Data Descriptor

Dataset: Mobility Patterns of a Coastal Area Using Traffic Classification Radars

1
Instituto de Telecomunicações, Escola Superior de Tecnologia e Gestão de Águeda, Universidade de Aveiro, Aveiro, P-3810-193 Aveiro, Portugal
2
Departamento de Eletrónica Telecomunicações e Informática, Instituto de Telecomunicações, Universidade de Aveiro, P-3810-193 Aveiro, Portugal
3
Instituto de Telecomunicações, Campus Universitário de Santiago, P-3810-193 Aveiro, Portugal
4
Instituto Federal Catarinense, Campus Araquari, Araquari 89245-000, Brazil
*
Author to whom correspondence should be addressed.
Submission received: 10 May 2022 / Revised: 7 July 2022 / Accepted: 7 July 2022 / Published: 13 July 2022
(This article belongs to the Special Issue Knowledge Extraction from Data Using Machine Learning)

Abstract

:
Monitoring road traffic is extremely important given the possibilities it opens up in terms of studying the behavior of road users, road design and planning problems, as well as because it can be used to predict future traffic. Especially on highways that connect beaches and larger urban areas, traffic is characterized by having peaks that are highly dependent on weather conditions and rest periods. This paper describes a dataset of mobility patterns of a coastal area in Aveiro region, Portugal, fully covered with traffic classification radars, over a two-year period. The sensing infrastructure was deployed in the scope of the PASMO project, an open living lab for co-operative intelligent transportation systems. The data gathered includes the speed of the detected objects, their position, and their type (heavy vehicle, light vehicle, two-wheeler, and pedestrian). The dataset includes 74,305 records, corresponding to the aggregation of road information at 10 min intervals. A brief analysis of the dataset shows the highly dynamic nature of traffic during the two-year period. In addition, the existence of meteorological records from nearby stations, and the recording of daily data on COVID-19 infections, make it possible to cross-reference information and study the influence of weather conditions and infections on traffic behavior.
Dataset License: CC BY 4.0

1. Introduction

Co-operative Intelligent Transportation Systems (C-ITS) technologies have been attracting much R&D efforts during the last decades and are becoming more pervasive in the context of Smart Roads, not only due to the deployment of connected roadside infrastructures, but especially for their potential to provide information that can help the driver and road users. C-ITS are equipped with traffic sensors and communications platforms able to extract useful information from the road vehicles and transmit it to nearby vehicles and/or to traffic management centers.
The connected and sensor-equipped roadside infrastructures can assist real-time applications, such as route planning, traffic analysis, and statistics collection applications for highway management or other third parties’ purposes. As an example, a highway traffic radar can support autonomous vehicles’ maneuvers, but it can also count the number of vehicles entering the highway and monitor their behavior, and therefore, it can be used to assist traffic control prediction and congestion control decisions.
Traffic congestion is one of the main challenges faced today by drivers, motorway operators, and city managers, because it makes daily travel more complex, with negative impacts on the environment, time, and monetary costs for the users. Such a problem can be mitigated by providing to the driver traffic flow predictions, such as the probability of traffic congestion, helping them to avoid undesirable events by rerouting their travels, choosing another means of transport, or changing their trip times. On the other hand, traffic flow predictions can be beneficial for road and city operators in the implementation of traffic planning and management strategies.
The platform used to gather monitoring data was developed under the scope of the PASMO project—An Open Platform for the development and experimentation of Mobility Solutions—[1], providing connectivity to the project sensors and the usage of telecommunications services. This project was developed by the Institute of Telecommunications at the University of Aveiro, with the purpose of providing solutions for intelligent mobility problems and an open platform for researchers to develop their own ideas. The project platform [
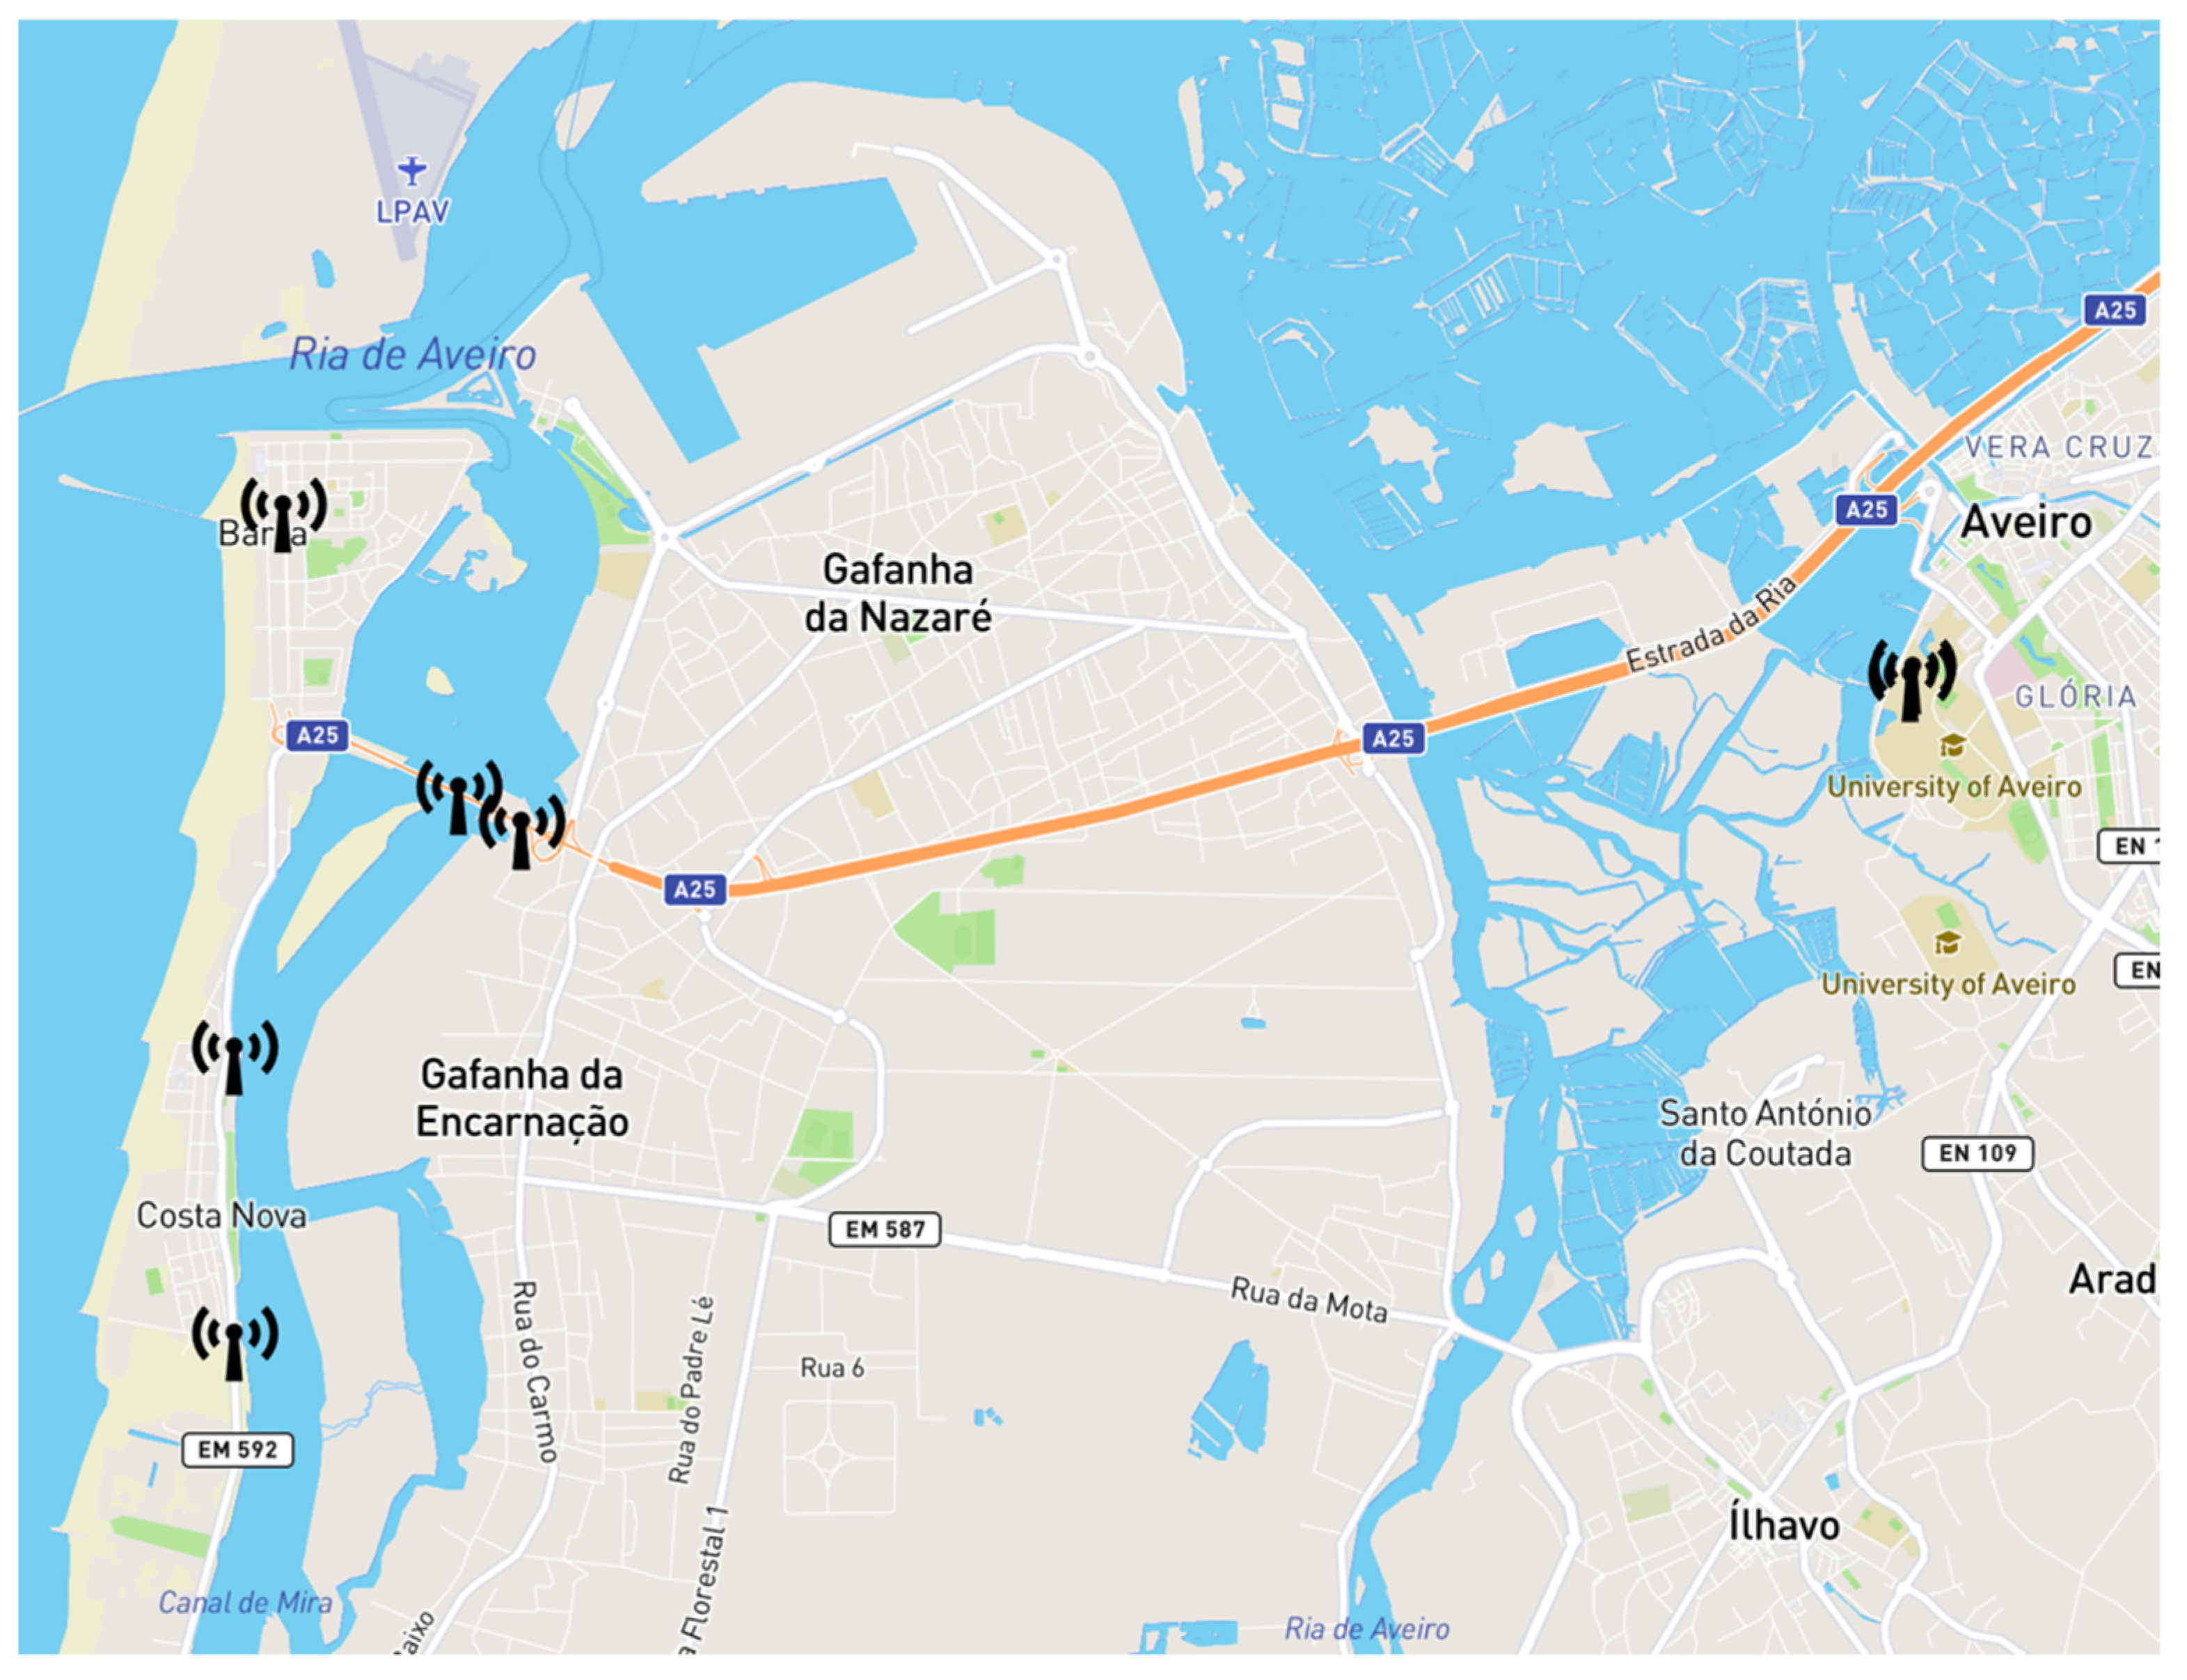
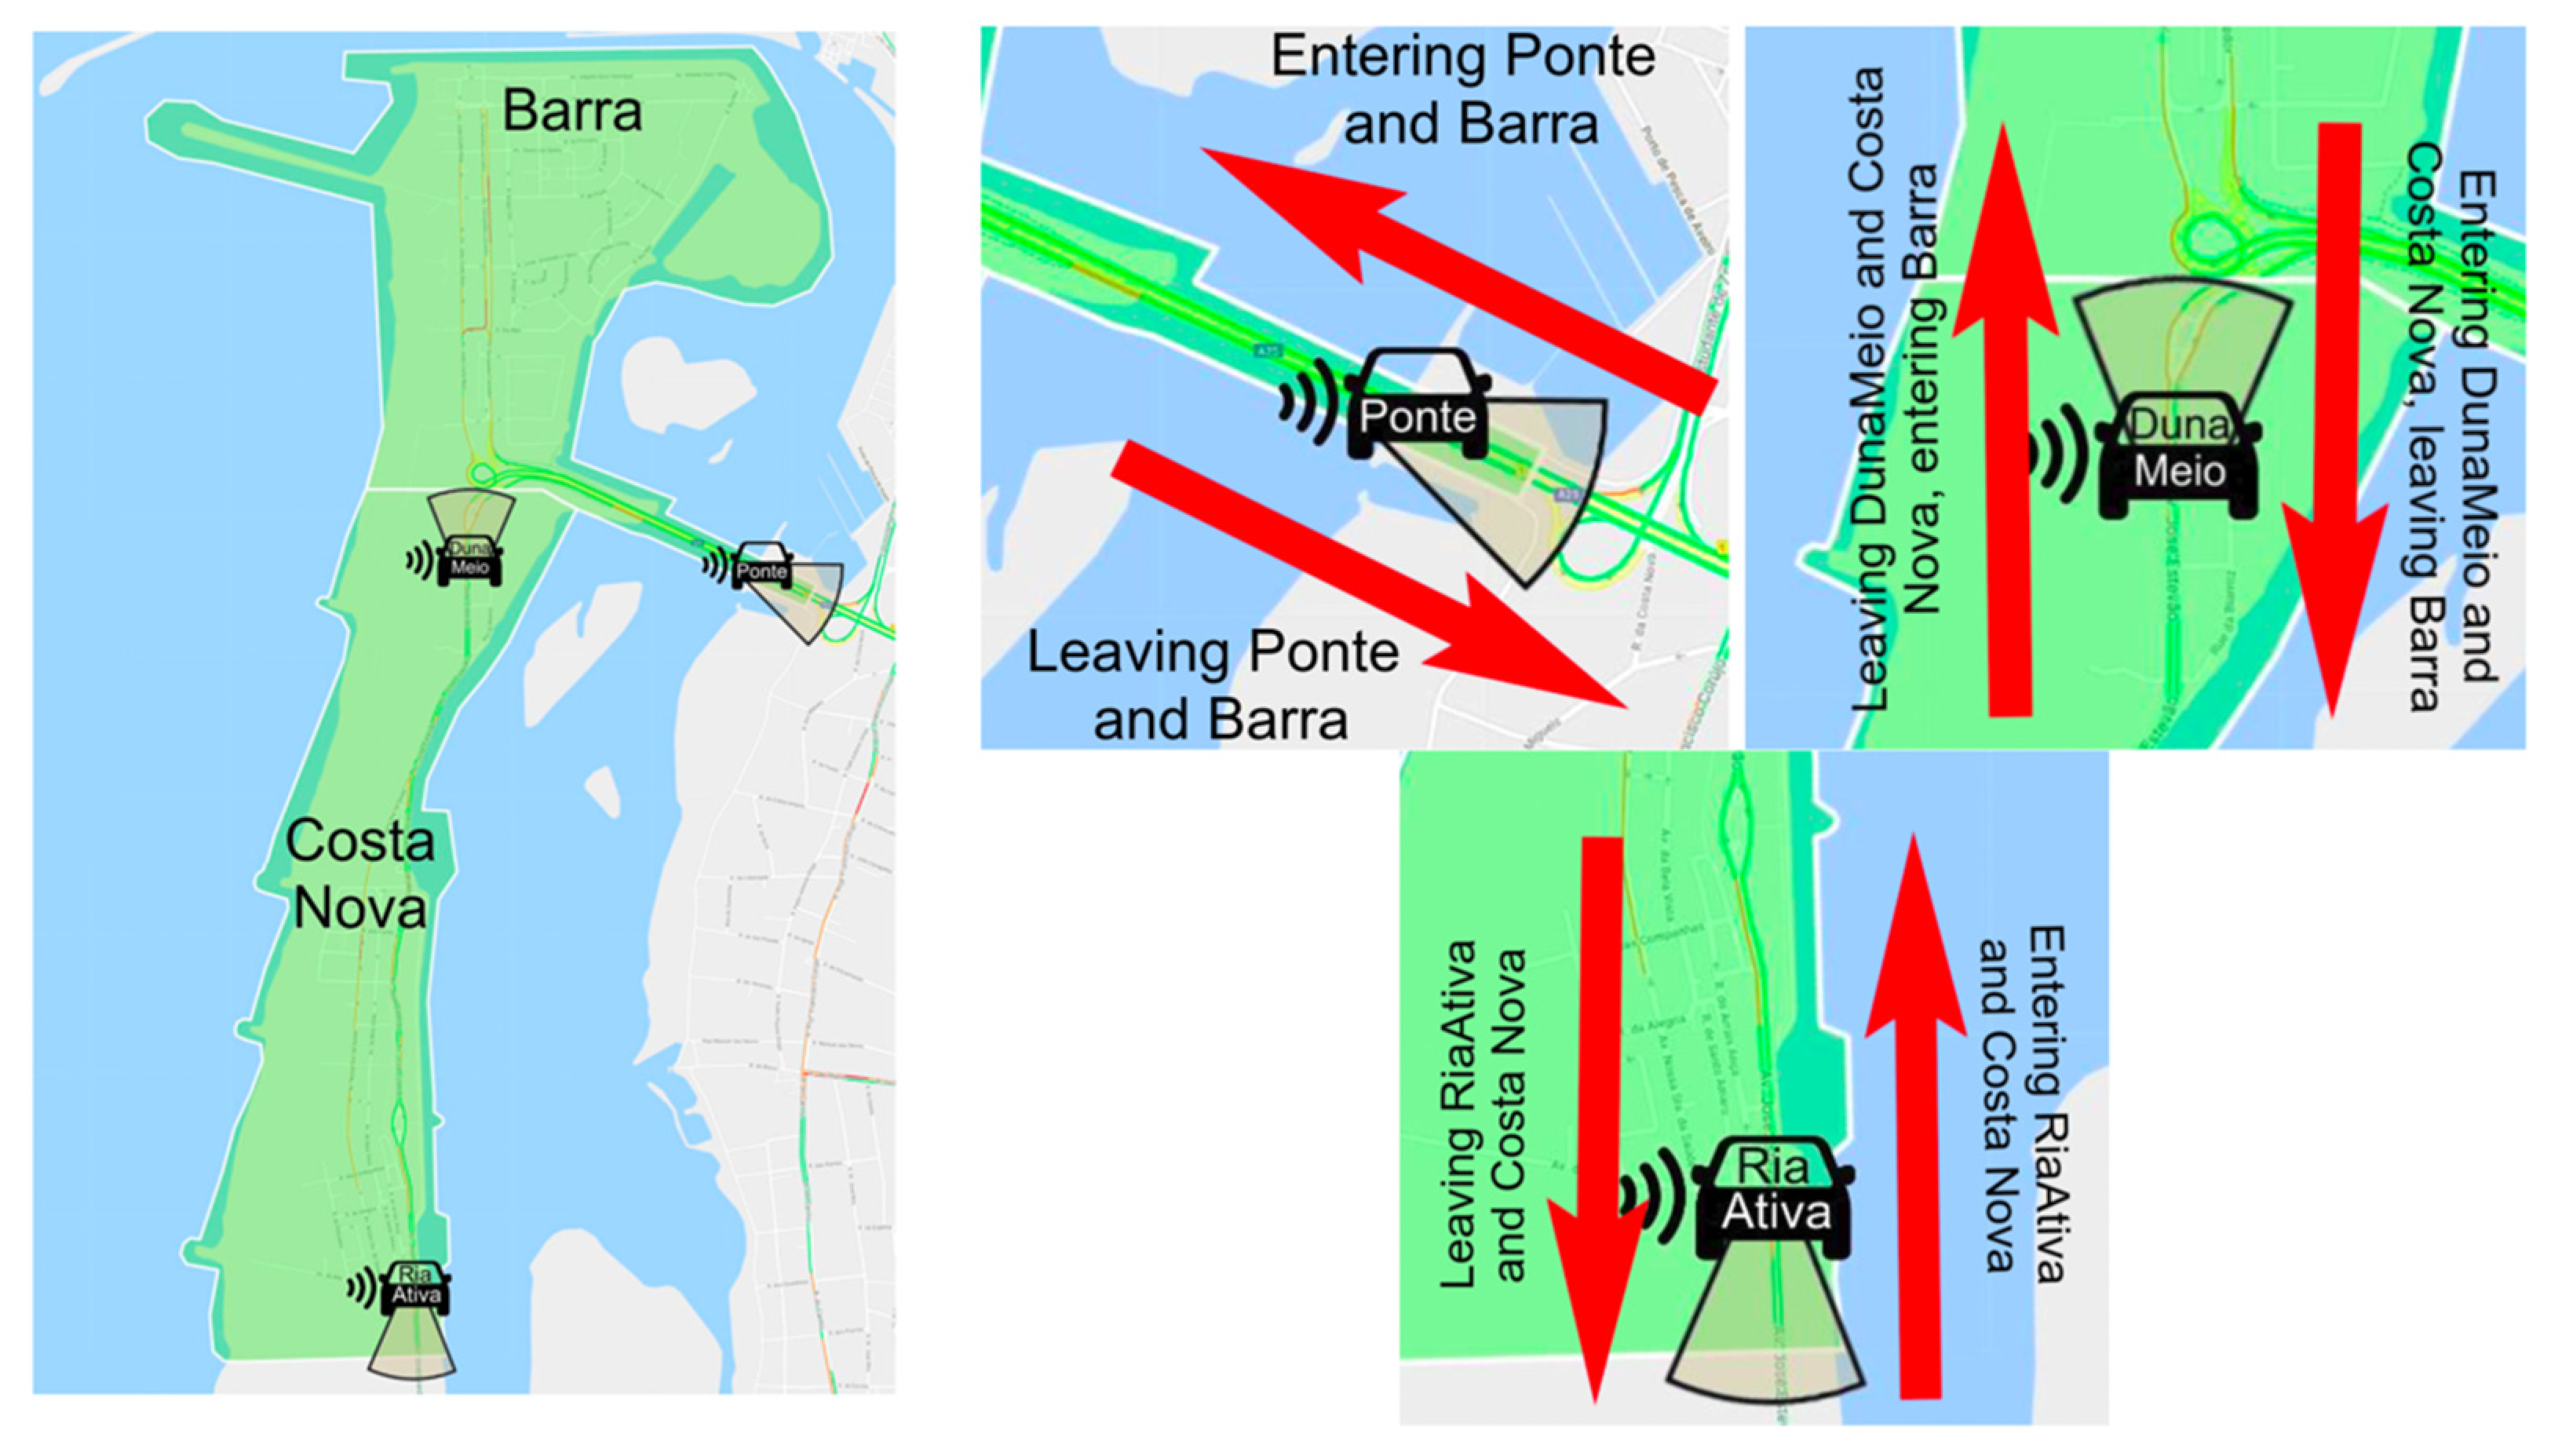
2] includes a set of services related to road mobility that use a set of physical sensors (e.g., traffic classification radar, parking, meteorological, etc.) and communication networks to monitor traffic behavior. The devices composing the core of the platform were installed in the municipalities of Ílhavo and Aveiro, in Portugal, at strategic locations to capture the most valuable information about the environment around the beaches of Barra and Costa Nova, as the map area, illustrated at an approximated scale of 1/10,000, in Figure 1 demonstrates. The main local city is 10 Km away toward the right of the map. Both covered places are both summer resorts, where people go to the beach, and places of residence, that act as urban dormitories for people that work in cities nearby. Vacationers and residents have different travel patterns, and their impact on the overall traffic differs from day to day and it varies depending on the time of year.
Although there is a vast amount of work on data analysis and traffic forecasting studies published, namely, [4,5,6,7,8,9,10,11,12,13], datasets are not in the public domain. Publicly available dataset repositories such as OpenDataMonitor, Kaggle, and MDPI Data, allow one to find several datasets related with traffic accidents, but none representing highway traffic, especially Portuguese traffic, behavior. A search over the IEEE DataPort repository returned two references [14,15], published by Cruz et al., related to WiFI data [14] and V2V communications [15] collected by driving vehicles in Porto city. There is not, at least to our best knowledge, a dataset that describes the traffic flow in a shoreline area that makes it possible to correlate the habits of travel to the beach with the weather information. This makes the present dataset unique.
From the set of devices, we selected three traffic classification radars [16,17,18] covering all entries of the beaches of Barra and Costa Nova, whose data were collected from 2019 to 2021. This paper details the corresponding dataset, aggregating traffic data with a time granularity of 10 min, detailing the number of detected vehicles, including 2-wheelers, and their maximum, minimum, and median speed, in both directions. The goal is to enable further and better work by researchers. We also believe that the acquisition and processing methods can be helpful for others responsible for acquiring, cleaning, and processing IoT data from smart cities.
The paper continues in Section 2 with a description of the dataset and detailing the data collection and preparation methodologies in Section 3. Section 4 concludes the paper, and some additional information is provided in the annexes.

2. Data Description

The original telemetry dataset contains more than 170 million records (170,158,409) considering the years of 2019, 2020, and 2021, and is composed of parking sensors and radars data. Section 3 presents the steps to transform the original data, including granularity and speed calculations related to radar stations, since the parking sensor data were not included in the present dataset.
The final dataset, summarized in Table A1 (Appendix A), has 74,305 records ordered and summarized by index columns (year, month, day, hour, and minute). In addition to the indexing columns, it contains the weekday (wd), added for ease of query writing; mean speed approximating radar i (Speed_med_ARi); maximum speed approximating radar i (Speed_max_Ari); the minimum speed approximating radar i (Speed_min_Ari); mean speed leaving radar i (Speed_med_DRi); maximum speed leaving radar i (Speed_max_DRi); minimum speed leaving radar i (Speed_min_DRi); traffic Flow at Barra (TF_Barra); and traffic Flow at Costa (TF_Costa). The minute attribute represents ten-minute intervals (0–10, 11–20, 21–30, 31–40, 41–50, 51–60) used to aggregate the original records. The dataset can be accessed at https://figshare.com/s/d324f5be912e7f7a0d21 (accessed on 23 June 2020).
Each record stores the minimal, maximal, and mean speed of the objects approximating and detaching for each radar station. Furthermore, the traffic flow (TF) values for the two regions (Barra and Costa Nova) are presented by the TF_barra and TF_Costa attributes. The units of Speed and Traffic Flow are meters per second (m/s) and the number of objects per ten minutes (#obj/10 min), respectively.
TF_Barra and TF_Costa can be positive or negative. A positive TF value represents a movement of the increase in the traffic flow for that region, and negative values express a movement of reduction. 
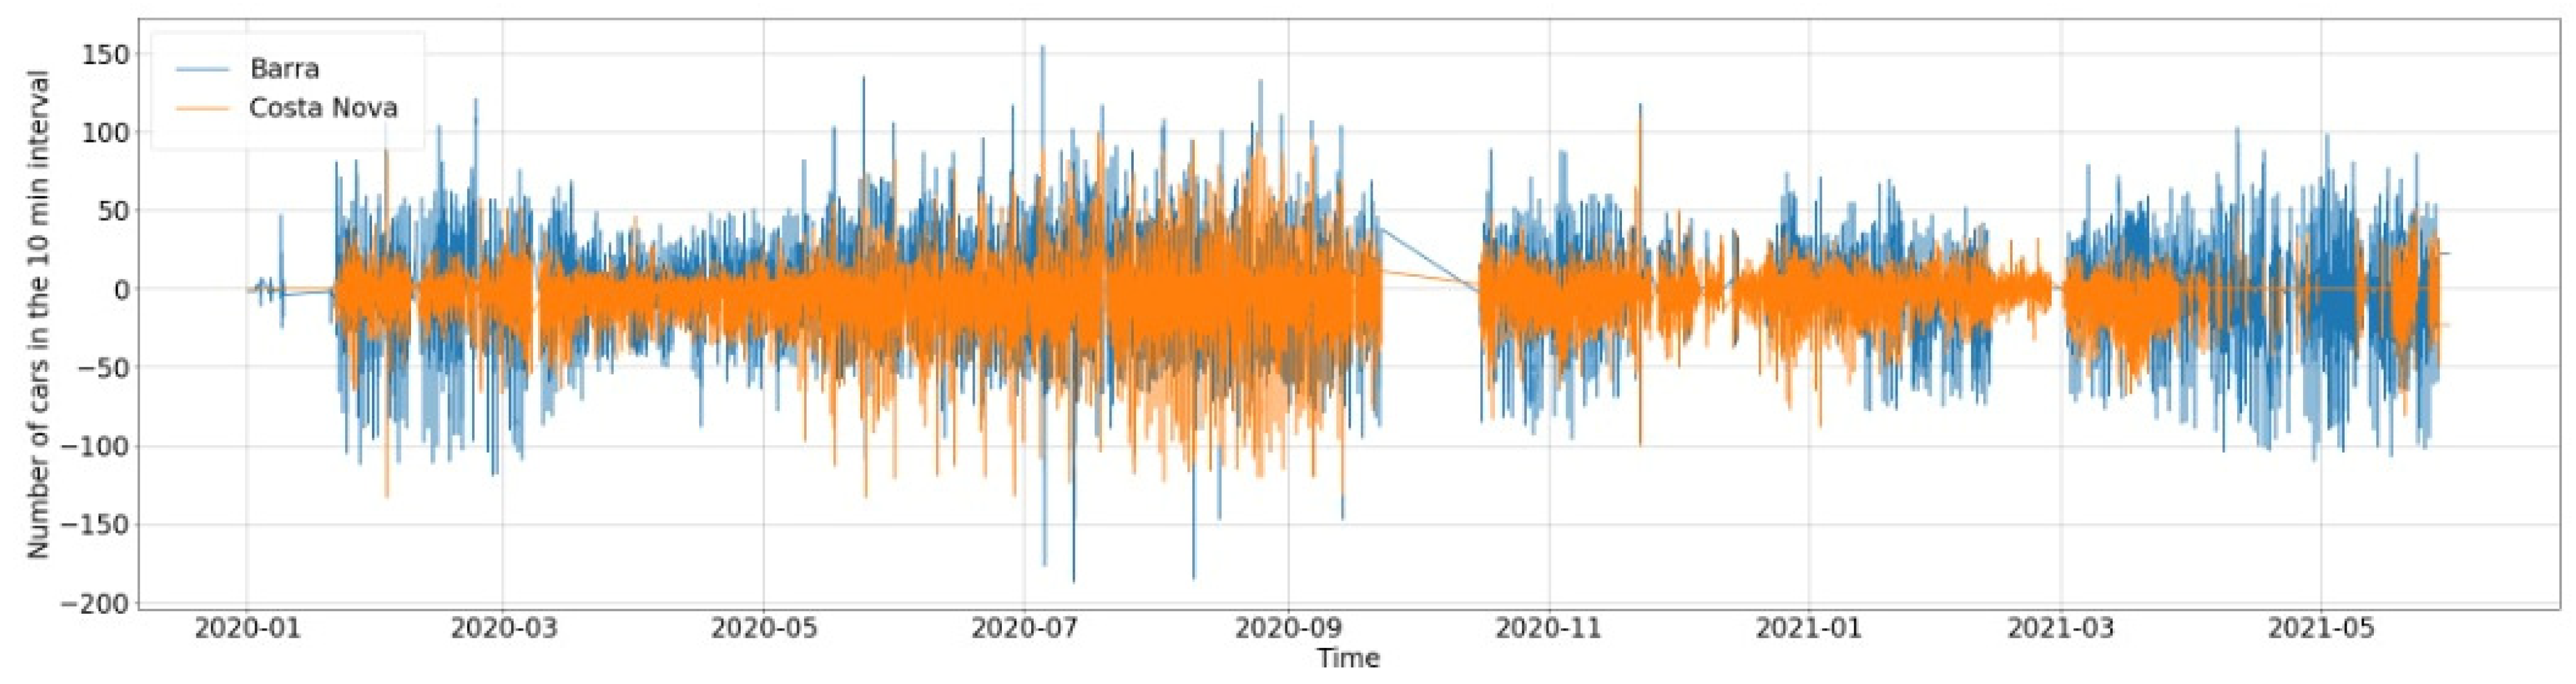
Figure 2 presents the dataset; the x-axis represents the time and the y-axis the traffic flow values (Barra and Costa Nova).
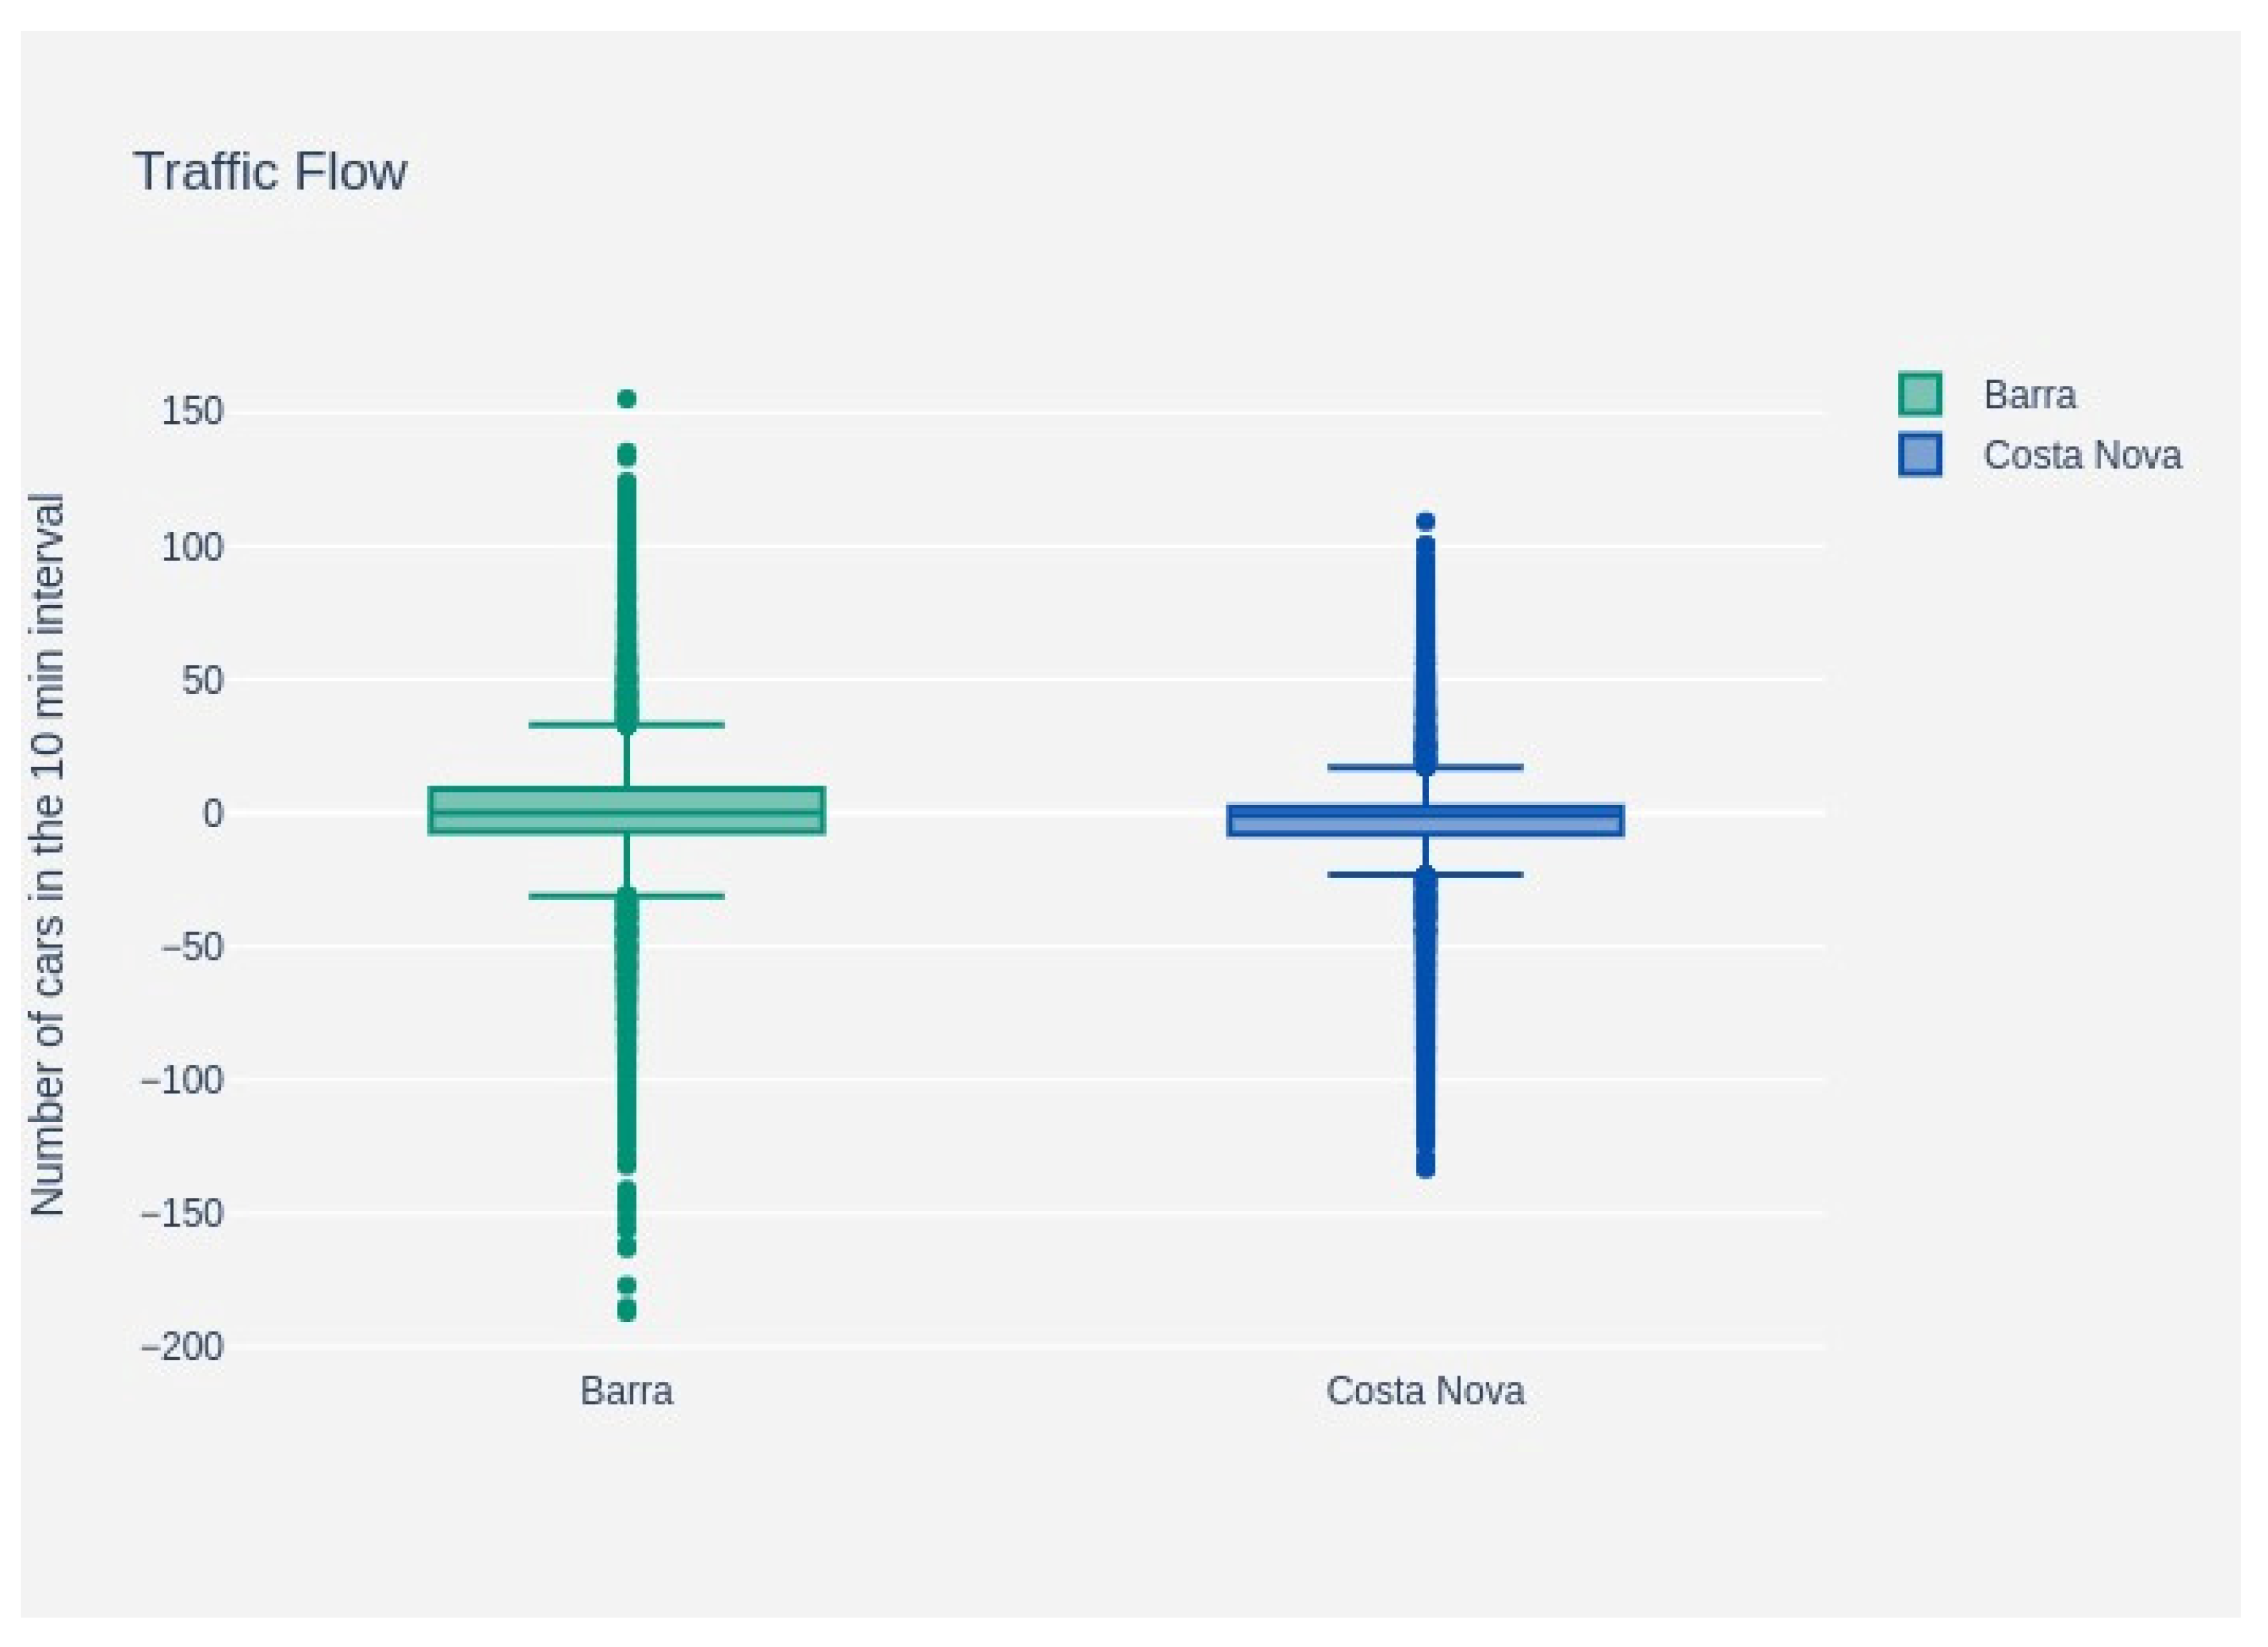
Figure 3 presents the data distribution of the final dataset considering the values of Traffic Flow for each region.
The detailed statistics of the dataset are presented in Table 1. Mean, Std (Standard Deviation), Min (Minimal), 25% (quartile 1), 50% (quartile 2), 75% (quartile 3), and Max (Maximal) are related to values of Traffic Flow for Barra and Costa Nova, and complete the description of the final dataset.
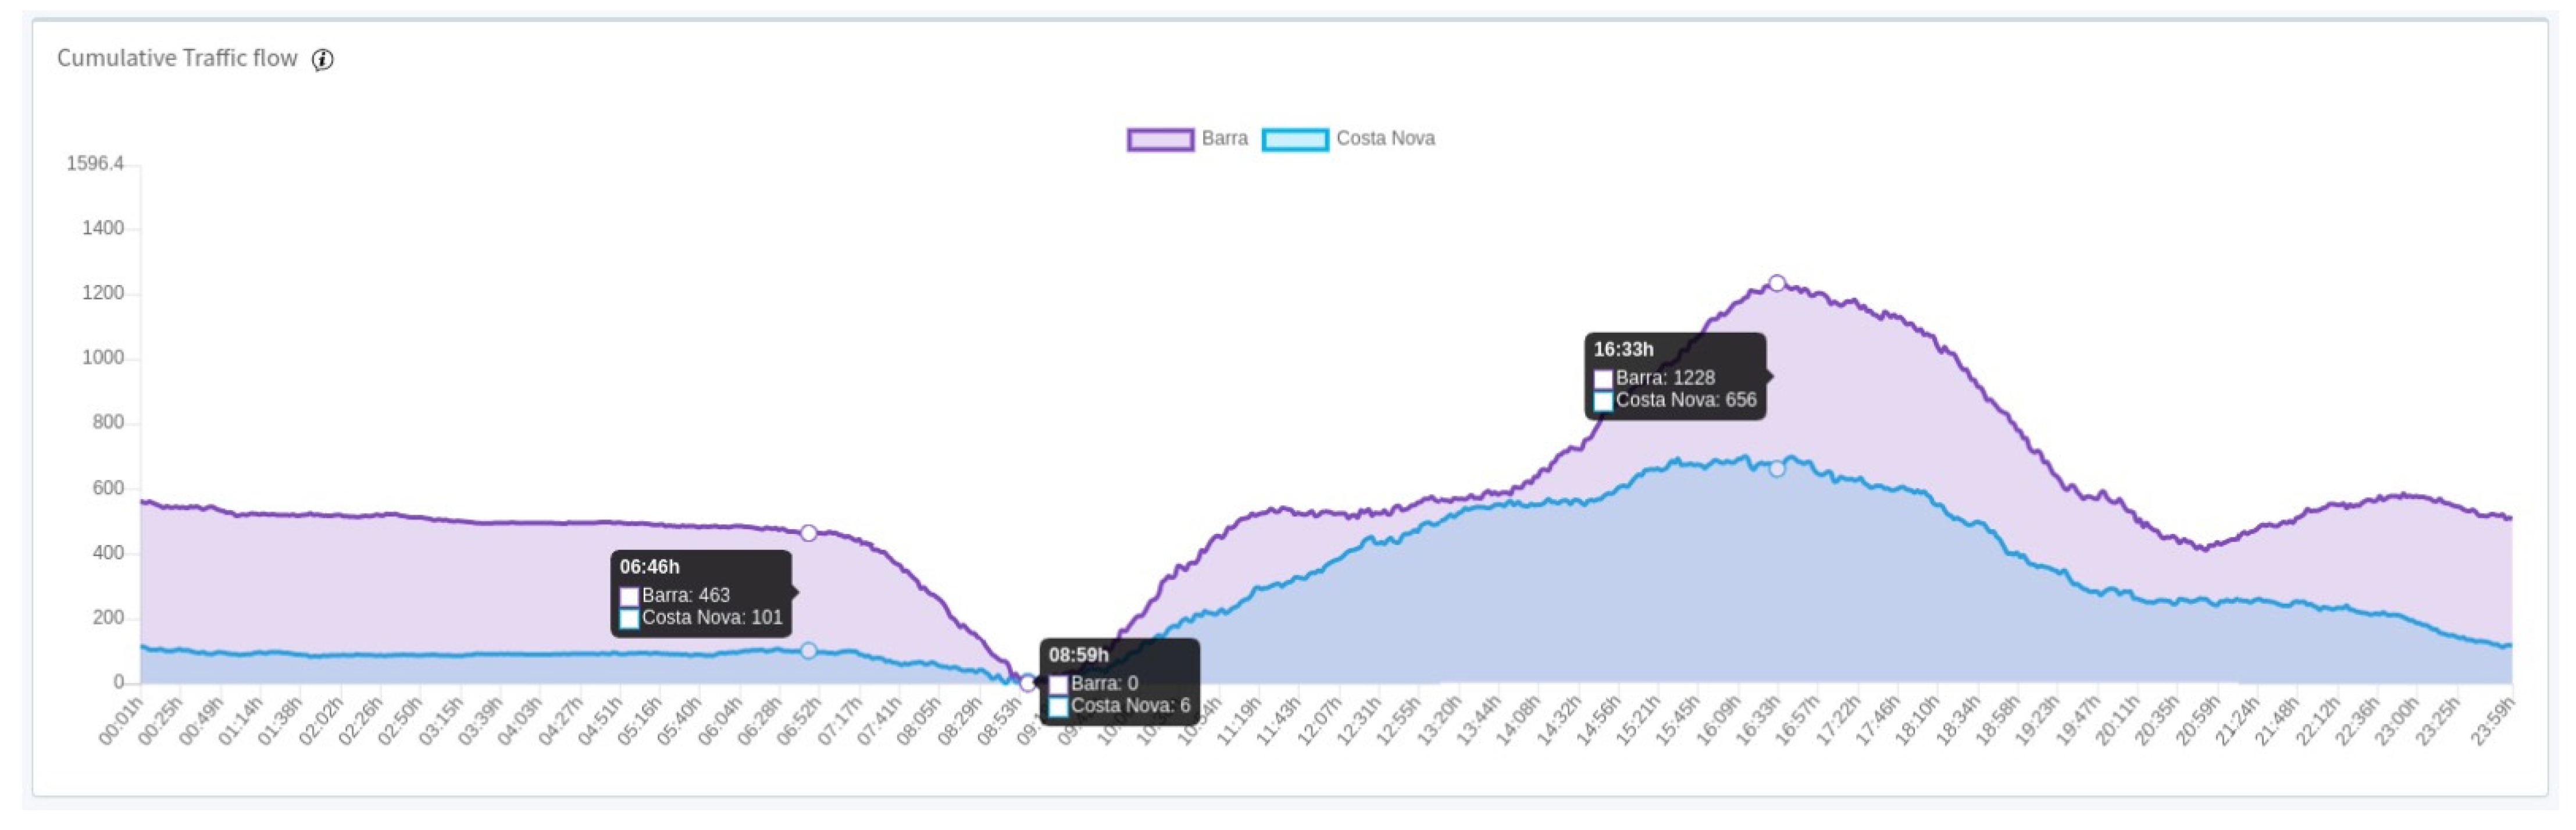
Figure 4 shows cumulative traffic count over the course of an entire day that, as explained in Section 3, is calculated from a cumulative sum of the difference of vehicles entering and exiting, shifting the values to make the minimum of zero. The values, by themselves, do not provide much information, since it is not possible to know exactly how many cars were in each place. Although the values are not precise about the number of vehicles in the system, Figure 4 allows one to understand the count evolution over the day, and, for instance, to notice that the lowest number of vehicles in Barra was in the morning, while the highest was in the afternoon. Furthermore, when comparing the values, we can observe that the number of vehicles entering and leaving Barra goes from 476 to 0, and since these values were taken in the morning, we can conclude the data represent people leaving home to go to work. If we compare it with Costa Nova, we can see the discrepancy in values for the same period is not so large; it falls from 101 to 6.

3. Data Preparation Methods

The radar used in PASMO was a UMRR-0C Type 42, produced by smartmicro, that operates in the 24Ghz band for multilane, multiobject traffic tracking and is capable of measuring several parameters (such as range, angle, and radial speed) of moving targets. It has a bandwidth of 250 Mhz and a maximum transmitted power of 20 dBm, and it uses a multiple Frequency Modulated Continuous Wave (FMCW) technique to acquire the relative speed and range of each target. The Type 42 integrated array of antennas allows for long-range and wide horizontal coverage. It also integrates tracking algorithms that can track up to 126 moving targets simultaneously, regardless of object speed, distance to the sensor, or azimuth angle. Table 2 summarizes the main characteristics of the radar used, and Correia [19] further details data sensorization and the gathering process.
The original telemetry dataset contains more than 170 million records (170,158,409) over 3 years, and is composed of parking sensors and radar data. The dataset is a sample from the entire PASMO platform data, according to a specific method. 
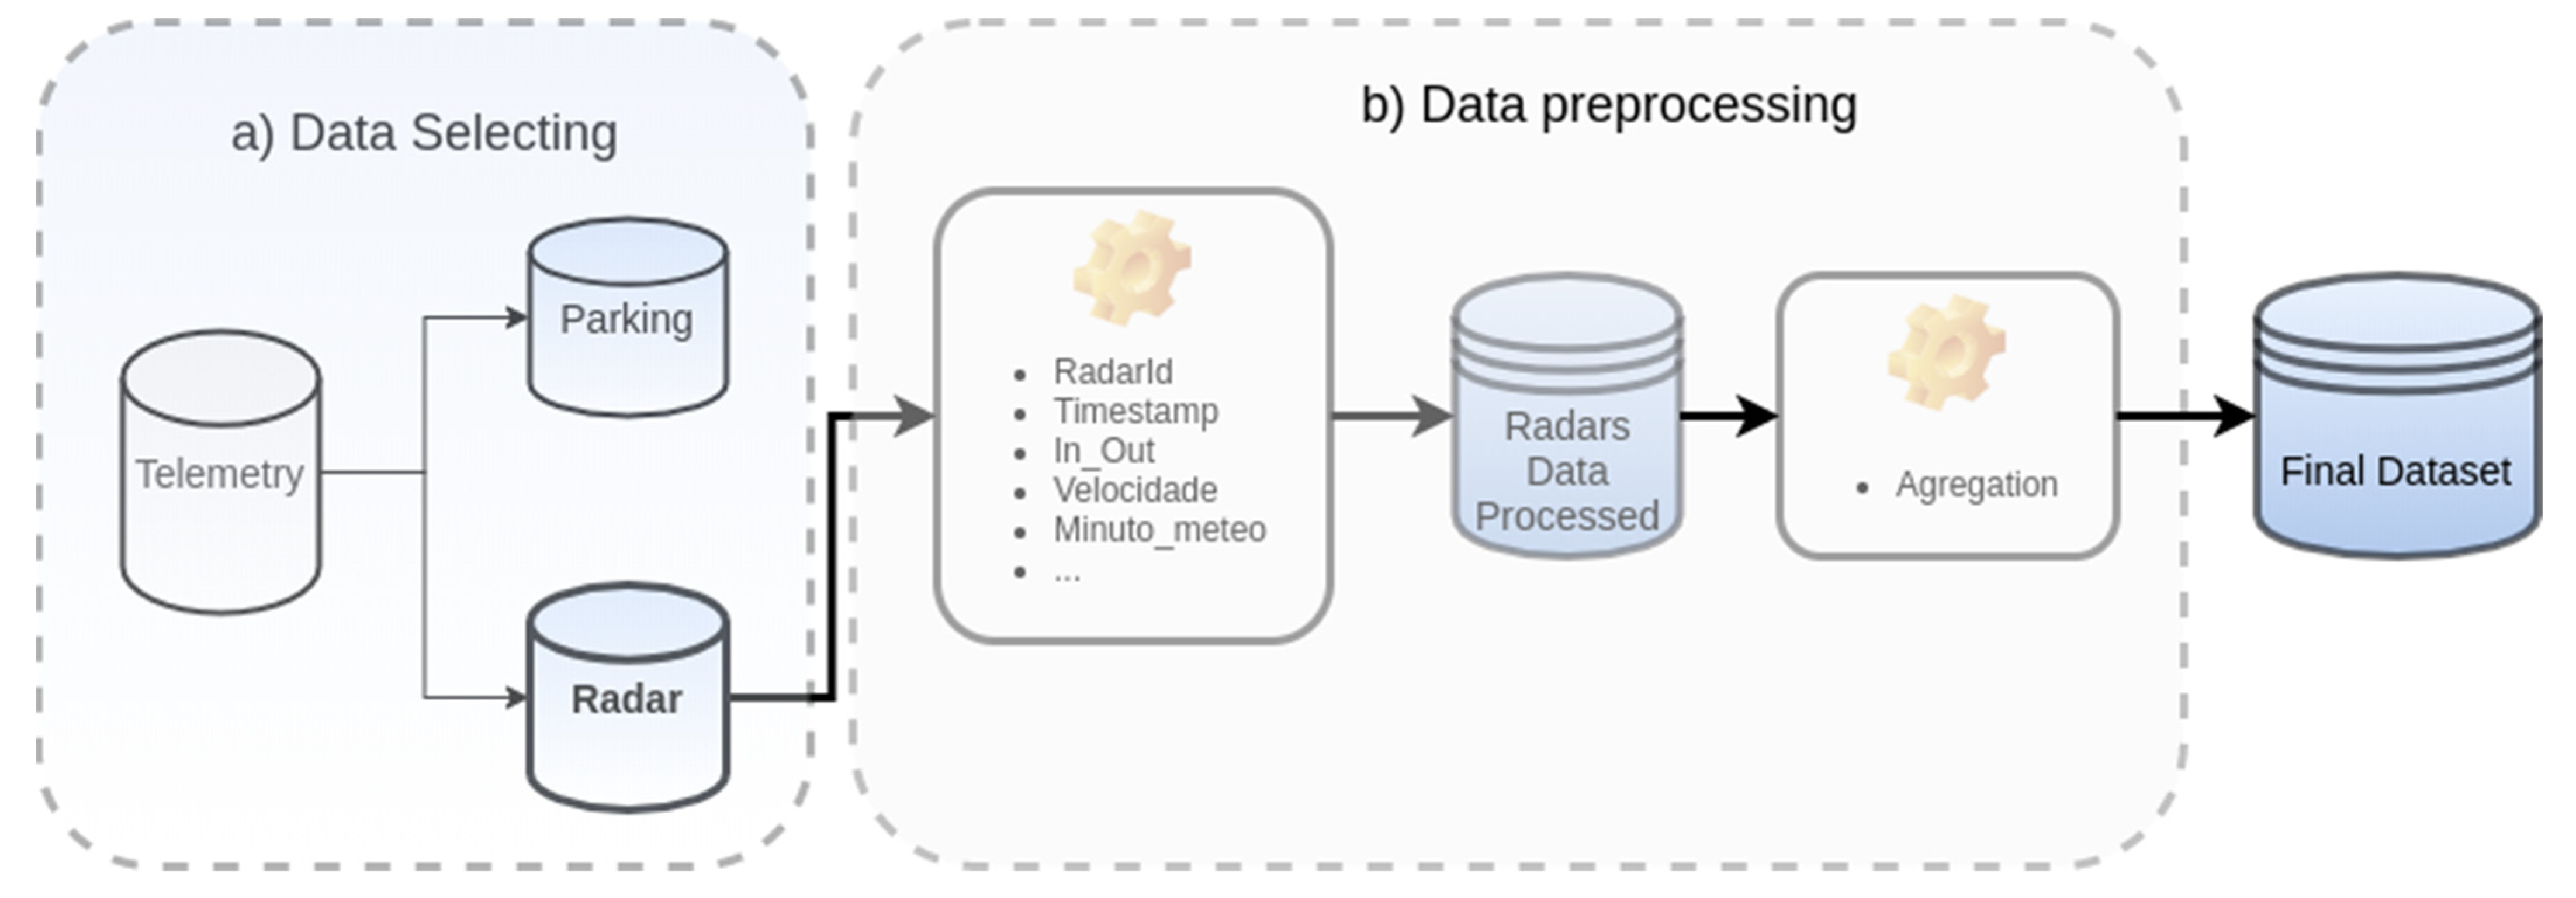
Figure 5 presents the complete method designed to prepare the final dataset, starting with the data selection applied to Parking and Radar data. For the goal of this dataset, just radar data were selected, resulting in 155,432,185 records.
Table 3 presents the attributes of the original data. Each record is produced at a sampling interval of 100 milliseconds and contains the identification of the moving object, id, and co-ordinates of the radar, timestamp, and x-y axis speed component. The dataset was aggregated considering a ten-minute granularity.
Before adjusting the granularity, other derived radar data were produced; year, month, day, hour, weekday, and minute attributes were calculated from the timestamp. Furthermore, xSpeed and ySpeed attributes also result in the Speed measure. Negative values for Speed represent the measure of the speed of an object approximating the radar, and positive values represent the movement of the detachment; the in_out logical attribute stores this situation. These steps are represented in Figure 5.
Using the identification, speed, and direction of the moving object, it is possible to compute the number of vehicles that have passed, as well as their speed (maximal, mean, and minimal) at the radar level by year, month, day, hour, and minutes (ten-minute intervals). Table 4 presents the resulting format of the processing radar data, and each record represents measures aggregated for ten minutes at the hour.
Figure 6 depicts the localization of the radars. The first one is before entering the bridge, the second one is in the interconnection segment between Barra and Costa Nova, and the third one is at the urban limit to the south of Costa Nova.
This work presents a dataset to store the traffic flow in Barra and Costa Nova. Therefore, two new measures were computed to represent the traffic flow in regions: TF_Barra and TF_Costa.
T F B a r r a =   ( Q A R 1   +   Q D R 2 )     ( Q D R 1   +   Q A R 2 )
T F C o s t a =   ( Q A R 2   +   Q A R 3 )     ( Q A R 2   +   Q D R 3 )
where QARi = quantity of objects approximating the radar i, and QDRi = quantity of objects detaching from the radar i, computed by
Q A R i = i = 1 3 j =   0 50 o b j _ c o u n t _ A i , j
Q D R i = i = 1 3 j =   0 50 o b j _ c o u n t _ D i , j
with i as the identification of the radar, j as the interval minute (0, 10, …, 50), obj_count_A as value of the count_obj attribute where the in_out = 1 and obj_count_D as value of the count_obj attribute where the in_out = 0.
Therefore, TF_Barra and TF_Costa can be positive or negative values. A positive TF value represents a movement of the increase in the traffic flow for that region, and negative values can express a movement of reduction. Additionally, new speed measures were computed considering the movement of approximation and detaching for each radar.
S p e e d _ m e d _ A R i , j = 1 n S p e e d _   m e d i , j
with n as the quantity of records representing the Speed_med attribute with in_out = 1.
S p e e d _ m e d _ D R i , j = 1 n S p e e d _ m e d i , j
with i as the identification of the radar, j as the interval minute, and n as the quantity of records representing the Speed_med attribute with in_out = 0.
S p e e d _ max _ A R i , j = max ( S p e e d _ m a x i , j )
S p e e d _ max _ D R i , j = max ( S p e e d _ max i , j )
S p e e d _ min _ A R i , j = min ( S p e e d _ min i , j )
S p e e d _ min _ D R i , j = min ( S p e e d _ min i , j )
In Equations (5)–(10), i represents the identification of the radar and j the interval minute. Equations (7) and (9) consider the records with in_out = 1, while Equations (8) and (10) consider those with in_out = 0. Table 5 presents the final processed radar data.

4. Conclusions

The present dataset was obtained through the aggregation of telemetry data from the PASMO project, and it was cleaned and aggregated in order to obtain a summary of the passages at 10 min intervals. The aggregation process produced 155,432,185 records that allow us to characterize the traffic in the beach area in the years of 2019, 2020, and 2021.
In addition to allowing the analysis of traffic distribution and the forecast of future traffic, the present dataset can be correlated with national/regional holidays (Table A2 in Appendix B) and a set of events related to the COVID-19 pandemic [20] and the circulation restrictions that occurred in 2020 and 2021 (Table A3 in Appendix C). Furthermore, it can be correlated with meteorological data through the use of an adequate dataset, since in the case of bathing areas, the meteorological factor has a strong impact on road travel.
This dataset can be used for a wide spectrum of situations related to smart cities and vehicular traffic. We highlight the identification of behaviors, trends, diurnal mobility patterns, and training of modelling and predictive algorithms.
In the near future, we plan to clean and aggregate the data produced by the remaining radars installed within the scope of the PASMO project and try to create a dataset that will allow us to characterize the pattern of entrances and exits in the city of Aveiro.

Author Contributions

Conceptualization, J.F., R.A., J.A.F., J.A., J.B., D.G., J.R., F.B. and P.G.; methodology, F.B. and P.G.; software, J.B., D.G., R.O., J.R. and F.B.; validation, F.B. and P.G.; resources, J.R.; data curation, F.B.; writing—original draft preparation, F.B. and P.G.; writing—review and editing, R.A., J.F., J.A., J.A.F., J.B., D.G., F.B. and P.G.; project administration, J.F. and R.A.; funding acquisition, J.F. and R.A. All authors have read and agreed to the published version of the manuscript.

Funding

This work is supported by the European Regional Development Fund (FEDER), through the Competitiveness and Internationalization Operational Programme (COMPETE 2020) of the Portugal 2020 framework [Project STEROID with Nr. 069989 (POCI-01-0247-FEDER-069989)].

Institutional Review Board Statement

Not applicable.

Informed Consent Statement

Not applicable.

Data Availability Statement

The dataset is available at https://figshare.com/s/d324f5be912e7f7a0d21 (accessed on 23 June 2022) under CC BY 4.0 license.

Acknowledgments

The authors would like to acknowledge all the work carried out within the scope of PASMO project (https://www.pasmo.pt (accessed on 23 June 2022)) which enabled the deployment of the roadside infrastucture setup responsible for producing the available dataset. This past project, that ran between 15/05/2017 and 14/05/2020, was supported by the European Regional Development Fund (FEDER), through the Regional Operational Programme of Centre (CENTRO 2020) of the Portugal 2020 framework [Project PASMO with Nr. 000008 (CENTRO-01-0246-FEDER-000008)].

Conflicts of Interest

The authors declare no conflict of interest.

Appendix A

Table A1. Table description.
AttributeContent
yearYear of record
monthMonth of record
dayDay of record
hourHour of record
minuteMinute Interval of record
wdWeekday
Speed_med_ARiMean speed approximating radar i
Speed_max_ARiMaximum speed approximating radar i
Speed_min_ARiMinimum speed approximating radar i
Speed_med_DRiMean speed moving away radar i
Speed_max_DRiMaximum speed moving away radar i
Speed_min_DRiMinimum speed moving away radar i
TF_BarraTraffic Flow at Barra
TF_CostaTraffic Flow at Costa

Appendix B

There are a number of dates that can have a special impact on traffic, as they are national or regional holidays and therefore allow people to go to the beaches, and there are festive dates in both villages (Barra and Costa Nova) which, because of the festivities, lead people to travel to places. Table A2 lists the festive dates and the list of holidays from the years 2019 to 2021.
Table A2. Relevant dates for the region.
YearDateDescription
20191 JanuaryFirst Bath of the Year (https://beachcam.meo.pt/newsroom/2019/01/banho-magnificos-praia-da-barra-2019/)
1 MayNational holiday
26–30 SeptemberCosta Nova feast
22–24 JuneSaint John feast
29–29 JuneSaint Peter feast
15 AugustNational holiday
20 August–2 SeptemberSenhor dos Navegantes feast
20201 January First Bath of the Year (https://beachcam.meo.pt/newsroom/2019/01/banho-magnificos-praia-da-barra-2019/)
10 AprilGood Friday
5 MayNational day
10 JuneNational day
11 JuneNational holiday
4–7 September Senhor dos Navegantes feast
5 OctoberNational holiday
1 NovemberNational holiday
1 DecemberNational holiday
20211 JanuaryFirst Bath of the Year (https://www.dn.pt/pais/primeiro-banho-de-2021-na-praia-da-barra-cancelado-devido-a-pandemia-13176929.html
2 MayGood Friday
3 JuneNational holiday
10 JuneNational holiday
5 OctoberNational holiday
1 NovemberNational holiday
1 DecemberNational holiday
8 DecemberNational holiday
All websites in this table were accessed on 23 June 2022.

Appendix C

There are two factors with an impact on traffic accessing the beaches: the evolution in the number of COVID-19 infections [4], and a set of dates on which, also due to the epidemic, a curfew was decreed, and circulation between municipalities was prohibited. Table A3 summarizes the set of dates related to driving bans.
Table A3. Dates of the main events related to COVID-19 in the region.
AttributeContent
16 March 2020Schools and universities were closed for face-to-face classes.
19 March 2020National lock-down of March 2020.
18 May 2020Opening of restaurants and cafes and beginning of face-to-face classes in the 11th and 12th grade. Day care centers were also permitted to start opening on that date.
30 July 2020Opening of bars and nightclubs.
15 September 2020Back to school and face-to-face work.
29 October 2020 to
2 November 2020
Ban on movement between municipalities on the holiday of the deceased.
31 October 2020Mandatory curfew between 23:00 and 05:00 in the 121 most-affected municipalities. On weekends, the curfew in these municipalities starts at 1:00 pm.

References

  1. Ferreira, J.; Fonseca, J.; Gomes, D.; Barraca, J.; Fernandes, B.; Rufino, J.; Almeida, J.; Aguiar, R. PASMO: An open living lab for cooperative ITS and smart regions. In Proceedings of the 2017 International Smart Cities Conference (ISC2), Wuxi, China, 14–17 September 2017. [Google Scholar] [CrossRef]
  2. Almeida, J.; Rufino, J.; Cardoso, F.; Gomes, M.; Ferreira, J. TRUST: Transportation and Road Monitoring System for Ubiquitous Real-Time Information Services. In Proceedings of the IEEE Vehicular Technology Conference, Antwerp, Belgium, 25–28 May 2020. [Google Scholar] [CrossRef]
  3. Traffic Control Center. Available online: https://ccam.av.it.pt (accessed on 15 May 2022).
  4. Sadeghi-Niaraki, A.; Mirshafiei, P.; Shakeri, M.; Choi, S.M. Short-term traffic flow prediction using the modified elman recurrent 600 neural network optimized through a genetic algorithm. IEEE Access 2020, 8, 217526–217540. [Google Scholar] [CrossRef]
  5. Yi, H.; Bui, K.H.N. An automated hyperparameter search-based deep learning model for highway traffic prediction. IEEE Trans. Intell. Transp. Syst. 2020, 22, 5486–5495. [Google Scholar] [CrossRef]
  6. Hu, Z.; Sun, R.; Shao, F.; Sui, Y. An efficient short-term traffic speed prediction model based on improved TCN and GCN. Sensors 2021, 21, 6735. [Google Scholar] [CrossRef] [PubMed]
  7. Performance Measurement System (PeMS) Data Source. Available online: https://dot.ca.gov/programs/traffic-operations/mpr/pems-source (accessed on 4 April 2022).
  8. Wei, W.; Wu, H.; Ma, H. An autoencoder and LSTM-based traffic flow prediction method. Sensors 2019, 19, 2946. [Google Scholar] [CrossRef] [PubMed] [Green Version]
  9. Simunek, M.; Smutny, Z. Traffic information enrichment: Creating long-term traffic speed prediction ensemble model for better navigation through waypoints. Appl. Sci. 2020, 11, 315. [Google Scholar] [CrossRef]
  10. Sun, B.; Sun, T.; Jiao, P. Spatio-temporal segmented traffic flow prediction with ANPRS data based on improved XGBoost. J. Adv. Transp. 2021, 2021, 5559562. [Google Scholar] [CrossRef]
  11. Guo, K.; Hu, Y.; Qian, Z.; Liu, H.; Zhang, K.; Sun, Y.; Gao, J.; Yin, B. Optimized graph convolution recurrent neural network for traffic prediction. IEEE Trans. Intell. Transp. Syst. 2020, 22, 1138–1149. [Google Scholar] [CrossRef]
  12. Zhang, T.; Ding, W.; Chen, T.; Wang, Z.; Chen, J. A Graph Convolutional Method for Traffic Flow Prediction in Highway Network. Wirel. Commun. Mob. Comput. 2021, 2021, 1997212. [Google Scholar] [CrossRef]
  13. Hoseinzadeh, N.; Gu, Y.; Han, L.D.; Brakewood, C.; Freeze, P.B. Estimating freeway level-of-service using crowdsourced data. Informatics 2021, 8, 17. [Google Scholar] [CrossRef]
  14. Cruz, S.; Aguiar, A. “Cooperative Localization in Vehicular Networks Dataset”, IEEE Dataport. Available online: https://doi.org/10.21227/jtqe-q772 (accessed on 13 April 2020).
  15. Cruz, S.B.; Aguiar, A. Road Vehicle Localization Dataset. IEEE Dataport. Available online: https://doi.org/10.21227/92ya-v240 (accessed on 23 June 2020).
  16. UMRR Traffic Management Sensor Data Sheet. Available online: https://www.smartmicro.com/fileadmin/media/Downloads/Traffic_Radar/Sensor_Data_Sheets__24_GHz_/UMRR_Traffic_Sensor_Type_42_Data_Sheet.pdf (accessed on 1 July 2022).
  17. Correia, M.; Almeida, J.; Bartolomeu, P.C.; Fonseca, J.A.; Ferreira, J. Performance Assessment of Collective Perception Service Supported by the Roadside Infrastructure. Electronics 2022, 11, 347. [Google Scholar] [CrossRef]
  18. Oliveira, R. Aplicações de IoT No Contexto de uma Cidade Inteligente. Master’s Dissertation, Universidade de Aveiro, Aveiro, Portugal, 2022. Available online: http://hdl.handle.net/10773/31381 (accessed on 15 May 2022).
  19. Correia, M. Roadside Infrastructure to Support Cooperative Intelligent Transportation Systems. Master’s Dissertation, Universidade de Aveiro, Aveiro, Portugal, December 2021. Available online: http://hdl.handle.net/10773/33731 (accessed on 1 June 2022).
  20. GitHub-Dssg-pt/COVID-19PT-Data: Dados Relativos à Pandemia COVID-19 em Portugal. Available online: https://github.com/dssg-pt/covid19pt-data (accessed on 15 March 2022).
Figure 1. Radar locations [3] represented in a view of a map of the Aveiro region.
Data 07 00097 g001
Figure 2. Temporal distribution of Barra and Costa Nova traffic flow. Negative values represent flows approaching the radar accordingly with Figure 6.
Data 07 00097 g002
Figure 3. Traffic flow distribution for each region of the final dataset. Negative values represent flows approaching the radar accordingly with Figure 6.
Data 07 00097 g003
Figure 4. Cumulative traffic flow over a day in Barra and Costa Nova [3].
Data 07 00097 g004
Figure 5. Data preparation and preprocessing process.
Data 07 00097 g005
Figure 6. Radar relative velocities [3] representation.
Data 07 00097 g006
Table 1. Data characterization.
StatisticsBarraCosta Nova
Mean0.19−3.61
Std20.2914.45
Min−187.00−133.00
25%−7.00−8.00
50%0.00−0.88
75%9.002.00
Max155.00109.00
Table 2. UMRR-0C Type 42 smartmicro radar characteristics.
ParameterUnitDescription
Frequency BandGhz24
Interval Rangem1.5 to 340
Interval Speedkm/h−320 to 320
Azimuth field of view°50−to 50
Elevation field of view°−8 to 8
Range accuracym0.25
Speed accuracykm/h1
Angle accuracy°1
Power SupplyV13 to 32
Ambient Temperature°C−40 to 74
Dimensionsmm212.6 × 154.6 × 31.65
Table 3. Table attributes of the original data.
AttributeContent
idobject id
timestamprecord timestamp
radar_latlatitude—radar co-ordinate
radar_lonlongitude—radar co-ordinate
xSpeedx-axis speed component
ySpeedy-axis speed component
Table 4. Resulting data format of the processing radar data.
AttributeContent
timestamprecord timestamp
yearyear
monthmonth
dayday
wdweekday
hourhour
minuteminute
radar_idradar identification
Speed_medmean speed
Speed_maxmaximum speed
Speed_minminimum speed
Obj_countnumber of vehicles
in_outmovement direction
Table 5. Processed radar data structure.
AttributeContent
yearYear of record
monthMonth of record
dayDay of record
hourHour of record
minuteMinute Interval of record
wdWeekday
Speed_med_ARiMean speed approximating radar i
Speed_max_ARiMaximum speed approximating radar i
Speed_min_ARiMinimum speed approximating radar i
Speed_med_DRiMean speed leaving radar i
Speed_max_DRiMaximum speed leaving radar i
Speed_min_DRiMinimum speed leaving radar i
TF_BarraTraffic Flow at Barra
TF_CostaTraffic Flow at Costa
Publisher’s Note: MDPI stays neutral with regard to jurisdictional claims in published maps and institutional affiliations.

