
Microscopic Imaging and Labeling Dataset for the Detection of Pneumocystis jirovecii Using Methenamine Silver Staining Method

 ,
,  , , and
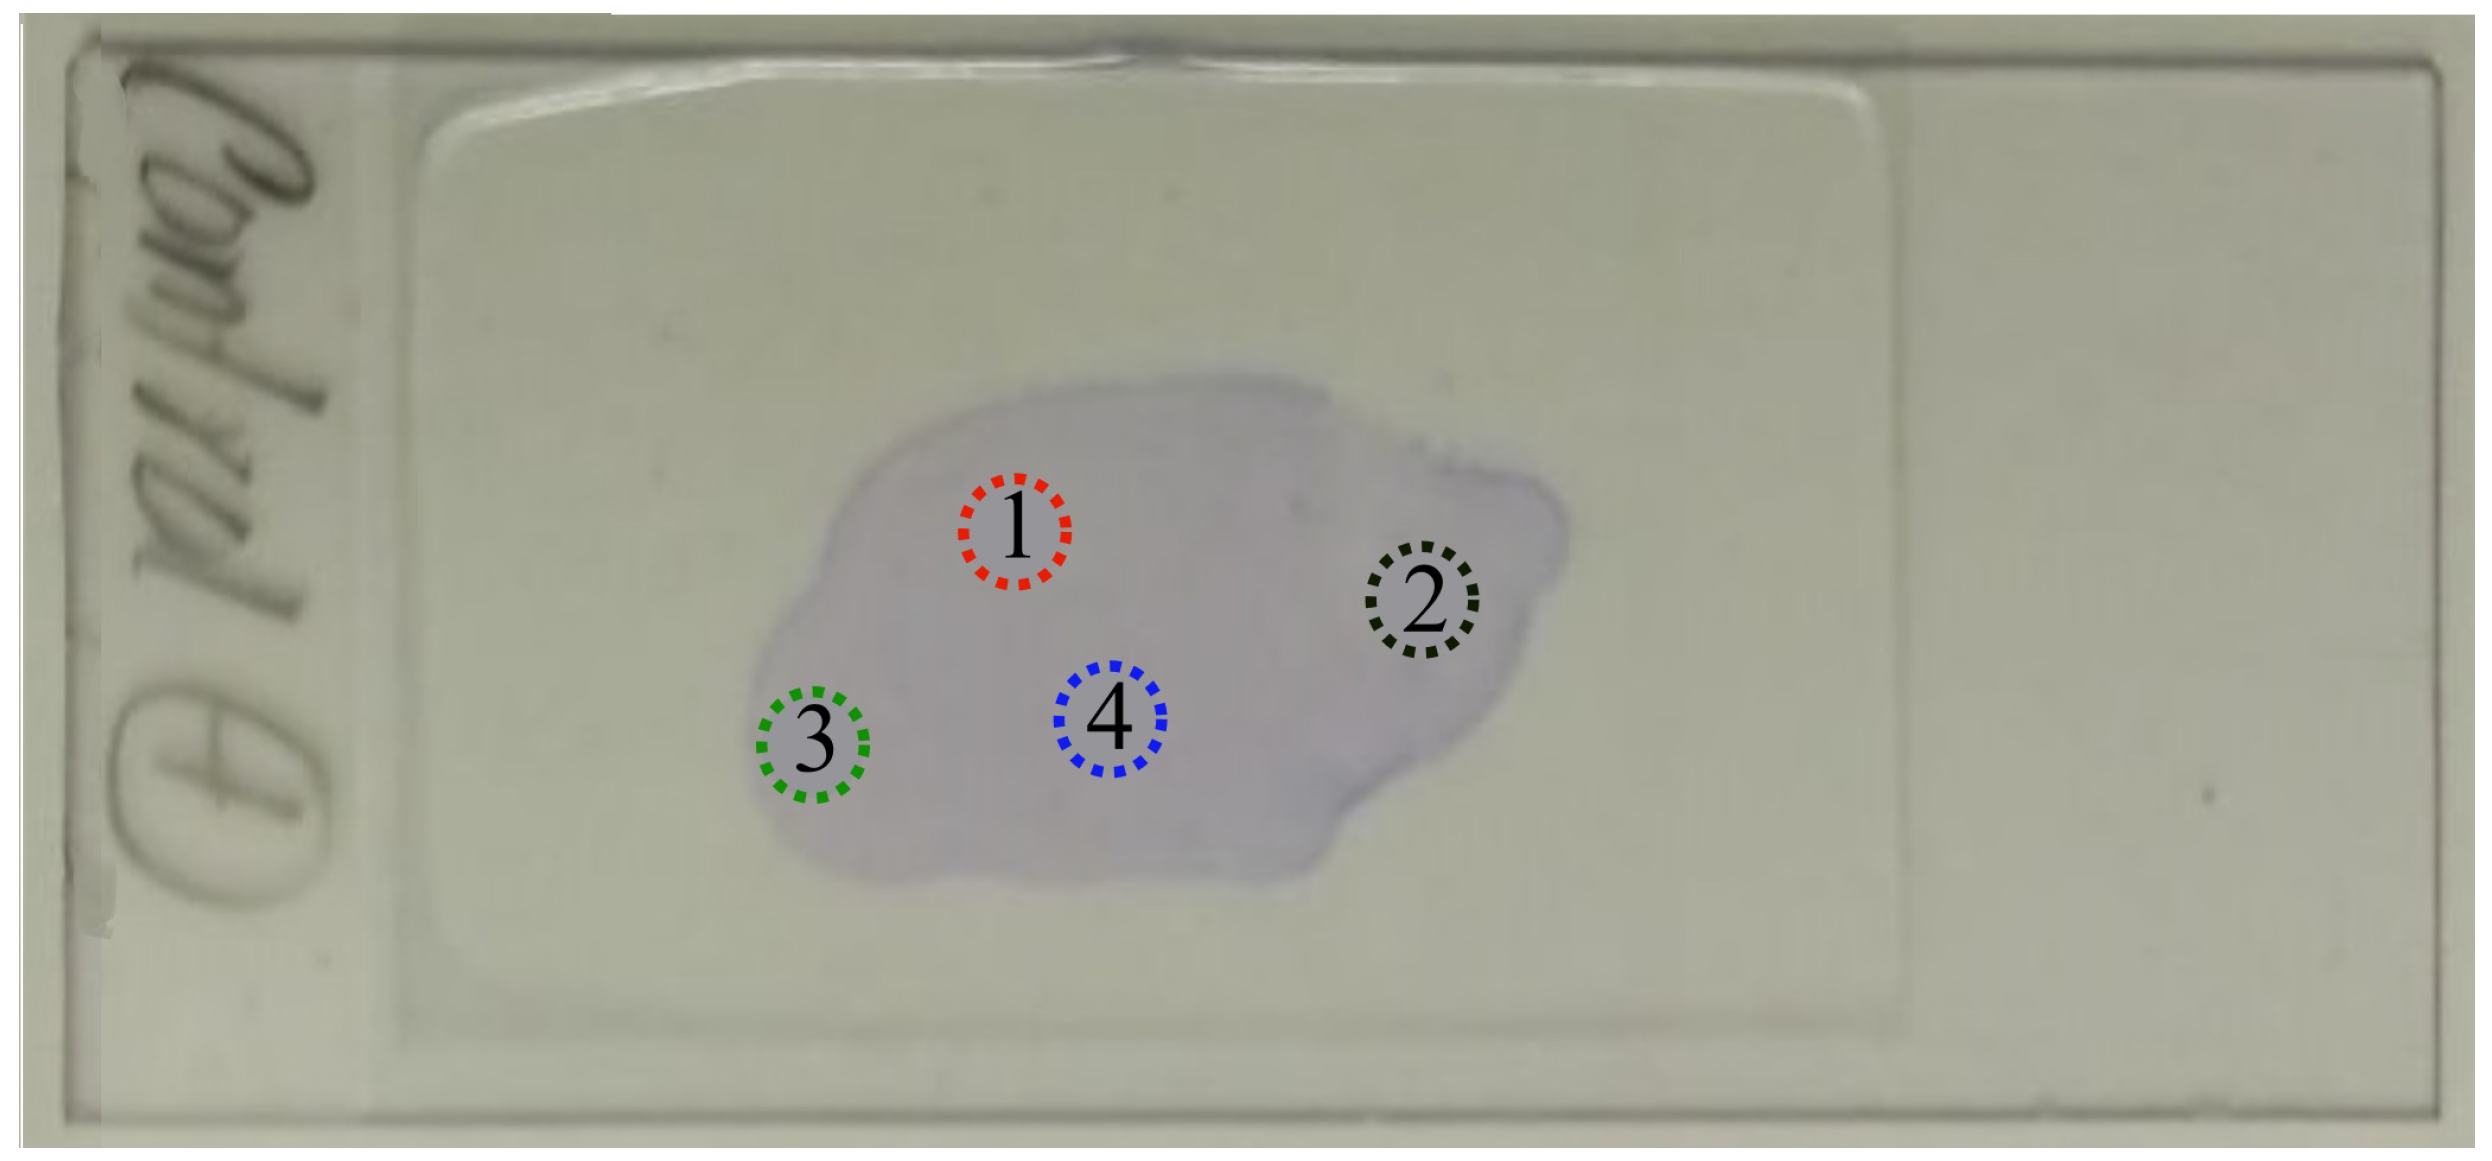
Abstract
1. Summary
2. Materials and Methods
2.1. Materials
2.2. Samples’ Preparation
2.3. Image Acquisition
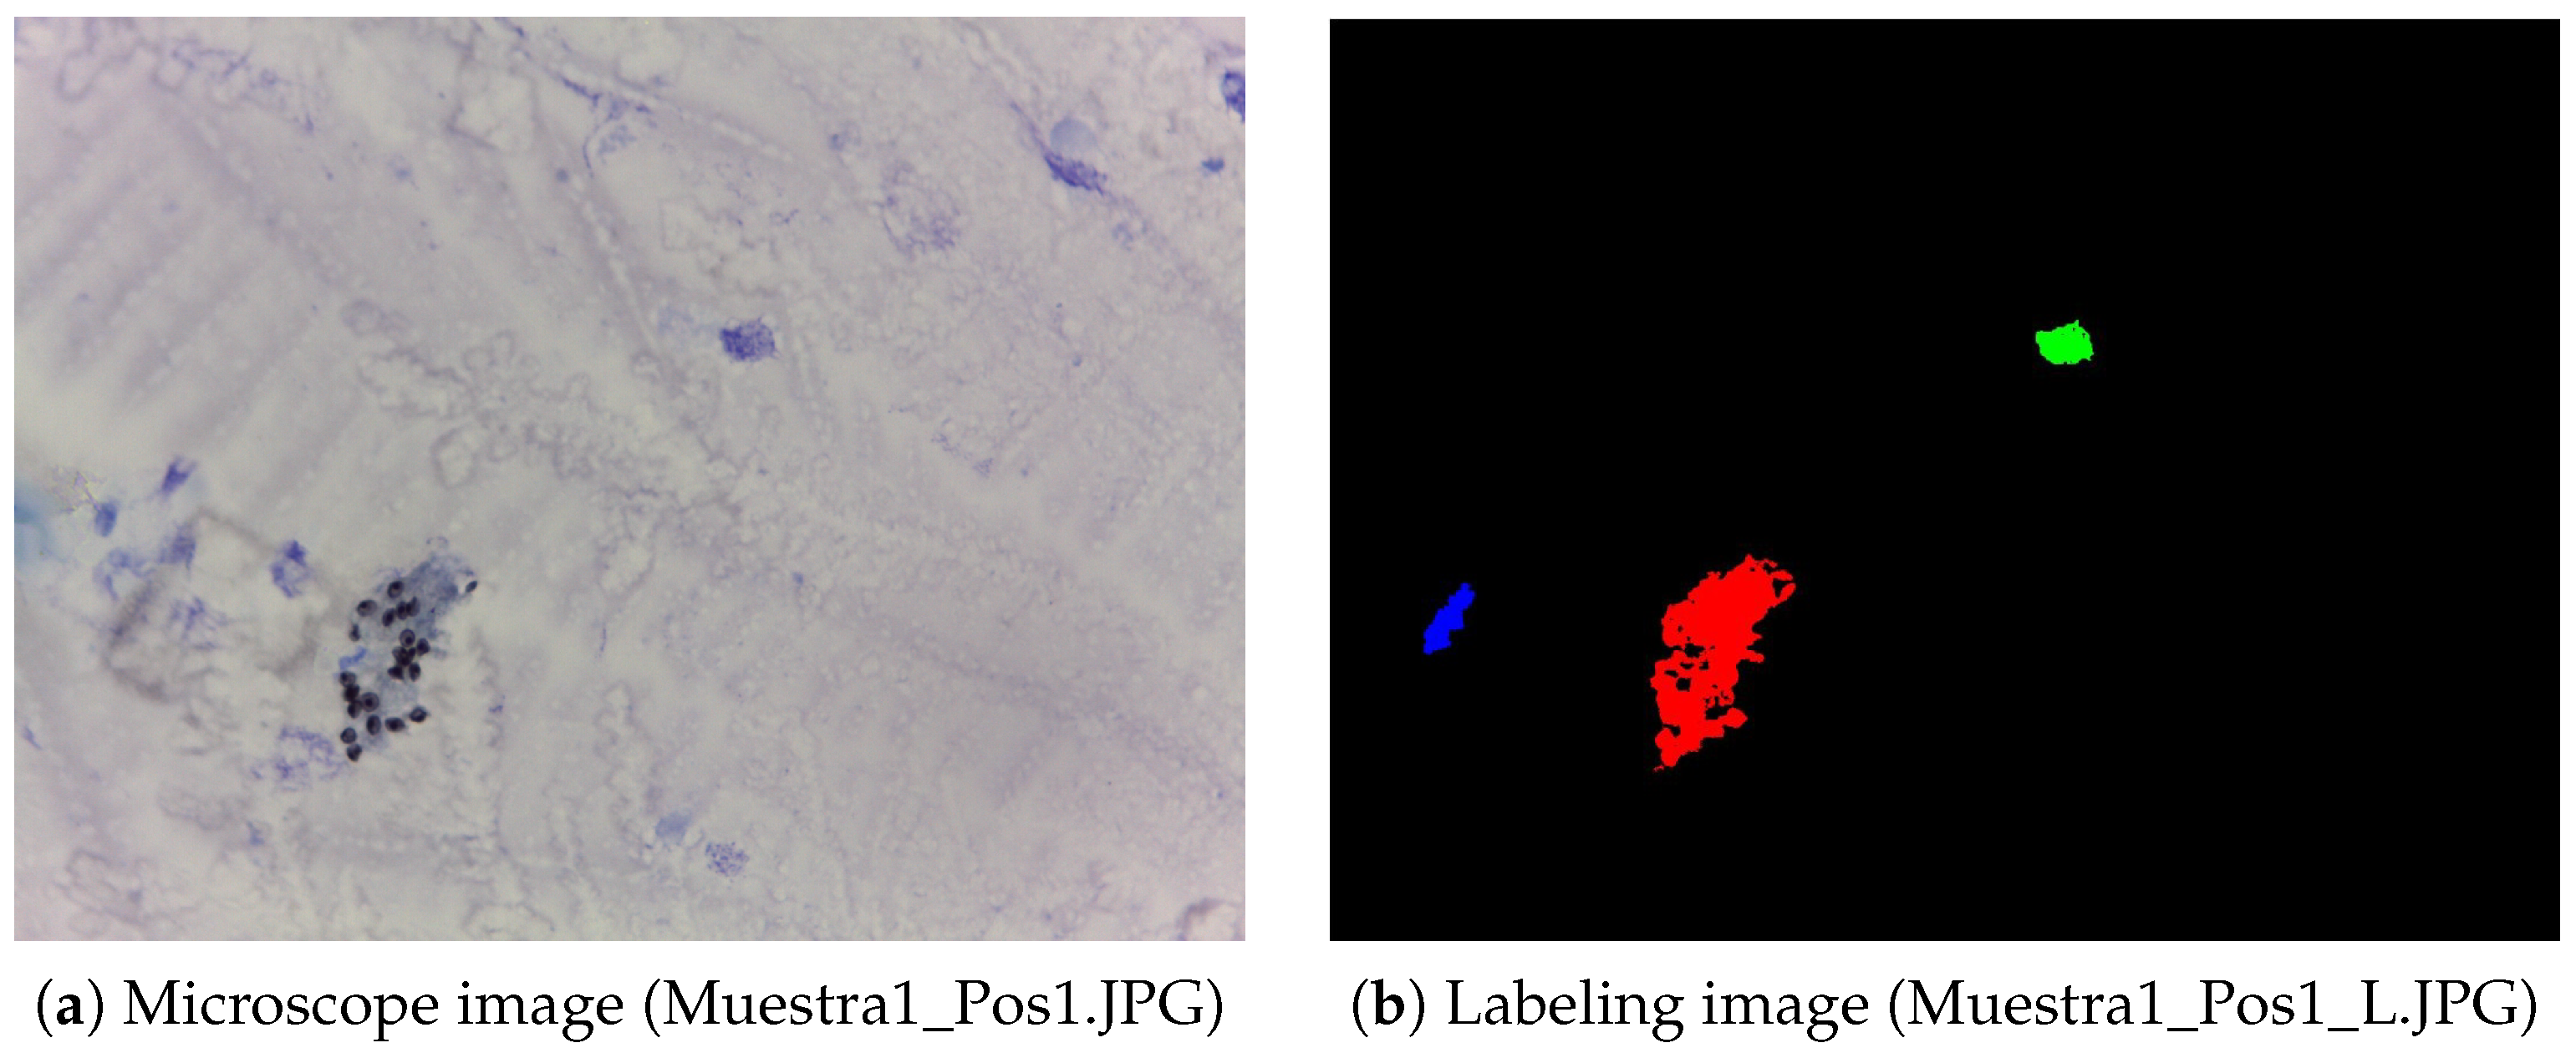
2.4. Image Processing
3. Data Description
4. User Notes
- These diagnostic images obtained with optical microscopy can be useful for researchers and data scientists working on computer-vision-based models for image segmentation and object detection using medical images. Recent studies have shown that the diagnosis of this disease from diagnostic imaging is a topic of worldwide interest [15,23], since the timely diagnosis of this disease can save many lives, especially immunocompromised patients.
- The presented dataset could be used to train, test, and validate computational models related to Pneumocystis jirovecii pneumonia diagnosis based on image analysis. For example, it is possible to use convolutional neural networks (CNNs) to address a binary classification of images obtained with optical microscopy. In this way, one of the most widely used diagnostic techniques for the detection of pneumonia can be improved.
- Our dataset includes annotations made by an expert in the diagnosis of Pneumocystis jirovecii pneumonia, which can be used to develop algorithms based on deep learning that help to have a more automated diagnosis of this disease from images obtained with optical microscopy.
- The dataset reported in this work can be further segmented and processed in different free tools such as ImageJ, U-Net, ML-powered, OpenCV, and others. Furthermore, commercial software such as Matlab or Mathematica can be used for segmentation and further analysis.
- This is the first dataset based on medical images obtained with optical microscopy for analyzing whether a patient has Pneumocystis jirovecii pneumonia.
Author Contributions
Funding
Institutional Review Board Statement
Informed Consent Statement
Data Availability Statement
Conflicts of Interest
References
- Vielle Peggy, F.D. Métodos Diagnósticos Tintoriales para Pneumocystis jirovecii (Diagnostic methods staining for Pneumocystis jirovecii). Boletin Medico 2011, 26, 29–34. [Google Scholar]
- Saraiva, A.A.; Santos, D.B.; Costa, N.C.; Sousa, J.V.M.; Fonseca Ferreira, N.M.; Valente, A.; Soares, S. Models of Learning to Classify X-ray Images for the Detection of Pneumonia using Neural Networks. In Proceedings of the 12th International Joint Conference on Biomedical Engineering Systems and Technologies—BIOIMAGING, Prague, Czech Republic, 22–24 February 2019; Volume 1, pp. 76–83. [Google Scholar] [CrossRef]
- Hammarström, H.; Grankvist, A.; Broman, I.; Kondori, N.; Wennerås, C.; Gisslen, M.; Friman, V. Serum-based diagnosis of Pneumocystis pneumonia by detection of Pneumocystis jirovecii DNA and 1,3-β-D-glucan in HIV-infected patients: A retrospective case control study. BMC Infect. Dis. 2019, 19, 658. [Google Scholar] [CrossRef] [PubMed]
- Clarkson, A.B.; Merali, S. Pneumocystis pneumonia, 1st ed.; CRC Press: Boca Raton, FL, USA, 2009; pp. 227–236. [Google Scholar] [CrossRef]
- Kaur, R.; Wadhwa, A.; Bhalla, P.; Dhakad, M.S. Pneumocystis pneumonia in HIV patients: A diagnostic challenge till date. Med. Mycol. 2015, 53, 587–592. [Google Scholar] [CrossRef] [PubMed]
- Song, Y.; Ren, Y.; Wang, X.; Li, R. Recent advances in the diagnosis of Pneumocystis pneumonia. Med. Mycol. J. 2016, 57, E111–E116. [Google Scholar] [CrossRef]
- Baltazar, L.R.; Manzanillo, M.G.; Gaudillo, J.; Viray, E.D.; Domingo, M.; Tiangco, B.; Albia, J. Artificial intelligence on COVID-19 pneumonia detection using chest xray images. PLoS ONE 2021, 16, e0257884. [Google Scholar] [CrossRef]
- Chumbita, M.; Cillóniz, C.; Puerta-Alcalde, P.; Moreno-García, E.; Sanjuan, G.; Garcia-Pouton, N.; Soriano, A.; Torres, A.; Garcia-Vidal, C. Can artificial intelligence improve the management of pneumonia. J. Clin. Med. 2020, 9, 248. [Google Scholar] [CrossRef]
- Stokes, K.; Castaldo, R.; Federici, C.; Pagliara, S.; Maccaro, A.; Cappuccio, F.; Fico, G.; Salvatore, M.; Franzese, M.; Pecchia, L. The use of artificial intelligence systems in diagnosis of pneumonia via signs and symptoms: A systematic review. Biomed. Signal Process. Control. 2022, 72, 103325. [Google Scholar] [CrossRef]
- Ebrahimian, S.; Homayounieh, F.; Rockenbach, M.A.; Putha, P.; Raj, T.; Dayan, I.; Bizzo, B.C.; Buch, V.; Wu, D.; Kim, K.; et al. Artificial intelligence matches subjective severity assessment of pneumonia for prediction of patient outcome and need for mechanical ventilation: A cohort study. Sci. Rep. 2021, 11, 858. [Google Scholar] [CrossRef]
- Rodiño, J.; Rincón, N.; Aguilar, Y.A.; Rueda, Z.V.; Herrera, M.; Vélez, L.A. Diagnóstico microscópico de neumonía por Pneumocystis jirovecii en muestras de lavado broncoalveolar y lavado orofaríngeo de pacientes inmunocomprometidos con neumonía. Biomédica 2011, 31, 222. [Google Scholar] [CrossRef][Green Version]
- Alshahrani, M.Y.; Alfaifi, M.; Ahmad, I.; Alkhathami, A.G.; Hakami, A.R.; Ahmad, H.; Alshehri, O.M.; Dhakad, M.S. Pneumocystis jirovecii detection and comparison of multiple diagnostic methods with quantitative real-time PCR in patients with respiratory symptoms. Saudi J. Biol. Sci. 2020, 27, 1423–1427. [Google Scholar] [CrossRef]
- Zhu, H.; Isikman, S.O.; Mudanyali, O.; Greenbaum, A.; Ozcan, A. Optical imaging Techniques for Point-Of-Care Diagnostics. Lab Chip 2013, 13, 51–67. [Google Scholar] [CrossRef] [PubMed]
- Alanio, A.; Bretagne, S. Diagnosis of Pneumocystis jirovecii Pneumonia: Role of β-D-Glucan Detection and PCR. Curr. Fungal Infect. Rep. 2014, 8, 322–330. [Google Scholar] [CrossRef]
- Jaiswal, A.K.; Tiwari, P.; Kumar, S.; Gupta, D.; Khanna, A.; Rodrigues, J.J. Identifying pneumonia in chest X-rays: A deep learning approach. Measurement 2019, 145, 511–518. [Google Scholar] [CrossRef]
- Botero-Valencia, J.S.; Valencia-Aguirre, J. Portable low-cost IoT hyperspectral acquisition device for indoor/outdoor applications. HardwareX 2021, 10, e00216. [Google Scholar] [CrossRef]
- Momenzadeh, M.; Sehhati, M.; Mehri Dehnavi, A.; Talebi, A.; Rabbani, H. Automatic diagnosis of vulvovaginal candidiasis from Pap smear images. J. Microsc. 2017, 267, 299–308. [Google Scholar] [CrossRef]
- Asefpour Vakilian, K.; Massah, J. An artificial neural network approach to identify fungal diseases of cucumber (Cucumis sativus L.) plants using digital image processing. Arch. Phytopathol. Plant Prot. 2013, 46, 1580–1588. [Google Scholar] [CrossRef]
- Ziyaee, P.; Ahmadi, V.F.; Bazyar, P.; Cavallo, E. Comparison of different image processing methods for segregation of peanut (Arachis hypogaea L.) seeds infected by aflatoxin-producing fungi. Agronomy 2021, 11, 873. [Google Scholar] [CrossRef]
- Tahir, M.W.; Zaidi, N.A.; Rao, A.A.; Blank, R.; Vellekoop, M.J.; Lang, W. A fungus spores dataset and a convolutional neural network based approach for fungus detection. IEEE Trans. Nanobiosci. 2018, 17, 281–290. [Google Scholar] [CrossRef]
- Mäder, U.; Quiskamp, N.; Wildenhain, S.; Schmidts, T.; Mayser, P.; Runkel, F.; Fiebich, M. Image-Processing Scheme to Detect Superficial Fungal Infections of the Skin. Comput. Math. Methods Med. 2015, 2015, 851014. [Google Scholar] [CrossRef]
- Sirazitdinov, I.; Kholiavchenko, M.; Mustafaev, T.; Yixuan, Y.; Kuleev, R.; Ibragimov, B. Deep neural network ensemble for pneumonia localization from a large-scale chest X-ray database. Comput. Electr. Eng. 2019, 78, 388–399. [Google Scholar] [CrossRef]
- Kassania, S.H.; Kassanib, P.H.; Wesolowskic, M.J.; Schneidera, K.A.; Detersa, R. Automatic Detection of Coronavirus Disease (COVID-19) in X-ray and CT Images: A Machine Learning Based Approach. Biocybern. Biomed. Eng. 2021, 41, 867–879. [Google Scholar] [CrossRef] [PubMed]
- Pujari, J.D.; Yakkundimath, R.; Byadgi, A.S. Image processing Based Detection of Fungal Diseases in Plants. Procedia Comput. Sci. 2015, 46, 1802–1808. [Google Scholar] [CrossRef]
- Urda-Benitez, R.D.; Castro-Ospina, A.E.; Orozco-Duque, A. Feature extraction based on time-singularity multifractal spectrum distribution in intracardiac atrial fibrillation signals. TecnoLógicas 2017, 20, 97–111. [Google Scholar] [CrossRef][Green Version]
- Bedoya-Vargas, M.E.; Vásquez-Correa, J.C.; Orozco-Arroyave, J.R. Time-frequency representations from inertial sensors to characterize the gait in Parkinson’s disease. TecnoLógicas 2018, 21, 53–69. [Google Scholar] [CrossRef]
- Arteaga, M.A.; Castaneda, E. Micosis Humanas, Procedimientos Diagnósticos—Exámenes directos, 2nd ed.; Corporación para Investigaciones Biológicas: Medellin, Colombia, 2003; pp. 146–168. [Google Scholar]
- Nassar, A.; Zapata, M.; Little, J.V.; Siddiqui, M.T. Utility of reflex gomori methenamine silver staining for Pneumocystis jirovecii on bronchoalveolar lavage cytologic specimens: A review. Diagn. Cytopathol. 2006, 34, 719–723. [Google Scholar] [CrossRef] [PubMed]
- Reiss, E.; Shadomy, H.J.; Lyon, G.M., III. Laboratory Diagnostic Methods in Medical Mycology; John Wiley & Sons, Inc.: Hoboken, NJ, USA, 2011; pp. 31–73. [Google Scholar] [CrossRef]
- Zuluaga, A.; Gonzalez, D.; Rua, A. Diagnostico Micologico por el Laboratorio II: Examen Directo, Coloraciones y Medios de Cultivo, 1st ed.; Corporacion para Investigaciones Biologicas: Medellin, Colombia, 2018; pp. 553–592. [Google Scholar]


Publisher’s Note: MDPI stays neutral with regard to jurisdictional claims in published maps and institutional affiliations. |
© 2022 by the authors. Licensee MDPI, Basel, Switzerland. This article is an open access article distributed under the terms and conditions of the Creative Commons Attribution (CC BY) license (https://creativecommons.org/licenses/by/4.0/).
Share and Cite
Reyes-Vera, E.; Botero-Valencia, J.S.; Arango-Bustamante, K.; Zuluaga, A.; Naranjo, T.W. Microscopic Imaging and Labeling Dataset for the Detection of Pneumocystis jirovecii Using Methenamine Silver Staining Method. Data 2022, 7, 56. https://doi.org/10.3390/data7050056
Reyes-Vera E, Botero-Valencia JS, Arango-Bustamante K, Zuluaga A, Naranjo TW. Microscopic Imaging and Labeling Dataset for the Detection of Pneumocystis jirovecii Using Methenamine Silver Staining Method. Data. 2022; 7(5):56. https://doi.org/10.3390/data7050056
Chicago/Turabian StyleReyes-Vera, Erick, Juan S. Botero-Valencia, Karen Arango-Bustamante, Alejandra Zuluaga, and Tonny W. Naranjo. 2022. "Microscopic Imaging and Labeling Dataset for the Detection of Pneumocystis jirovecii Using Methenamine Silver Staining Method" Data 7, no. 5: 56. https://doi.org/10.3390/data7050056
APA StyleReyes-Vera, E., Botero-Valencia, J. S., Arango-Bustamante, K., Zuluaga, A., & Naranjo, T. W. (2022). Microscopic Imaging and Labeling Dataset for the Detection of Pneumocystis jirovecii Using Methenamine Silver Staining Method. Data, 7(5), 56. https://doi.org/10.3390/data7050056