1. Introduction
The academic performance of students is an essential part of education. Students with low academic performance will face many issues, such as late graduation and even dropping out [
1,
2]. Thus, educational institutions should monitor their students’ academic performance closely and support low performing students immediately. One method to achieve that is by predicting students’ academic performance [
1]. Using this method will help educational institutions to identify and support low performing students at an early stage.
Early prediction of students’ academic performance can assist educational institutions to take the appropriate action at the right time, and making a suitable plan to improve the academic performance of low performing students [
3]. However, predicting students’ academic performance accurately can be challenging as it is influenced by numerous factors (e.g., academic, marital, and economic factors) [
4,
5].
The paper aims to predict students’ academic performance (i.e., total score) for university students, through some factors using Machine Learning (ML) algorithms. This paper achieves the aim by undertaking the following objectives:
Create a dataset that contains the academic and demographic data of the students in the Computer Science (CS) department at the College of Sciences and Humanities.
Build a prediction model to predict students’ academic performance.
Compare different algorithms to indicate which one gives the best prediction’s MAPE.
Identify the most important factors that help to predict students’ academic performance.
Deploy the prediction model on a web page.
Generate a report for students’ academic performance via the web page.
The remainder of this paper is arranged as follows.
Section 2 presents related work on students’ academic performance prediction using ML.
Section 3 and
Section 4 put forward the prediction system. Experimental settings and results are discussed in
Section 5 and
Section 6. Finally,
Section 7 draws the conclusion and sets future work.
2. Related Work
This section reviews the most important related studies on students’ academic performance prediction. Moreover, the software support tools for students’ academic performance are mentioned.
2.1. Students’ Academic Performance Prediction
Students’ academic performance prediction models can be divided into the models applied in E-learning and distance learning environment, and on-campus learning environment.
2.1.1. E-Learning and Distance Learning Environment
Predicting students at risk of academic failure at the year’s level was considered in [
4,
6,
7]. The authors have examined the impact of economic, psychological, and demographic factors on the students’ academic performance. The results showed that demographic factors affect students’ academic performance. In [
7], the academic history has the most affects the students’ academic performance. Moreover, the Random Forest (RF) algorithm gave the highest accuracy by 93%, 90%, and 91%, respectively.
In [
8], the authors have conducted to improve students’ final performance prediction in online discussion forums using Data Mining (DM) techniques. The authors have illustrated how features selection can improve prediction accuracy. Moodle platform provided the dataset with 114 undergraduate students in the first-year CS course. The results showed that early prediction was possible, and the application of classification via clustering with association rules was the best. Moreover, a subset of features was more beneficial to improve the accuracy of classification.
In [
9], the authors have focused on E-learning problems which are difficult to analyze students’ behavior towards their researches, and their interaction with class activities and teachers. The authors obtained the dataset from the Kalboard 360 E-learning system. The results showed that the LR has an accuracy of 71%, while the accuracy of the Support Vector Machine (SVM) is 78%. Moreover, the three main categories of factors that affect students’ academic grades are student satisfaction, interaction with the system, and punctuality in the classroom.
In [
3], the authors have highlighted the importance of the early warning system to predict students at risk during the course of progress. The authors have collected data from 300 students who have completed learning activities of an online undergraduate course. Furthermore, students’ files of learning recorded in the Learning Management System (LMS) were analyzed. The main technique is Classification And Regression Tree (CART) supplemented by AdaBoost. The results showed that the LMS is critical factor for online learning. In addition, time-dependent variables are important in identifying student learning performance. Moreover, the accuracy of predicting increases as the semester progresses.
In [
1], the authors have considered the effective DM techniques to early predict students likely to fail in Introductory Programming course. The datasets were obtained from a Brazilian Public University, one dataset collected from distance education and the other one from on campus. The most important attribute in distance education is the exam, and on-campus education is an exercise. The main techniques applied are SVM, Decision Tree (DT) via J48, Neural Network (NN), and Naive Bayes (NB). The result showed that the DT technique could predict with 82% accuracy when the students have performed at least 50% of the distance education course, and 79% prediction accuracy when the students have performed at least 25% of the on-campus course.
2.1.2. On-Campus Learning Environment
In [
10], the authors have used DM techniques on the school’s student data to investigate the relationship between failure courses using the association rule technique. The dataset with 28 students was provided from class 11-A in Istanbul Eyup I.M.K.B. Vocational Commerce HS, including all the students’ points in 74 courses in total. The authors applied the Apriori algorithm to the students’ data, and the minimum confidence rate of the relationship was 85%. The results showed some rules indicating that students who did not succeed in the numeral courses failed in it again after a year. However, using the prediction may help get an early warning to prevent students from dropping out.
In [
11], the authors have focused on predicting students that doing poorly in a course early in order to take appropriate action. This study develops a model to predict the final grade at the course level, which means the excepted accuracy of the prediction is sufficient based on past history of students’ performance in a course. The dataset consists of 700 undergraduate students are registered in Massive Open Online Courses (MOOCs) who have taken the Introductory Digital Signal Processing course over the past seven years. The technique used was Regression and Classification algorithms. The result showed that the system could predict the final grade of students with 76% accuracy after the fourth week and when predict later, the accuracy will increase.
In [
12], the authors have considered the applicability of ANN in predicting medical students’ learning performance compared to LR models. Three ANN models, namely: Radial Bias Function (RBF), Multilayer Perceptron (MLP), and Probabilistic Neural Network (PNN) are used with SVM, and the performance is represented with T-scores of the total examination scores. For two academic years, the dataset was collected from second-year students of the medical neuroscience course from Mahidol University, who totaled 368 students. The main findings were the accuracy of the algorithm’s performance ranged from 98.1% to 99.5% for the good and 97.0% to 99.5% for the poor students but, there were no statistically significant differences between the ANN and the regression models.
In [
13], the authors have applied clustering and classification to evaluate the student performance and predict whether the student will pass or fail a technical exam. The data of students was obtained from Koneru Lakshmaiah (KL) University. The applied clustering algorithms were K-mean and hierarchical clustering. The results showed that K-mean was efficient in large datasets, while hierarchical proved its efficiency in small datasets. The authors also used classification to predict whether the student would pass or fail a technical exam. The classification techniques used are DT and NB algorithms. The results showed that the DT algorithm is more accurate than the NB algorithm for the same dataset.
In [
14], the authors have provided two models to predict the performance of students in the final test for a Mathematics course, using the SVM and K-Nearest Neighbor (KNN) algorithms. The dataset consists of 395 students from the HE. Data were collected based on several features, which are academic and marital features. The results showed that both features of the paternal education degree and the grade of the semester have an impact on students’ performance. In addition, the SVM algorithm gave better results in predicting the student’s score with a correlation coefficient of 0.96.
In [
15], the authors have provided a model to predict the students’ performance in Mathematics and Language courses, using a hybrid classification technique. The dataset consists of 1044 students from the HE. Thirty-two factors were used from various domains, which are academic and marital factors. Student’s performance data was taken from the two courses and then classified into several categories which are excellent (a), good (b), satisfactory (c), adequate (d), and failed (f). The results showed that the feature of father’s education, father’s job, student’s guardian, activities, and the number of school absences have an impact on the student’s performance and are considered as the optimal features. The accuracy of predicting students’ performance for the Mathematics course is 82.278% and 85.821% for the Language course.
In [
16], the authors have provided a model for early prediction of final exam score for a programming course, using ML algorithms. The data were collected from Programming Online Judge (POJ), for 486 students. The data of the first two weeks were used to make the prediction early. The results showed that there are five features that play a role in identifying students with difficulty and hence has an impact on students’ performance, namely average of test cases correct only, an average of test cases all, an average of submission attempts, an average of deleted characters, the ratio between the submissions with the syntax error and the number of attempts, and the average log lines on attempt feature. In addition, the prediction accuracy of the model reached 75.55%.
In [
2], the authors have provided a model to predict the final test result for five courses: Python, Java, CS2-Java, Data Structure, and Architecture, using a binary classifier of a SVM. This study focused on one of the teaching practices, namely peer learning, which is an educational curriculum that presents a set of questions that are answered individually and then collectively discussed. The answers and all data for students were recorded using a clicker (hand-held device). The dataset used consists of the clicker data for the previous semester and the results of the final exams. The results showed that the dry Python cycle gave higher accuracy, which is 79%.
In [
17], the authors have considered the problems of low students’ achievement to avoid an expected poor result. This paper aims to predict the course’s final mark over three semesters. The main techniques applied are KNN and DT algorithms. The results showed that the prediction accuracy using DT yields 94.44% and 89.74% using KNN in predicting student final exam performance. The authors avoided some basic attributes such as attendance, assignment, and presentation. They found that the final exam depends on the midterm and the class test mark of a semester. This paper is similar to our model in terms of predicting the student’s final exam performance. However, we included more courses and considered the demographic and marital factors of the student.
2.2. Software Support Tool for Students’ Academic Performance Prediction
Some researches provided online tools to help tutors in predicting student’s academic performance. In [
18], the authors have conducted a case study to predict students’ marks in distance learning using ML. Regression algorithms were compared to identify an algorithm suitable for accurate prediction and as a supportive software tool for tutors. The dataset was provided by the Introduction to Informatics course of the Hellenic Open University (HOU) with 354 students records. The results showed that the M5rules algorithm was more accurate. The authors produced the software support tool version by implementing the M5rules algorithm while making it available online. This study is nearly identical to our objectives, except that it is not focused on the academic factors of students. In opposition to our work, one of our key objectives is to identify the factors that most influence student performance.
In [
19], the authors have considered the problem of students’ dropout in distance learning. They desired to determine whether the ML techniques were useful for predicting student dropout and then determining the most accurate algorithm. Six of the most common ML technologies were selected: DTs, NN, NB, Instance-Based Learning algorithms, Linear Regression (LR), and SVMs. The dataset was provided by the Introduction to Informatics course of the HOU with a total of 356 students’ records. The results showed that these algorithms are capable of predicting with satisfactory accuracy. After comparison, the NB algorithm was the best among them. The accuracy was 63% with students’ demographic data and exceeded 83% with student performance data. Finally, a prototype web-based support tool was created. In this paper, the authors predicted the student’s dropout. However, our model predicts the student’s dropout through his performance at the course level and predicts its final grade as well.
2.3. Research Motivation
Many researches have developed models for students’ academic performance prediction using ML. Most of the researches aims to predict dropout, failure courses, final performance, and final Grade Point Average (GPA). Nevertheless, our model aims to predict students’ academic performance (i.e., total score) and identify students’ at risk of failure, considering the factors that help in prediction. In most researches, their studies environment is on-campus. Nevertheless, in our model, distance and on-campus learning are applied, as teaching is applied in the distance learning environment duo to the COVID 19 pandemic, and students are assessed in on-campus environment.
Moreover, most of the researches focused on academic, marital, psychological, and demographic factors. In our model, we focus on academic information, marital and health factors. Besides, it is found that most of the researches did not consider the distance from home to the university as a factor (i.e., living place). However, in our model, we take this factor into consideration.
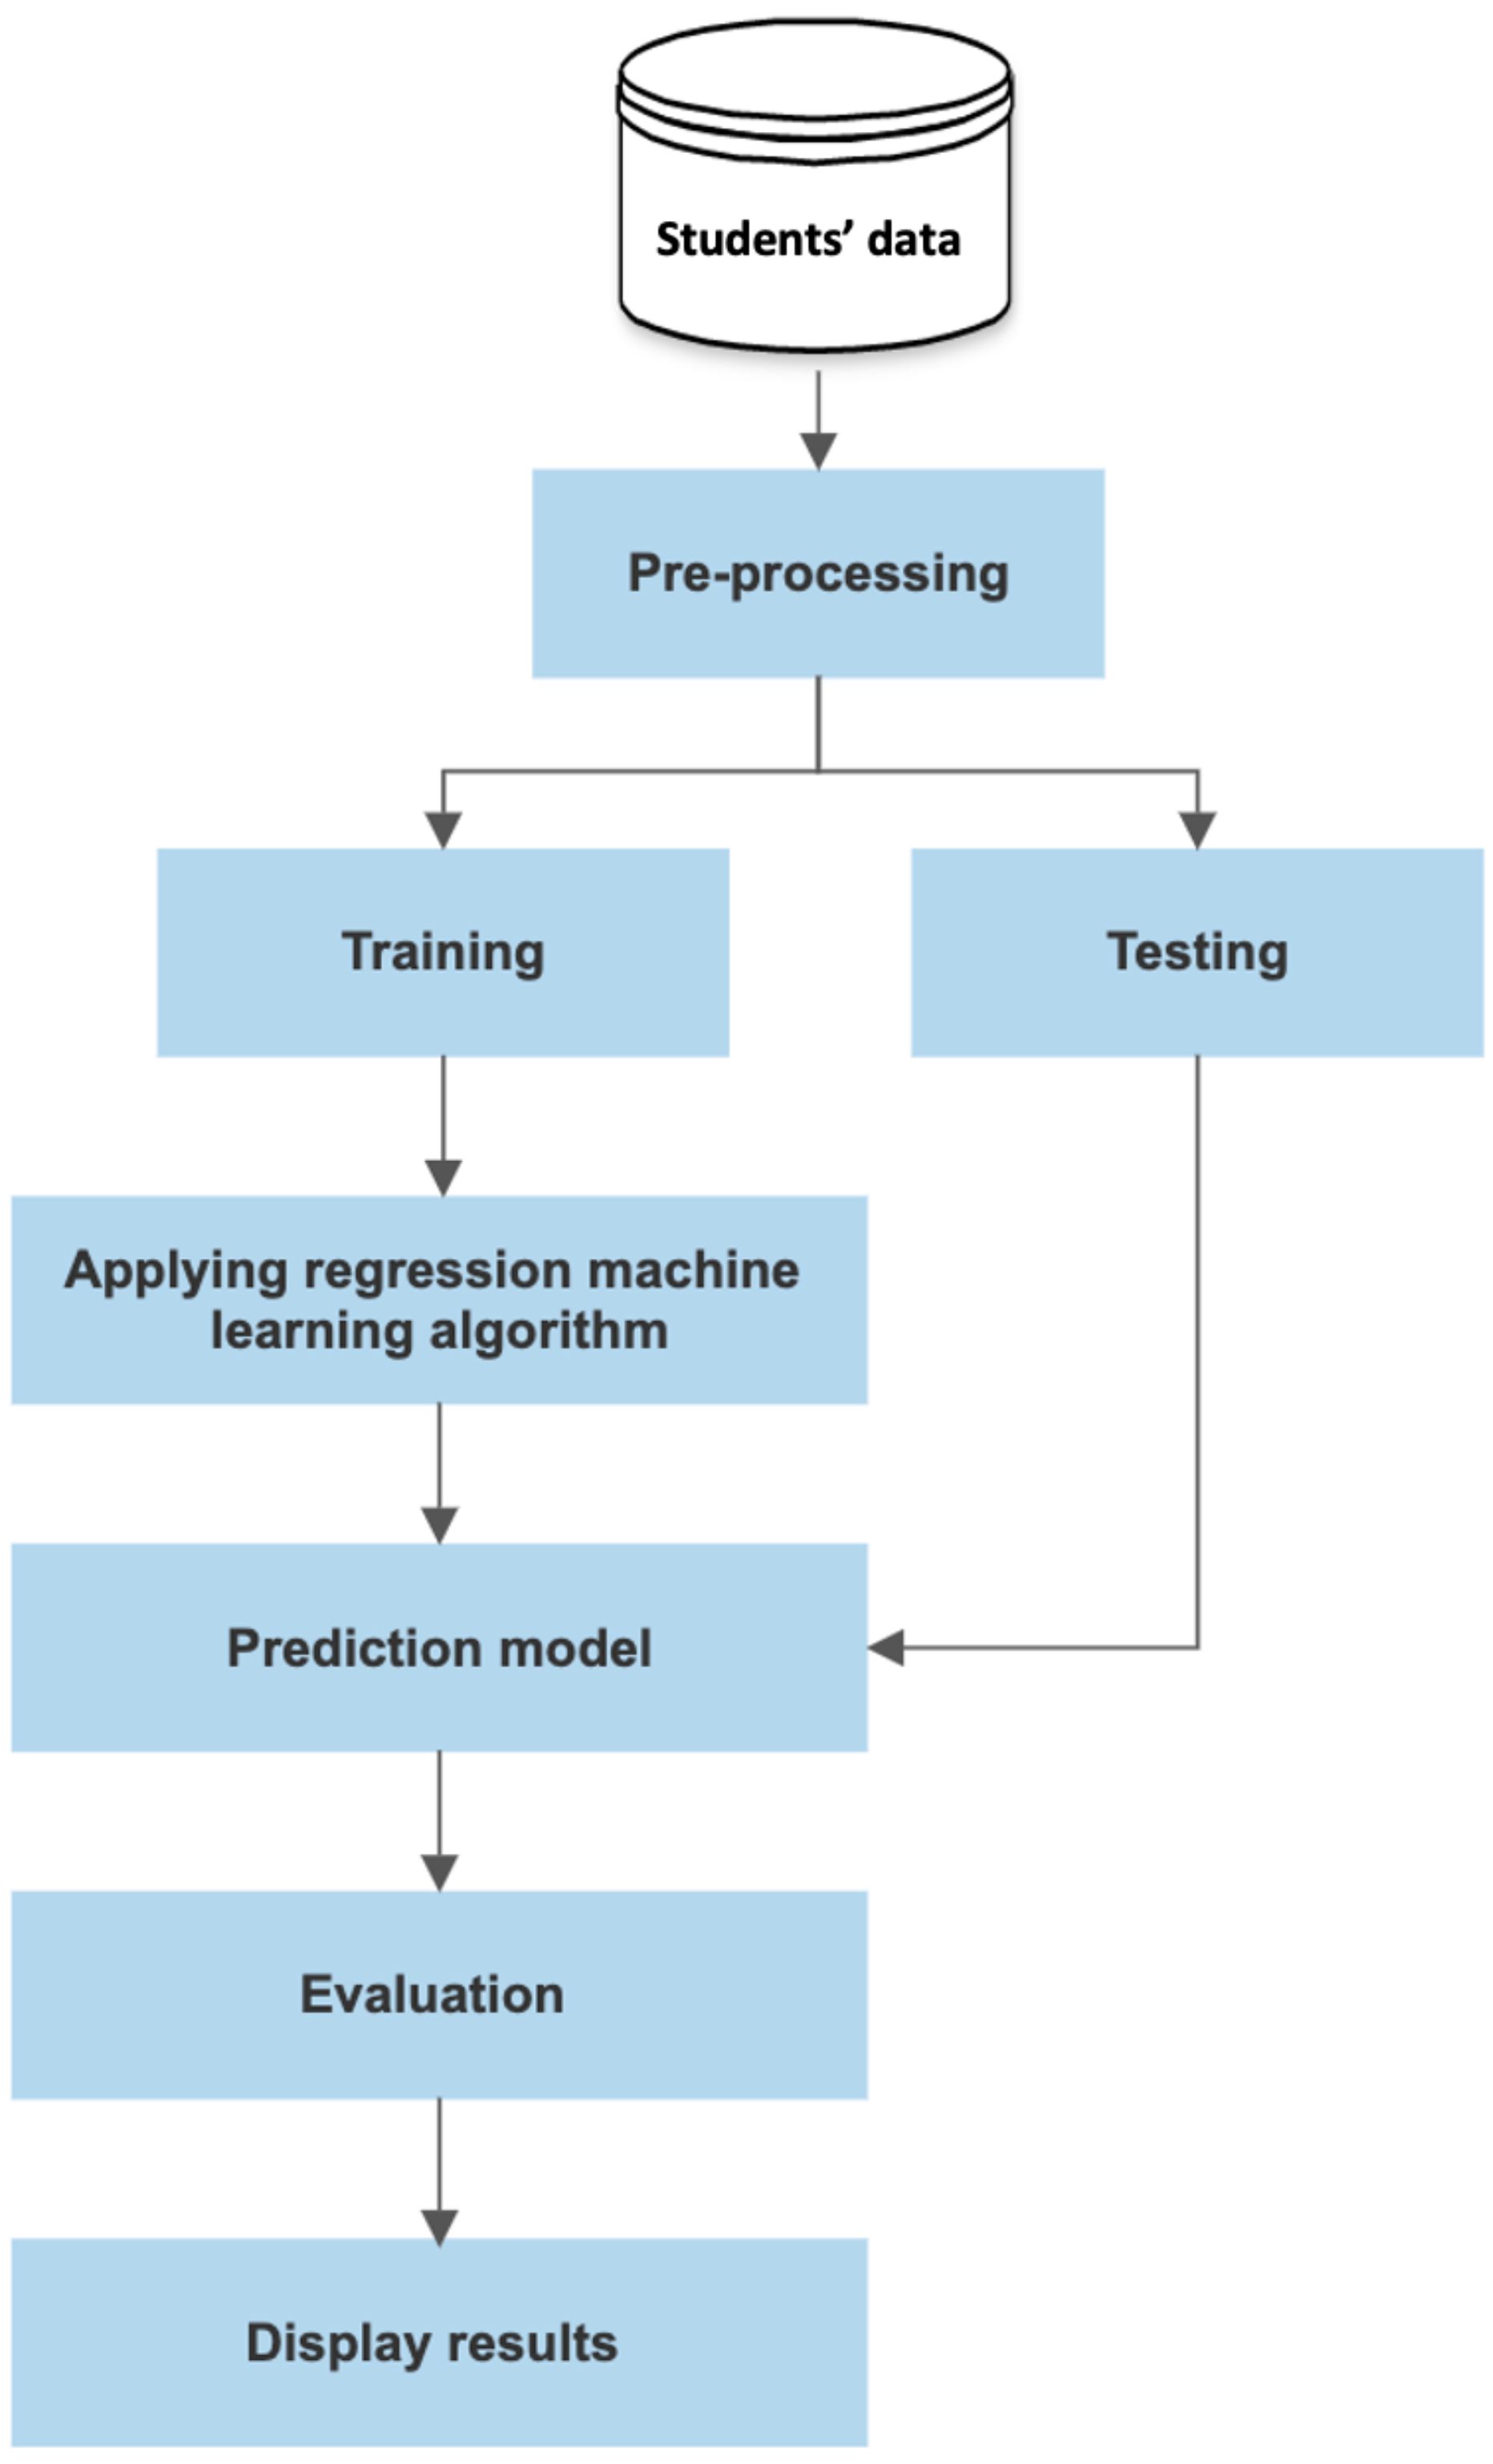
3. Prediction System for Students’ Academic Performance
The ML model for predicting students’ academic performance includes several steps: data collection, data pre-processing, splitting dataset, and the regression. The flowchart of the prediction model is shown in
Figure 1.
3.1. Data Collection
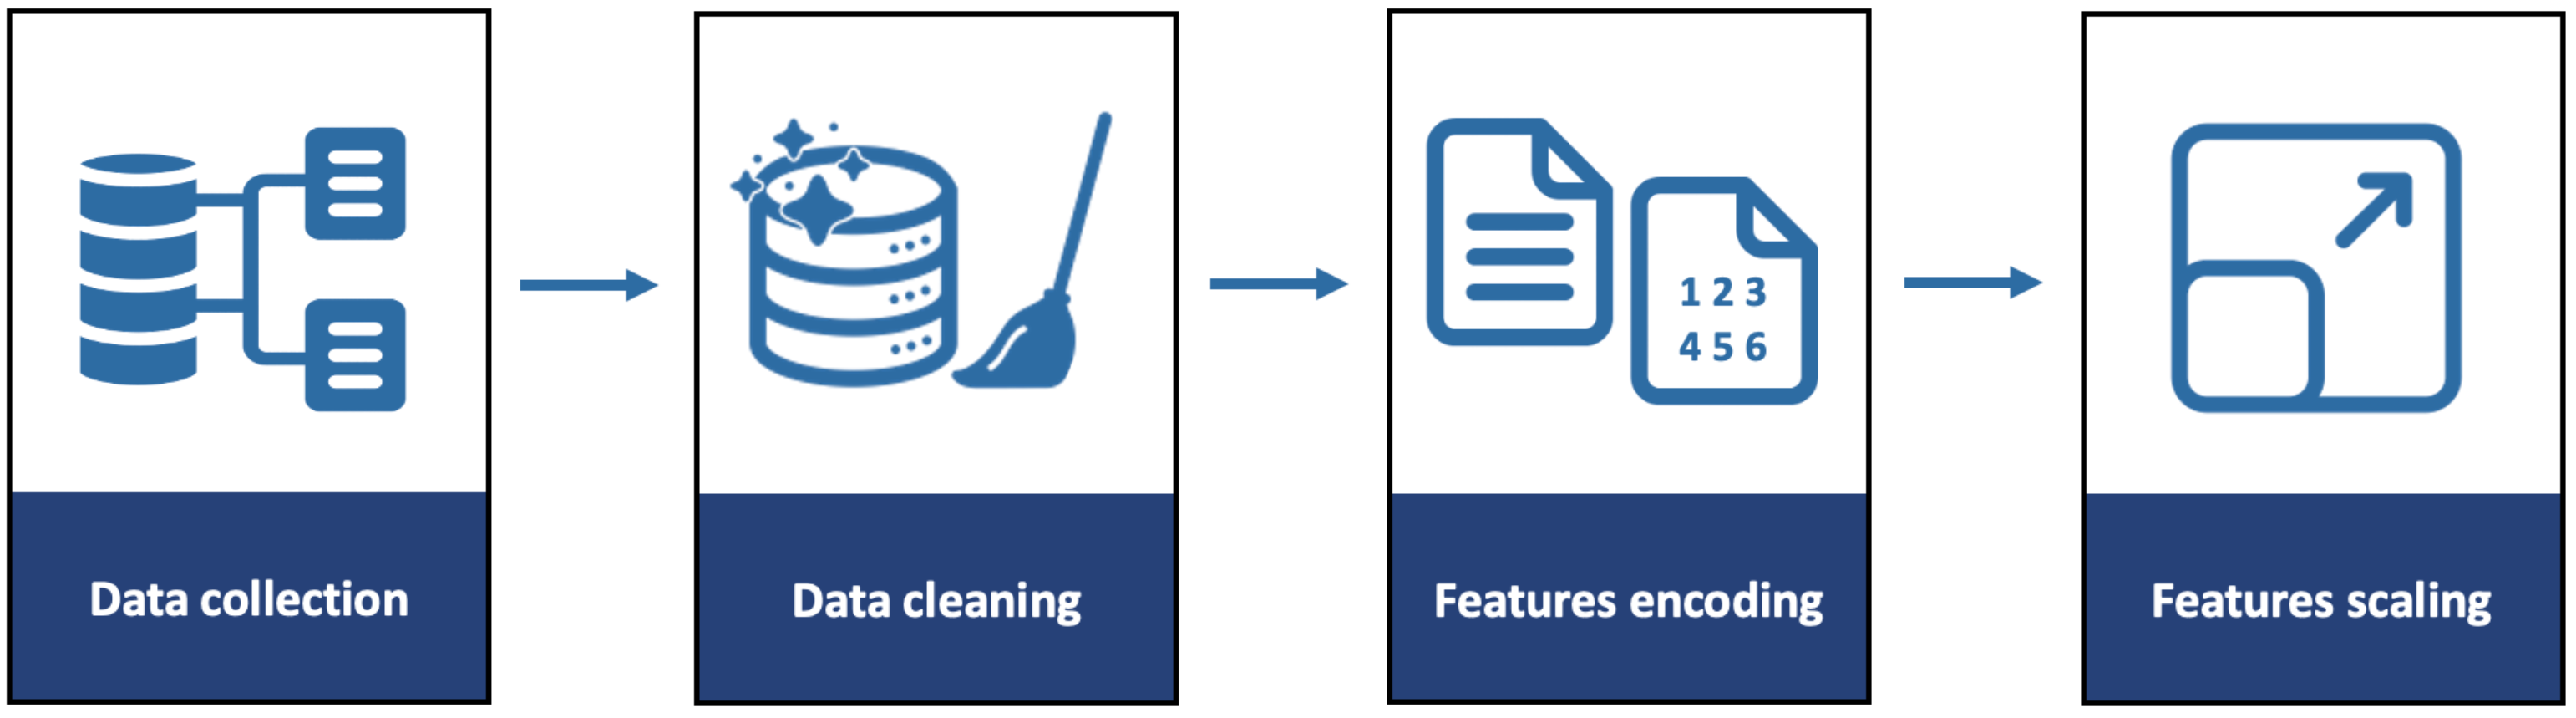
The dataset was collected from CS department in the College of Sciences and Humanities in Jubail at Imam Abdulrahman Bin Faisal University (IAU). The college is for female students only.
Figure 2 shows the methodology of collecting and pre-processing the dataset. The dataset contains 842 instances for 168 students. The students’ academic data were taken from the Academic Affairs. The dataset was collected from the first and second semesters in the academic year 2020–2021. Moreover, it was a distance learning year. All courses teaching and activities were held via distance learning, except for the midterm and final exams, they were held on-campus at the college. The dataset contains the academic information for students from the following levels: three, four, five, six, and seven. Each level contains several separate courses.
The study in the CS program starts at level 3 (after the foundation year) and ends at level 8. At each level, there are compulsory courses that the student must pass including specialized courses and general courses and there are no elective courses. In our dataset, we selected specialized courses in Computing only from level 3 to level 7, as we do not have any students in level 8 yet.
Table 1 shows the description of the dataset.
The data contains numeric data, which are the students’ course scores, categorical data which are courses names and the city. Each course has different columns depending on the course’s nature. Some columns were shared at all courses, such as the “mid_term” column. Other columns were different between courses, such as “participation”, “workshop”, and “discussion”. These columns were combined in one column called “mid_activities”.
Moreover, the dataset contains demographic data about the students collected via a questionnaire, which are:
Marital status data: includes whether the student is married or not, has children or not.
Health situation data: includes whether the student suffers from any diseases or not.
Living place data: includes the city where the student lives.
We have ten features, ten features are inputs and the last one is the output.
Table 2 presents the features descriptions which include the feature name, the description, and the domain. The domain means the numeric values of each feature. In features marital_status, children, and health, “1” means “Yes” and “0” means “No”, while in level and class the domain of the feature is the range between specific numbers.
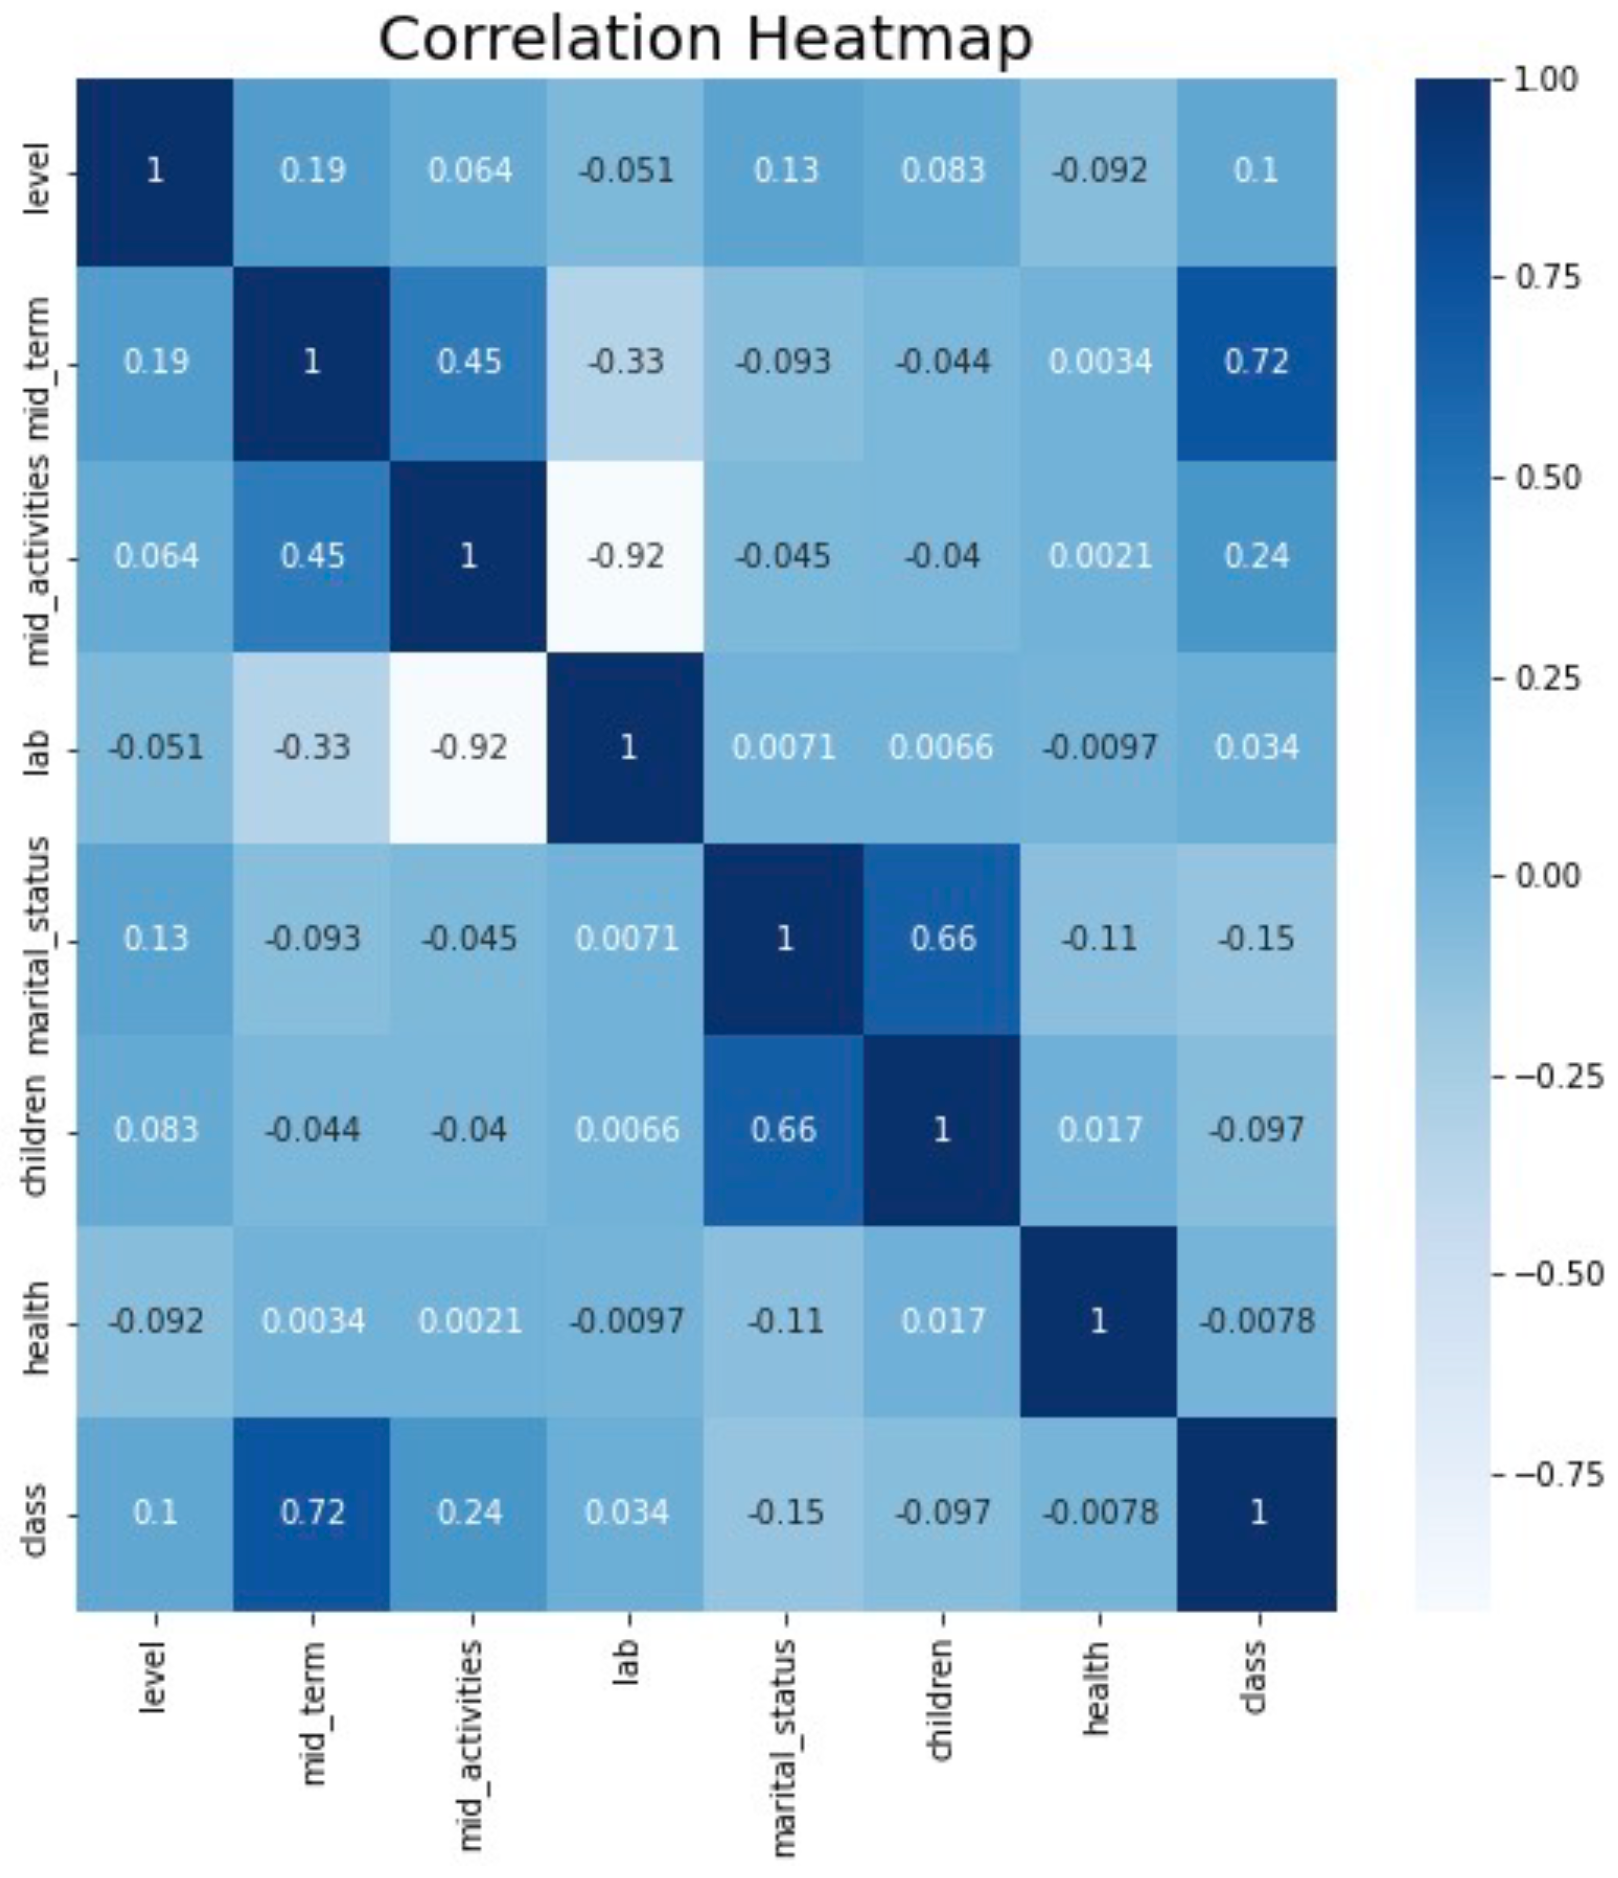
In
Figure 3, it can be seen how relational the features are. The level correlates with the midterm exam by 0.19. There is a correlation between the midterm exam and mid-activities by 0.45. There is also a significant correlation between midterm exam and class (i.e., total score) by 0.72. In addition, there is a correlation between the mid-activities and class (i.e., total score) by 0.24. Finally, there is also a significant correlation between marital_status and children by 0.66.
3.2. Data Pre-Processing
Pre-processing is an important step in data mining. The purpose of data pre-processing is to convert the data into a suitable form that can be used by algorithms. Three main pre-processing steps have been applied to the dataset which are data cleaning, features encoding, and features scaling. The pre-processing was implemented using Python language and Microsoft Excel.
3.2.1. Data Cleaning
Data in the real world are often noisy and unstructured. The data cleaning step aims to fix anomalies in the data by filling in missing values and smoothing out noise when finding outliers.
Handling Missing Values: In our dataset, several students did not fill out the questionnaire which led to having missing values in the demographic data columns. The observations with at least one missing value were deleted (listwise deletion). The dataset had 864 instances, and after removing the rows with the missing values the dataset now contains 842 instances and 168 students. Given the small percentage of observations eliminated (2.5%), there are probably no significant distortions.
3.2.2. Features Encoding
In ML models, all inputs and outputs are required to be numerical variables. Therefore, when there are categorical data, it must be encoded before using it in the model, and this is called features encoding. So, encoding is the pre-processing of the categorical data when working on a model of ML algorithms. There are several techniques to encode categorical features, such as Label Encoding, One-Hot Encoding, Frequency Encoding, Ordinal Encoding, Binary Encoding, Hash Encoding, and Mean/Target Encoding.
In our dataset, we have two categorical features, namely “course” and “city”. The course feature contains the abbreviation for the courses names, and the city feature is the name of the city where the student currently lives. To encode these two features into numeric features, we started by applying LabelEncoder and One-Hot Encoding techniques to determine which technique suits our dataset. LabelEncoder gave us the lower MAPE, so we used it in our dataset.
3.2.3. Features Scaling
Features scaling is a method for normalizing a set of independent variables or data features, where the data is scaled to fall within a smaller range such as 0.0 to 1.0. This may help to reduce the error rate of algorithms and speed up the training phase. Features scaling has several techniques, namely: MinMaxScaler, StandardScaler, MaxAbsScaler, and RobustScaler. In our dataset, we used the StandardScaler technique because it gave lower MAPE than the other techniques.
3.3. Splitting Dataset
The dataset is splitted into training and testing datasets. The training dataset is used to build the model and the testing dataset is used to evaluate the model. The model has been validated by using different validation techniques which are: percentage split and cross-validation. The validation technique that gave better results in terms of prediction’s MAPE has been chosen.
Table 3 shows the results of prediction’s MAPE for all algorithms when using 5-fold cross-validation and percentage split. It can be seen that the 80% for training data and 20% for testing data obtained better prediction’s MAPE than the 5-fold cross-validation technique.
3.4. Regression
Regression techniques are used to predict continuous outcomes rather than predicting discrete class labels. In this research, the aim is to predict the students’ total scores. Hence, the prediction problem is considered as a regression problem. Different algorithms (i.e., SVM, RF, KNN, ANN, and LR) are compared to identify which algorithm is more appropriate to predict the total score of students in each course. The prediction based on the regression model considers features as an input, executes some process on it, and predicts the total score as its output. After that, the performance of all regression models was compared through evaluation metrics. The algorithm that obtained the lowest prediction MAPE will be adopted in the prediction system.
3.4.1. Support Vector Machines (SVM)
SVMs are one of the most popular supervised ML algorithms used primarily for the classification task [
20]. It was developed by Vapnick in 1995 to deal with the problem of prediction and pattern recognition as well as for analyzing and mapping both linear and nonlinear functions [
21,
22].
The basic idea of how the SVM algorithm works are to find the hyperplane that can separate data belongs to two classes with a maximum margin [
23], builds a hyperplane, or a group of hyperplanes (classes) in a high dimensional space. It classifies the object into categories, above or lower plane depending on the features of the object and by using kernel techniques, it can convert nonlinear to linear before partitioning [
21].
3.4.2. Random Forest (RF)
RF is a supervised learning algorithm that was developed by Leo Breiman in 2001 [
24]. RF is a form of ML method based on aggregating a large number of decision trees used for regression and classification. In general, the more trees in the forest the more robust the prediction.
The RF has evolved into a standard tool for data analysis, so it is an effective tool for prediction [
25]. Each decision tree regression predicts a number as an output for a given data. RF regression takes the average of those predictions as its ‘final’ output.
3.4.3. K-Nearest Neighbors (KNN)
KNN method was first described in the early 1950s. KNN is a supervised ML algorithm that can be used to solve problems such as classification and regression. KNN is purely lazy, retaining the entire training set and deferring all inductive generalization attempts before regression time [
26].
3.4.4. Artificial Neural Network (ANN)
McCulloch’s study into the simulation of a biological nervous system culminated in developing the ANN method in the 1940s. NN is a set of interconnected units whose properties are determined by the network’s topology and the neurons’ properties. NNs are now one of the most commonly adopted and efficient learning systems. ANNs learn, train, and change themselves in the same manner as humans do with their brains [
27].
3.4.5. Linear Regression (LR)
Regression methods are used to describe the relationship between a response variable and explanatory variables. LR is one of the most simple ML algorithms that come under the supervised learning technique and is used for solving regression problems [
28].
LR is used for predicting the continuous dependent variable with the help of independent variables. If one independent variable is used for prediction, it is called simple LR, and if there are over two independent variables, then it is called multiple LR [
29].
4. The Web-Based Prediction System
The main goal of developing a prediction system for students’ academic performance is to allow decision makers and academic advisors to predict a student’s total score easily and quickly. After training the model using different algorithms, namely SVM, RF, KNN, ANN, and LR. The RF algorithm gave the lowest MAPE percentage and it is chosen as the base algorithm used in the web page’s prediction system.
The system allows the user to enter the student’s scores and his/her demographic data and then predict the student’s total score by the prediction model. After that, a report with all information about students (i.e., general and demographic information, expected total score, and the expected grade) are displayed in a table. Further, this report can be printed.
At the start of the system flow, there must be conditions for calling the two prediction models and handling the missing values errors.
Figure 4 presents the prediction system flowchart. The system operates under the following conditions:
If the values of the mid activities and lab scores are null, then the first prediction model is called, which is based on the midterm exam score only from academic data. Then it is transferred to the report template.
If the value of the mid activities score is null and the value of the lab score is not null, the user is warned that they must be entered together.
If the value of the mid activities score is not null and the value of the lab is null, the user is warned that they must be entered together.
If all the data are entered, then the second prediction model is called based on all three academic data. Then it is transferred to the report template.
The report template is straightforward; it prints the submitted student’s information with the prediction result in a table.
4.1. Interfaces
The interfaces consist of two web pages depend on each other as follow:
Home interface: this interface is created to enter the academic and demographic data of students.
Report interface: this interface is created to display and print the general, academic, and demographic information about students resulted from running the prediction model.
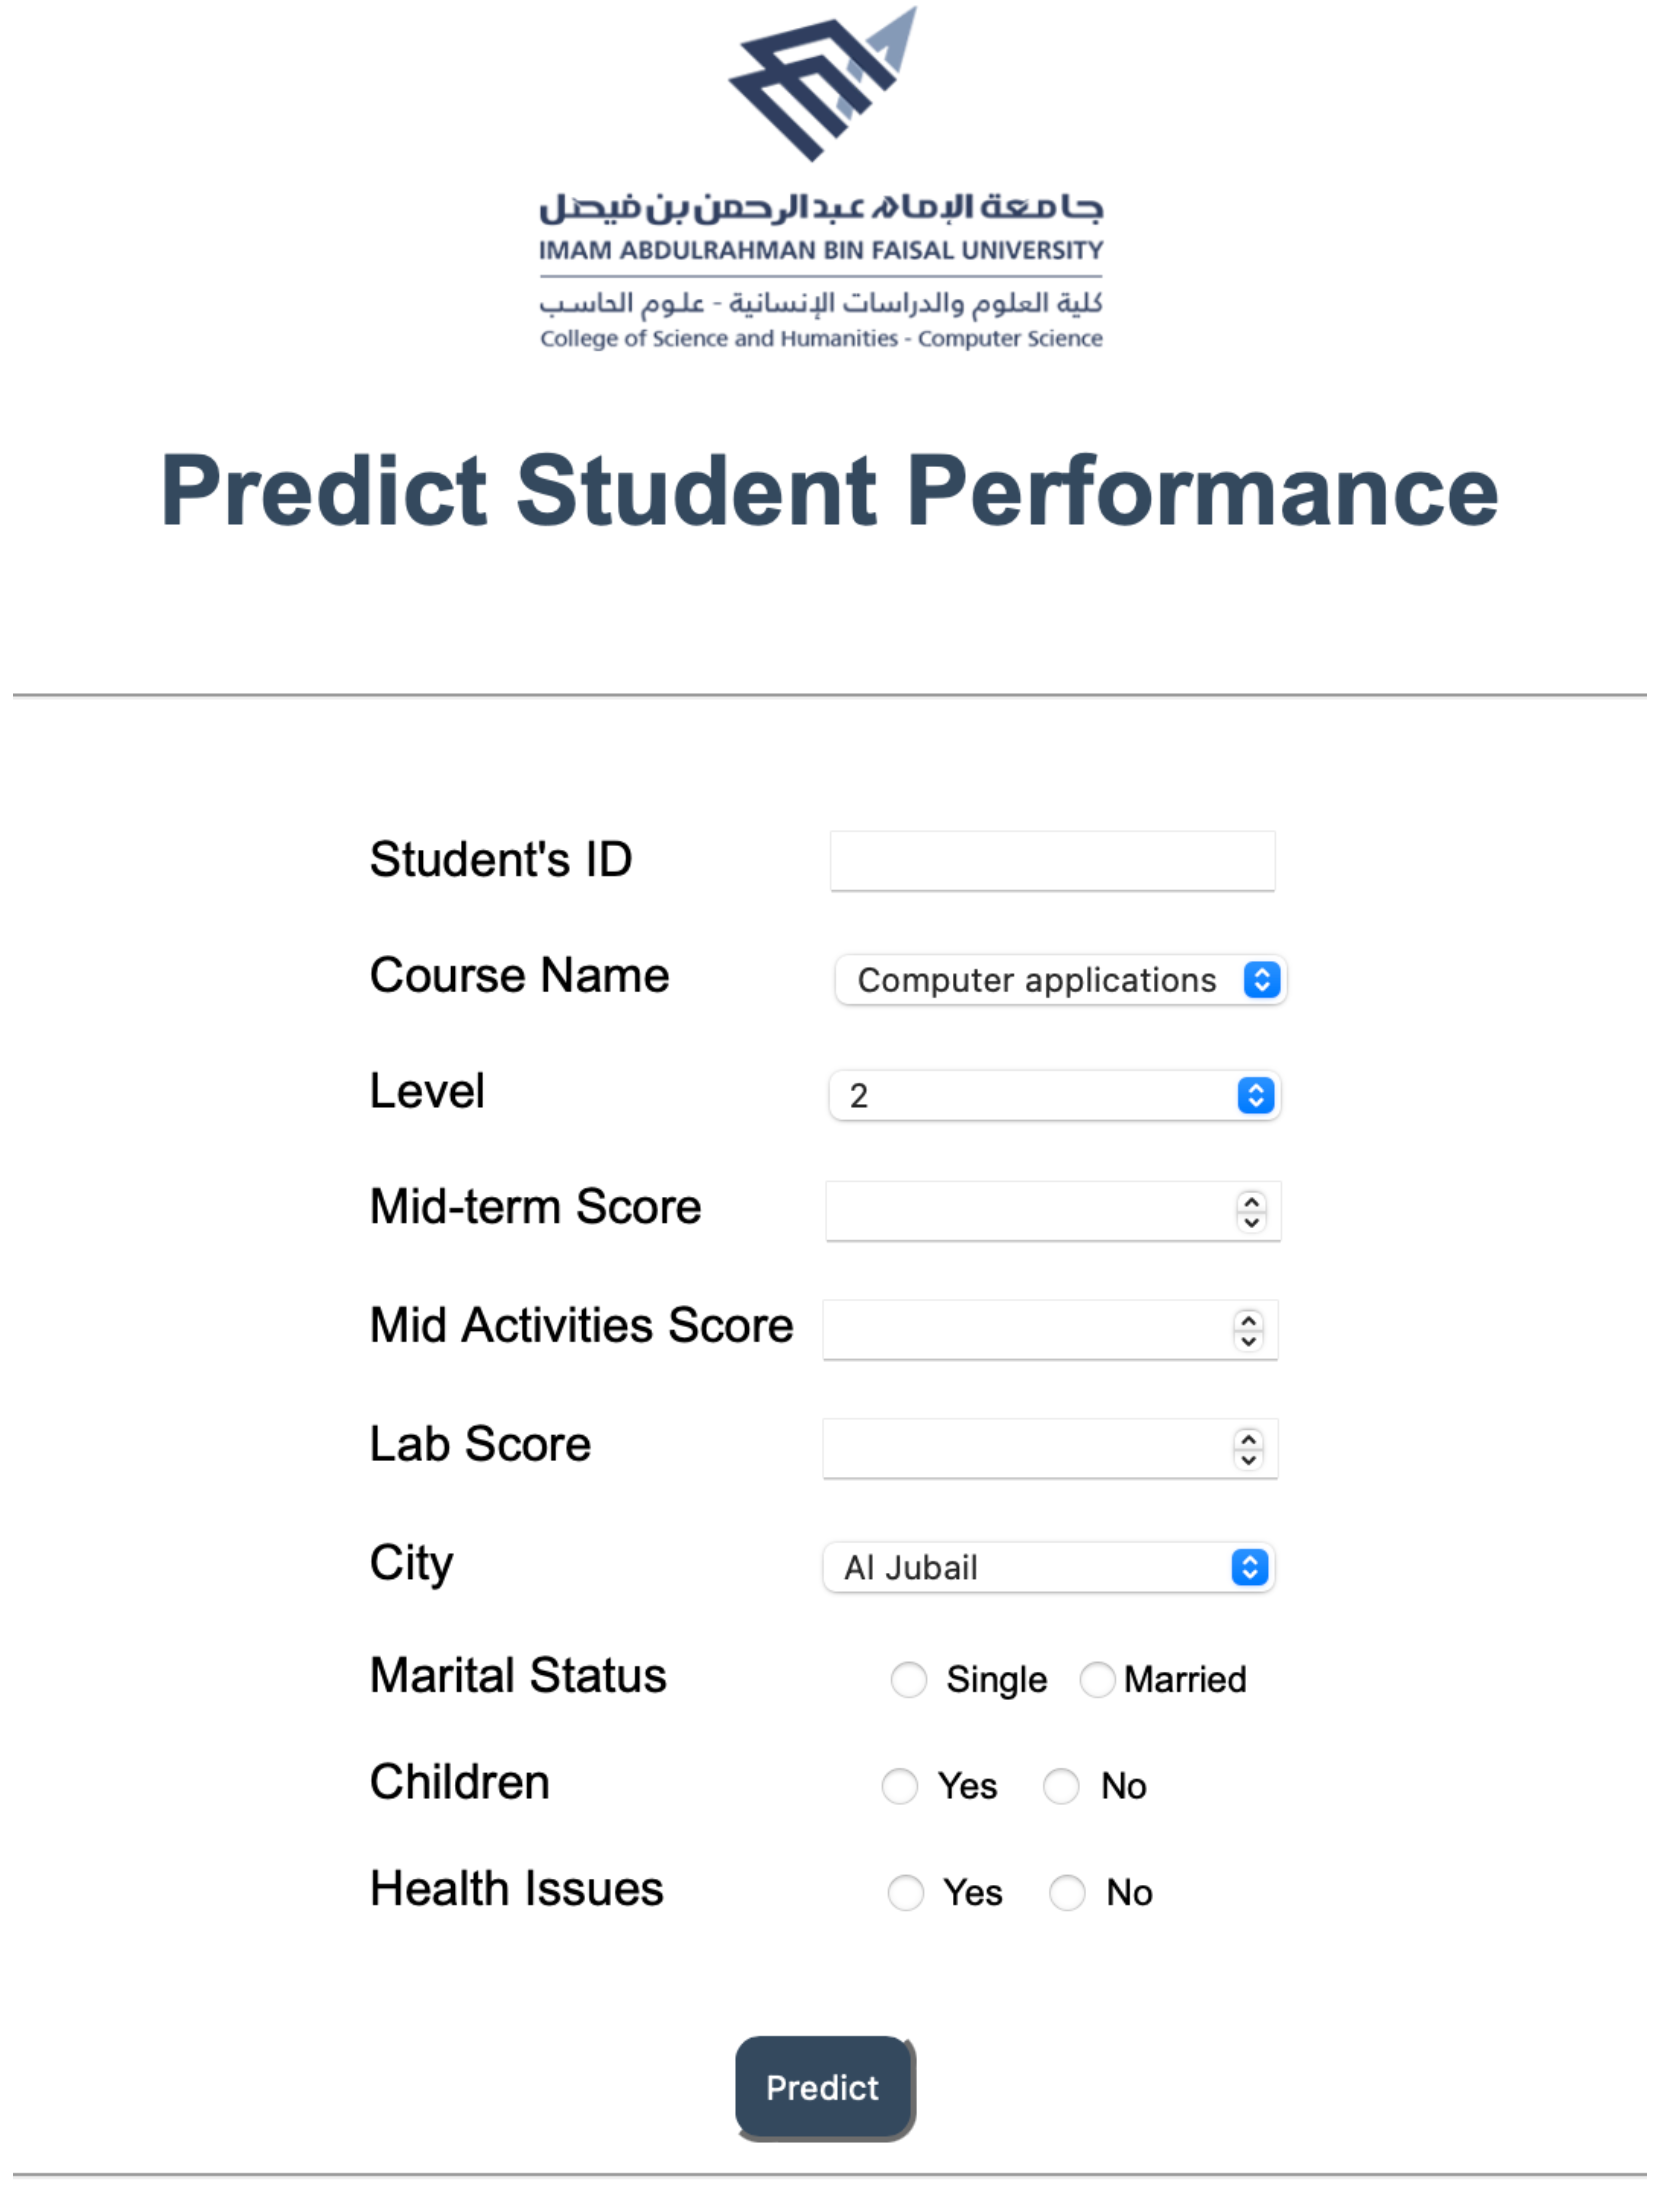
4.1.1. Home Interface
The student data is entered into the home interface as shown in
Figure 5. The required is to enter the student’s ID number to print it in the report, choose the course name, choose the academic level, enter the midterm score, enter the mid activities & lab scores (If available). In addition, it requires demographic data, which is the city where the student lives, the marital status of student (i.e., single or married), has children or not, and has health issues or not. After filling in the data, a button named “Predict” is clicked to perform the prediction model and generate the prediction results.
4.1.2. Report Interface
After getting the prediction results about the student through the home interface, the report interface shown in
Figure 6 displays a report in the form of a table containing the student’s information and the prediction results. The prediction results display an expected total score and the expected grade that depends on the total. Once it clicked on the “Print” button, the report page will be prepared for printing.
4.2. Web Server
To deploy the web pages to the public, the PythonAnywhere web hosting service was used. PythonAnywhere is a host for websites and an online Integrated Development Environment (IDE) built on the Python programming language. WSGI-based web, e.g., Flask can be hosting by the PythonAnywhere. Here is the link to the prediction system hosting by PythonAnywhere:
PredictGrade.pythonanywhere.com (accessed 12 November 2021).
5. Experimental Settings
ML models were developed using five algorithms, namely SVM, RF, KNN, ANN, and LR. In the experiments, we follow the recommended value settings of hyperparameters for algorithms as presented in
Table 4. Adjusting the hyperparameters of each algorithm is out of the scope.
5.1. Performance Metrics
The following performance metrics were used to determine whether the model is accurate or not.
5.2. Mean Absolute Error (MAE)
Mean Absolute Error (MAE) is one of the most common performance metrics. It is used to calculate the prediction error of the model. The MAE measures the average magnitude of the errors in a set of predictions.
MAE is given by the following Equation (
1):
where
represents the actual value,
represents the predicted value of
, and
N represents the number of instances.
5.3. Mean Absolute Percentage Error (MAPE)
The MAPE is calculated as follow.
where
represents the value of MAE and
represents the actual value.
6. Results
6.1. The Impact of Using Different Features on the Performance of the Regressions Models
The fourth objective of this research is to know the best features that affect students’ academic performance, through which it is possible to predict the total score of students early, and take necessary measures when failures are discovered. Hence, two scenarios in which to investigate the effect of the features set on model performance were set. The first scenario when using the first dataset (DS1), which contains only 8 features, the midterm exam score and all demographic features (i.e., course, level, mid_term, marital_status, children, health situation, living place, and class which is the total score for students).
The second scenario when using the second dataset (DS2), which contains all the academic and demographic features (i.e., course, level, mid_term, mid_activities, lab, marital_status, children, health situation, living place, and class which is the total score for students).
6.1.1. Scenario 1: Midterm Exam Score Only and All Demographic Features
In the first scenario, predict the total score by only one of the academic features, which is the midterm exam score and all demographic features.
Table 5 shows the results of the regression models in terms of prediction’s MAPE and MAE. The RF algorithm had the lowest MAPE of 9.21% with MAE of 6.38, followed by the LR with an MAPE of 10.34% with MAE of 7.31. SVM has a nuance different from that of the LR regression by the MAPE of 10.40% with MAE of 7.30. The highest MAPE was obtained from the ANN, with 13.65%, and MAE of 10.02.
6.1.2. Scenario 2: All Academic and Demographic Features
The second scenario predicts the total score by using three academic features: midterm exam, mid_activities, and lab scores, and all demographic features.
Table 6 shows the results of the regression models in terms of prediction’s MAPE and the MAE. The LR had the lowest MAPE of 6.34% with 4.33 MAE. SVM has a nuance different from the LR had 6.40% of MAPE and 4.35 of MAE, followed by the RF model which had 7.05% of MAPE and 4.80 of MAE. The ANN model had the highest MAPE with 13.06%, and it also had the highest MAPE in the first scenario. The MAPE of all regression models is slightly lower than the MAPE of the first scenario.
6.2. Discussion
Two scenarios were conducted to find out the effect of a set of features on the performance of the regressions models. It can be noticed from
Table 5 and
Table 6 that the performance of the regression models that are using the DS2 achieve lower MAPE scores. The reason for this is the increase in the number of important features used for prediction.
Using DS1, the RF algorithm yielded the lowest MAPE with 9.21%. In addition, the MAPE of SVM and LR are close to RF. On the other hand, when using DS2, LR achieved the lowest MAPE with 6.34%, and the SVM also had a good MAPE with 6.40% that very close to the LR followed by RF with a MAPE of 7.05%. After including more features, the LR MAPE outperformed the RF. It can be noticed that the ANN in both scenarios had the highest MAPE. The reason behind this is the dataset size, ANN is more efficient in large datasets.
The results showed that the RF algorithm yielded the lowest MAPE of 6.34%, using academic and demographic factors to predict students’ academic performance. This result is compatible with results in [
4,
6,
7,
30], which RF gave highest accuracy among other algorithms. The accuracy percentages of RF in [
4,
6,
7,
30] were 91%, 93%, 90% and 88.3%, respectively.
6.3. Features Importance
The dataset may contain many features, but some may not affect students’ academic performance. Hence, it is recommended to know the most important features. The purpose of this is to identify the features that have a significant impact on students’ academic performance and through which it is possible to discover whether the student will fail. After training the prediction model, the RF calculated features importance by ranking the features importance. Features ranking aims to sort the features regarding the index’s quality that reflects the individual relevance of a feature [
31]. Ranking techniques was used to rank features, and it assigned rank value to each feature according to their influence.
Table 7 shows the feature ranking for the DS1 that contains the midterm exam score only from academic data and all demographic features.
It can be observed that the mid_term score had the highest impact on the prediction process, followed by the course feature. The children, marital_status, and health had little effect on students’ academic performance. The reason is that most of the students in the dataset are single, have no children, and are in a good health.
Table 8 shows the feature ranking for the DS2 that contains the midterm exam, mid-activities, and lab scores from academic data and all demographic features.
It can be observed that the mid_term score had the highest impact on students’ academic performance, followed by lab score. In the study [
11], their results showed that the mid_term score had the highest impact on students’ performance as our results achieved. However, for the other academic features such as mid_activities and lab, they have a low impact on students’ academic performance. All demographic features had a small impact. In contrast with the DS1, in which the city feature affected students’ academic performance, while the rest of the features had a small impact as well.
6.4. Discussion
After ranking the important features that had a great impact on the academic performance of students, it was found that the academic factor had a higher impact on students’ academic performance, as in [
5,
14], while demographic factors had less influence. This is consistent with the results of studies [
9,
12,
19]. Moreover, the results revealed that the midterm test score factor is the most influential factor on the students’ academic performance. This was consistent with the studies [
11,
14,
17].
However, some results showed that using the academic, social, and demographic factors to predict the students’ academic performance confirmed that social factors of which include the fathers’ education and fathers’ job had a greater impact on the students’ academic performance compared to the academic factors [
11].
In addition, our results revealed that the other factors such as marital status and health situation had the lowest impact on student’s performance, in contrast with [
14,
32]. In our model, a new feature in the demographic factors was included, which is the living place (city) to investigate if the distance between college and city of residence does affect the academic performance of students or not. The impact of the city feature has not been studied in previous researches. Our results revealed that the influence of including this feature on students’ academic performance was little, similar to other demographic features.
6.5. The Web-Based Prediction System
6.5.1. Scenario 1: Entering One Academic Feature and Demographic Features
In this scenario, decision makers or academic advisors want to predict the student’s total score through entering only one of the academic data, which had the highest importance feature among all academic features, that is the midterm exam score as shown in
Figure 7. After that, the prediction model, which uses the RF algorithm that trained on the DS1 will be called. Hence, the results are generated and displayed on the interface as a report as shown in
Figure 8.
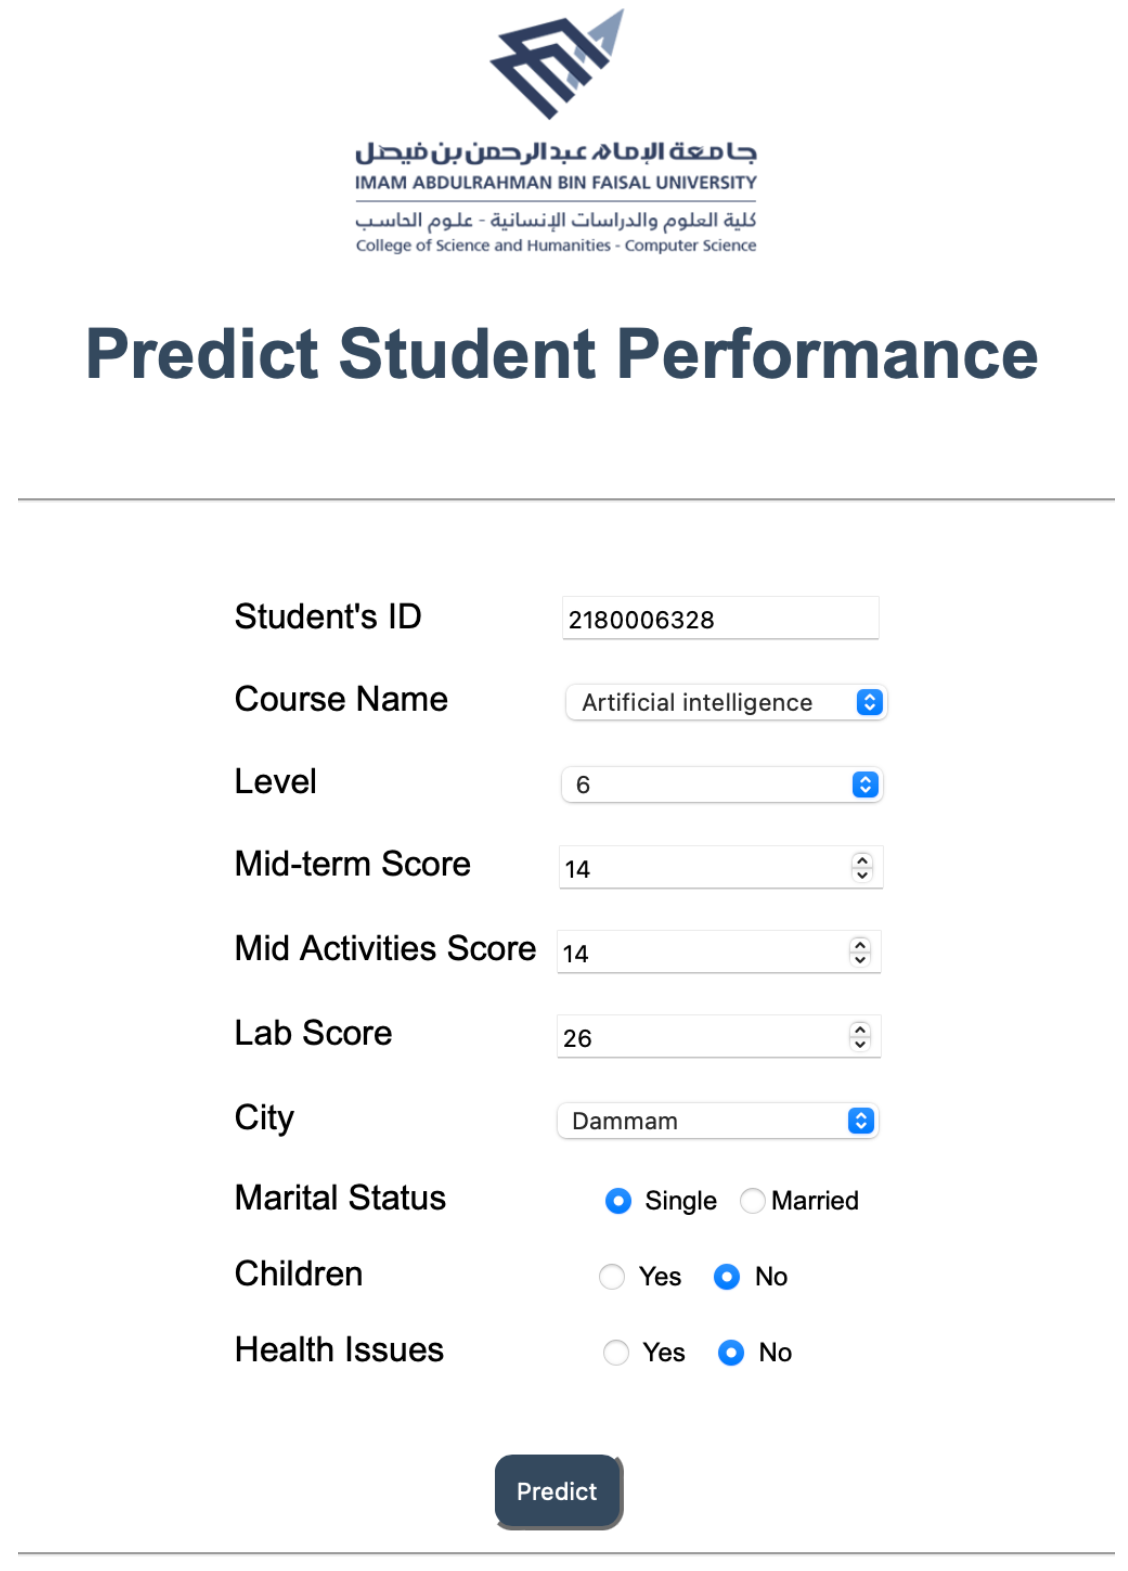
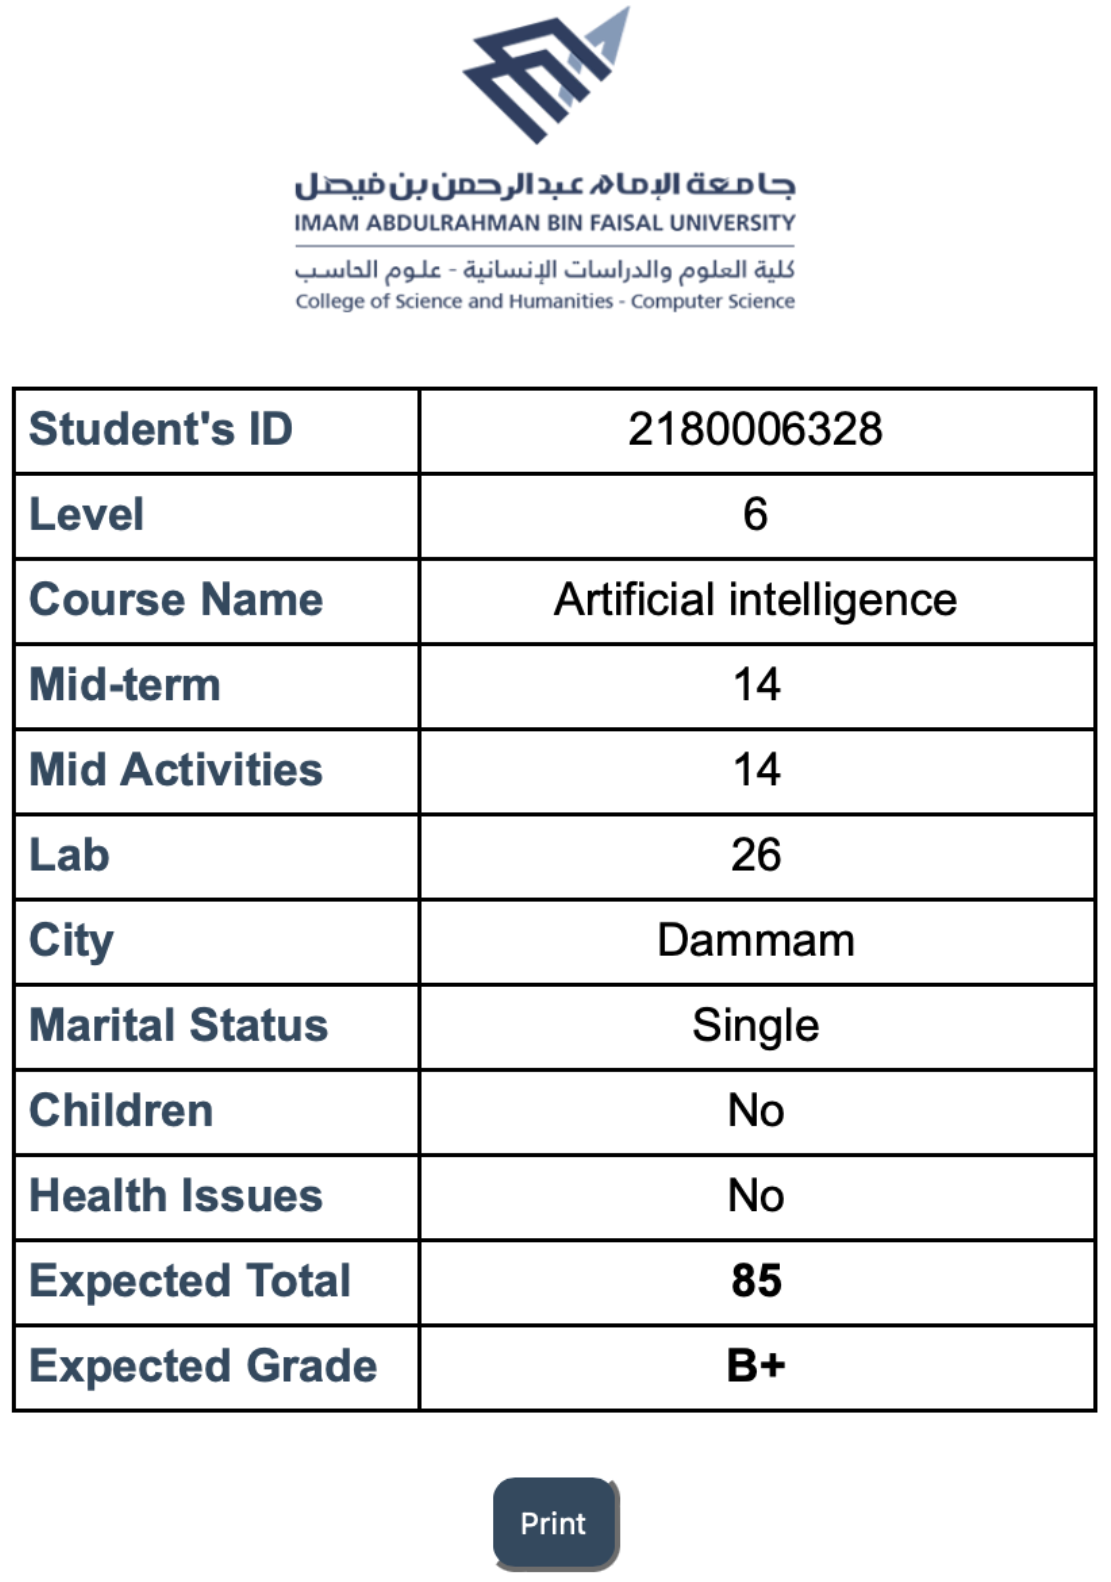
6.5.2. Scenario 2: Entering All Academic Features and Demographic Features
In this scenario, decision makers and academic advisors want to predict the student’s total score through entering all academic data which are midterm, mid-activities, and lab scores as shown in
Figure 9. After that, the prediction model, which uses the RF algorithm that trained on the DS2 will be called. Hence, the results are generated and displayed on the interface as a report as shown in
Figure 10.
This scenario is also an early prediction, but the first scenario is considered as an early prediction more than the second one because only the midterm exam score is taken among other academic features.
7. Conclusions
This paper aims to develop an ML model to predict the students’ academic performance at the early stages based on the course level. The students’ data were collected from the CS department at the College of Sciences and Humanities at IAU containing academic and demographic factors. Several algorithms (i.e., SVM, RF, KNN, ANN, and LR) were applied to predict students’ total score. The RF algorithm obtained the lowest MAPE and then it was adopted in the web-based prediction system. Academic factors had a higher impact on students’ academic performance. Other features such as marital_status, children, health, and living place had little effect on students’ academic performance.
The model can be used as an early warning mechanism to identify and improve the performance of at risk students. With the help of ML methods, tutors are in a position to know which of their students will complete a course with the lowest error rate. In addition, creating a web page helps tutors to enter data easily, and print a report with academic students’ performance. Moreover, this paper contributed to considering a new factor that has not been studied in previous studies, which is living place (city).
In future work, the system can be developed to add more features such as the academic history of the students, the effect of the English language on the students’ academic performance, and frequent absence. As our data includes female students only and it has good MAPE values, it would be interesting to test the model on male students’ data as well.
Author Contributions
Conceptualization, D.A.; Data curation, D.A. and M.A.; Formal analysis, D.A., R.A. (Rawan Alsubaie), R.A. (Raneem Alghamdi), L.A. and R.A. (Renad Alharthi); Methodology, D.A., R.A. (Rawan Alsubaie), R.A. (Raneem Alghamdi), L.A. and R.A. (Renad Alharthi); Project administration, D.A. and R.A. (Rawan Alsubaie); Resources, R.A. (Rawan Alsubaie), R.A. (Raneem Alghamdi), L.A. and R.A. (Renad Alharthi); Software, M.A., R.A. (Rawan Alsubaie), R.A. (Raneem Alghamdi), L.A. and R.A. (Renad Alharthi); Supervision, D.A. and M.A.; Validation, R.A. (Rawan Alsubaie), R.A. (Raneem Alghamdi), L.A. and R.A. (Renad Alharthi); Visualization, R.A. (Rawan Alsubaie), R.A. (Raneem Alghamdi), L.A. and R.A. (Renad Alharthi); Writing—original draft, R.A. (Rawan Alsubaie), R.A. (Raneem Alghamdi), L.A. and R.A. (Renad Alharthi); Writing—review & editing, D.A., M.A., R.A. (Rawan Alsubaie), R.A. (Raneem Alghamdi), L.A. and R.A. (Renad Alharthi). All authors have read and agreed to the published version of the manuscript.
Funding
This research received no external funding.
Institutional Review Board Statement
Not applicable.
Informed Consent Statement
Not applicable.
Data Availability Statement
Data available on request.
Conflicts of Interest
The authors declare no conflict of interest.
References
- Costa, E.B.; Fonseca, B.; Santana, M.A.; de Araújo, F.F.; Rego, J. Evaluating the effectiveness of educational data mining techniques for early prediction of students’ academic failure in introductory programming courses. Comput. Hum. Behav. 2017, 73, 247–256. [Google Scholar] [CrossRef]
- Liao, S.N.; Zingaro, D.; Thai, K.; Alvarado, C.; Griswold, W.G.; Porter, L. A robust machine learning technique to predict low-performing students. ACM Trans. Comput. Educ. (TOCE) 2019, 19, 1–19. [Google Scholar] [CrossRef]
- Hu, Y.H.; Lo, C.L.; Shih, S.P. Developing early warning systems to predict students’ online learning performance. Comput. Hum. Behav. 2014, 36, 469–478. [Google Scholar] [CrossRef]
- Jayaprakash, S.; Krishnan, S.; Jaiganesh, V. Predicting Students Academic Performance using an Improved Random Forest Classifier. In Proceedings of the 2020 International Conference on Emerging Smart Computing and Informatics (ESCI), Pune, India, 12–14 March 2020; pp. 238–243. [Google Scholar]
- Francis, B.K.; Babu, S.S. Predicting academic performance of students using a hybrid data mining approach. J. Med. Syst. 2019, 43, 162. [Google Scholar] [CrossRef] [PubMed]
- Hoffait, A.S.; Schyns, M. Early detection of university students with potential difficulties. Decis. Support Syst. 2017, 101, 1–11. [Google Scholar] [CrossRef]
- Solis, M.; Moreira, T.; Gonzalez, R.; Fernandez, T.; Hernandez, M. Perspectives to predict dropout in university students with machine learning. In Proceedings of the 2018 IEEE International Work Conference on Bioinspired Intelligence (IWOBI), San Carlos, Costa Rica, 18–20 July 2018; pp. 1–6. [Google Scholar]
- Romero, C.; López, M.I.; Luna, J.M.; Ventura, S. Predicting students’ final performance from participation in on-line discussion forums. Comput. Educ. 2013, 68, 458–472. [Google Scholar] [CrossRef]
- Bhutto, E.S.; Siddiqui, I.F.; Arain, Q.A.; Anwar, M. Predicting Students’ Academic Performance through Supervised Machine Learning. In Proceedings of the 2020 International Conference on Information Science and Communication Technology (ICISCT), Karachi, Pakistan, 8–9 February 2020; pp. 1–6. [Google Scholar]
- Buldu, A.; Üçgün, K. Data mining application on students’ data. Procedia-Soc. Behav. Sci. 2010, 2, 5251–5259. [Google Scholar] [CrossRef] [Green Version]
- Meier, Y.; Xu, J.; Atan, O.; Van der Schaar, M. Predicting grades. IEEE Trans. Signal Process. 2015, 64, 959–972. [Google Scholar] [CrossRef] [Green Version]
- Dharmasaroja, P.; Kingkaew, N. Application of artificial neural networks for prediction of learning performances. In Proceedings of the 2016 12th International Conference on Natural Computation, Fuzzy Systems and Knowledge Discovery (ICNC-FSKD), Changsha, China, 13–15 August 2016; pp. 745–751. [Google Scholar]
- Kumar, V.U.; Krishna, A.; Neelakanteswara, P.; Basha, C.Z. Advanced Prediction of Performance of a Student in an University using Machine Learning Techniques. In Proceedings of the 2020 International Conference on Electronics and Sustainable Communication Systems (ICESC), Coimbatore, India, 2–4 July 2020; pp. 121–126. [Google Scholar]
- Al-Shehri, H.; Al-Qarni, A.; Al-Saati, L.; Batoaq, A.; Badukhen, H.; Alrashed, S.; Alhiyafi, J.; Olatunji, S.O. Student performance prediction using support vector machine and k-nearest neighbor. In Proceedings of the 2017 IEEE 30th Canadian Conference on Electrical and Computer Engineering (CCECE), Windsor, ON, Canada, 30 April–3 May 2017; pp. 1–4. [Google Scholar]
- Al-Obeidat, F.; Tubaishat, A.; Dillon, A.; Shah, B. Analyzing students’ performance using multi-criteria classification. Clust. Comput. 2018, 21, 623–632. [Google Scholar] [CrossRef]
- Pereira, F.D.; Oliveira, E.H.; Fernandes, D.; Cristea, A. Early performance prediction for CS1 course students using a combination of machine learning and an evolutionary algorithm. In Proceedings of the 2019 IEEE 19th International Conference on Advanced Learning Technologies (ICALT), Maceio, Brazil, 15–18 July 2019; Volume 2161, pp. 183–184. [Google Scholar]
- Hasan, H.R.; Rabby, A.S.A.; Islam, M.T.; Hossain, S.A. Machine Learning Algorithm for Student’s Performance Prediction. In Proceedings of the 2019 10th International Conference on Computing, Communication and Networking Technologies (ICCCNT), Kanpur, India, 6–8 July 2019; pp. 1–7. [Google Scholar]
- Kotsiantis, S.B. Use of machine learning techniques for educational proposes: A decision support system for forecasting students’ grades. Artif. Intell. Rev. 2012, 37, 331–344. [Google Scholar] [CrossRef]
- Kotsiantis, S.B.; Pierrakeas, C.; Pintelas, P.E. Preventing student dropout in distance learning using machine learning techniques. In International Conference on Knowledge-Based and Intelligent Information and Engineering Systems; Springer: Berlin/Heidelberg, Germany, 2003; pp. 267–274. [Google Scholar]
- Bithari, T.B.; Thapa, S.; Hari, K. Predicting Academic Performance of Engineering Students Using Ensemble Method. Tech. J. 2020, 2, 89–98. [Google Scholar] [CrossRef]
- Adejo, O.W.; Connolly, T. Predicting student academic performance using multi-model heterogeneous ensemble approach. J. Appl. Res. High. Educ. 2018, 10, 61–75. [Google Scholar] [CrossRef]
- Jakkula, V. Tutorial on Support Vector Machine (svm); School of EECS, Washington State University: Washington, DC, USA, 2006; Volume 37. [Google Scholar]
- Jia, Y.S.; Jia, C.Y.; Qi, H.W. A new nu-support vector machine for training sets with duplicate samples. In Proceedings of the 2005 International Conference on Machine Learning and Cybernetics, Guangzhou, China, 18–21 August 2005; Volume 7, pp. 4370–4373. [Google Scholar]
- Breiman, L. Random forests. Mach. Learn. 2001, 45, 5–32. [Google Scholar] [CrossRef] [Green Version]
- Akar, Ö.; Güngör, O. Classification of multispectral images using Random Forest algorithm. J. Geod. Geoinf. 2012, 1, 105–112. [Google Scholar] [CrossRef] [Green Version]
- Han, J.; Pei, J.; Kamber, M. Data Mining: Concepts and Techniques, 3rd ed.; Morgan Kaufmann: Burlington, MA, USA, 2011. [Google Scholar]
- Russell, S.J.; Norvig, P. Artificial Intelligence: A Modern Approach, 3rd ed.; Pearson: London, UK, 2016. [Google Scholar]
- Seber, G.A.; Lee, A.J. Linear Regression Analysis; John Wiley & Sons: Hoboken, NJ, USA, 2012; Volume 329. [Google Scholar]
- Kavitha, S.; Varuna, S.; Ramya, R. A comparative analysis on linear regression and support vector regression. In Proceedings of the 2016 Online International Conference on Green Engineering and Technologies (IC-GET), Coimbatore, India, 19 November 2016; pp. 1–5. [Google Scholar]
- Hasan, R.; Palaniappan, S.; Mahmood, S.; Abbas, A.; Sarker, K.U.; Sattar, M.U. Predicting student performance in higher educational institutions using video learning analytics and data mining techniques. Appl. Sci. 2020, 10, 3894. [Google Scholar] [CrossRef]
- Wojtas, M.; Chen, K. Feature Importance Ranking for Deep Learning. arXiv 2020, arXiv:2010.08973. [Google Scholar]
- Waheed, H.; Hassan, S.U.; Aljohani, N.R.; Hardman, J.; Alelyani, S.; Nawaz, R. Predicting academic performance of students from VLE big data using deep learning models. Comput. Hum. Behav. 2020, 104, 106189. [Google Scholar] [CrossRef] [Green Version]
| Publisher’s Note: MDPI stays neutral with regard to jurisdictional claims in published maps and institutional affiliations. |
© 2022 by the authors. Licensee MDPI, Basel, Switzerland. This article is an open access article distributed under the terms and conditions of the Creative Commons Attribution (CC BY) license (https://creativecommons.org/licenses/by/4.0/).


 ,
, 


