
Seismic Envelopes of Coda Decay for Q-coda Attenuation Studies of the Gargano Promontory (Southern Italy) and Surrounding Regions


Abstract
:1. Summary
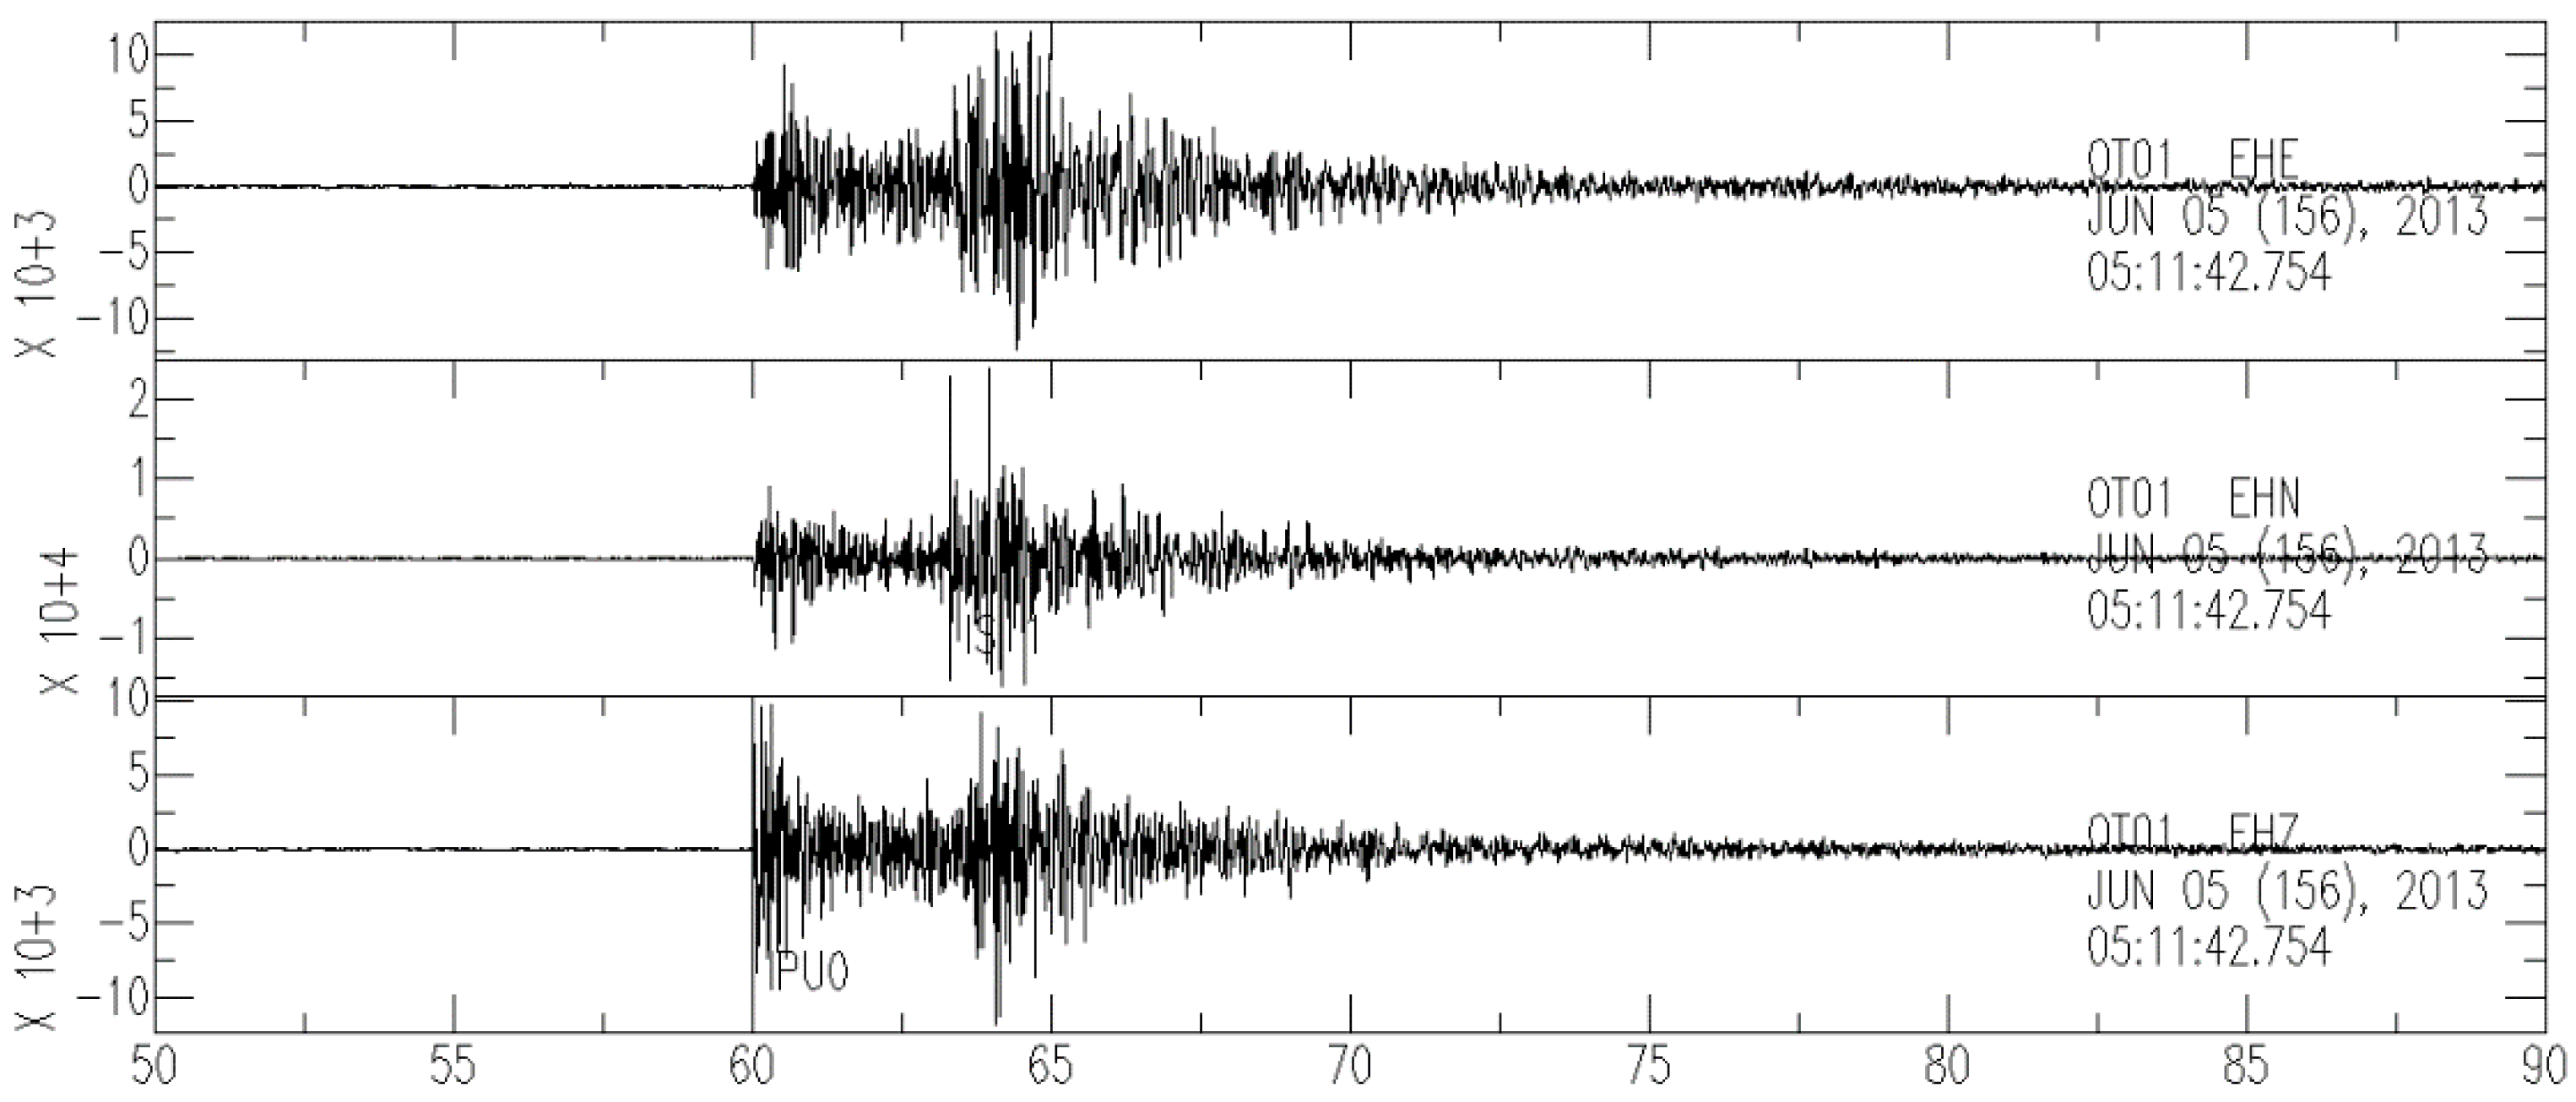
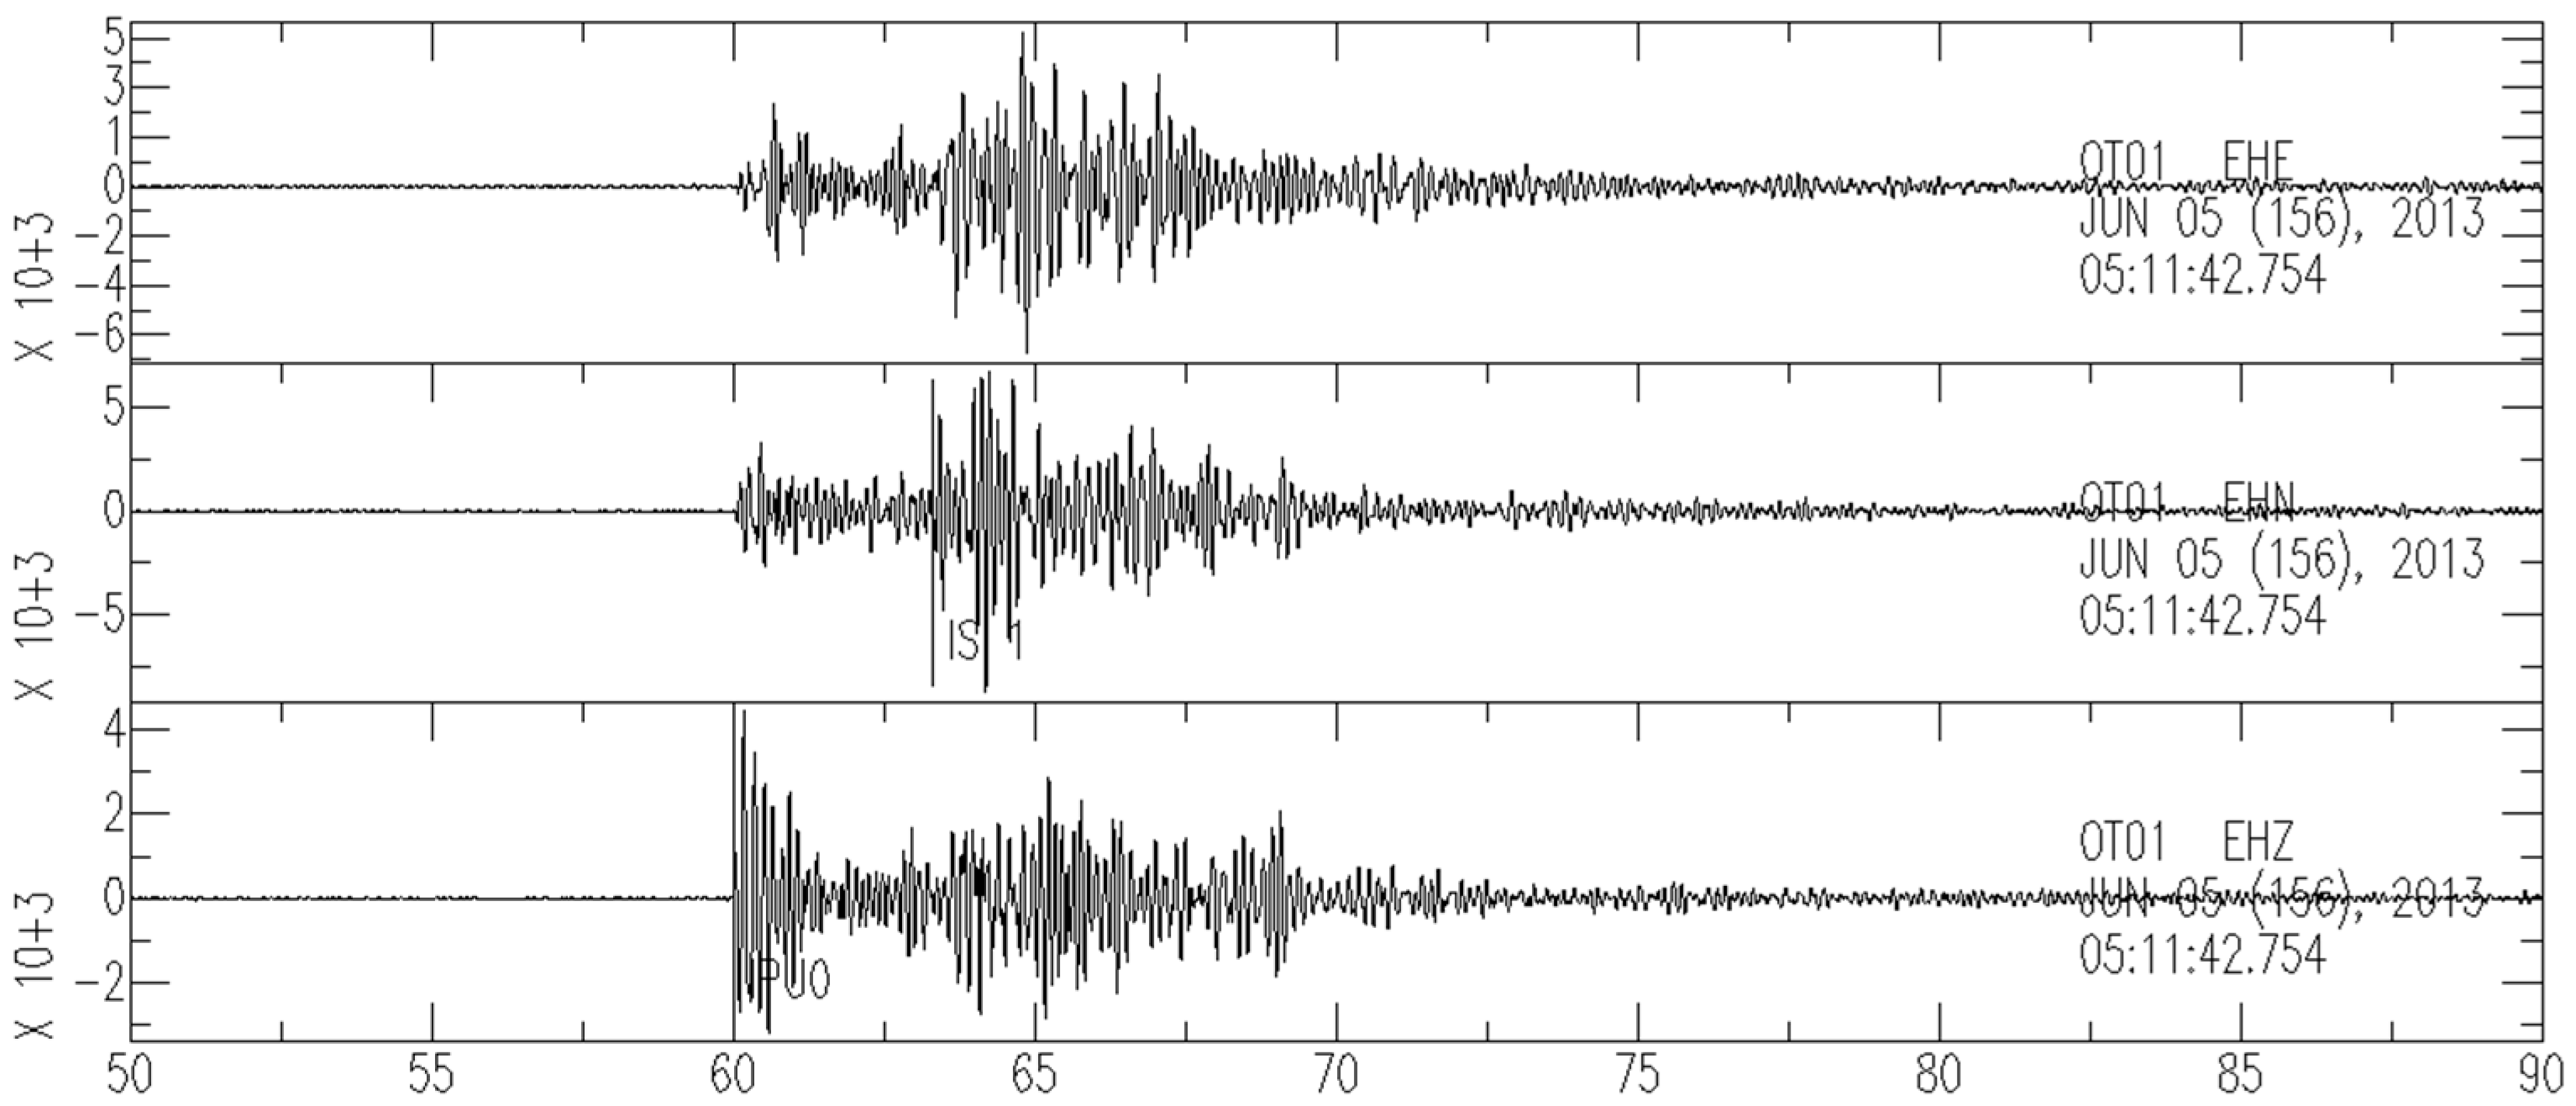
2. Data Description
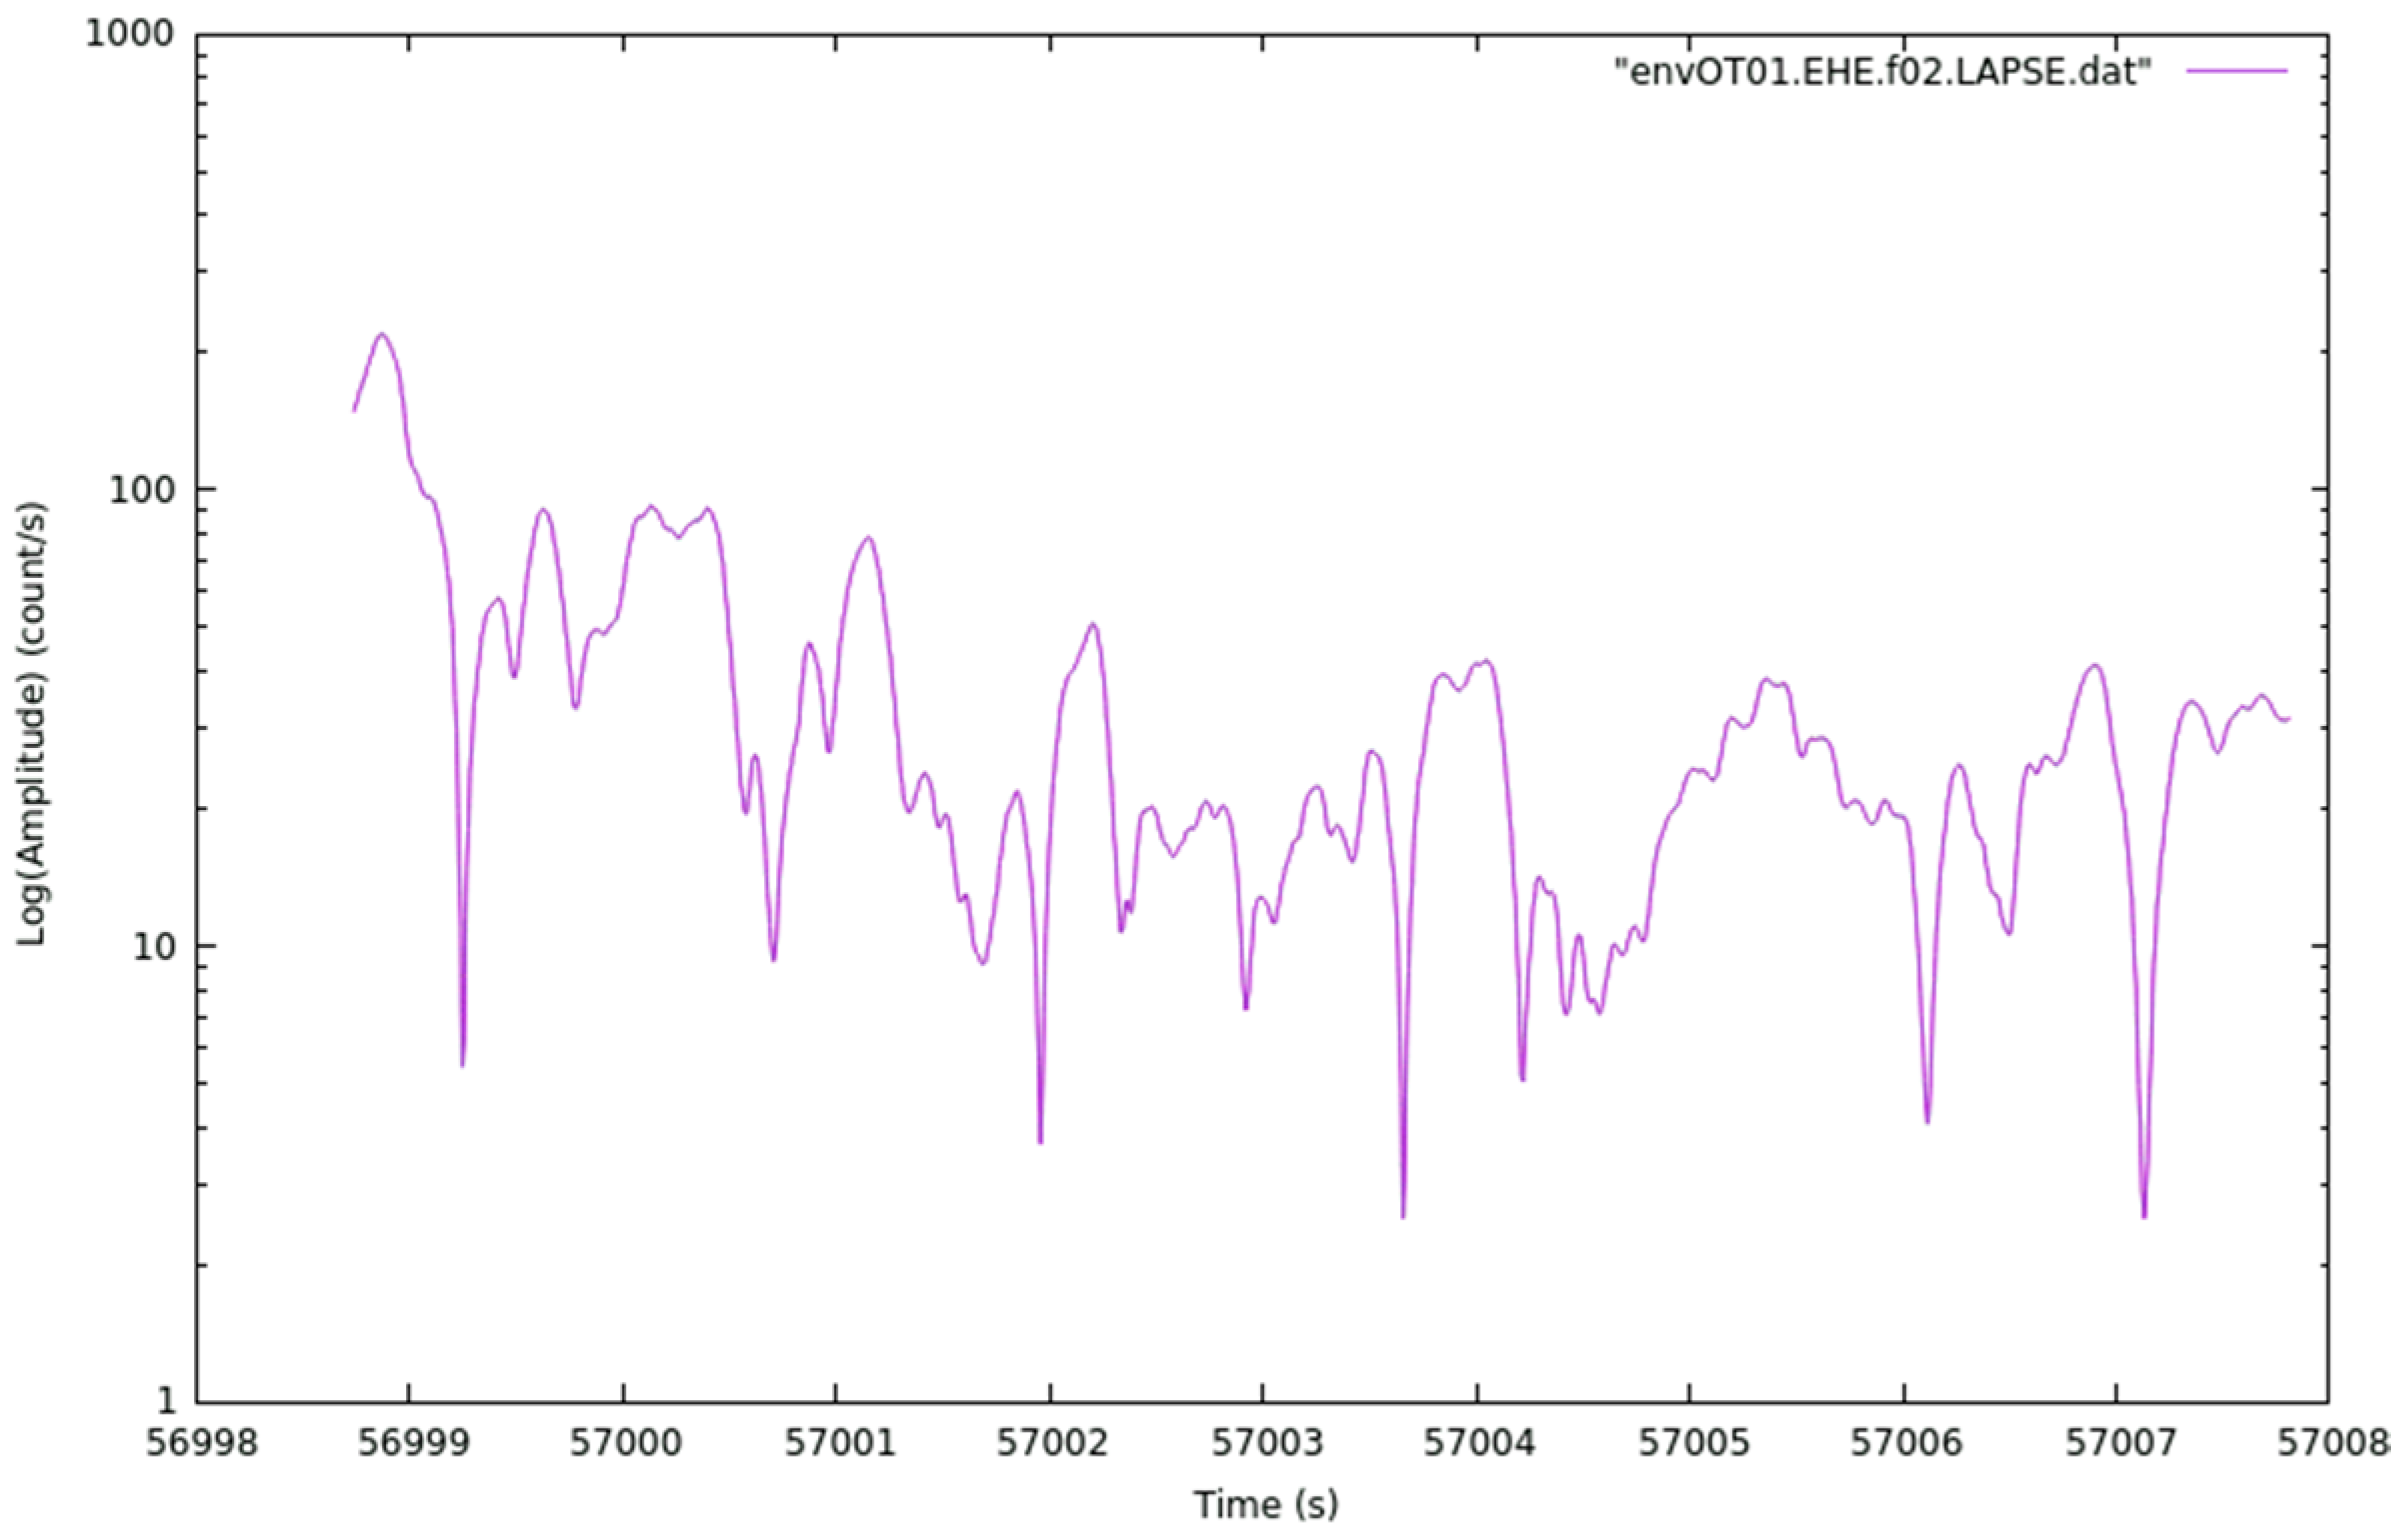
2.1. First Envelope Dataset
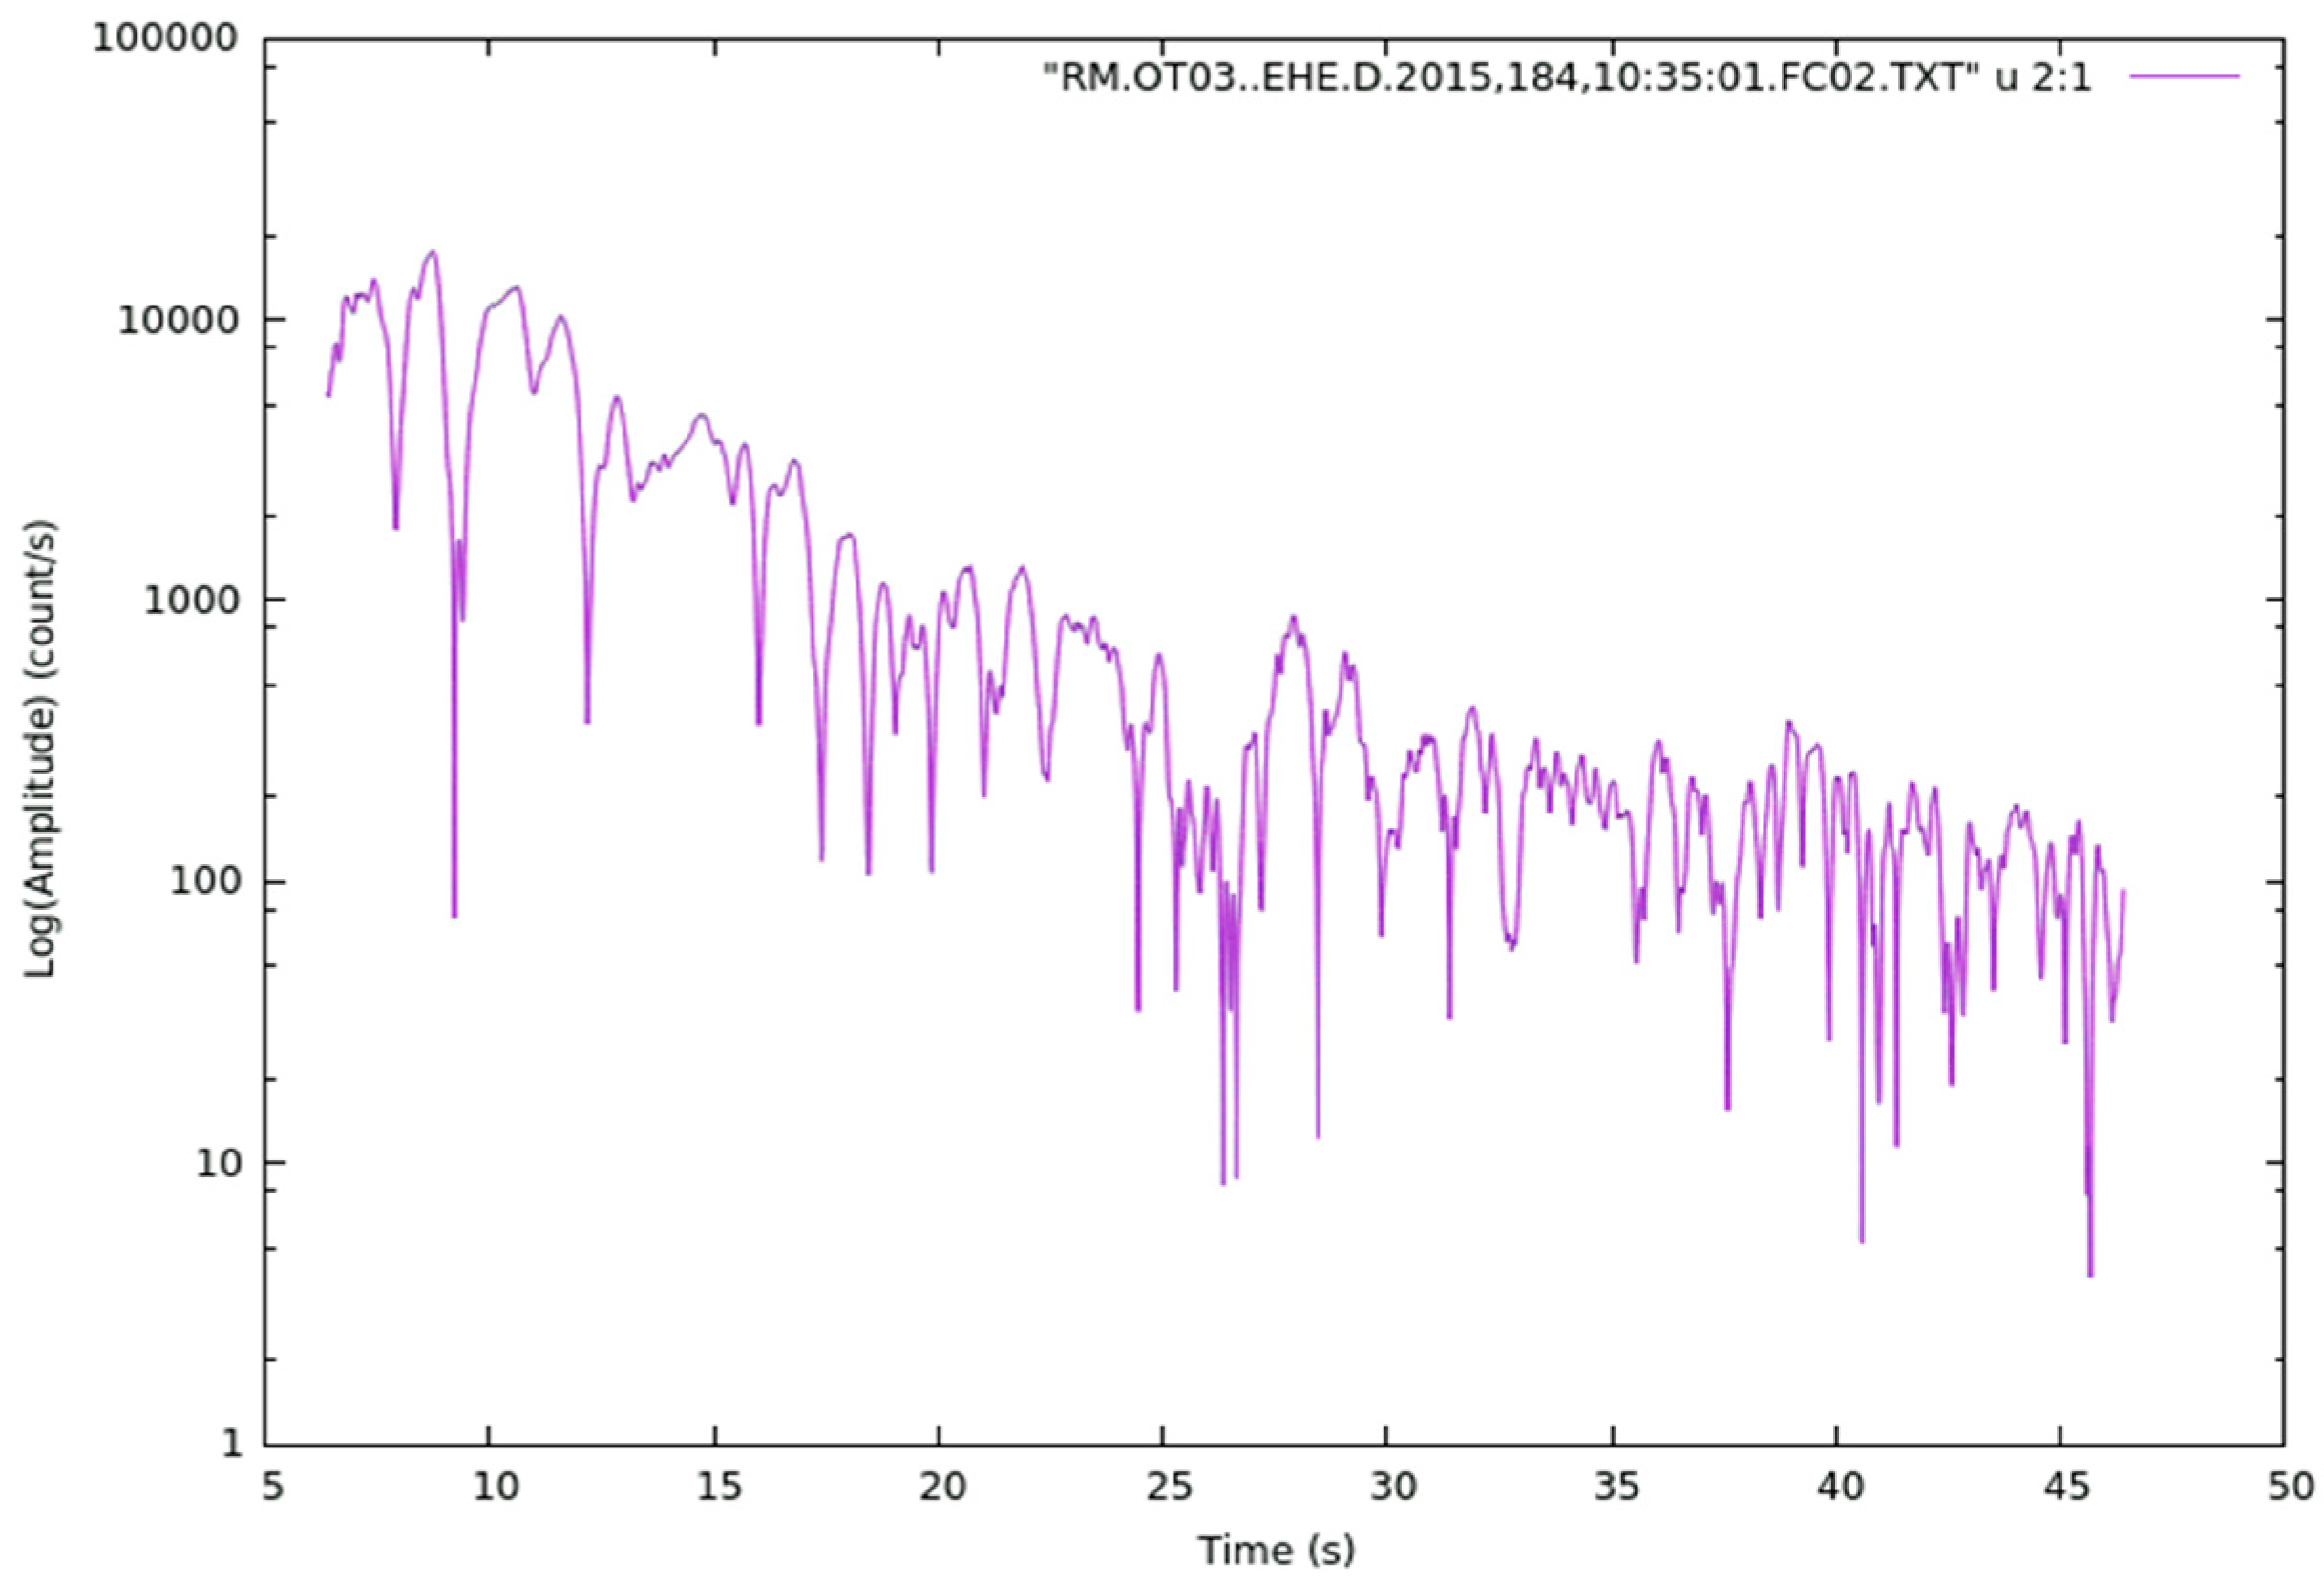
2.2. Second Envelope Dataset
3. Methods
Author Contributions
Funding
Institutional Review Board Statement
Informed Consent Statement
Data Availability Statement
Acknowledgments
Conflicts of Interest
References
- Filippucci, M.; Lucente, S.; de Lorenzo, S.; Del Pezzo, E.; Tallarico, A. Energy Envelope Data for Seismic Attenuation Study of the Gargano Promontory (Southern Italy) and Surrounding Regions. Mendeley Data 2021, 1. [Google Scholar] [CrossRef]
- Filippucci, M.; Miccolis, S.; Castagnozzi, A.; Cecere, G.; de Lorenzo, S.; Donvito, G.; Falco, L.; Michele, M.; Nicotri, S.; Romeo, A.; et al. Seismicity of the Gargano Promontory (Southern Italy) after 7 Years of Local Seismic Network Operation: Data Release of Waveforms from 2013 to 2018. Data Brief 2021, 35, 106783. [Google Scholar] [CrossRef] [PubMed]
- de Lorenzo, S.; Michele, M.; Emolo, A.; Tallarico, A. A 1D P-Wave Velocity Model of the Gargano Promontory (South-Eastern Italy). J. Seismol. 2017, 21, 909–919. [Google Scholar] [CrossRef]
- Aki, K.; Chouet, B. Origin of Coda Waves: Source, Attenuation, and Scattering Effects. J. Geophys. Res. (1896–1977) 1975, 80, 3322–3342. [Google Scholar] [CrossRef]
- Bianco, F.; Pezzo, E.D.; Malagnini, L.; Luccio, F.D.; Akinci, A. Separation of Depth-Dependent Intrinsic and Scattering Seismic Attenuation in the Northeastern Sector of the Italian Peninsula. Geophys. J. Int. 2005, 161, 130–142. [Google Scholar] [CrossRef] [Green Version]
- Filippucci, M.; Del Pezzo, E.; de Lorenzo, S.; Tallarico, A. 2D Kernel-Based Imaging of Coda-Q Space Variations in the Gargano Promontory (Southern Italy). Phys. Earth Planet. Int. 2019, 297, 106313. [Google Scholar] [CrossRef]
- Filippucci, M.; Pierri, P.; de Lorenzo, S.; Tallarico, A. The Stress Field in the Northern Apulia (Southern Italy), as Deduced from Microearthquake Focal Mechanisms: New Insight from Local Seismic Monitoring. In International Conference on Computational Science and Its Applications; Springer: Cham, Switzerland, 2020; pp. 914–927. [Google Scholar] [CrossRef]
- Filippucci, M.; Tallarico, A.; Dragoni, M.; de Lorenzo, S. Relationship Between Depth of Seismicity and Heat Flow: The Case of the Gargano Area (Italy). Pure Appl. Geophys. 2019, 176, 2383–2394. [Google Scholar] [CrossRef]
- Filippucci, M.; Lucente, S.; Del Pezzo, E.; de Lorenzo, S.; Prosser, G.; Tallarico, A. 3D-Kernel Based Imaging of an Improved Estimation of (Qc) in the Northern Apulia (Southern Italy). Appl. Sci. 2021, 11, 7512. [Google Scholar] [CrossRef]
- Miccolis, S.; Filippucci, M.; de Lorenzo, S.; Frepoli, A.; Pierri, P.; Tallarico, A. Seismogenic Structure Orientation and Stress Field of the Gargano Promontory (Southern Italy) From Microseismicity Analysis. Front. Earth Sci. 2021, 9, 179. [Google Scholar] [CrossRef]
- Goldstein, P.; Dodge, D.; Firpoand, M.; Lee Minner, S. Signal Processing and Analysis Tools for Seismologists and Engineers; Lee, W.H.K., Kanamori, H., Jennings, P.C., Kisslinger, C., Eds.; Academic Press: London, UK, 2003. [Google Scholar]
- IRIS: Data Services: Nodes: DMC: Software Downloads: SAC. Available online: http://ds.iris.edu/ds/nodes/dmc/software/downloads/sac/ (accessed on 22 May 2021).


| First Dataset | Event Folders |
|---|---|
| Seismic_Envelopes_2013 | 201306031549 |
| 201306050513 | |
| 201306061512 | |
| … |
| Event Folder | Envelope File |
|---|---|
| 201306031549 | envOT01.EHE.f02.LAPSE.dat |
| envOT01.EHE.f03.LAPSE.dat | |
| envOT01.EHE.f04.LAPSE.dat | |
| … |
| Envelope File | File Content | |
|---|---|---|
| envOT01.EHE.f02.LAPSE.dat | (Time s) | (Amplitude counts/s) |
| 56,998.7383 | 148.276596 | |
| 56,998.7422 | 151.102402 | |
| 56,998.7461 | 154.158295 | |
| … | … | |
| First Dataset | Event Folders |
|---|---|
| Seismic_Envelopes_2015_2018 | 201607031216 |
| 201507040338 | |
| 201507201850 | |
| … |
| Event Folder | Envelope File |
|---|---|
| 201607031216 | RM.OT03..EHE.D.2015,184,10:35:01.FC02.TXT |
| RM.OT03..EHE.D.2015,184,10:35:01.FC02.TXT | |
| RM.OT03..EHE.D.2015,184,10:35:01.FC02.TXT | |
| … |
| Envelope File | File Content | |
|---|---|---|
| RM.OT03..EHE.D.2015,184,10:35:01.FC02.TXT | (Amplitude counts/s) | (Time s) |
| 5549.86621 | 6.40 | |
| 5474.11377 | 6.41 | |
| 5359.18904 | 6.42 | |
| … | … | |
Publisher’s Note: MDPI stays neutral with regard to jurisdictional claims in published maps and institutional affiliations. |
© 2021 by the authors. Licensee MDPI, Basel, Switzerland. This article is an open access article distributed under the terms and conditions of the Creative Commons Attribution (CC BY) license (https://creativecommons.org/licenses/by/4.0/).
Share and Cite
Filippucci, M.; Lucente, S.; de Lorenzo, S.; Del Pezzo, E.; Prosser, G.; Tallarico, A. Seismic Envelopes of Coda Decay for Q-coda Attenuation Studies of the Gargano Promontory (Southern Italy) and Surrounding Regions. Data 2021, 6, 98. https://doi.org/10.3390/data6090098
Filippucci M, Lucente S, de Lorenzo S, Del Pezzo E, Prosser G, Tallarico A. Seismic Envelopes of Coda Decay for Q-coda Attenuation Studies of the Gargano Promontory (Southern Italy) and Surrounding Regions. Data. 2021; 6(9):98. https://doi.org/10.3390/data6090098
Chicago/Turabian StyleFilippucci, Marilena, Salvatore Lucente, Salvatore de Lorenzo, Edoardo Del Pezzo, Giacomo Prosser, and Andrea Tallarico. 2021. "Seismic Envelopes of Coda Decay for Q-coda Attenuation Studies of the Gargano Promontory (Southern Italy) and Surrounding Regions" Data 6, no. 9: 98. https://doi.org/10.3390/data6090098
APA StyleFilippucci, M., Lucente, S., de Lorenzo, S., Del Pezzo, E., Prosser, G., & Tallarico, A. (2021). Seismic Envelopes of Coda Decay for Q-coda Attenuation Studies of the Gargano Promontory (Southern Italy) and Surrounding Regions. Data, 6(9), 98. https://doi.org/10.3390/data6090098