1. Introduction
Multimorbidity, which refers to the presence of more than one chronic condition in a patient [
1], is a prominent problem in healthcare. It is more prevalent in elderly patients, and is associated with higher morbidity, mortality, and increased healthcare costs [
2]. Patients suffering from multiple chronic conditions are usually high-need and high-cost patients [
3]. According to a study in 2015, the prevalence of multimorbidity was above 75 percent among elderly patients, and the total cost related to multimorbidity was 5.5 times higher than for other patients [
4]. The higher the number of coexisting conditions a patient has, the more challenging it becomes to manage their care [
5,
6]. In 2012, approximately 38 million deaths worldwide were related to multiple chronic diseases; according to the World Health Organization, this number will increase to 52 million by 2030 [
7].
Thus, there is a rising demand for research that provides deeper insights into multimorbidity. Electronic medical records (EMRs) hold great promise to facilitate the understanding of problems related to multimorbidity and its underlying mechanisms [
8]. EMRs contain patient data such as prescriptions, demographics, diagnosis history, laboratory test results, discharge summaries, and surgical notes [
9]. EMR databases are systematized platforms that can help medical professionals to access accurate and complete information about patients. With the progression of information technology and the extensive use of computerized systems, EMRs are available nowadays for subsequent use for research purposes [
10,
11,
12,
13]. For instance, EMRs can potentially aid clinical researchers in detecting hidden patterns and trends, revealing missing events, identifying event sequences, establishing quality control, and reducing medical errors [
14,
15]. A number of recent studies have used EMRs to address multifaceted challenges of multimorbidity [
16,
17,
18].
Despite the advantages of EMRs, it is often challenging for medical professionals to keep pace with the large quantity of heterogeneous data stored in EMRs [
19]. These databases are usually complex and difficult to analyze and interpret. Automated data analysis methods based on statistics, data mining, and machine learning have the potential to fulfill the computational demands of EMRs [
20,
21]. Data analysis refers to the analysis of raw data to gain both deeper and novel insights into associations among the data elements [
22]. However, one of the challenges of using such analysis methods lies in their lack of interpretability and transparency, which limits their application in EMR-based systems [
12,
13]. In order to overcome this challenge, it is possible to make the analysis processes accessible to the user through interactive visualizations. A new set of computational tools, known as visual analytics systems (VASes), have the potential to help reduce the complexity of EMRs by combining automated analysis techniques with interactive visualizations [
23,
24,
25]. VASes can help with the analysis, interpretation, and making sense of EMR databases by improving the capabilities of the user to accomplish complex data-driven tasks [
26]. Even though VASes hold great promise for analyzing and making sense of EMR data from patients with multiple chronic diseases, up until now, there is a shortage of VASes for understanding multimorbidity.
The objective of this study is to demonstrate how VASes can be designed to offer deeper insights into multimorbidity by enabling exploratory analyses of EMR datasets and providing a rich set of descriptive statistics. We provide a foundation for, and implementation of, the design and use of VA systems in exploring the prevalence and patterns of multimorbidity in a given patient population. To this end, we present a novel web-based system that we have developed, called VISEMURE—VIsual analytics system for making SEnse of MUltimorbidity using electronic medical REcord. To illustrate the usefulness of VISEMURE, we use the Deliver Primary Healthcare Information project database, which is available through the Canadian Primary Care Sentinel Surveillance Network [
27].
The proposed system uses an interactive bar chart to display the prevalence of chronic diseases, as well as a dynamic correlation matrix to present the correlations among occurrences of those diseases. Disease prevalence and correlations may be estimated using count-based conditional probability, logistic regression, and decision tree models. VISEMURE can also create conditional prevalence and correlation estimates, based on any pre-existing conditions the patient may have, and on other patient characteristics such as gender, age, household income, and household education. This allows for the investigation of the impact of existing chronic disease and patient characteristics on the distribution of multimorbidity in a patient population. The visualization techniques in VISEMURE can be repurposed for other tasks in the area of healthcare where high-dimensional joint distributions of random variables are important to understand.
We envision VISEMURE being most useful for researchers who are familiar with EMR data and for multidisciplinary teams of data specialists and clinical specialists to investigate many different questions related to multimorbidity. Because multimorbidity is a complex phenomenon that is not easily captured by a small number of prespecified visualizations, we contend that a VAS is needed. The main purpose of VISEMURE is not to create plots for a static publication (although it could be used for this task) but rather to quickly and efficiently make sense of the multimorbidity patterns within a dataset and to generate hypotheses about how these patterns may generalize to other settings.
The rest of this paper is organized as follows:
Section 2 explains the methodology employed for VISEMURE.
Section 3 explains the design of the proposed system by describing its structure and components.
Section 4 presents the results using some case studies to illustrate the usefulness of the system.
Section 5 and
Section 6 include discussion, limitations, and some future areas of application. Finally,
Section 7 presents the conclusion of the paper.
2. Methods
This section describes the methodology we have employed to design the proposed VA system, namely VISEMURE. In
Section 2.1, we explain the data source. We then describe the preprocessing steps in
Section 2.2. Next, in
Section 2.3, we introduce the analytical and visual components of VISEMURE and briefly describe how these components are combined, which is discussed more extensively in
Section 3. Finally,
Section 2.4 outlines the implementation details of VISEMURE.
2.1. Data Source
VISEMURE is designed to be used with
structured EMR data, that is, data that are in a tabular format consisting of columns with well-defined entries for the variables of interest, including patient characteristics such as age and sex, and disease status. Many EMR data sources have this structure, but if a data source does not, applying case definitions [
27] and/or natural language processing [
28] to create patient characteristics or disease status variables may be required as a preprocessing step.
To demonstrate the use of VISEMURE, we use a subset of the Deliver Primary Healthcare Information (DELPHI) project database. It is one of the eleven regional networks included in the Canadian Primary Care Sentinel Surveillance Network [
29]. DELPHI established the first Canadian primary care database derived from EMR data, which coded symptoms and diagnoses for a subset of patient encounters using the International Classification of Primary Care.
For our illustrative example, we use a subset of the DELPHI database that includes a total of 13,697 patients who have at least one of 20 specified chronic diseases. Each patient is further characterized by three features: age, gender, and socioeconomic status (SES). Among a total of 7565 females and 6132 males in the dataset, 6303 patients have developed only one disease, 3183 patients have developed two chronic diseases, and 4211 patients have developed more than two chronic conditions. SES is categorized into five equal-sized quintiles. The first quintile represents the lowest-income group, whereas the fifth quintile refers to the highest-income group. The distribution of sociodemographic factors among 13,697 patients is shown in
Table 1. Small cell sizes have been suppressed. It is important to note that there are no patients in the first and second quintile for both female and male categories; hence, we would not be able to use these data to extrapolate conclusions to patients in these income quintiles.
Table 2 depicts the list of twenty chronic diseases ordered by patient counts according to the dataset, which was derived from the DELPHI database using the same methodology as Nicholson (2017) [
30]. As shown in
Table 2, ‘Hypertension’, ‘Hyperlipidemia’, and ‘Bronchitis’ are the most common diseases, whereas ‘Kidney Disease’, ‘Dementia’, and ‘Liver Disease’ are the least common diseases among all patients in the database.
We have chosen the ten most common chronic diseases based on our dataset to use for further exploratory analysis. They are as follows: ‘Hypertension’, ‘Hyperlipidemia’, ‘Bronchitis’, ‘Cardiovascular Disease’, ‘Musculoskeletal Problem’, ‘Diabetes’, ‘Depression’, ‘Arthritis’, ‘Cancer’, and ‘Thyroid Disease’. The main reason for this choice is that the dataset is not large enough to allow a good estimation of disease prevalence and correlations when prevalence is very low.
2.2. Preprocessing
This section describes the preprocessing steps to prepare the data for the statistical and machine learning techniques in VISEMURE.
2.2.1. Creating Dummy Variables
All chronic diseases, as well as gender, are already binary variables taking values either 0 or 1 in the dataset. Age is, however, a categorical variable with more than two categories and was converted into dummy variables prior to regression.
2.2.2. Merging Categories with Few Observations
Since some dummy variables in the dataset have very few observations, the classification models in VISEMURE were unable to fit models properly and return null or not-a-number (NaN) values as coefficients. This results in NaNs as prevalence and correlation estimates. One solution for this problem is to merge the categories of predictors with a small number of patients. To do so, the three groups of ‘Child’, ‘Adolescent’, and ‘Young Adult’ have been merged and labeled as ‘Child and Young Adult’. We also merge ‘Adult’ and ‘Middle-Aged’ into one category. Therefore, the modified age variable in the dataset has three categories—namely, ‘Child and Young Adult’, ‘Adult and Middle-Aged’, and ‘Elder’.
Similarly, ‘Third Income Quintile’ and ‘Fourth Income Quintile’ have also been merged. According to Statistics Canada [
31],
Table 3 shows the average adjusted after-tax income that is divided into five quintiles in 2010.
Statistics Canada’s income grouping is used to label the new categories of SES after merging them. This attribute breaks down the patients into two groups of ‘Less than or Equal to USD 50,600’ and ‘Greater than USD 50,600’ average adjusted after-tax income.
2.3. Components of VISEMURE
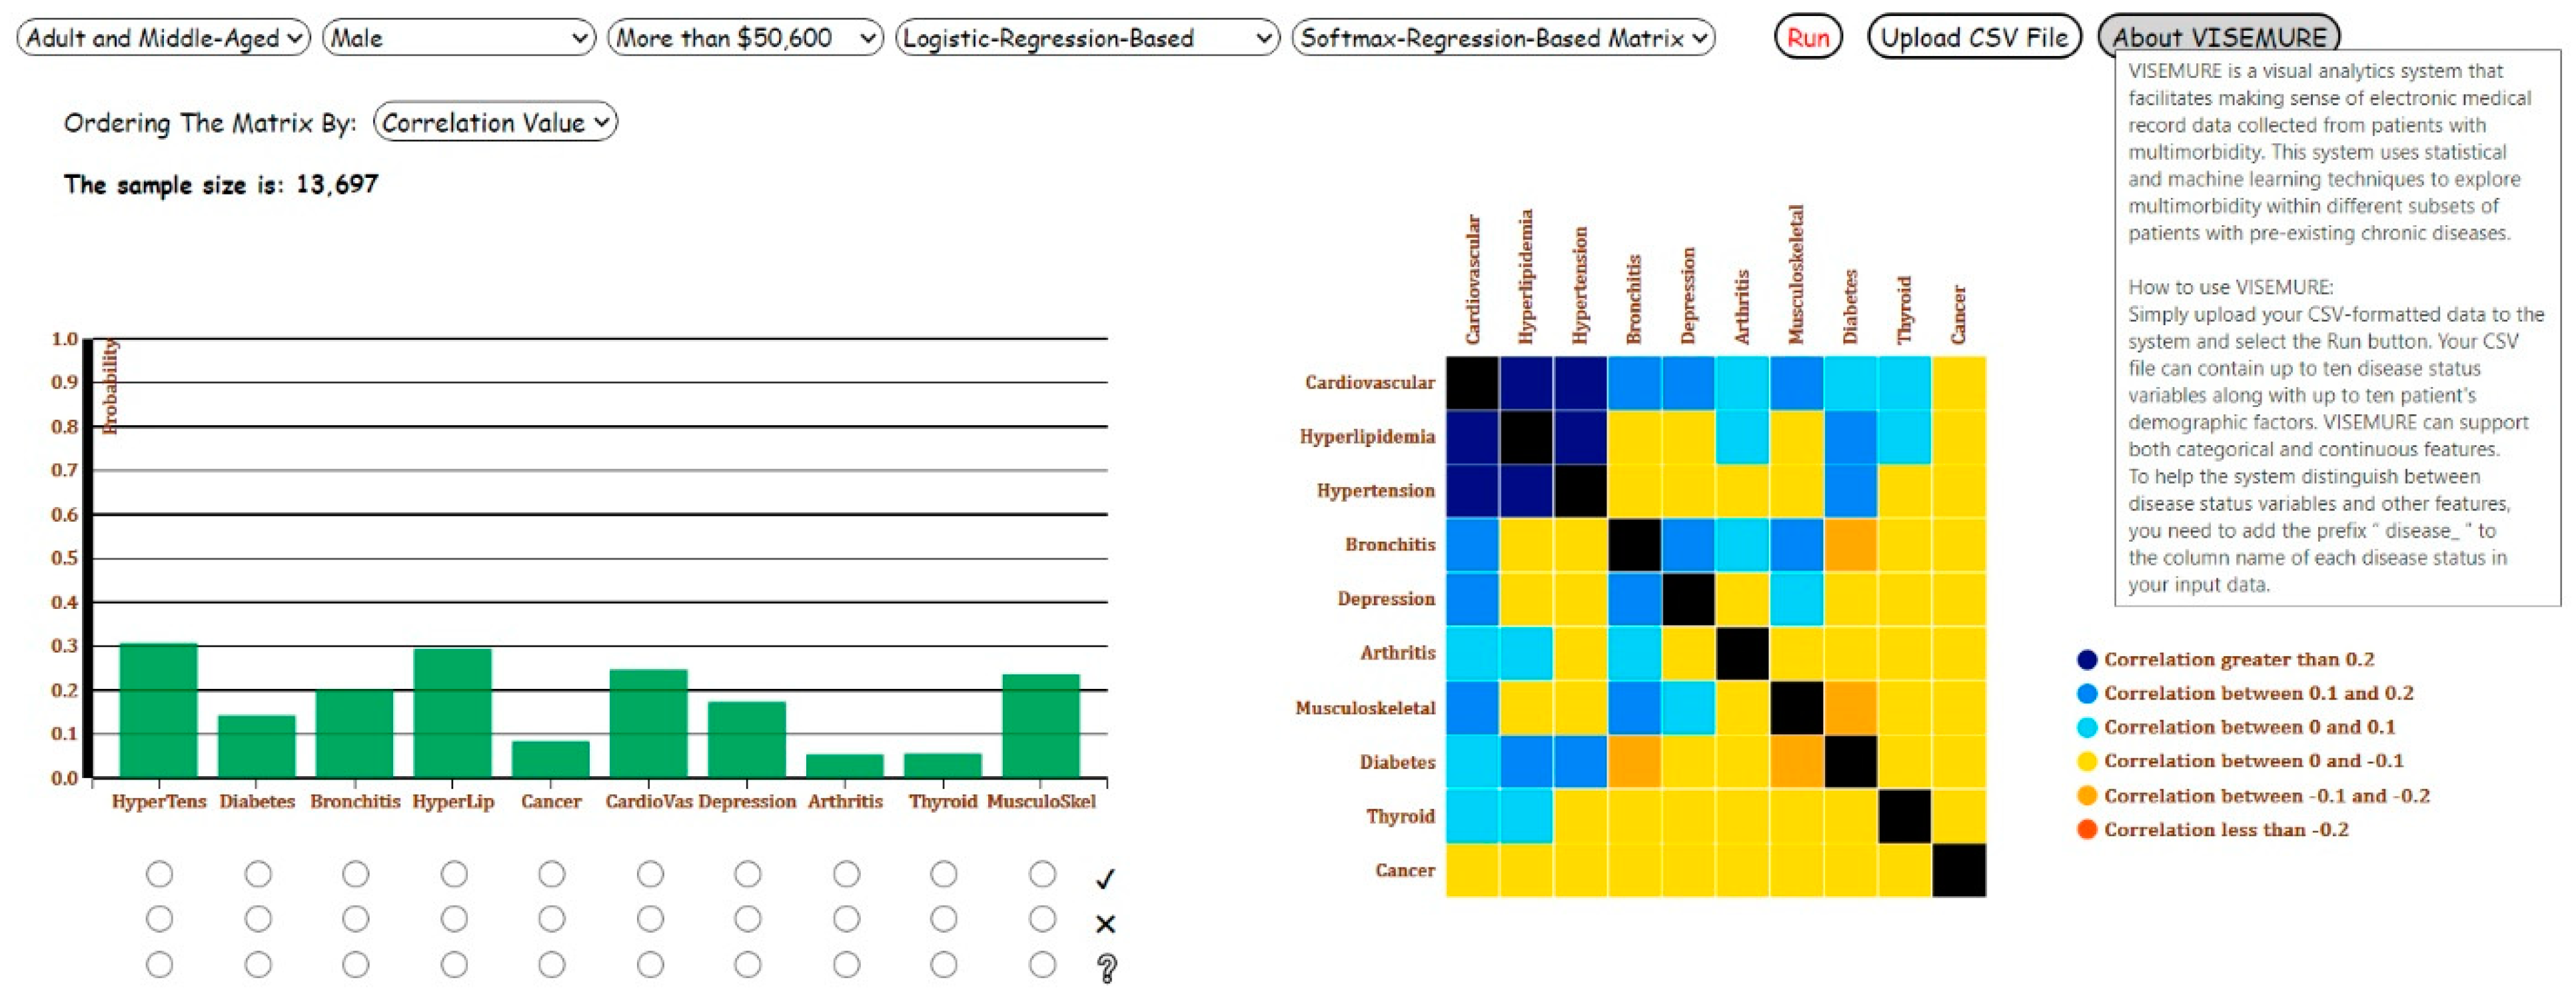
This section introduces VISEMURE by providing an overview of its design components. The main interface of VISEMURE is presented in
Figure 1. VISEMURE calculates conditional probabilities and performs logistic regression, softmax regression, and decision tree on the data in real-time based on user selections. These statistical and machine learning models are currently the available techniques employed by the system to analyze and interactively visualize the input data. However, the system is modular and so can be extended by incorporating additional methods.
First, five dropdown lists are created to allow the user to select different categories of age, gender, and SES available in the data, as well as the types of models applied to the visualizations in the system.
Second, a bar graph is designed interactively to represent the prevalence of chronic diseases. The three prevalence estimation techniques—namely, count-based conditional probability, logistic regression, and decision tree—are used by the bar graph. Based on the user selections, the results of the model of interest are shown in the bar chart. Three radio buttons (graphical control elements) are associated with each bar in the bar chart, allowing end-users to select only one item at a time. Every bar encodes the prevalence of the chronic disease, and its corresponding radio buttons take one of the labels among 1, 2, or null. If the user selects the first and nearest radio button to a bar with label 1, all prevalence estimates will be made conditional on having the corresponding disease. In contrast, selecting the second radio button produces prevalence estimates conditional on not having the corresponding disease. Finally, a radio button with a null label under each bar indicates that the prevalence estimates will be made assuming the status of that disease is unknown.
Third, a dynamic correlation matrix is created to show the pairwise correlations between chronic diseases. Two machine learning models, decision tree and softmax regression, are employed to estimate these correlation values. The user can select one of these two models from the corresponding dropdown menu. The system then computes the correlation coefficients based on the selected model. One additional dropdown menu is incorporated into the system to let the user order the cells in the correlation matrix by either disease name or correlation value.
When the data is filtered by the user, the sample size of the filtered data is shown in the interface. We note that VISEMURE is intended for exploratory analysis of a given dataset that represents a patient population, hence, there is no “minimum dataset size” required, subject to the needs of the different analysis techniques as described in
Section 2.2.2. The development of VASes for analyses that generalize beyond the given dataset is an active area of research, and is discussed in
Section 6.
VISEMURE can analyze and visualize arbitrary datasets containing up to ten features representing patient characteristics in addition to up to ten chronic diseases encoded as binary variables. We found that ten of each was sufficient to allow for a rich exploration of multimorbidity patterns, but this could be easily increased if a user had sufficient data and screen real estate. The system dynamically generates dropdown menus for features in input data, so it can be used with other data with other categorical and continuous patient characteristics.
An “About VISEMURE” button is provided such that when the user hovers over the button, a user guide appears that contains a brief introduction of the system as well as instructions on using it (see
Figure 2).
2.4. Implementation Details
The VISEMURE system is designed using Flask and D3.js. Flask is a Python web application framework, and D3.js is a library in JavaScript for creating interactive visualizations. We built our binary logistic regression and softmax regression models with Python library Statsmodels [
32] and decision tree model using python library Scikit-Learn [
33].
We use D3.js to develop interactive visualizations primarily because D3 (1) provides a data-driven method to attach data to the DOM (i.e., Document Object Model) elements. (2) allows the user to access the full functionalities of state-of-the-art web-browsers, and (3) is compatible with other programming languages such as python.
2.5. Architecture
The architecture of VISEMURE is shown in
Figure 3. VISEMURE is comprised of three modules: Analytics, Visualization, and Interaction. The Analytics module consists of two components: (1) disease prevalence estimator (shaped like an oval) and (2) disease correlations estimator (shaped like a rounded rectangle). The disease prevalence estimator can apply count-based conditional probability, logistic regression, or decision tree to compute prevalence estimates of chronic diseases. The visualization module displays these estimates through Count-Based Bar Chart, Logistic-Regression-Based Bar Chart, and Decision-Tree-Based Bar Chart, respectively. The disease correlations estimator employs a softmax regression or decision tree to produce correlation estimates between chronic diseases. The visualization module encodes the outputs of the disease correlations estimator into Softmax-Regression-Based Correlation Matrix and Decision-Tree-Based Correlation Matrix. The Interaction module of VISEMURE provides users with three main actions: (1) selecting, (2) filtering, and (3) arranging. Using the interaction module, users can gain insight into the data and explore associations between chronic conditions and patient characteristics by selecting drop-down menus and radio buttons. Users can also filter the data and display it in the Count-Based Bar Chart and observe the sample size of the filtered data or rearrange the correlation matrix to see the degree of association of diseases easily.
3. Design of VISEMURE
In this section, we explain the design of VISEMURE by describing how different visual and analytical components are combined in the system to facilitate various interactions.
Section 3.1 describes how simple count-based estimates can be used by VISEMURE to produce and display prevalence and correlation estimates. Because such count-based estimates can be problematic when exploring small groups of patients,
Section 3.2 and
Section 3.3 describe different machine learning techniques (i.e., court-, logistic regression-, and decision tree-based) that are also supported by the bar chart of VISEMURE. Next,
Section 3.4 and
Section 3.5 describe how two other machine learning techniques (i.e., softmax regression- and decision tree-based) can be used to interactively generate the correlation matrix.
3.1. Count-Based Bar Chart
By selecting ‘Count-Based Bar Chart’ from the dropdown list corresponding to the type of the interactive bar chart, the prevalence of chronic diseases is displayed on the bar chart in our VA system. Each bar on the x-axis is allocated to one disease; the prevalence of that disease is presented on the y-axis. If the user selects two diseases, the system calculates the probability of each unselected disease conditioned on the presence of both selected diseases. Then, the system animates the change and updates the visualization. The selection process can be continued by the user to look for further associations within the subgroup who have the selected diseases, and so on.
The user can also interact with the visualizations by selecting different age, gender, and socioeconomic groups from the dropdown lists. As a result, the dataset of multimorbid patients would be filtered based on the selected sociodemographic factors, and the conditional probabilities would be updated accordingly. For example, suppose the user selects ‘Child and Young Adult’ as the age group, ‘Male’ from the gender groups, and the existence of diabetes. The prevalence of each unselected disease would then be computed and presented on its associated bar, estimated only using patients who are child or young adult, male, with diabetes. Because it is selected and assumed to be present, the prevalence of diabetes would change to 1 in the bar graph. In this case, the conditional probability formula for the
jth unselected disease is as follows
3.2. Logistic-Regression-Based Bar Chart
Selecting ‘Logistic-Regression-Based Bar Chart’ from the corresponding drop-down list, the bar graph represents the prevalence of chronic diseases predicted by logistic regression. The logistic regression model uses the entire data with all 13,697 patients and only the selected sociodemographic factor/s and pre-existing disease/s are included in these models. The model will be changed and updated if the user changes the selection. As an example, if the user clicks on the radio button with label 0 related to arthritis (the absence of arthritis), then selects the radio button with label 1 corresponding to thyroid disease (the presence of thyroid disease) and ‘Elder’ age group, the logistic regression model for finding a mathematical relationship between them and ‘Cancer’ as the target is as follows
where
P is the probability of developing cancer, which would be shown on the corresponding bar as the cancer prevalence. The model investigates the associations between arthritis and cancer, and thyroid disease and cancer, adjusted for the dummy variables
age1 and
age2.
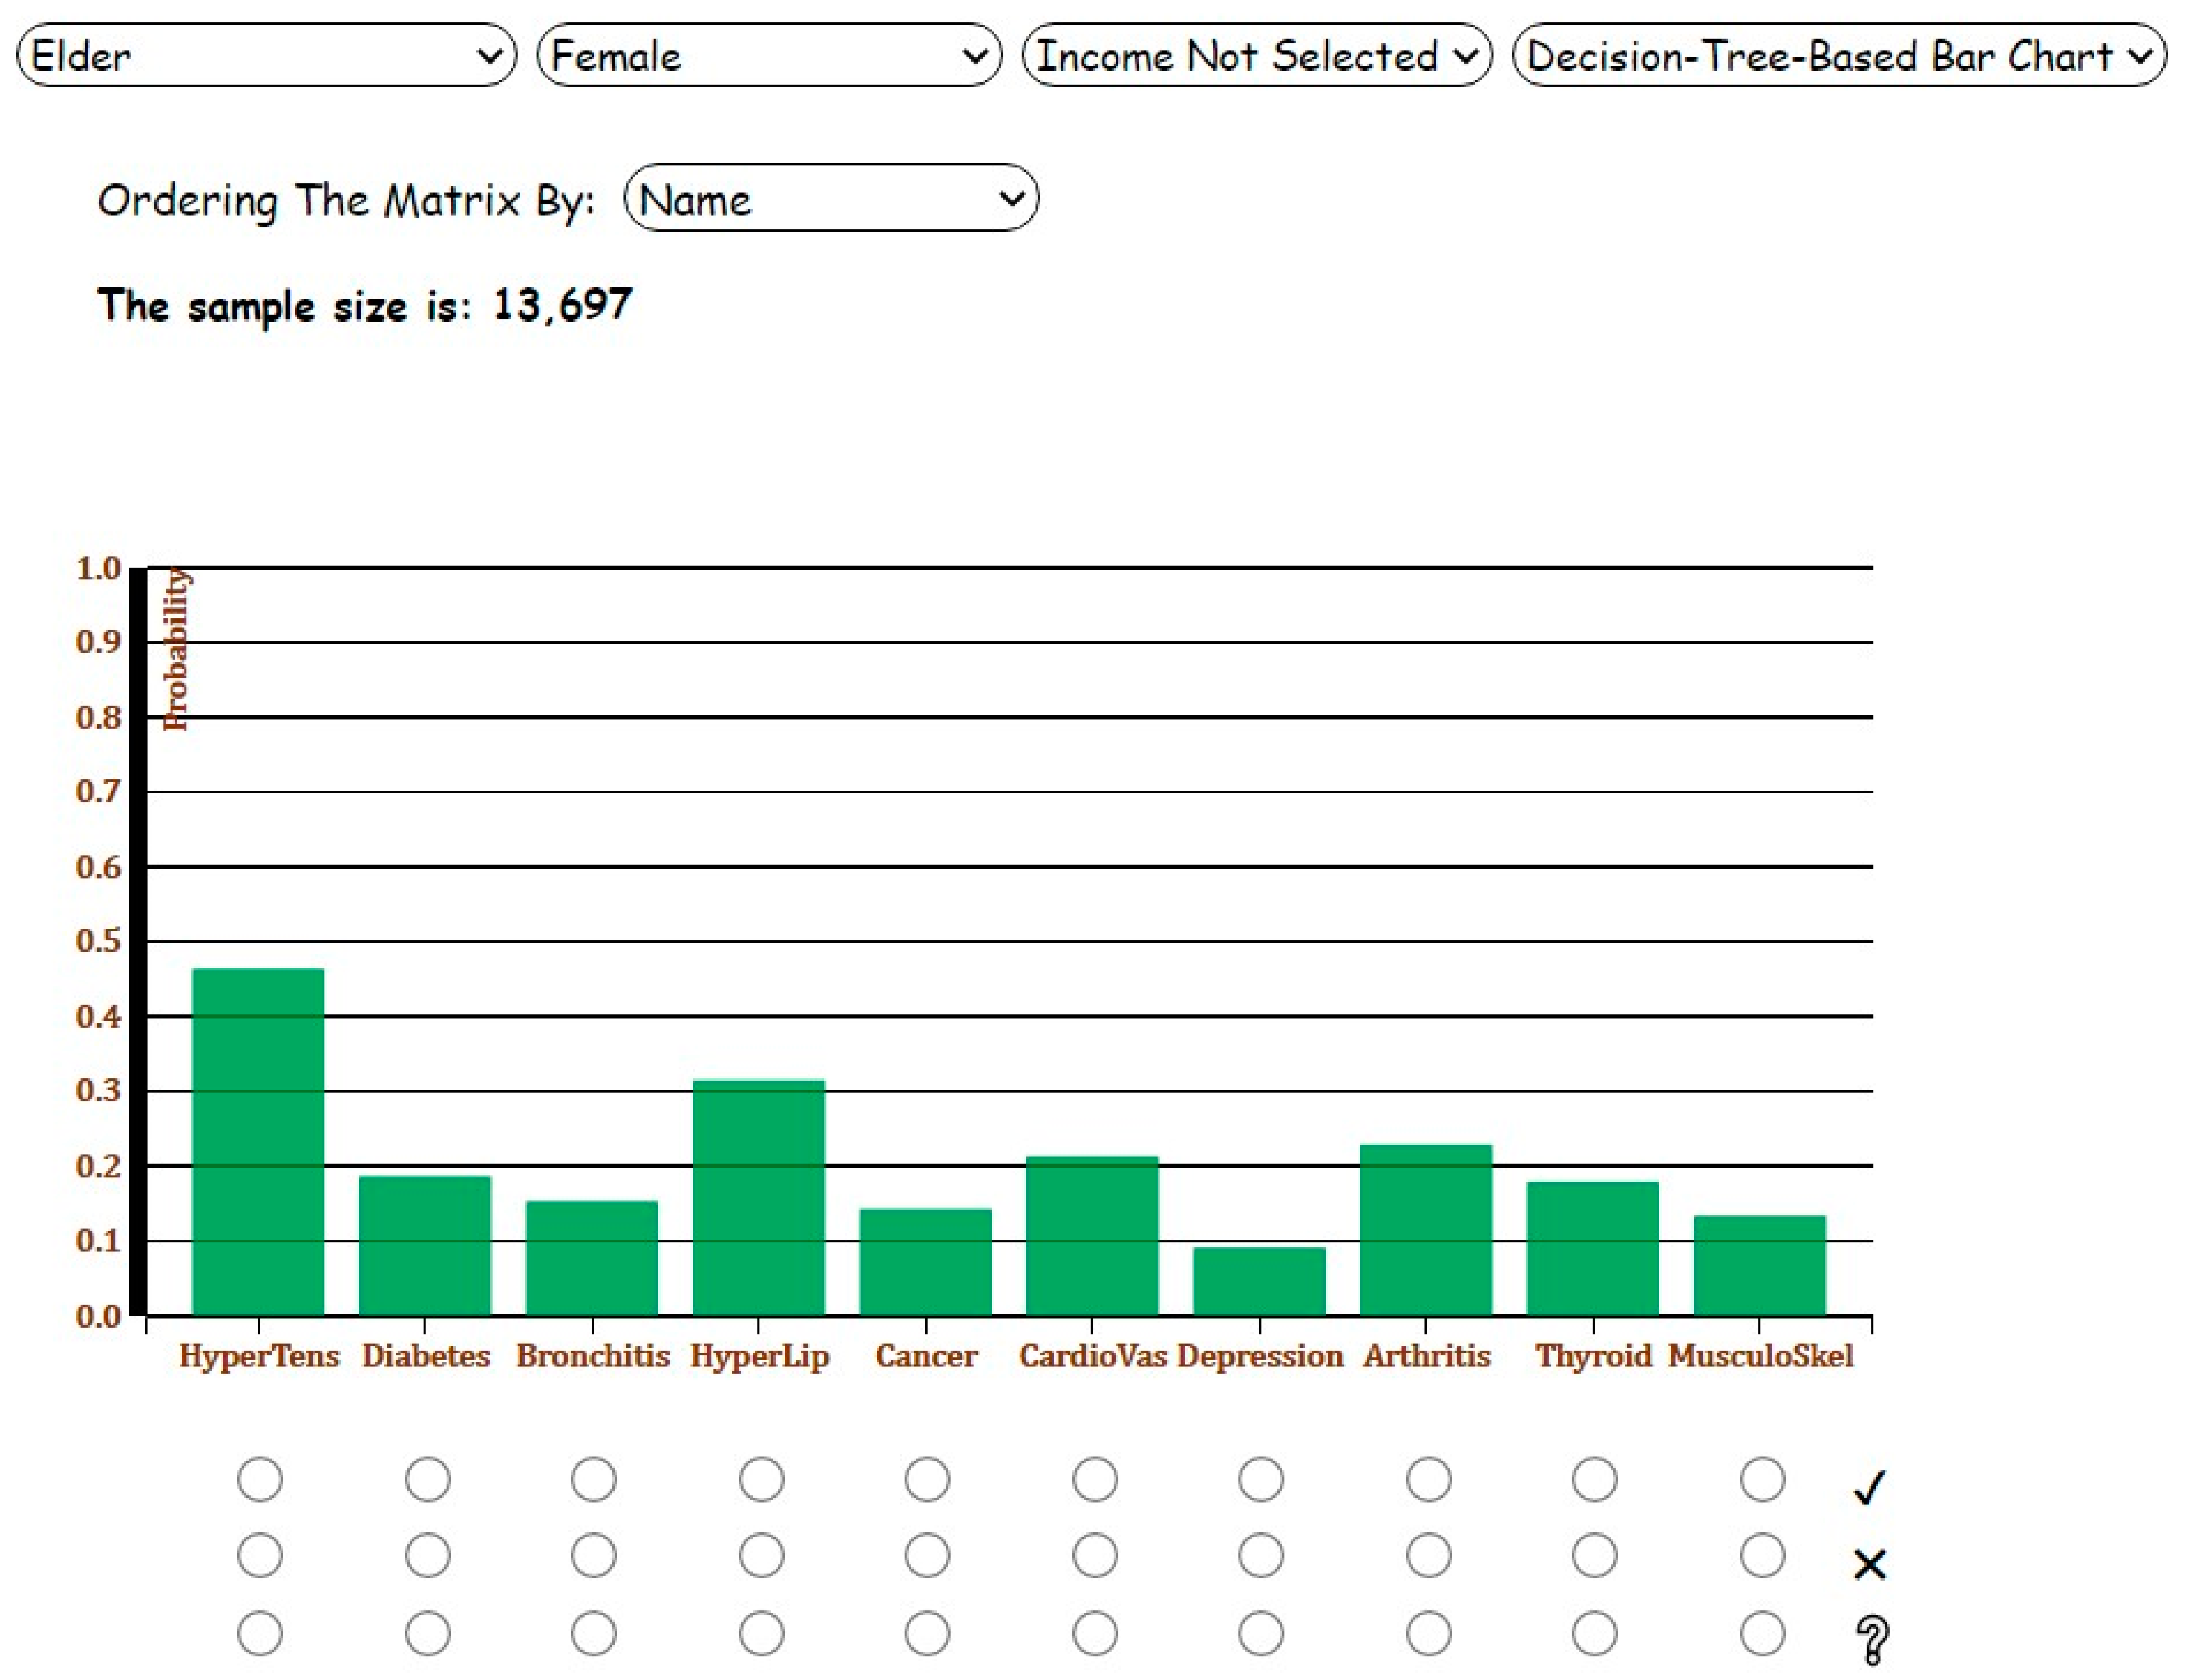
3.3. Decision-Tree-Based Bar Chart
When the user selects ‘Decision-Tree-Based Bar Chart’ from the dropdown list, a decision tree model will be created such that all diseases of interest, as well as selected patient characteristics, are included in the model. It is important to note that if a categorical variable with more than two categories is selected (e.g., age), we do not use one-hot encoding to binarize each category, which converts the categorical variable into dummy variables. We avoid this process because dummy variables make a decision tree sparse and obscure the order of feature importance, which results in inefficiency and poor performance. We build the model based on all patients included in the dataset. To avoid overfitting and to reduce complexity, we utilize pruning methods by changing the parameters ‘max_depth’ (=3) and ‘min_samples_leaf’ (=200) in the Python server, which refers to the maximum number of nodes in a branch and the minimum number of samples required at the leaf node (a node without further split), respectively.
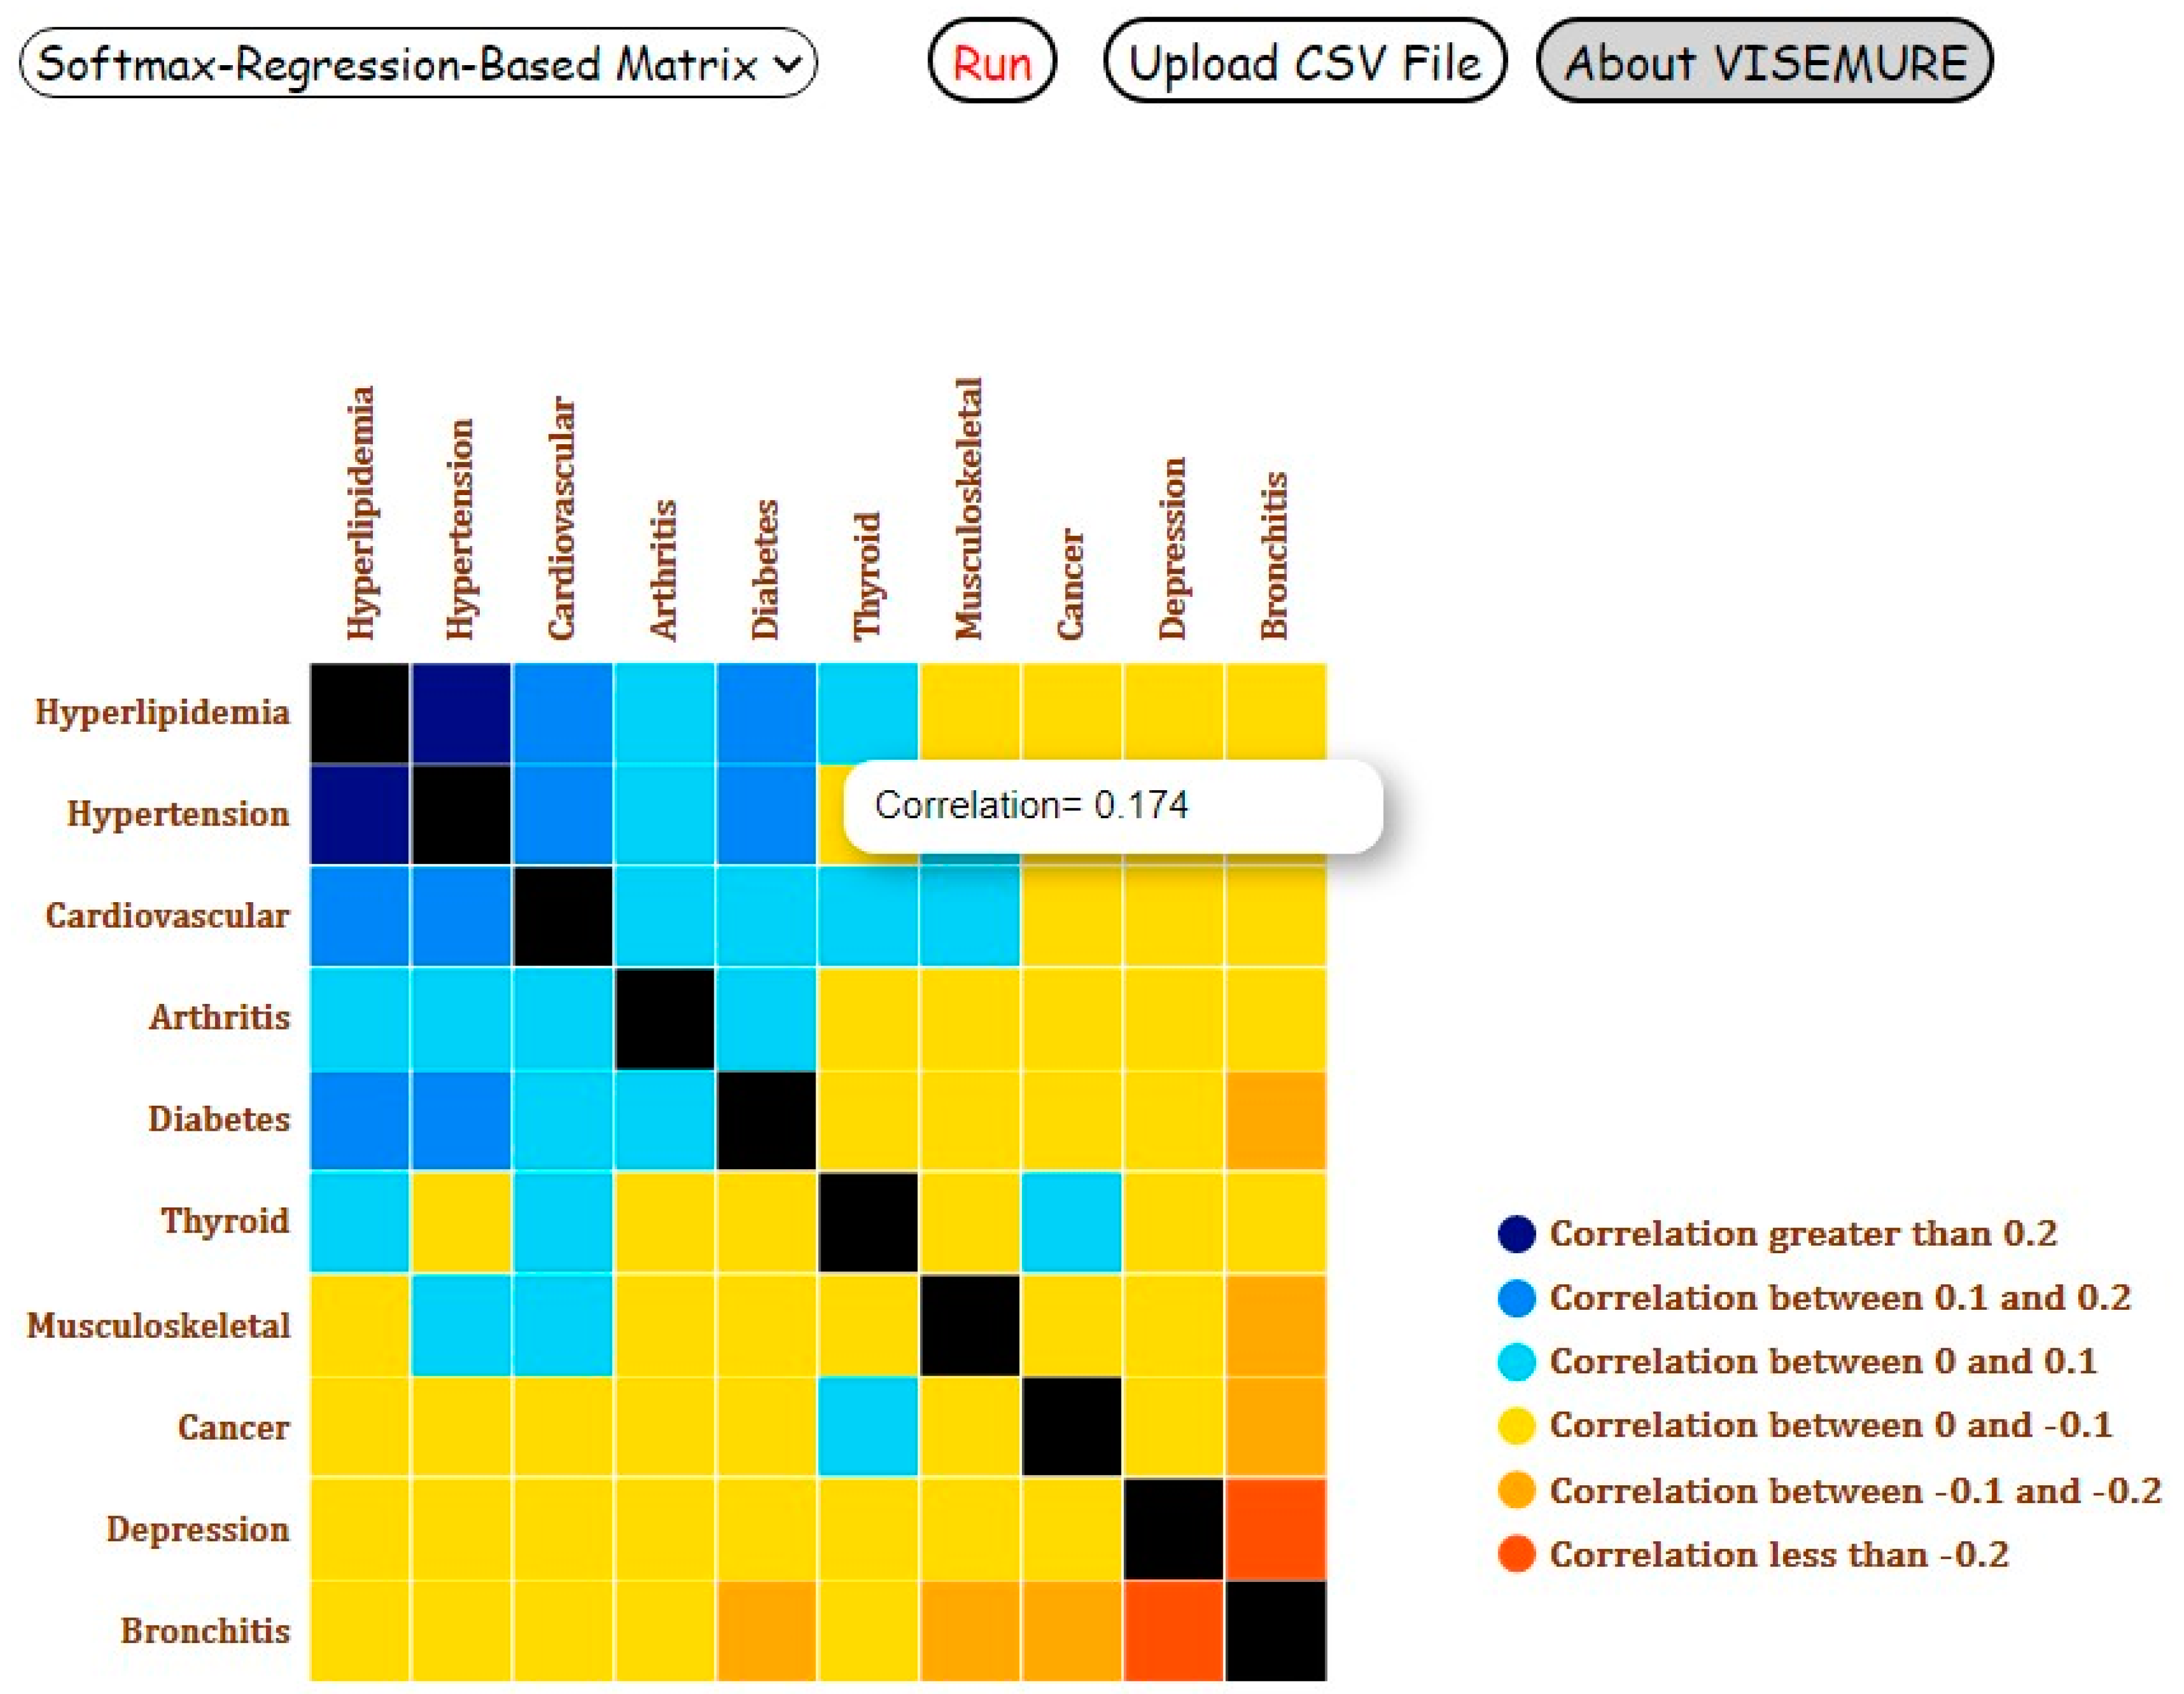
3.4. Softmax-Regression-Correlation Matrix
Suppose we aim to measure the association between two chronic diseases
and
. We create a new variable
having the following four levels:
Since our new target is the variable A with four levels (
K = 4), we can build a softmax (or multiclass logistic) regression in order to predict the probabilities for each of the levels of
A, which in turn can be used to compute the pairwise correlation between these two diseases. Softmax regression utilizes a linear predictor function
f(
k,
i) to predict the probability that observation
i belongs to class
k
where
M is the number of independent variables in the model and
i is an observation from 13,697 inputs in the data. We assign value 0 to the ‘Male’ category and value 1 to the ‘Female’ category, since in this dataset, gender is encoded as a binary variable. If the user selects the presence depression and ‘Male’ group, the softmax regression model built for class zero is as follows
After computing the linear predictor function for all four classes of the dependent variable
, we can also compute the probability of each class as follows
The correlation between the two random variables
X and
Y is calculated through the following formula
where
and
denote the standard deviation and the expected value of
X, respectively, and
is defined as follows when
X and
Y are discrete random variables and not independent
We name , , , and . We also define and . Given that each chronic disease in our data can be modeled as a random variable with a Bernoulli distribution, we have , , , and .
According to the definition of
and given that
and
might influence each other, we calculate
. Then, the correlation between
and
is computed as follows
This process is repeated for each pair of chronic diseases, and their estimated correlation is depicted by the corresponding cell in the interactive matrix. By hovering over each cell, the corresponding correlation value appears. The direction of the relationships between diseases is encoded by color. Blue and orange are used for positive and negative correlations, respectively. In addition, color intensity encodes the magnitude of the correlation coefficients such that a darker color represents a greater absolute value. The user can also rearrange the correlation matrix by disease name and correlation value. Recall that the height of the bar corresponding to a selected disease changes to 1 or 0, based on the selection (assumed presence or absence). Similarly, if the user selects, the color of all cells in row i and the column i in the correlation matrix change to black, which indicates that the correlations are undefined.
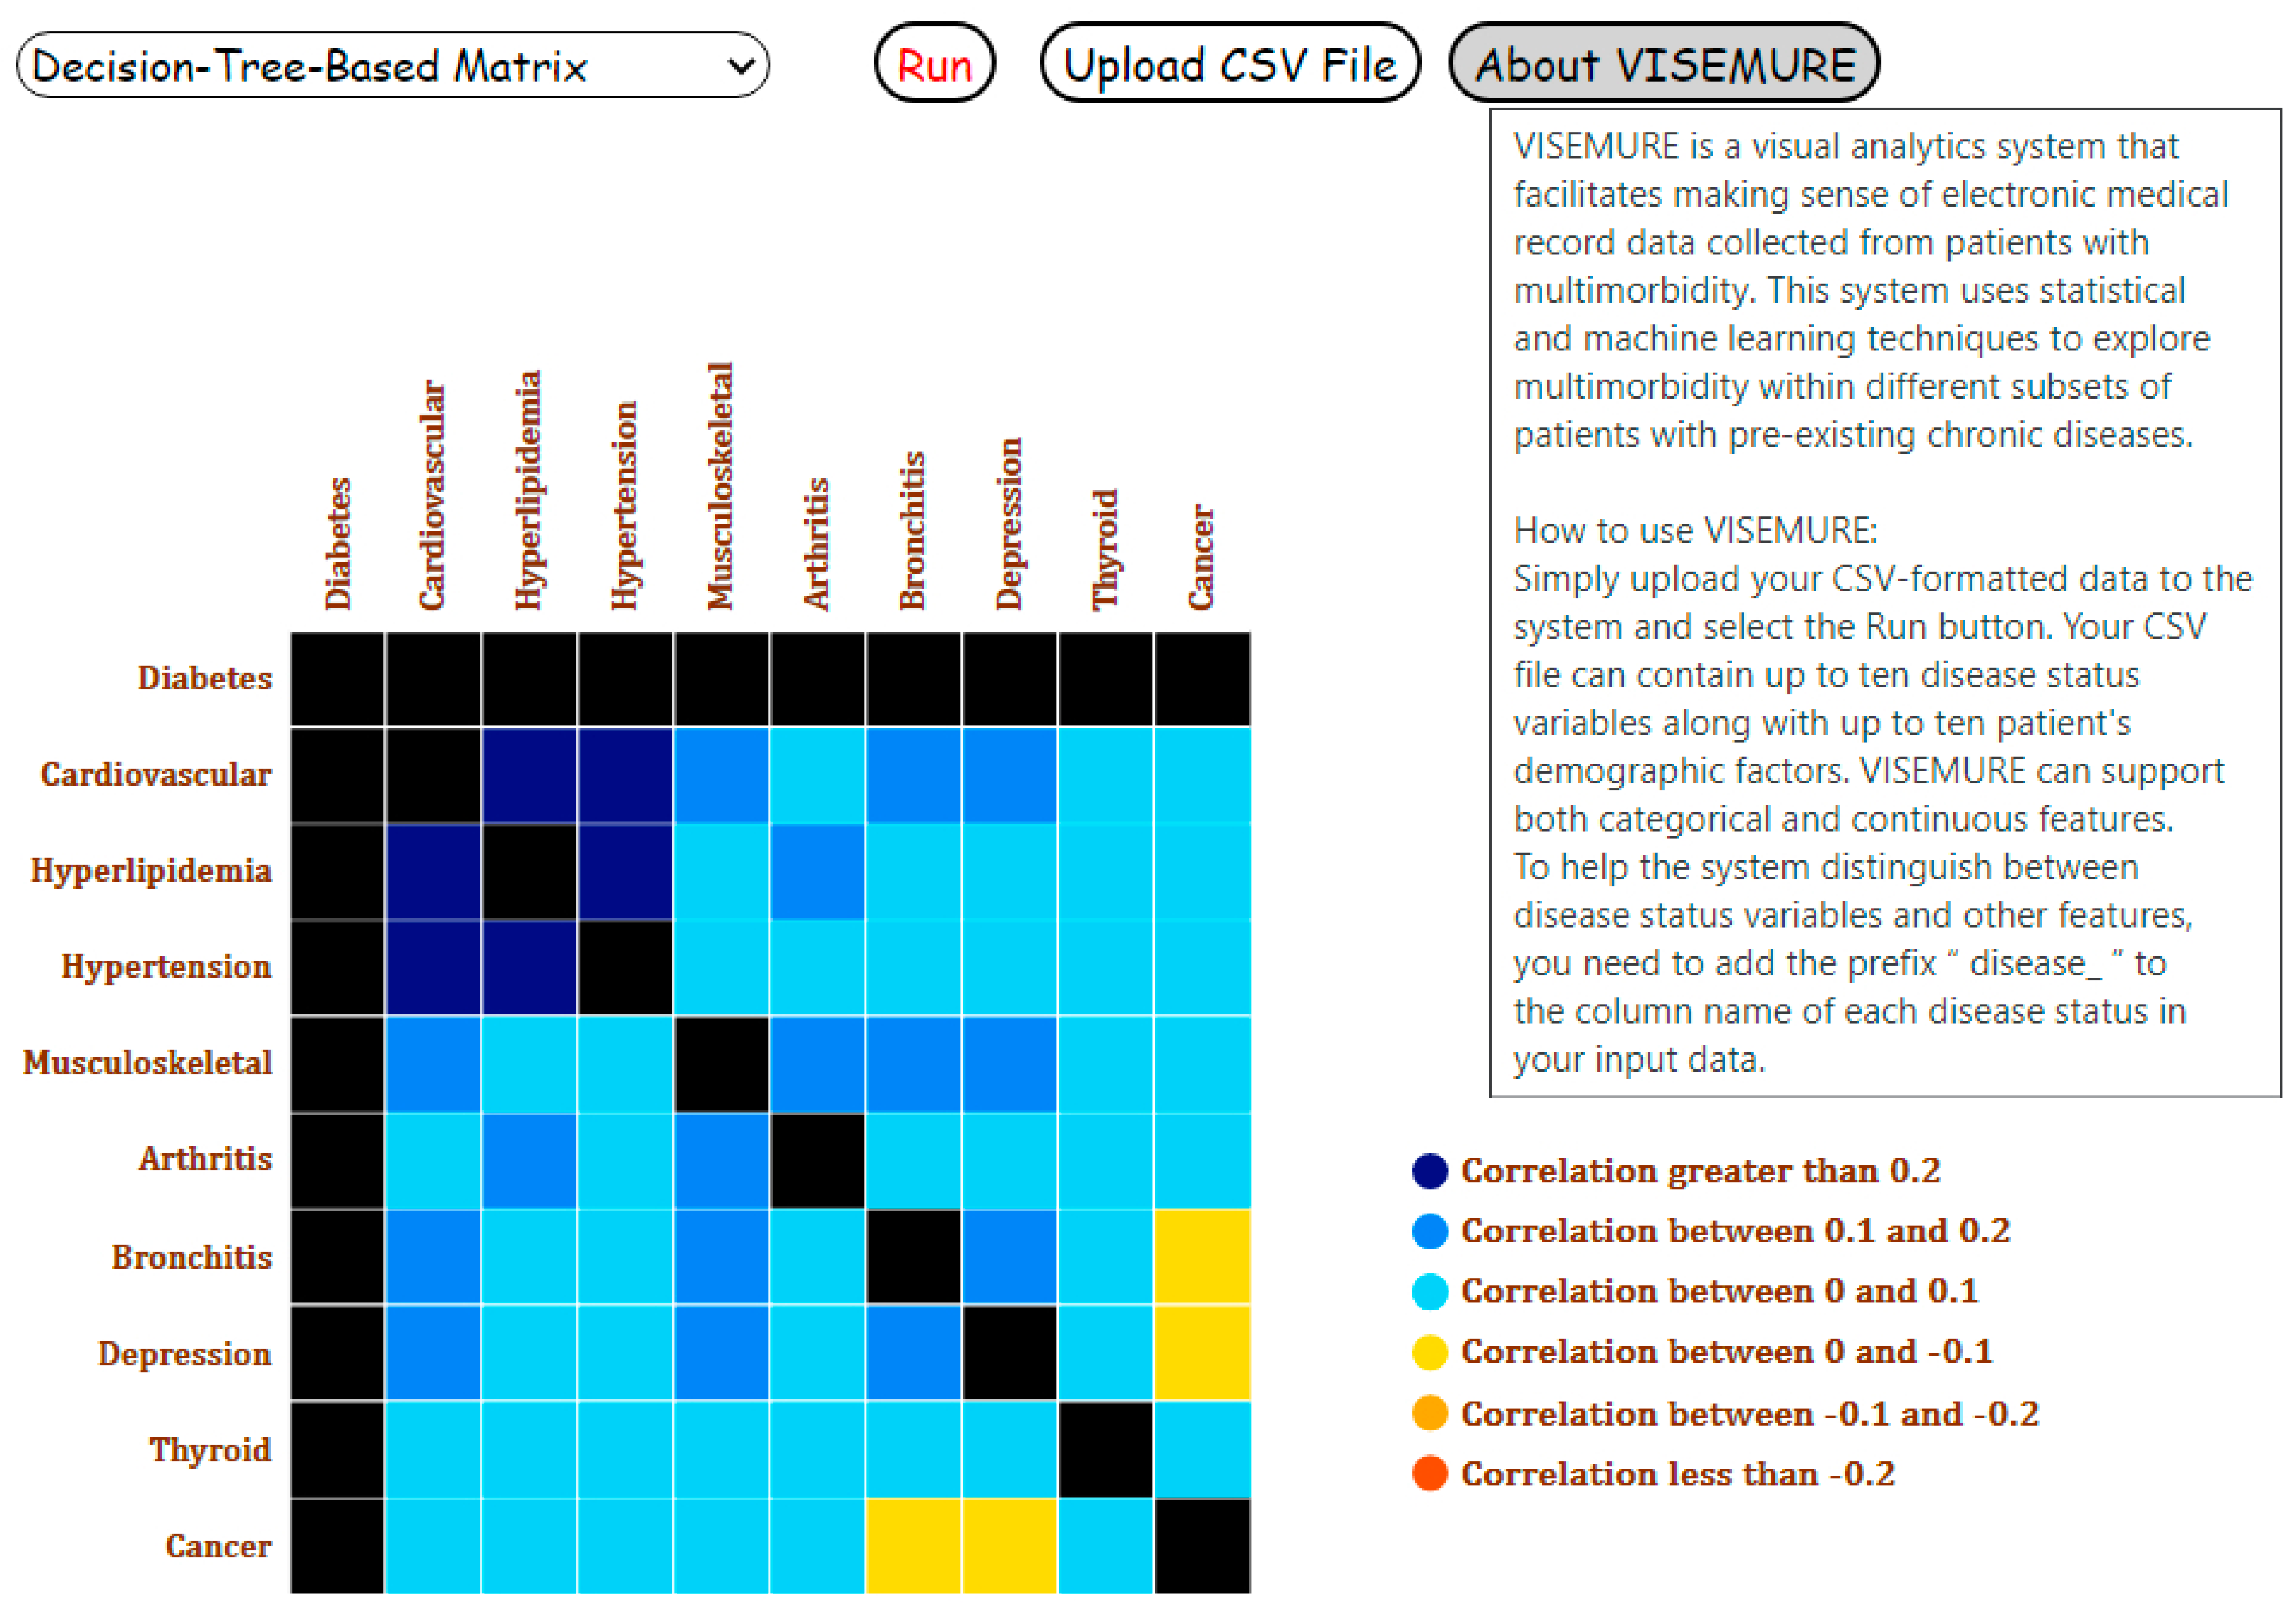
3.5. Decision-Tree-Based Correlation Matrix
By selecting ‘Decision-Tree-Based-Correlation Matrix’ from the dropdown menu related to the type of matrix, a decision tree is made given the selected variables and with the parameters ‘max_depth’ = 3 and ‘min_samples_leaf’ = 200 to prevent overfitting. The target in the correlation matrix is the variable A corresponding to a pair of chronic diseases and has four levels. For instance, suppose the user selects ‘Adult and Middle-Aged’ and the presence of hyperlipidemia and aims to observe their influence on the association between cardiovascular disease and hypertension as the target. Therefore, the model would examine the relationship between hyperlipidemia and the target controlling for age. Then, the probability of occurring for each class of the target would be estimated using one instance (in this case age = ‘Adult and Middle-Aged’ and hyperlipidemia = 1). The four computed probabilities would be used in estimating the correlation coefficient between cardiovascular disease and hypertension. This analysis would be repeated for all other pairs of unselected diseases. The correlation of those pairs whose one or both diseases are assumed to be known to be present or absent is undefined. In this example, all correlations between hyperlipidemia and the other nine chronic diseases would be undefined and their relative cells in the correlation matrix would change to black.
5. Discussion
In this paper, we have shown how visual analytics systems can be used to explore patterns of multimorbidity. To achieve this, we have described the development process of VISEMURE, a VA system designed to satisfy the requirements of healthcare researchers in making sense of multimorbidity. VISEMURE incorporates a wide range of statistical and machine learning techniques and integrates them seamlessly with interactive data visualizations.
Using the DELPHI data, we have demonstrated how a health researcher can use VISEMURE to better understand the relationships among patient characteristics, existing disease states, and patterns of multimorbidity. The system is thus able to answer many questions that health researchers may have about these relationships in a way that affords them a great deal of freedom in terms of what characteristics to consider or exclude and on what diseases to focus as outcomes.
There is little research focusing on elaborate and interactive visualizations for enhancing the exploration of multimorbidity patterns [
34]. Investigations in this area are mostly represented through static charts and tables that do not enable users to filter, select, control, and customize data points [
1,
35,
36]. There are some interactive visualization systems that provide valuable healthcare insights by investigating the effects of patient characteristics and risk factors on the prevalence, incidence, or mortality of diseases [
37]. However, such tools analyze only
one health outcome at a time. Previous work on multimorbidity often simplifies the outcome to a count of the number of chronic diseases present without distinguishing between them, although some work has investigated particularly common co-occurrence patterns [
30]. This is the key difference between the VA system designed in this paper and other applications: VISEMURE allows users to investigate the distribution of a
multivariate outcome, i.e., the joint occurrence of chronic diseases, in a way that supports a much richer set of questions about how those diseases are related to each other. This opens the path for a more detailed understanding of why chronic diseases co-occur, which in turn may lead to improved prevention and treatment strategies.
6. Limitations and Future Directions
The main limitation of this work stems from a design choice that we made regarding the type of analysis that VISEMURE is intended to support. Our system supports exploratory analysis, sometimes referred to as “descriptive epidemiology”, rather than confirming facts that generalize beyond the data that are being analyzed. Exploratory analyses are crucial for understanding what is happening within a population of interest, and they are crucial for developing hypotheses around which relationships among risk factors, pre-existing conditions, and multimorbidity patterns may generalize to other settings. The proof-of-concept case study that we presented using the DELPHI data is designed to describe the DELPHI population and demonstrate the utility of the VISEMURE approach rather than to create broadly generalizable knowledge about multimorbidity.
To move beyond exploratory/descriptive tasks requires careful attention to issues of bias (e.g., what populations are or are not represented in the data) and variance (e.g., assessing confidence and statistical significance of findings). Issues of bias in data are well-known in epidemiology, and health researchers are trained to mitigate the bias present in data through prior knowledge and modelling. One future direction for VISEMURE would be to allow end-users to more finely adjust what information is used to control bias, perhaps by offering more flexible modelling options. The issue of variance or confidence is tied to the idea of statistical significance; the best way to address statistical significance in an interactive setting has been explored but is still an open area of research [
38,
39]. Developing a methodology for interactively mitigating bias and understanding variance so that VISEMURE can be used for a wider variety of tasks will be a focus of our future work.
Another avenue for future work would be to provide a richer view of the joint distribution of outcomes (conditional on patient characteristics and pre-existing conditions). We have used correlation to describe pairwise relationships among the different diseases, but it is possible that three-way or higher-order relationships are important in understanding the distribution of patterns of multimorbidity. Making sense of these more complex relationships would require substantially more development of the visual analytics tool in order to help the user to understand their salience and, thereby, to make them useful for sensemaking.
7. Conclusions
Multimorbidity is a growing healthcare challenge, especially for older adults, and results in greater vulnerability, higher risk of functional decline and disability, and higher mortality. Focusing on chronic diseases individually no longer meets the needs of patients or healthcare providers in preventing and managing these chronic conditions. A holistic approach to chronic diseases and their associations with sociodemographic characteristics and risk factors is needed to design effective prevention and control strategies. Therefore, we created a system for analyzing and exploring multimorbidity prevalence and associations in a visual, interactive manner. Unlike many studies in the area of multimorbidity whose results are shown through simple charts, tables, and flowcharts, our VA system allows users to interact with dynamic subsets of data and select a set of chronic diseases, and specific categories of age, gender, and socioeconomic scores for investigation.
The data visualizations in our system can be repurposed for other tasks in the area of healthcare or other disciplines where high-dimensional joint distributions of random variables are important to understand. The system can also apply other statistical and machine learning models for prevalence and correlation estimation, and it can interpret more data with more available features.
VISEMURE is novel in the way it includes several statistical and machine learning techniques and integrates data analysis with interactive visualization to facilitate making sense of EMR data collected from patients with multimorbid diseases, which has never been attempted before. The design process established in this research will lead to the emergence of best practices for designing similar systems.


