Review

Innovation Trajectories for a Society 5.0

Department of Engineering, Parthenope University, 80133 Napoli, Italy
*
Author to whom correspondence should be addressed.
Data 2021, 6(11), 115; https://doi.org/10.3390/data6110115
Submission received: 30 September 2021 / Revised: 28 October 2021 / Accepted: 5 November 2021 / Published: 10 November 2021
(This article belongs to the Special Issue Development of a Smart Future under Society 5.0)

Abstract

:
Big Data, the Internet of Things, and robotic and augmented realities are just some of the technologies that belong to Industry 4.0. These technologies improve working conditions and increase productivity and the quality of industry production. However, they can also improve life and society as a whole. A new perspective is oriented towards social well-being and it is called Society 5.0. Industry 4.0 supports the transition to the new society, but other drivers are also needed. To guide the transition, it is necessary to identify the enabling factors that integrate Industry 4.0. A conceptual framework was developed in which these factors were identified through a literature review and the analytical hierarchy process (AHP) methodology. Furthermore, the way in which they relate was evaluated with the help of the interpretive structural modeling (ISM) methodology. The proposed framework fills a research gap, which has not yet consolidated a strategy that includes all aspects of Society 5.0. As a result, the main driver, in addition to technology, is international politics.

1. Introduction

In early 2019, the Japanese government introduced the concept of Society 5.0. Japan is one of the nations with the greatest amount of technological development applied to social wellness. For this reason, it aspires to create an anthropocentric society that strongly integrates cyberspace and physical space in order to balance economic and technological progress with social problem-solving [1,2].
The Japanese concept of Society 5.0 is aimed at the economy and at the citizens, thus promoting the idea of a Smart Society, where information technology will outline the profile of a new superintelligent company [3]. The digital transformation will once again radically change many aspects of society, affecting private life, public administration, industrial structure, and employment [4,5]. The goal is to create a society in which anyone can create value, anytime and anywhere [6], in compliance with future sustainable strategies developed with the 17 United Nations objectives [7]. Therefore, the objectives of Society 5.0 are also the objectives of the 2030 Agenda for Sustainable Development [8,9], adopted by all the member states of the United Nations in 2015. Society 5.0 will help achieve the Sustainable Development Goals. The two reforms in the vision of a new world share a common direction. From this perspective, Industry 4.0 can be considered as a tool to promote sustainable innovation and is, therefore, a policy-driven discourse on innovation [10,11,12,13,14,15,16].

1.1. The Industry 4.0 and Society 5.0 Relationship

Industry 4.0 (I4.0) has recently become a relevant phenomenon and is one of the most important international topics in both industry and academia today [17,18,19]. I4.0 can be understood as the combination of physical and digital technologies, such as artificial intelligence (AI) [13,20,21], cloud computing [22,23], Big Data [21,24], adaptive robotics [13], augmented and virtual realities [25], additive manufacturing [26], and the Internet of Things (IoT) [27,28].
I4.0 is considered a universal tool for the transformation of the information society that responds to the real needs of populations through the sharing of knowledge and information [1]. I4.0 can disseminate the technological initiatives surveyed in the productive environment in the social sphere [29]. The application of the results obtained from smart manufacturing creates the basis for a new model of social composition, expanding the advantage of the digital space (cyberspace) to nonproductive segments [1]. This is the case of Society 5.0. In the information society, people access a cloud service (such as a database) in cyberspace via the Internet, and search, retriev, and analyze information or data.
In Society 5.0, a huge amount of information from sensors in physical space is accumulated in cyberspace. In cyberspace, Big Data is analyzed by artificial intelligence (AI), and the results of the analysis are returned to humans in physical space in various forms. In this way, Society 5.0 transmits to humanity the next step in the development of civilization [1].

1.2. Motivation of the Study

To bridge the gap between Industry 4.0 and Society 5.0 in order to co-create value for the long-term sustainability of the ecosystem, some challenges still exist. For example, Yang et al., [27] and Bibri et al., [23] suggest using sensors to create data processing platforms and computing models in the context of sustainable smart cities of the future from the perspective of Society 5.0. In particular, an application of sensors is proposed by Francisco et al. [25] and is aimed at the area of the energy efficiency of buildings. The use of cloud computing technology is discussed by Dautov et al. [30]. Their research focused on employees in intelligent surveillance systems in order to supervise urban areas for public security purposes. Yigitcanlar et al. [12] showed the application of IoT in emerging smart cities and the potential symbiosis between this technology and smart and sustainable urbanism. Technologies, such as 3D printing, robotics, and augmented/virtual reality, in terms of their contributions to improving labor productivity, have been studied by Kuru et al., [31], and by Aquilani et al. [18].
The literature studies address the subject of Society 5.0 limited to specific sectors, such as smart cities of the future and industry. The production of a guidance study was not found. Therefore, the contribution of this study is to provide a general framework of the driving factors that allow for the transition to Society 5.0. These factors will be understood as unique factors with general application fields, and suitable for all sectors of Society 5.0.

1.3. Research Agenda

In this work, an integrated literature review, based on the implementation of the analytical hierarchy process (AHP) and interpretive structural modeling (ISM), is proposed [32]. The ultimate goal of this study is to answer three questions:
  • Q#1. What are the factors that can help the transition to the new model of society, identified in Society 5.0?
  • Q#2. What are the I4.0 technologies that can facilitate the transition and effectively implement Society 5.0?
  • Q#3. How are the factors related and working for the success of Society 5.0?
The rest of the manuscript is structured as follows: Section 2 details the methodology applied in the study in order to answer the key questions; Section 3 describes the application of the methodologies indicated in the previous section; Section 4 outlines the main findings later discussed in Section 5. Finally, Section 6 analyzes the conclusions.

2. Materials and Methods

In this section, the research methodology is presented. In agreement with the object of study, a literature review was applied in order to identify the factors that allow for the implementation of Society 5.0. The factors identified were subsequently submitted to the AHP methodology, with the aim of selecting the most important factors. Therefore, they were analyzed and evaluated through the ISM methodology in order to determine their connection and how they contribute to the achievement of the objective. A group of five experts was chosen. It was made up of people from academia and industry to carry out the three methodologies. Figure 1 shows graphically the methodology applied.
Below, a review of the literature, the AHP, and the ISM methodology are presented in detail.

2.1. The Decision-Making Team

The framework presented here was supported by a group of five experts who were selected in view of their knowledge and experience gained during their academic and business career years. The profile of the experts is as follows:
  • Two senior researchers with experience in designing preparedness assessment models and applying the AHP technique;
  • Two experts with extensive experience in advanced engineering, digital transformation, smart manufacturing, and knowledge development. They operate in both academic and industrial fields;
  • A researcher with experience in the field of sustainability, guided by I4.0 technologies, and ISM methodology.
The expert group may provide a holistic view of the decision-making context related to the elements and modalities of the transition to Society 5.0. In this respect, the roles of decision-makers are as follows:
  • Identify factors that can influence the transition through a literature analysis. This process is carried out by researchers with academic and sustainability experience;
  • Derive the weights of these factors by performing the pairwise comparisons required by the AHP technique in order to identify which of these factors are most influential for the transition. In this process, senior researchers designed the hierarchy and supported the AHP application, guiding other experts on how to accurately formulate paired judgments;
  • Obtain an assessment of the relationship between the factors for designing the influence model. In this process, the experienced ISM researcher involved all the experts guiding them in the judgments.

2.2. Step 1: Literature Review

The literature review was applied to identify the factors contributing to the implementation of Society 5.0. In order to find a number of factors for analysis and evaluation, the review was conducted with a high level of inclusiveness. Bibliographic records are useful elements of scientific work. Bibliometry facilitates more objective and reliable analyses and provides an overview of the existing research and scientific mapping.

2.2.1. Research Question

In order to better define the objective of the survey and to obtain results suitable for the purpose of the study, research questions have been formulated. The research questions are related to the questions in Section 1.3, but they are more general and inclusive for finding papers useful for the research objective. In particular, the research focuses on four research questions:
  • RQ#1: How interested is the scientific community in knowing the potential I4.0 offers to Society 5.0?
  • RQ#2: What is the contribution of the I4.0 Key Enabling Technologies (KETs) to Society 5.0?
  • RQ#3: What are the practices that facilitate the transition to Society 5.0?
  • RQ#4: How is the I4.0 paradigm used in the applications of the Society 5.0 model?
Key enabling technologies (KETs) are fundamental I4.0 technologies, as they increase the value of the production system chain and have the ability to innovate processes, products, and services in all economic sectors of human activity. These are technologies applied to objects that create a link and a collaboration between physical and virtual realities.

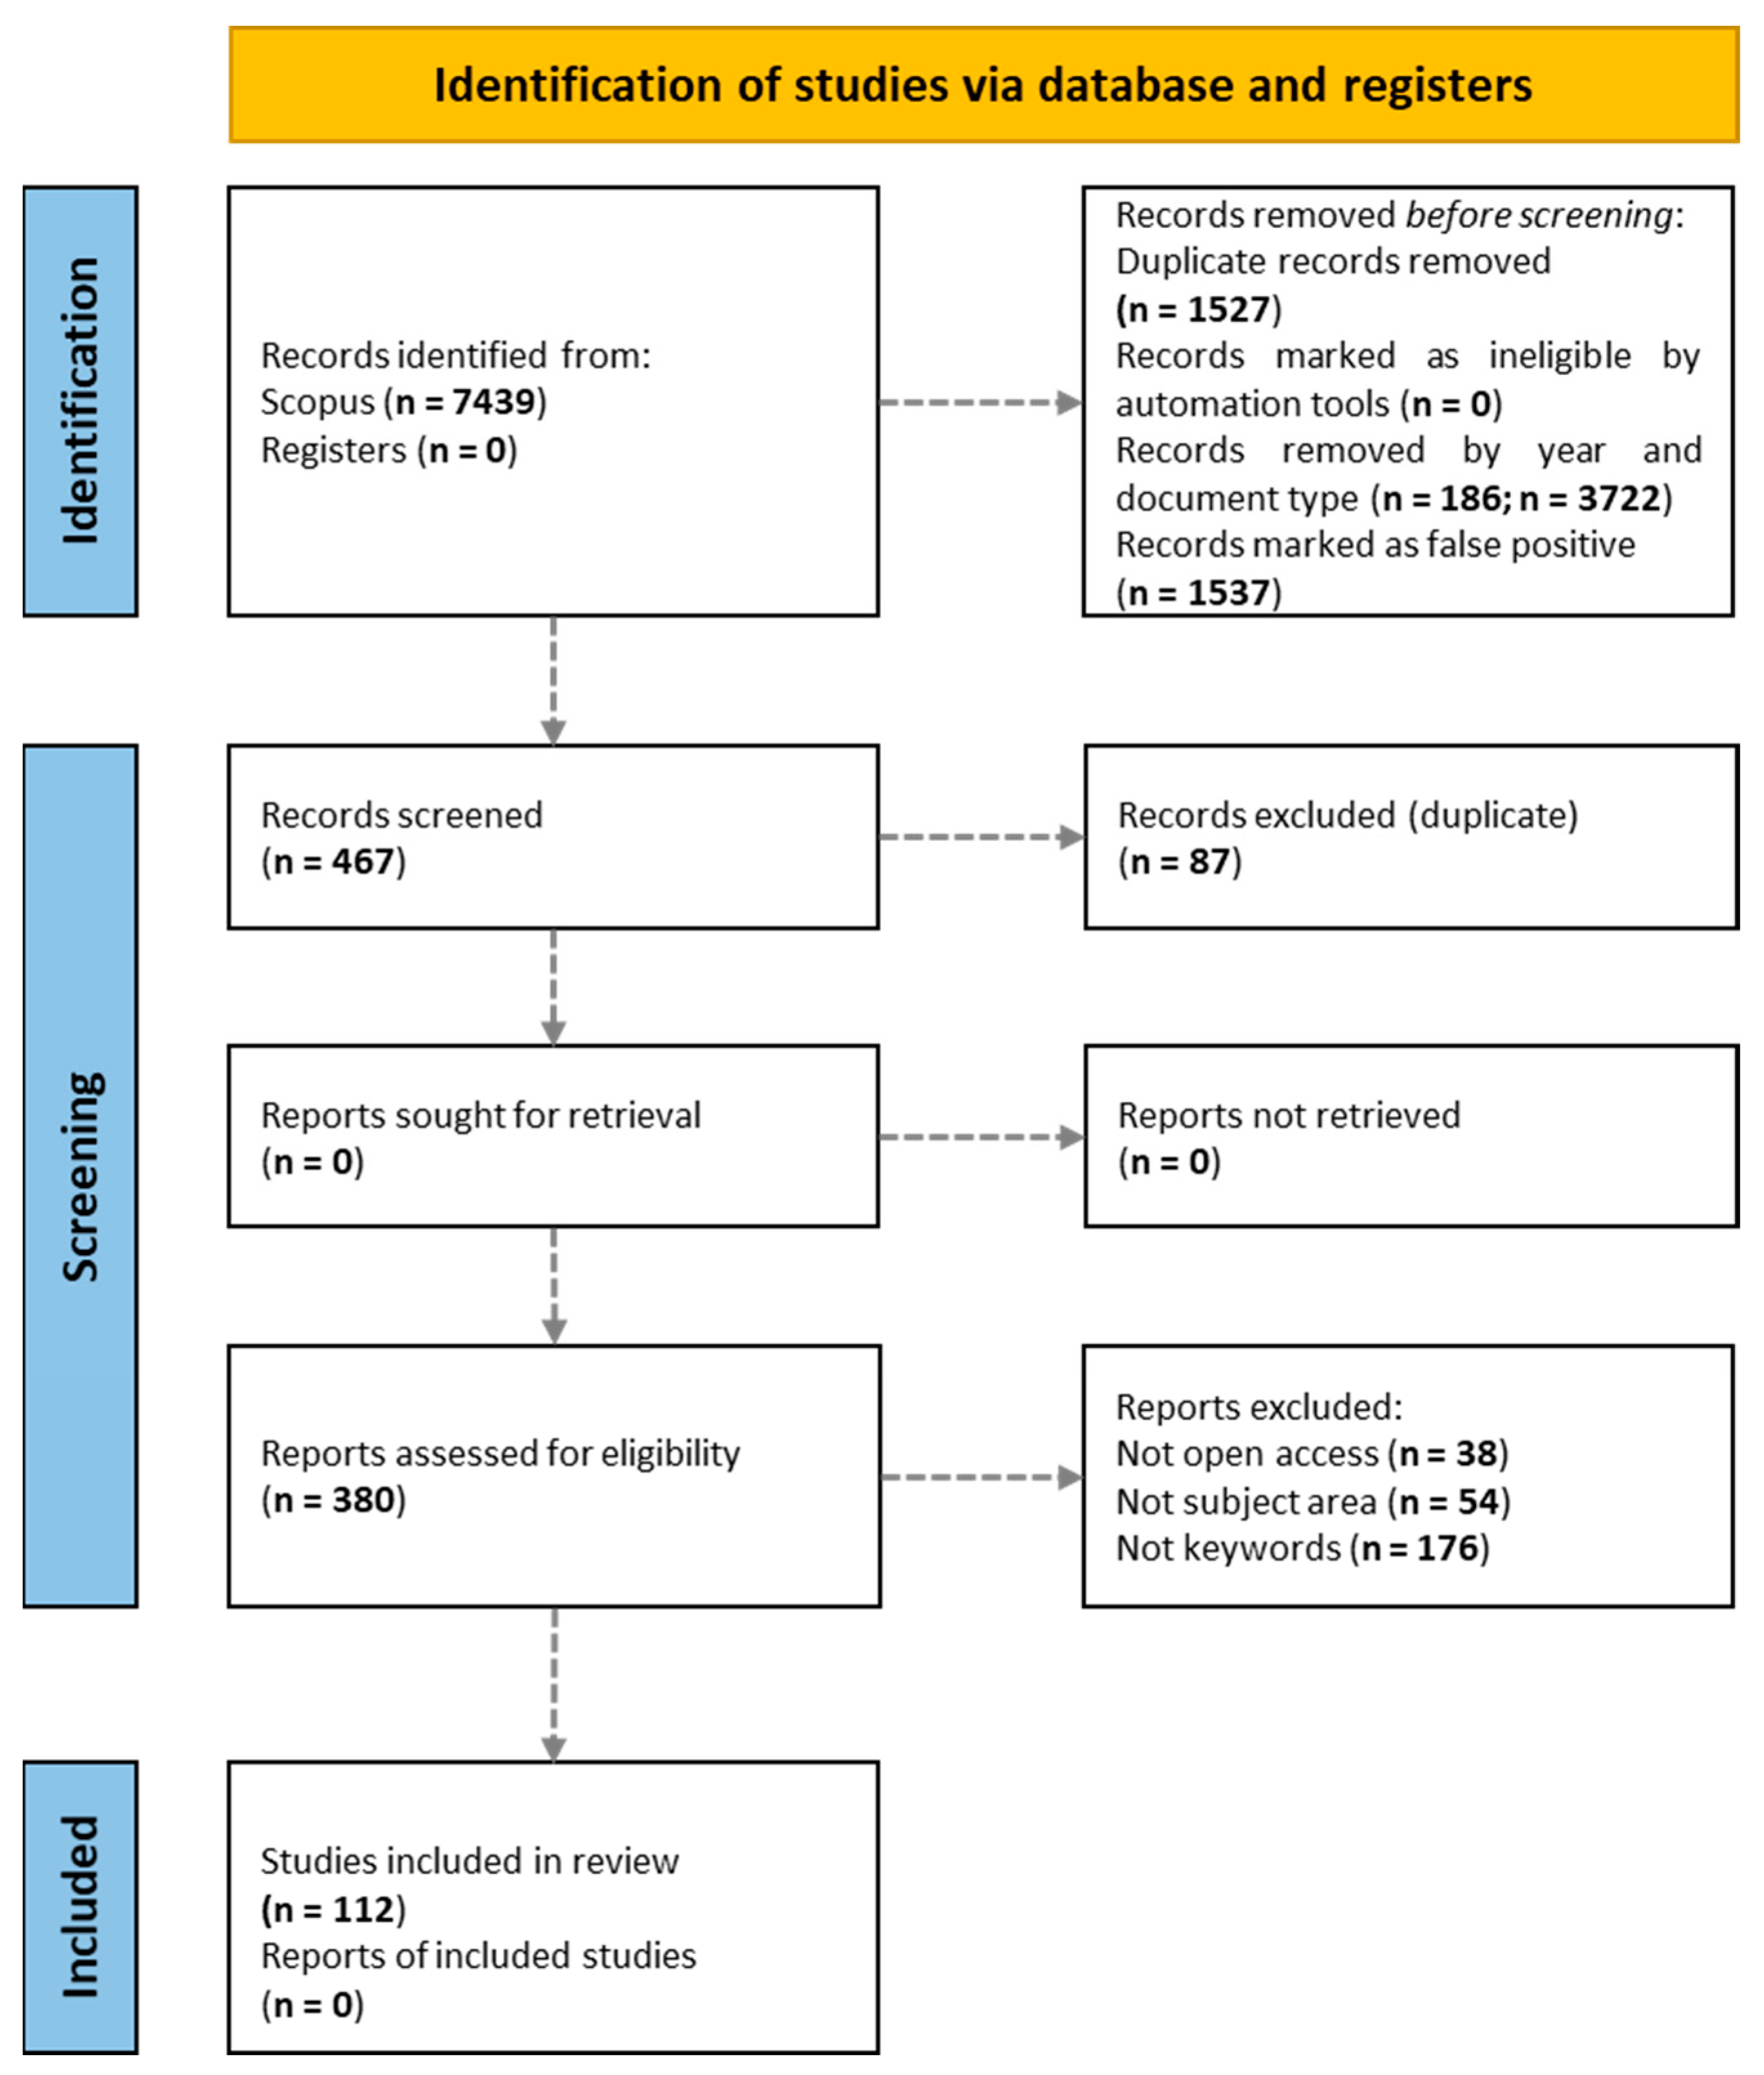
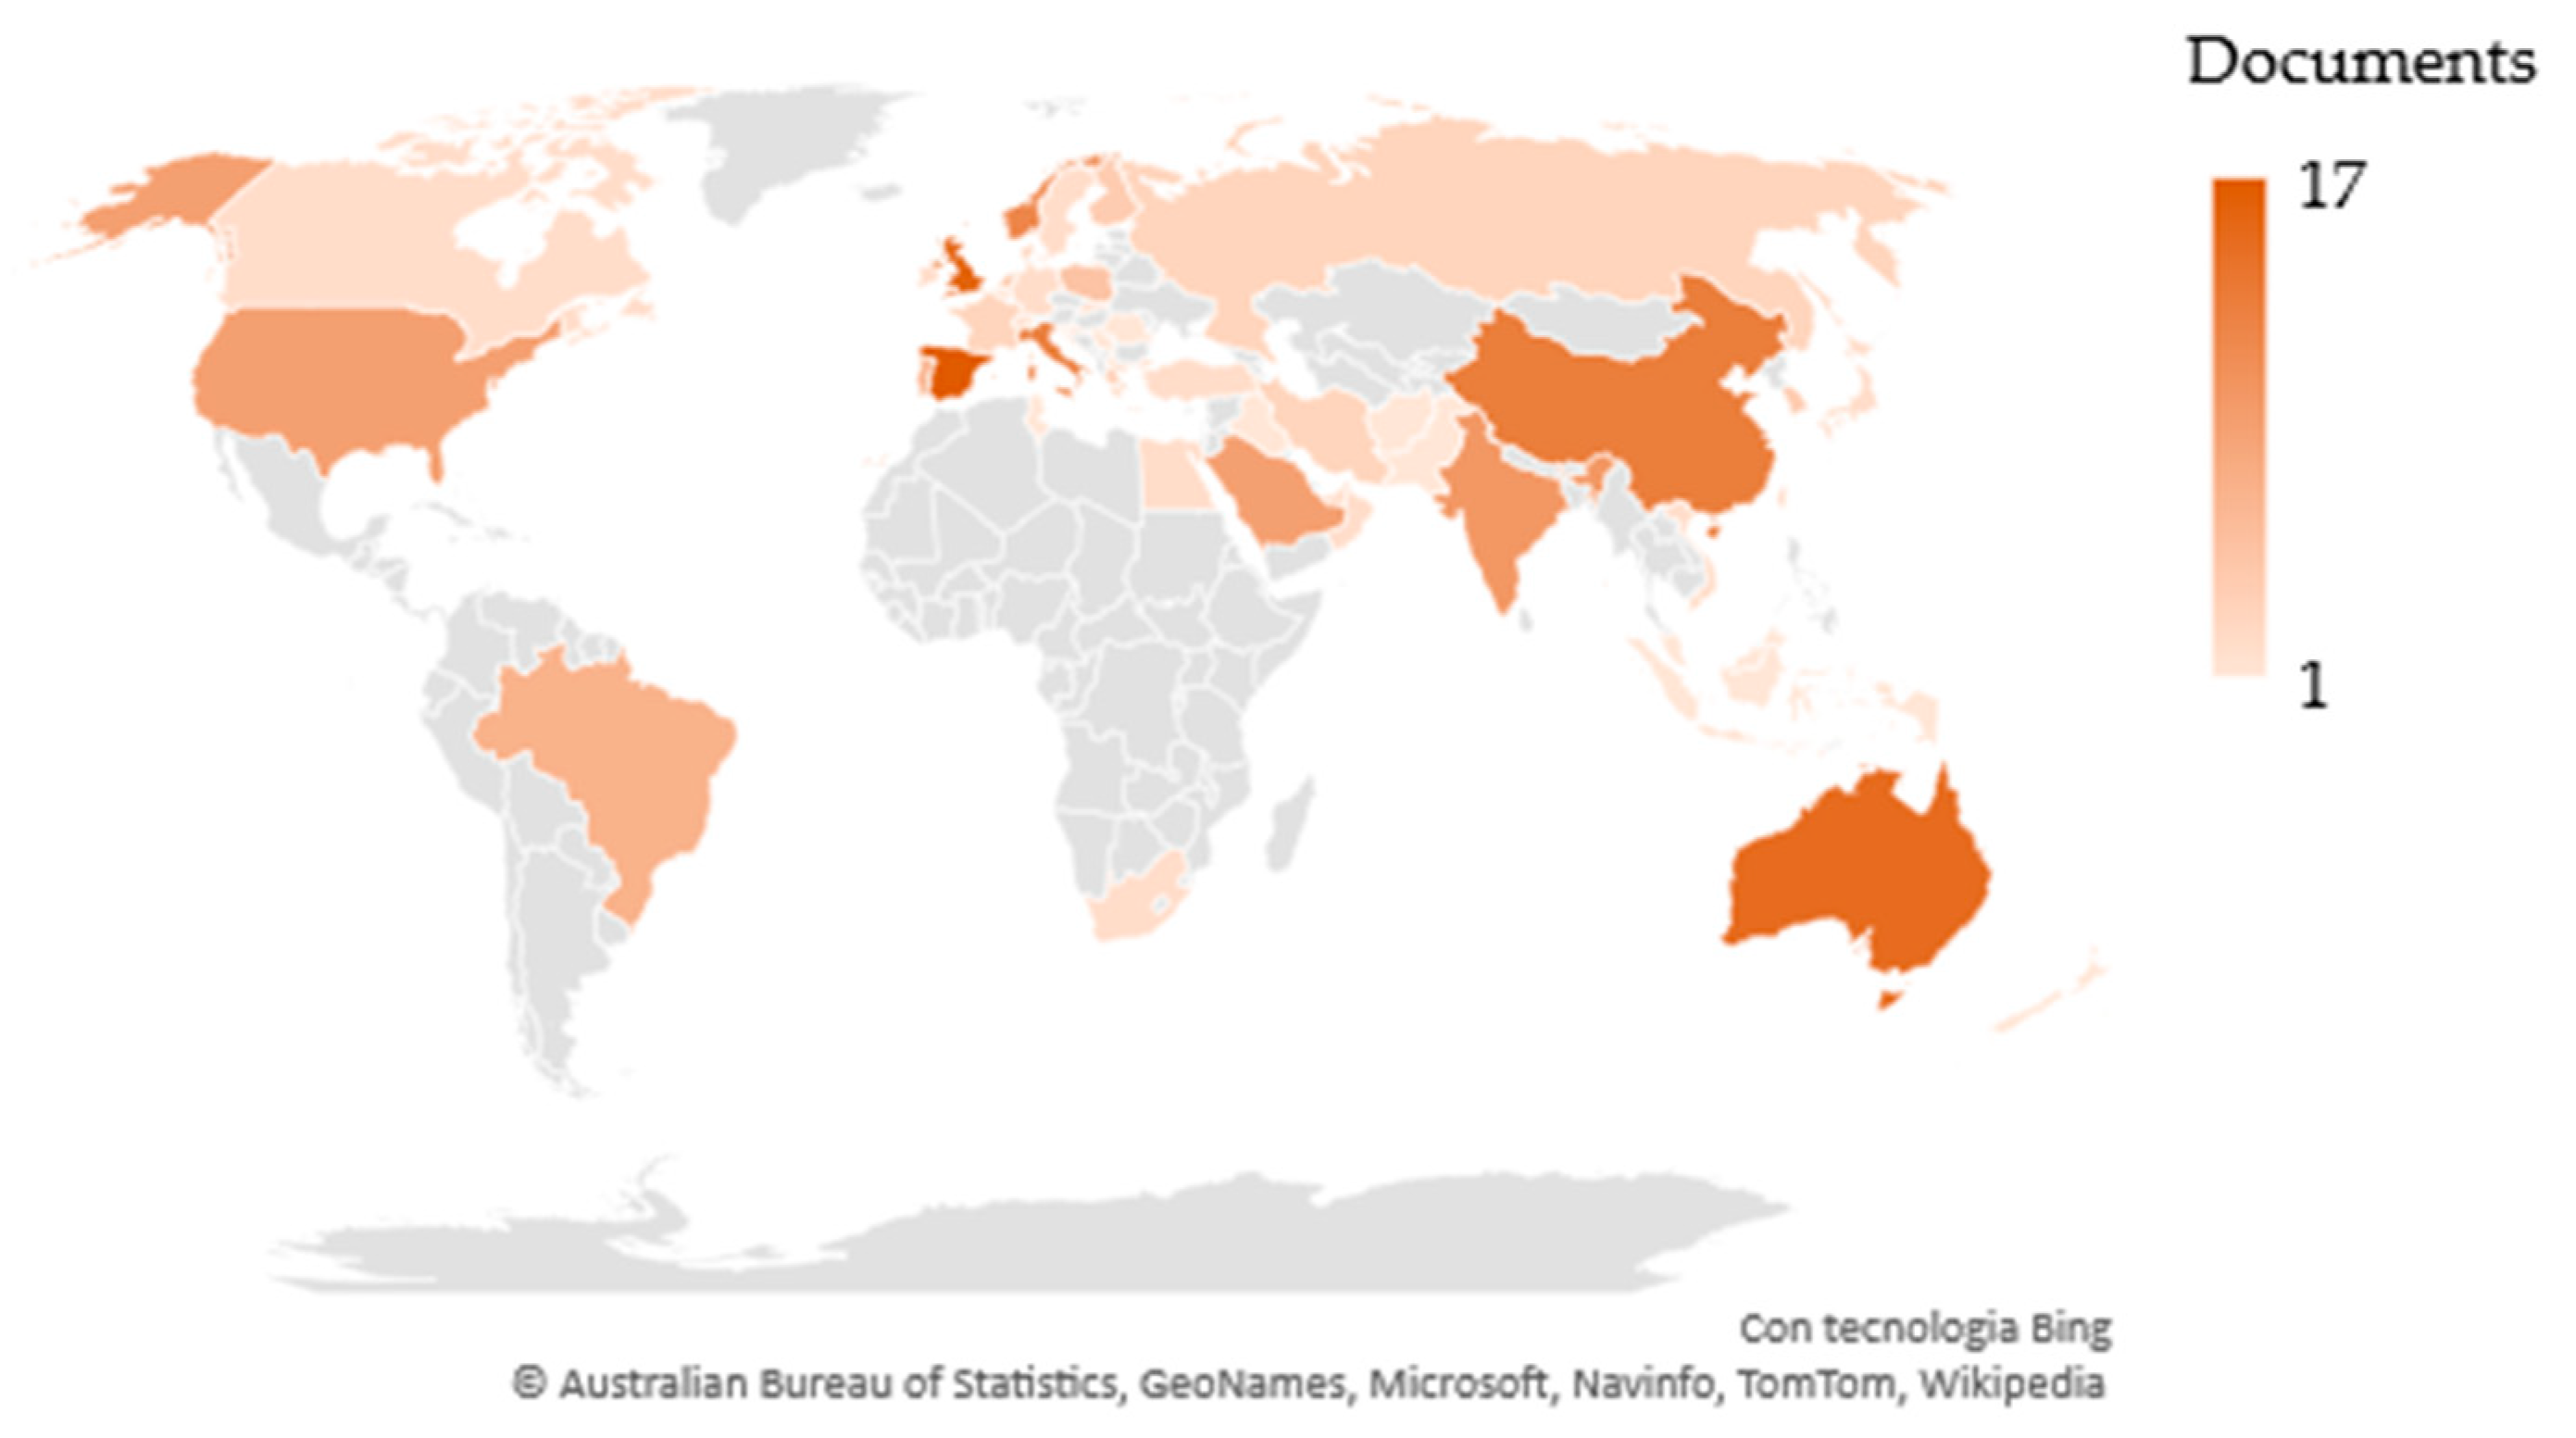
2.2.2. Database and Exclusion Criteria for Literature Searching

The search started by choosing the keywords appropriately. They were combined, generating eight search queries using the Scopus database. Scopus is one of the largest and most reliable databases for academic literature. It contains over 40,000 titles from over 10,000 international publishers, and nearly 35,000 of these publications are peer reviewed. Scopus covers various formats in the fields of science, technology, medicine, social sciences, and the arts and humanities. The choice of database is based on potential: Scopus is a carefully selected collection that offers users the most indexed and influential scientific information. A further choice criterion is based on the need to consult more recent sources. Indeed, the publications are updated daily. Therefore, users are given access to a large volume of more recent information. This allows them to keep track of current trends and to find colleagues for joint research. In addition, Scopus has special tools that allow the researcher to deepen the field of research, data analysis, and the monitoring of link-usage frequency. The research was carried out taking into consideration only the primary documents. In fact, Scopus proposed the secondary documents, but they were not indexed for three possible reasons:
  • They were retrieved from references or citations of documents covered by Scopus;
  • Scopus was unable to match documents with certainty because of incomplete or incorrect data;
  • Lack of content.
In order to comply with the inclusiveness criterion, the queries used included the AND operator and the OR operator. Since the interest is aimed at the literature focused on the factors contributing to the implementation of Society 5.0, the following combinations were chosen:
  • Society 5.0 AND Industry 4.0;
  • Industry 5.0 AND Future Development;
  • Industry 5.0 AND Business Model;
  • Smart City AND Sustainability AND Future Development;
  • Smart City AND Sustainability OR Future Development;
  • Smart City AND Sustainability OR Society 5.0;
  • Society 5.0 AND Sustainability OR Smart City;
  • Society 5.0 AND Digitalization.
To obtain the final sample of the documents, three phases were followed. The first phase of the search consisted of the identification of the documents. The global research process led to a sample of 7439 bibliographical records. Society 5.0 is a rather modern development concept based on Industry 4.0. For this reason, the research was carried out in a time frame that started from 2011 (year of the birth of the concept of Industry 4.0) until today. The search per year returned 7253 total documents. Therefore, 186 documents dated out of the decade 2011–2021 were excluded.
Furthermore, the need linked to the objective of the study led the group to limit the research to articles and reviews. Therefore, conference papers, book chapters, and books were excluded, as they are normally considered to be at the frontier of knowledge with less advanced methodological standards [33]. The number of documents excluded by this criterion was 3722. Then, the search criteria, applied by year and type of publication, returned a sample of 3531 documents. Next, the duplicates were removed using the Scopus lists tool. As the maximum limit of documents to be saved in a list is 2000, several lists were cross-referenced, and 1527 duplicates were excluded.
To ensure the relevance of each article, the documents were manually checked by the expert group through the reading of the titles. This allowed the identification and elimination of 1537 false-positive articles (e.g., articles not related to our topic of interest). The end of the identification step allowed a first substantial selection: the number of documents dropped drastically to 467. After identification, the documents were screened. As a result, it was possible to save the documents in a single list. In the screening phase, another 87 duplicates were identified by Scopus and removed from the sample of documents, and 380 eligible documents were obtained. Finally, thanks to the use of Scopus filters, all documents that did not have free access (38 documents), or that had subject areas and keywords not relevant to the research objective (54 and 176 documents respectively), were excluded. In the last phase (inclusion), each excluded article was subjected to the reading of the titles for a double check. Therefore, the final sample obtained was made up of 112 documents.
To summarize the process that led to the construction of the sample of documents, a process flowchart is presented in Figure 2.

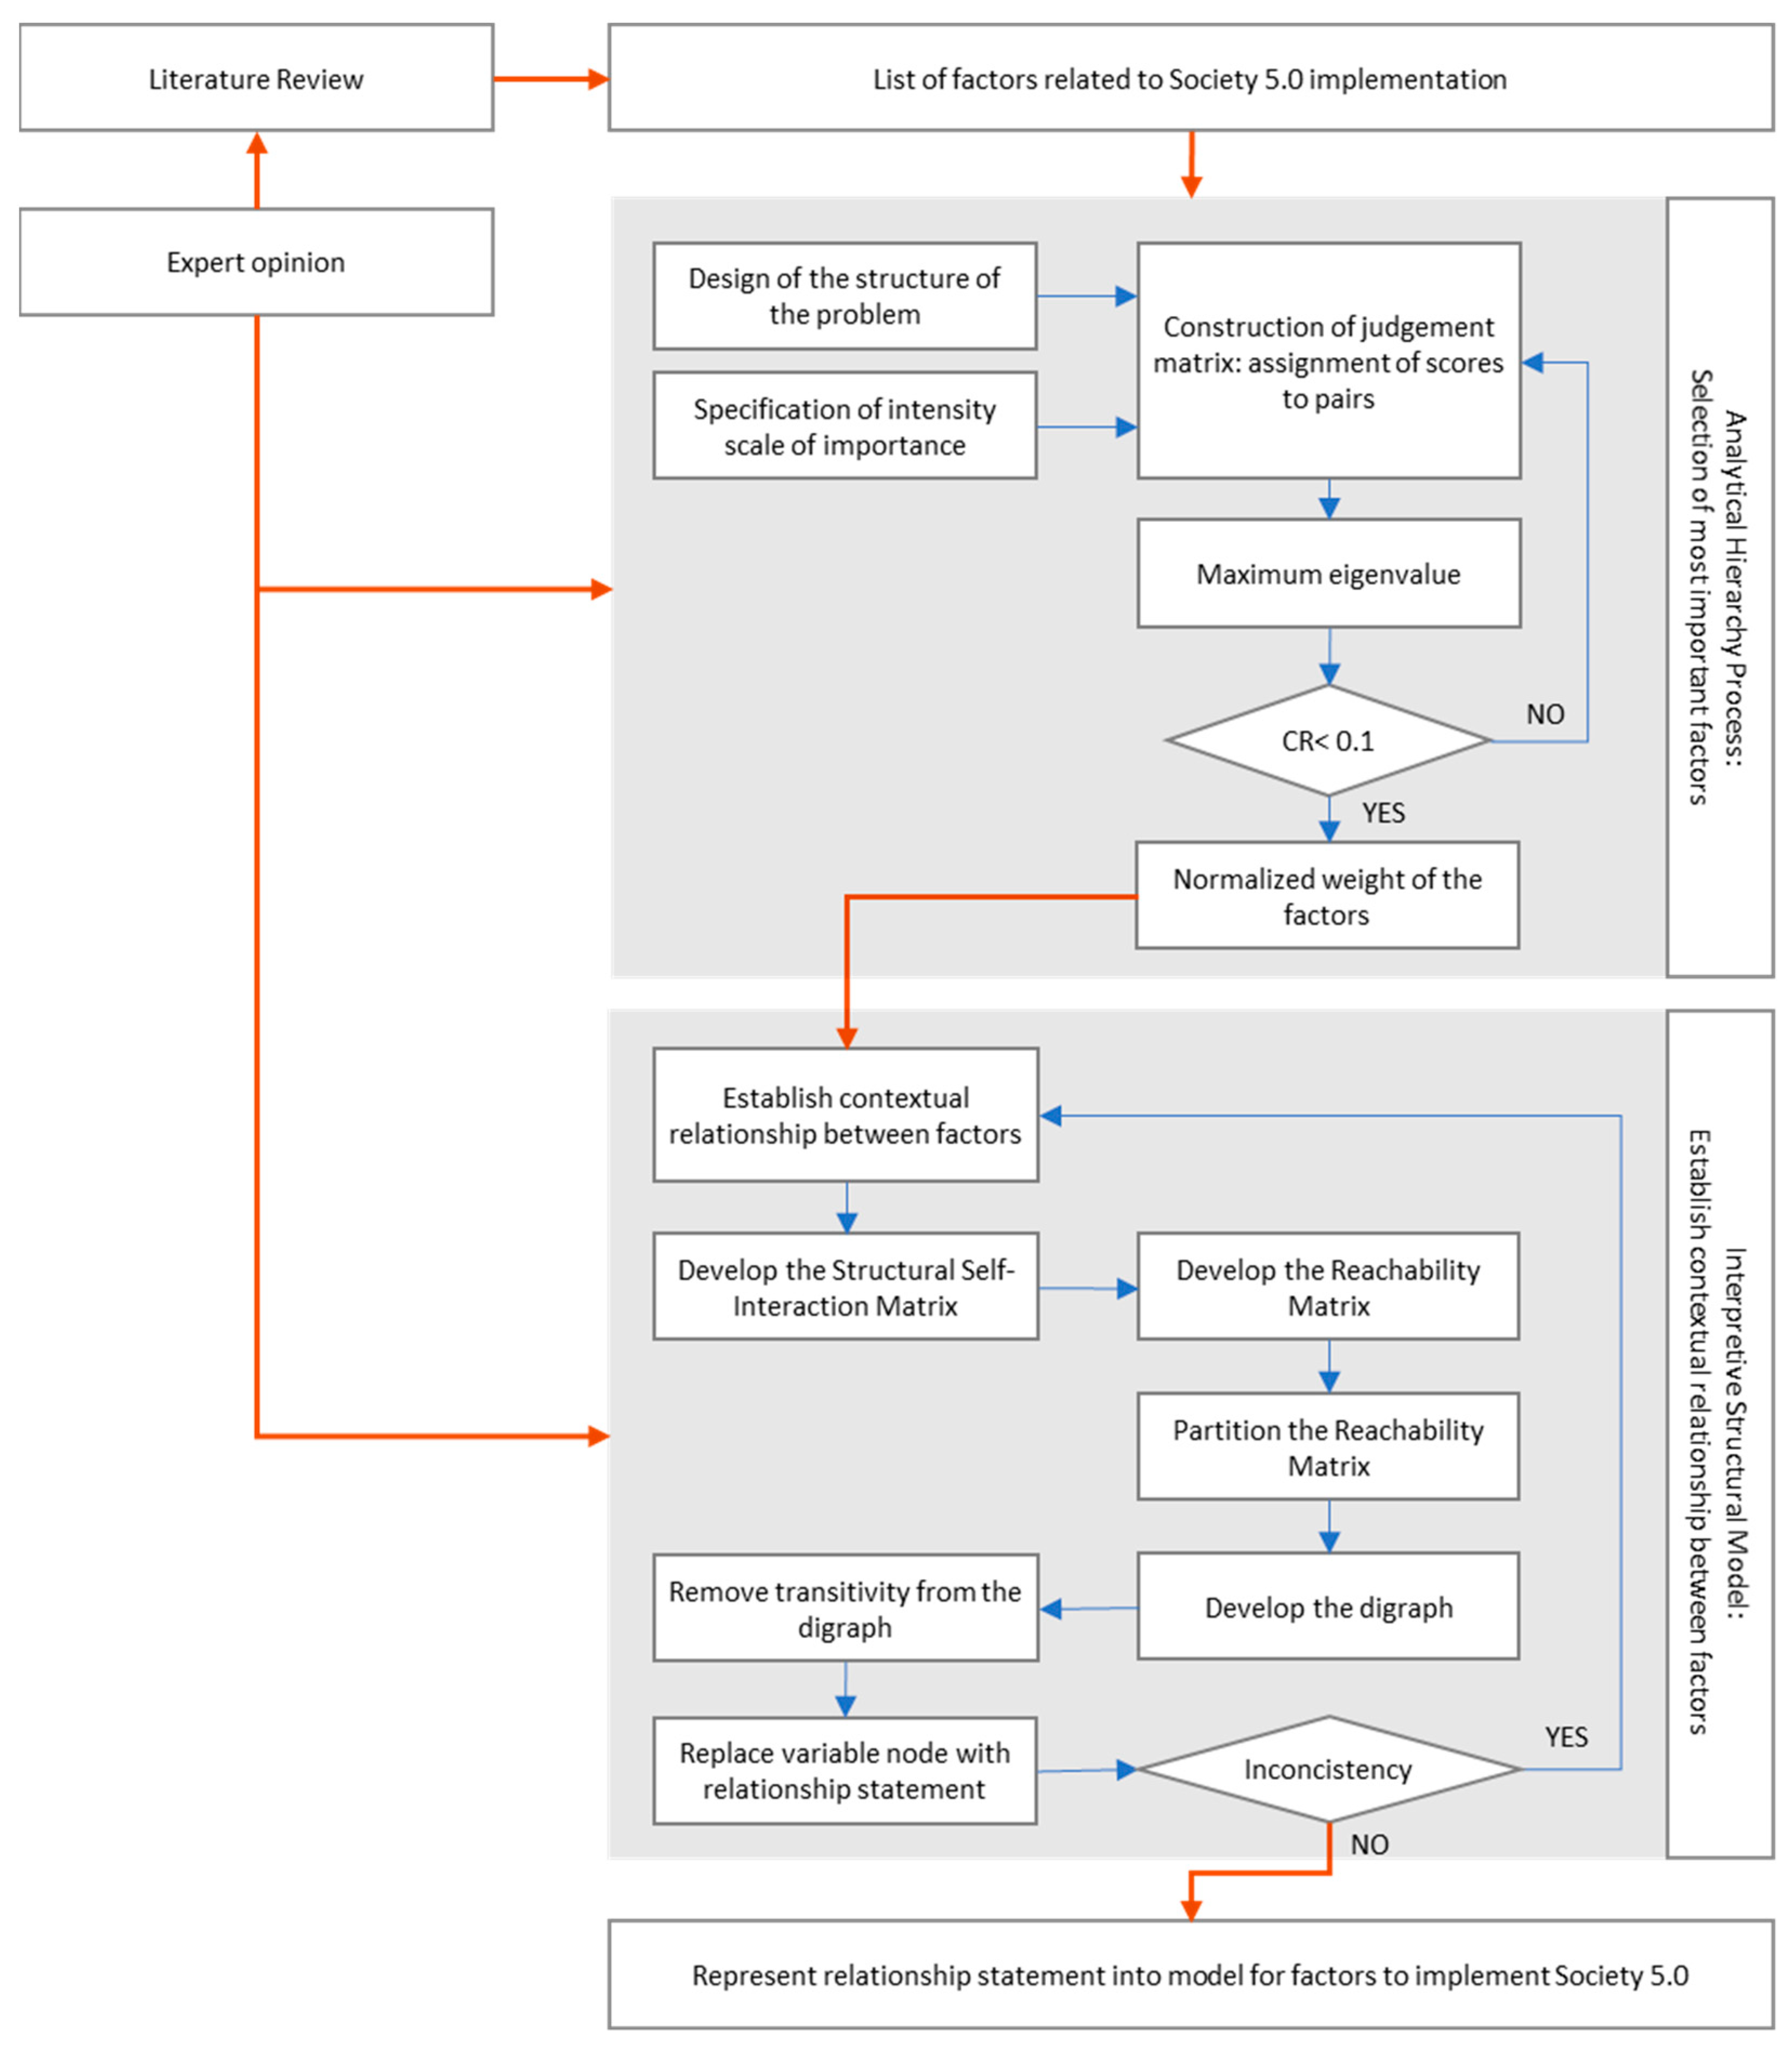
2.3. Step 2: Analytic Hierarchy Process Analysis

The literature review allowed for the extraction of a number of factors, which will be discussed and presented in Section 3.3. However, not all of them are equally relevant to the move to Society 5.0. For this reason, the analytical hierarchy process (AHP) method was applied, through which the most influential factors were appropriately selected by the group of experts mentioned above.
The AHP methodology, developed by Saaty [34], is an effective tool for evaluating the criteria that influence a problem in intuitive decision-making environments. The methodology allows for the comparison of several alternatives in relation to a plurality of criteria (quantitative or qualitative), and for the obtainment of an overall evaluation for each of them. The criteria (and any subcriteria) effective on the problem are modeled according to a multilevel hierarchical structure. The AHP has a simple and easy-to-implement solution process for evaluating these criteria collectively and qualitatively. There are basically four implementation steps used in the solution process of the AHP method [35]:
  • Phase#1. First of all, the decision problem and the objective to be achieved are defined. Then, the criteria that influence them are determined. At the same time, a hierarchical structure of the problem is formed consisting of several levels: purpose, criterion, possible subcriterion levels, and alternatives.
  • Phase#2. The AHP determines the importance of the weights of the criteria by binary comparisons. When the binary comparison is performed, the scale created by Saaty [34] is used. The scale goes from 1 to 9, where 1 indicates an equal importance between the elements compared, and 9 indicates the maximum weight of importance of a specific element. The meaning of the other scale values is shown in Table 1.
  • Phase#3. The next stage of AHP is the creation of normalized arrays. The normalized matrix is obtained by dividing each column value by its respective column sum. Then, the average of each sequence value is taken, representing the weights of importance for each criterion.
  • Phase#4. After obtaining the weights, the consistency of the comparison matrix must be considered. If the comparison matrix is not consistent, the resulting weights cannot be used. Considering A, the comparison matrix, and w, the weight matrix, the maximum eigen value (λmax) is calculated such that Aw = λmaxw. Now it is possible to calculate the consistency index (CI) through the equation CI = (λmax−n)/(n−1), where n corresponds to the order of the pairwise comparison matrices. After calculating the CI value, the random index (RI) is considered. This value is tabulated for different dimensions of the array. The ratio between the CI and the RI determines the consistency ratio (CR). If the CR is less than 0.1 (10%), it means that the application is consistent. If this value is exceeded, then the judgments should be revised again.
AHP can be carried manually or through the use of a tool. To facilitate the implementation of the methodology, SuperDecisions® software was used by the expert group.

2.4. Step 3: Interpretative Structure Model

ISM is a method that breaks down complex systems into different subsystem elements and transforms them into multilevel models (Watson, 1978). The approach is systematic in nature. It analyzes the interrelation properties between various factors [36,37]. With this method, it is possible to transform unclear or poorly articulated models into visible and well-defined models [38].
Specifically, the ISM methodology consists of three fundamental parts, which are:
  • Interpretative—The relationships between the elements are based on the judgments of a group of experts in the selected field;
  • Structural—the overall structure based on relationships is extracted from the complex set of variables;
  • Modeling technique: the result is a diagram model based on the relationships and the extracted structure.
ISM has enormous potential, as it can be applied in various fields [39]. The ISM method is usually divided into the following steps [36,40]:
  • Phase#1: The factors (also called drivers) that influence the implementation of the Society 5.0 are listed.
  • Phase#2: Determine the interrelationships between the factors identified in Phase#1. The interrelationships are chosen in the opinion of the expert group. The interrelationships are used to build a structural interaction matrix (SSIM).
  • Phase#3: Develop a reachability matrix from the SSIM and check the matrix for its transitivity. Transitivity states that if a variable, A, is related to B, and B is related to C, then A is necessarily related to C.
  • Phase#4: Divide the reachability matrix into different levels.
  • Phase#5: Plot a direct graph between the variables based on the relationships presented in the reachability matrix, and then remove the transitive links.
  • Phase#6: Convert the resulting digraph to an ISM by replacing the variable nodes with statements.
  • Phase#7: Check for the conceptual inconsistency of the ISM model and make any necessary changes.

3. Descriptive Analysis

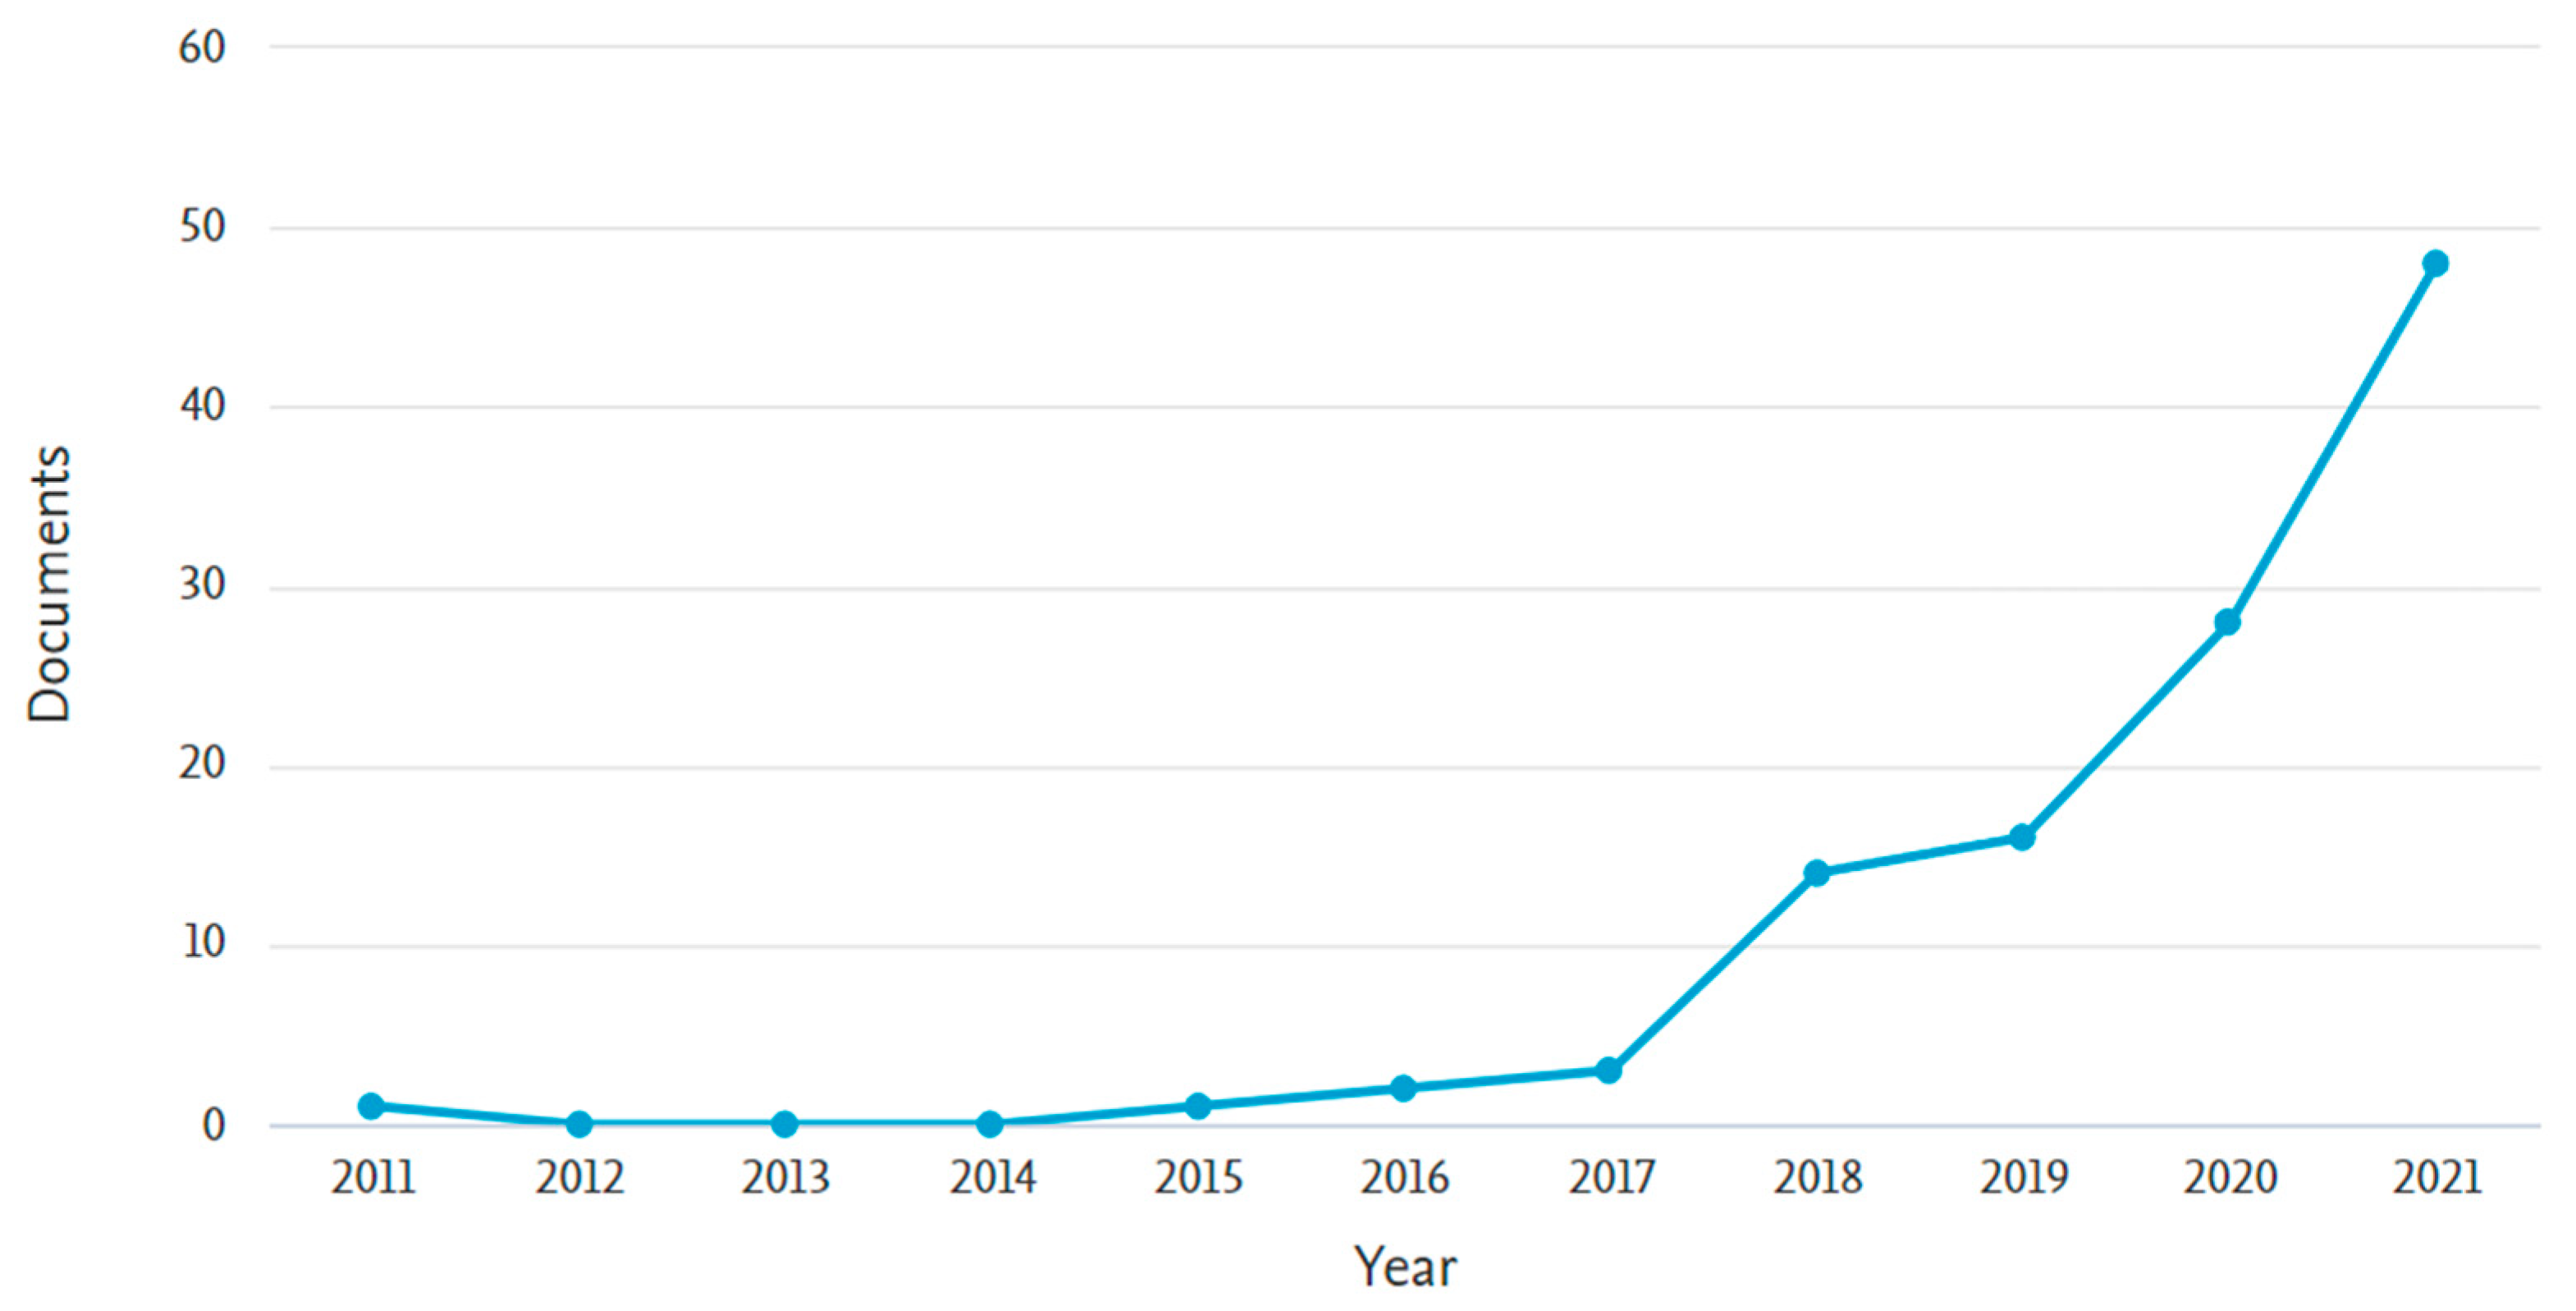
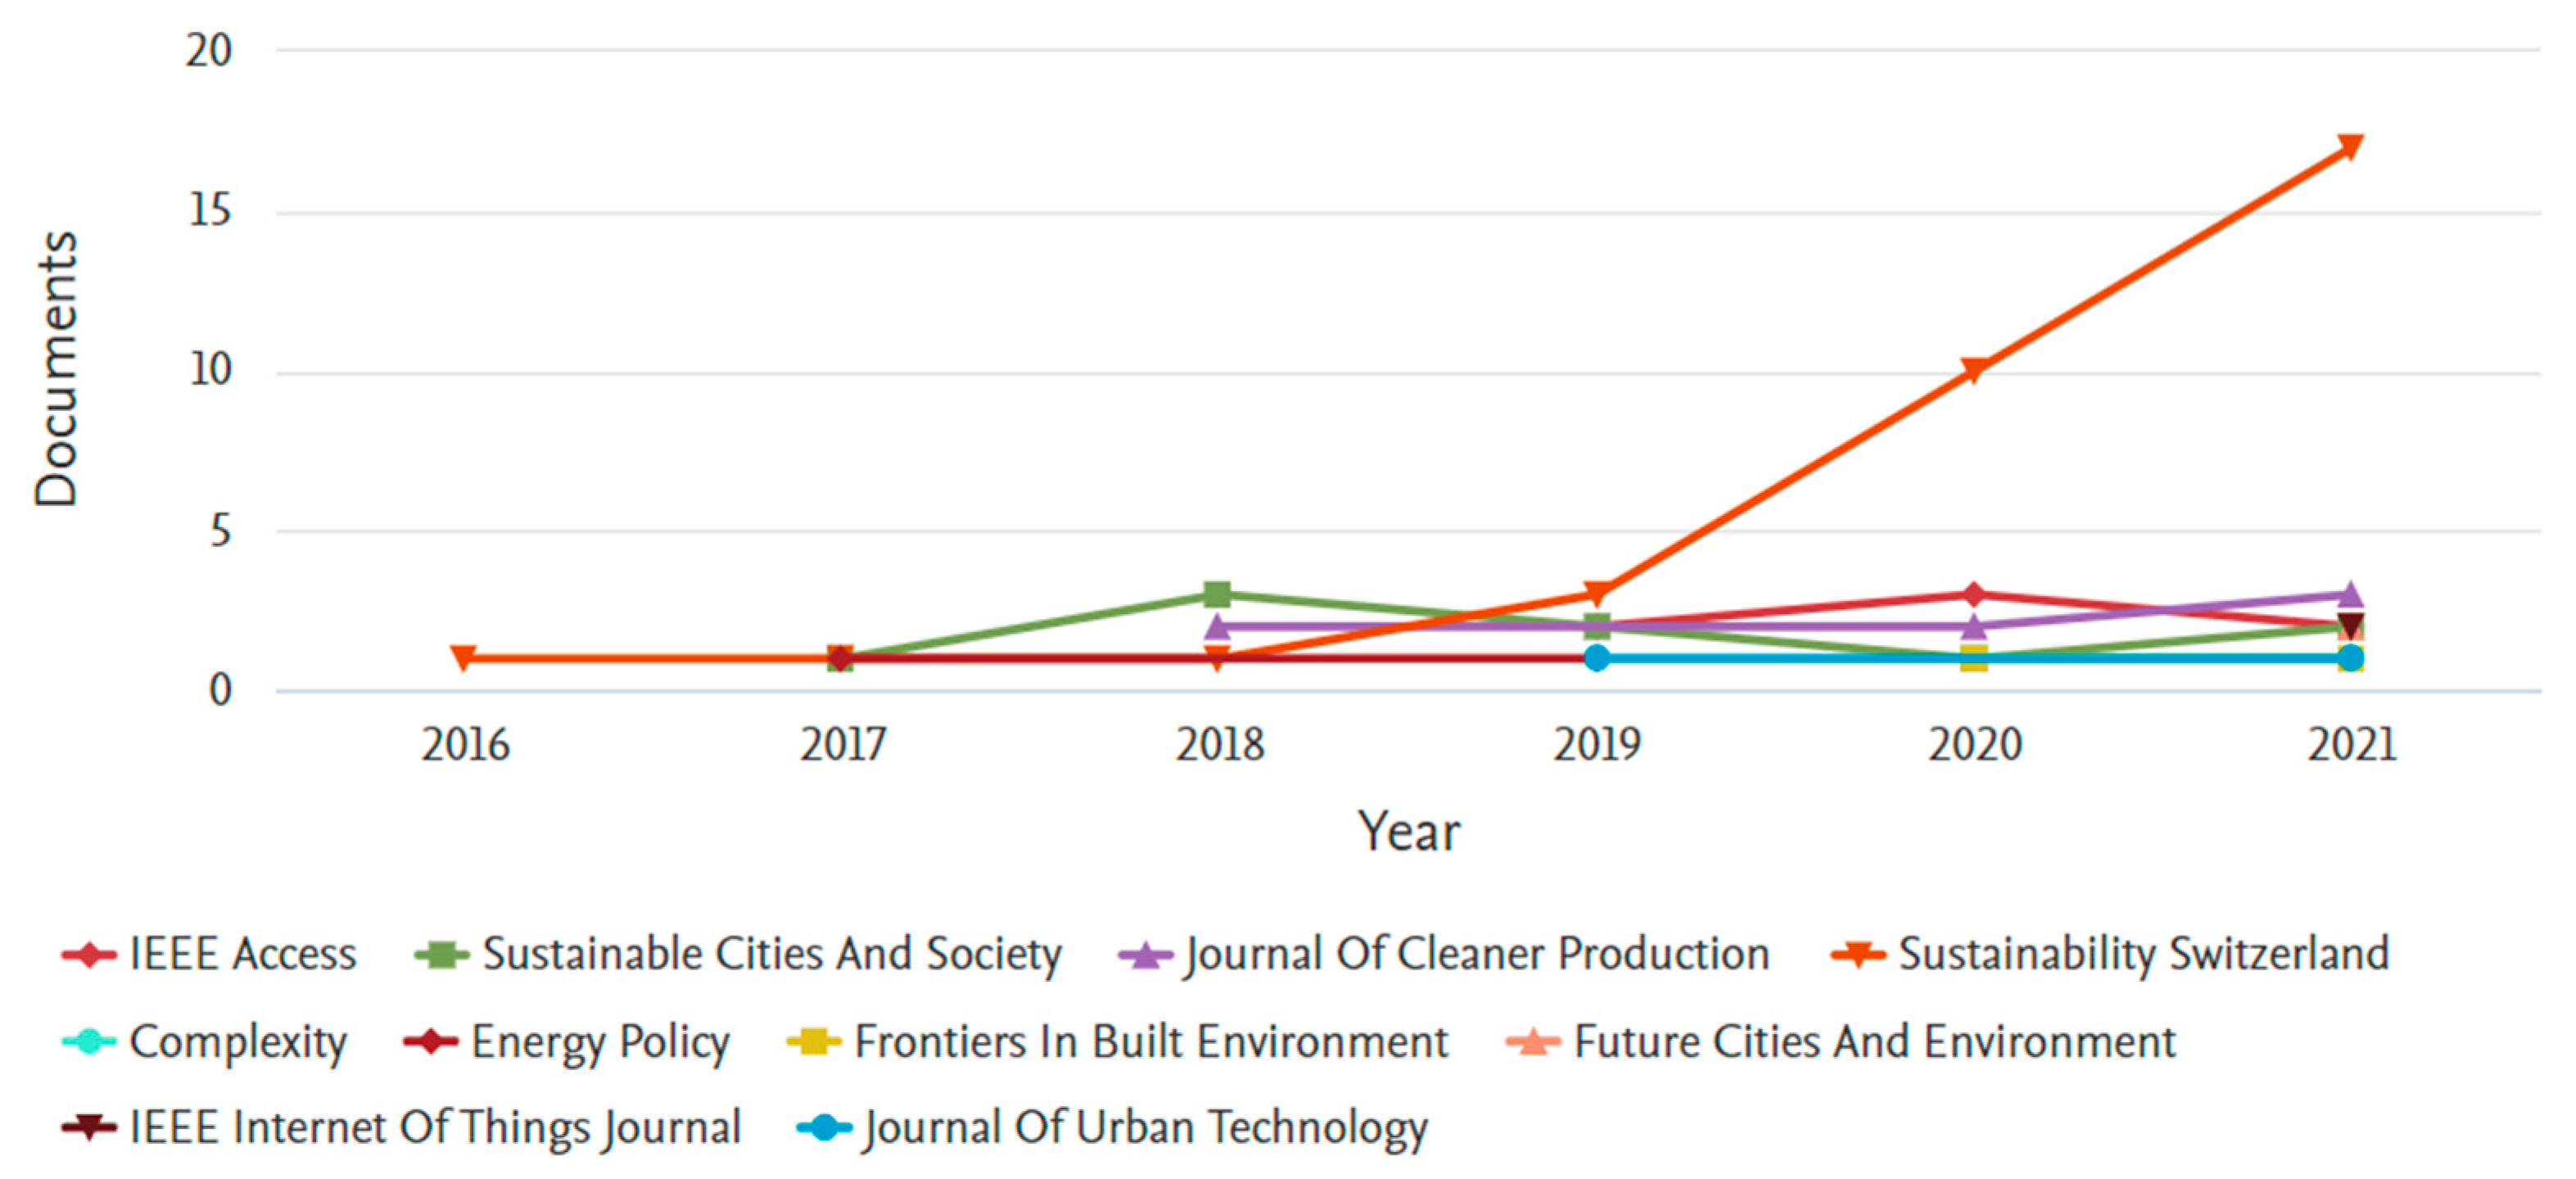
3.1. Findings of Literature Review Research

As previously mentioned, the literature review was conducted by the academic and sustainability experts of the decision-making team.
According to the research methodology (Section 2.1), the literature review returned 112 articles published in a total of 45 journals in the reference period from 2011–2021. The first seven journals collect 60% of the documents. In other words, they are those in which the largest number of articles have been published on the subject of interest for this study. Specifically, they are:
  • Sustainability Switzerland
  • Sustainable Cities and Society
  • IEEE Access
  • Journal of Cleaner Production
  • Energies
  • Cities
  • International Journal of Information Management
By evaluating the above-mentioned journals, it is possible to deduce that the interest in research on this subject is more prevalent in journals related to sustainability (in its environmental, cultural, economic, and social meanings) and innovation.
Analyzing the years of publication, it emerged that the research has been more concentrated in the last five years. The largest number is recorded from 2017 to 2021, with an increase in the number of publications.
The maximum peak was reached in 2021, with 48 publications. Crossing the data of the years of the publications with the journals revealed that the Sustainability Switzerland journal is the journal with the highest number of papers identified concerning the study. Overall, 33 documents were identified in the Sustainability Switzerland journal, 17 of which were published in 2021. The remaining publications were divided between various journals. Figure 3 shows the distribution of documents over time. Figure 4 shows the publications, per year, by journal. In particular, Figure 4 shows the journals in which at least two documents are published.
Figure 3 and Figure 4 show that there is growing interest among researchers on the subject. The observation period may be divided into three periods. The first period (2011–2017) is relatively long. It can be defined as “early emergency”, as a limited number of publications were found. The second period (2017–2019) can be described as “take-off”. Although there are some fluctuations, there is a peak in 2019. Finally, the third and last period (2019–2021) is one in which there is more intense research activity, which has become much more important than in the other years.
Finally, a consideration of publication by country can be made. Figure 5 shows that research is concentrated in Europe, with the publication of 50% of the total documents. On the Asian continent (China, Hong Kong, South Korea, Russian Federation, Taiwan, and Indonesia), 13% of the documents were published. The rest of the documents are distributed in other countries, as shown in Figure 5.

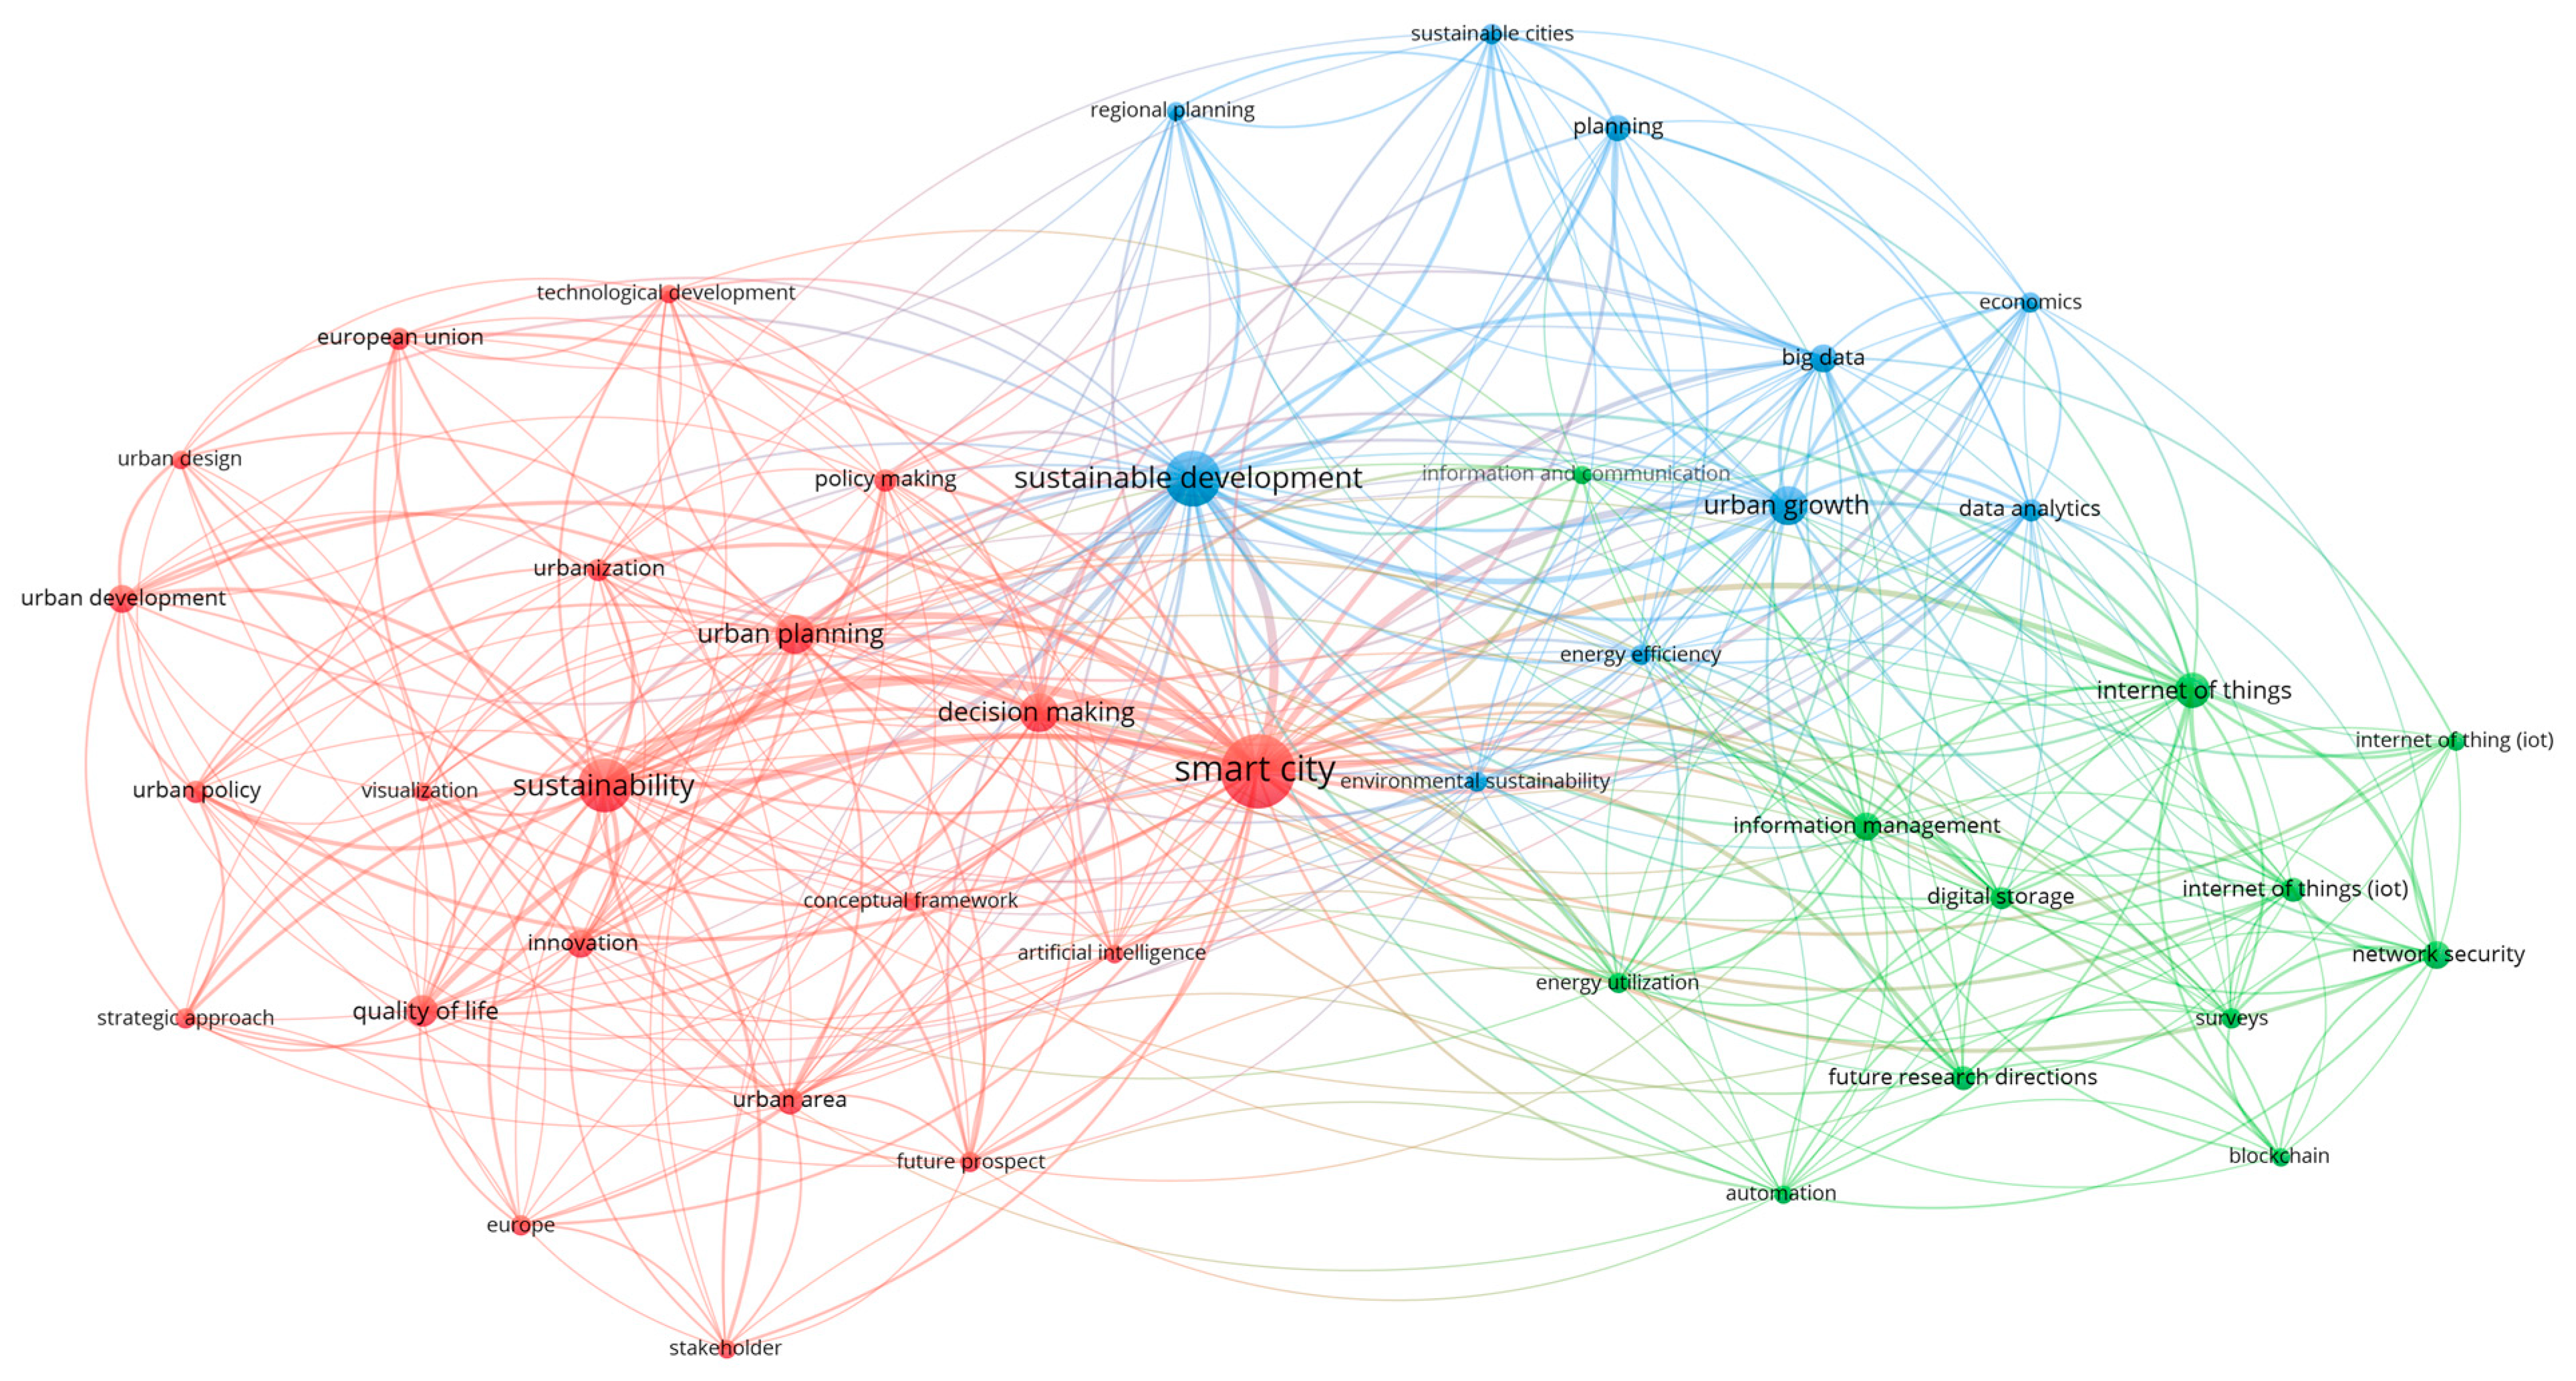
3.2. Conceptual Framework of Literature Review

In order to collect the factors enabling the transition to Society 5.0 from the literature, the articles were analyzed through VOSviewer. VOSviewer is a software tool for the construction and visualization of bibliometric networks. Among its features, there is also the text mining operation. It can be used to construct and visualize the co-occurrence networks of important terms extracted from a body of scientific literature. Therefore, a keyword analysis was carried out through the software. The total number of keywords identified was approximately 780, which included the keywords assigned by Scopus. This choice was based on the fact that Scopus integrates the keywords already assigned by the authors with further keywords. The keyword analysis considered co-occurrence, which is how many times an entire keyword repeats. The maximum co-occurrence value calculated by VOSviewer is 38. A minimum of five keyword occurrences was chosen, returning three distinct but related clusters, and 43 keywords (Figure 6). Figure 6 shows the network of links between the main keywords.
The colors of the circles represent the cluster type of a single keyword. Specifically, the color was determined by its weight/meaning: the colors vary from yellow (very low score), blue (low score), and green (medium score), to red (high score).
In addition to the color of the clusters (Figure 6), the size of the keywords is also significant. The sizes of the circles represent the frequency of the occurrences of the single keyword. Each cluster contains a large element, which means that the frequency of occurrence for the specific keyword was very high. VOSviewer did not create a yellow cluster. This means that there were no keywords with very low weight. Therefore, all keywords vary from low to high weight. All clusters also contain small elements, and these represent the minimum occurrence value, which is 5.
Another element that VOSviewer highlights is the total link strength of a particular keyword with the other keywords. The total link strength indicates the number of publications in which two keywords occur together. It is represented by the distance and thickness of the lines connecting the keywords. Therefore, shorter distances between elements indicate that there is a strong relationship, as do distances represented by thicker lines. This means that keywords close to each other, or keywords linked by thick lines, occur more frequently, while a large distance or thin link between two keywords indicates that they do not occur. The color of the clusters each represent a specific topic. However, it should be noted that each cluster is connected to all the others. As shown in Figure 6, sustainable development is the keyword with the highest occurrence in the blue cluster. It has an occurrence equal to 41, a total link strength of 178, and 411 links with other keywords. This means that sustainable development is a strong driver in this cluster. The blue cluster also contains keywords related to the concepts of environmental and economic sustainability, urban growth, and Big Data. Big Data is considered an enabling factor [28,41,42], but the articles included in this cluster also focus on the use of the other enabling technologies of the Industry 4.0 concept that promote sustainable development. Technology is used to promote urban growth, and for planning and implementing all those economic measures in order to achieve sustainable development. Indeed, the concept of sustainable development is linked to economic development [43,44] and is compatible with the protection of the environment [45] and free goods for future generations [20,42,46]. Urban growth is favored by the increasingly important use of data [41]. ICT and cloud computing [13,23,30,47] have the ability to use IoT technologies [19,28,46,48] and Big Data [24,28,49] to generate, process, analyze, and exploit urban data. In this way, it is easier to make decisions that accurately address the problems [25,45,50], issues, and challenges related to sustainability [51,52,53] and urbanization [15,16,54].
The second cluster created by VOSviewer is the green cluster and it is characterized by an average importance score. Figure 6 shows that the nodes of the green cluster are approximately the same size. This means that all of the nodes have the same importance. However, the Internet of Things keyword also appears three times. This is because Scopus assigned this keyword to the articles in a different form. Therefore, VOSviewer has recognized it as three distinct keywords. The Internet of Things is a technology that allows for the connection between different objects whose operation is based on the Internet, with the aim of forming an intelligent environment. These devices are based on standardized communication protocols, which allow for the sharing and exchange of information across heterogeneous platforms. Consequently, the IoT improves the interactivity and efficiency of critical infrastructures, such as those used in transport [31,45,55], in security [19,56,57], in education [16], and in healthcare [20,58]. Furthermore, IoT allows physical objects to mimic human characteristics, such as sight and hearing [59,60], the decision-making process for communicating [25,61], and the sharing of information and the coordination of actions with each other [23,46,48]. These abilities turn simple objects into intelligent devices that can operate in real time [29,31], adapt to circumstances, and function without human intervention or supervision [59,62]. Sensors and intelligent actuators are already implemented [27] and give rise to a huge amount of data collection. The data collected must be stored, analyzed, and processed before being presented in a useful form.
The last cluster is represented in red and is associated with a high importance score. Figure 6 shows that the red cluster is the largest. In other words, it is made up of a higher number of keywords than the other clusters and even the nodes are larger in size. The largest node is smart city. It is also at the center of the graph, which means that its connection to all clusters is equally verified. The concept of sustainability also appears again in this cluster. Smart cities realize the main statement of Society 5.0 [2]. They are defined as a set of urban planning strategies aimed at optimizing and innovating public services [63]. This makes it possible to relate the material infrastructures of cities [52] to the human, intellectual, and social capital of citizens, thanks to the widespread use of new technologies of communication [27,64], mobility [65,66], the environment, and energy efficiency [23,25,67,68,69]. The ultimate goal is to improve the quality of life and meet the needs of citizens, businesses, and institutions. Notice how the smart city concept includes concepts whose keywords have been assigned to other clusters. For example, energy and environmental efficiency belong to the blue cluster (Figure 6). Through the graph in Figure 6, it can be seen that technology is not the only factor in a smart city. Technology helps achieve social, environmental, economic, and cultural progress [45,70,71,72,73], but there are other factors that contribute to the implementation of smart cities. In particular, citizens play an important role [9,25]. Therefore, the quality of social interaction, integration with public life, and openness to the world are factors to be taken into consideration. Moreover, with regard to the management and operational aspects, a city is smart if it is managed in an intelligent, efficient, and sustainable way [26,42]. Furthermore, smart cities balance the needs of citizens’ economic well-being and their quality of life [51,74]. The theme of sustainability is repeated, but it is linked to the dynamics categorized through the participation of citizens, companies, and organizations [18,75]. Technology cannot bring about change by itself. Instead, smart cities should focus on how technology can become a vehicle for improving citizens’ lives. The keywords identified and categorized by VOSviewer provide the search direction for the factors that are intended to be extracted from the literature as drivers for the realization of Society 5.0.

Classification of Factors Enabling Society 5.0

For the purpose of the study, a number of factors were derived from the literature. To facilitate their understanding, they were divided into six macrogroups, each of which covers a certain topic.
The first group of factors concerns the objectives of Society 5.0. Indeed, the main purpose is to create a society in which various social challenges can be solved by incorporating the innovations into every sector and social life [2,52]. Among the objectives is healthcare which, thanks to technology, can lead to numerous benefits for the population [20,76]. Another objective is mobility, promoting the use of public transport to make transport more readily available [31,62,77]. Mobility is also considered in the context of logistics. Better distribution and logistics efficiency is to be achieved by introducing technological innovations [30,46]. Finally, the infrastructures were set as an additional objective. The deterioration of public infrastructure has created a shortage of skilled labor and an increased financial burden for inspections and maintenance [56,57]. In this sense, the technology provides support to minimize unexpected accidents and reduce the time spent on construction work, while increasing safety and productivity [22,59].
In the second group, the information and production technologies that emerged from the literature review were grouped. They were divided into three subgroups, according to their intended uses. The first subgroup concerns technologies applied to the manufacturing sector, such as 3D printing, robotics, and augmented/virtual reality. This technologies subgroup contributes to improving labor productivity [18,31]. The second subgroup shows the information technologies used for the connection between smart devices, which are sensors, remote controls, and the mobile Internet. The last subgroup specifically concerns information technologies based on Big Data and data processing. Therefore, they are considered to be: simulation; Big Data; data analysis; cloud computing; and the Internet of Things.
The third group was created to include communication strategies for the dissemination of knowledge in the digital Society 5.0. Digital technology, applied both in production and in society, is fundamental in promoting quality of life and sustainability in areas such as the economy, ecology, and social equity [28]. In order for technology to foster change across all sectors, communication as part of the knowledge-building process is essential. An analysis of the literature has allowed us to derive this concept as a driving factor [55,78]. Communication has three levels: horizontal communication between peers (legitimation); transversal communication between science and society (dissemination); and vertical communication (education) [17,45,49,79,80].
The fourth group concerns the concept of sustainability. By virtue of the literature analyzed, it refers to environmental, economic, and social sustainability.
Finally, a key role is played by stakeholders and governance. Stakeholder theory can be applied in the public and private fields [42,46,53,81,82,83]. A first category consists of functional agencies (Chambers of Commerce, health companies, universities, etc.), and controlled and participating companies. A second category consists, on the other hand, of organized groups (trade unions, political parties, mass media, etc.), territorial associations (cultural, environmental, consumer associations, etc.), and of nonorganized groups, which are the citizens and the local community. Stakeholders would normally also include public institutions; however, these have been separated and included in a separate group. In this case, local, national, and international bodies have been included in the governance category.
To summarize the groups, and the factors that compose them, a detailed overview is presented in Table 2.

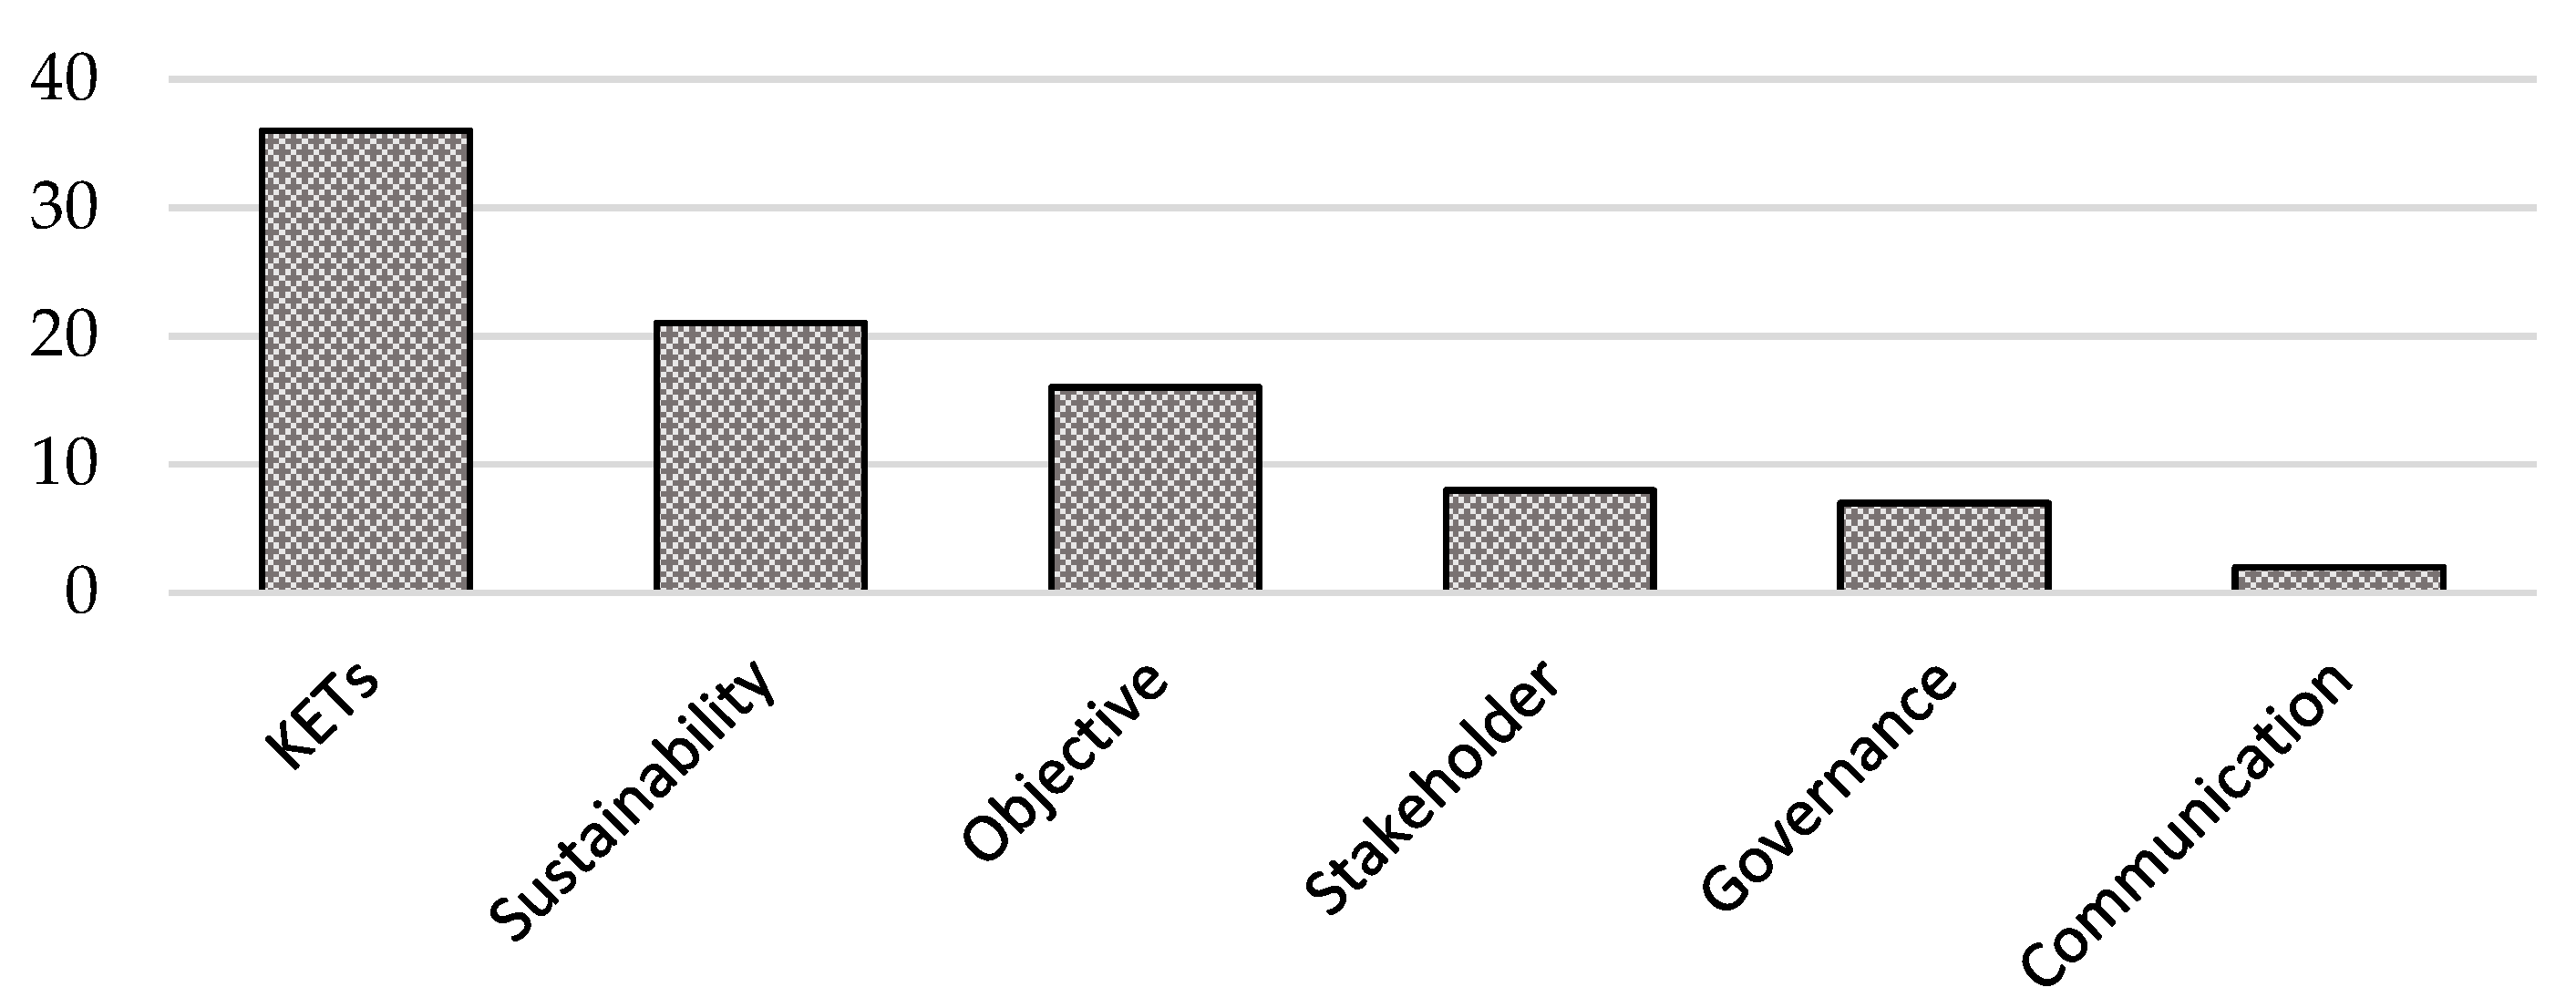
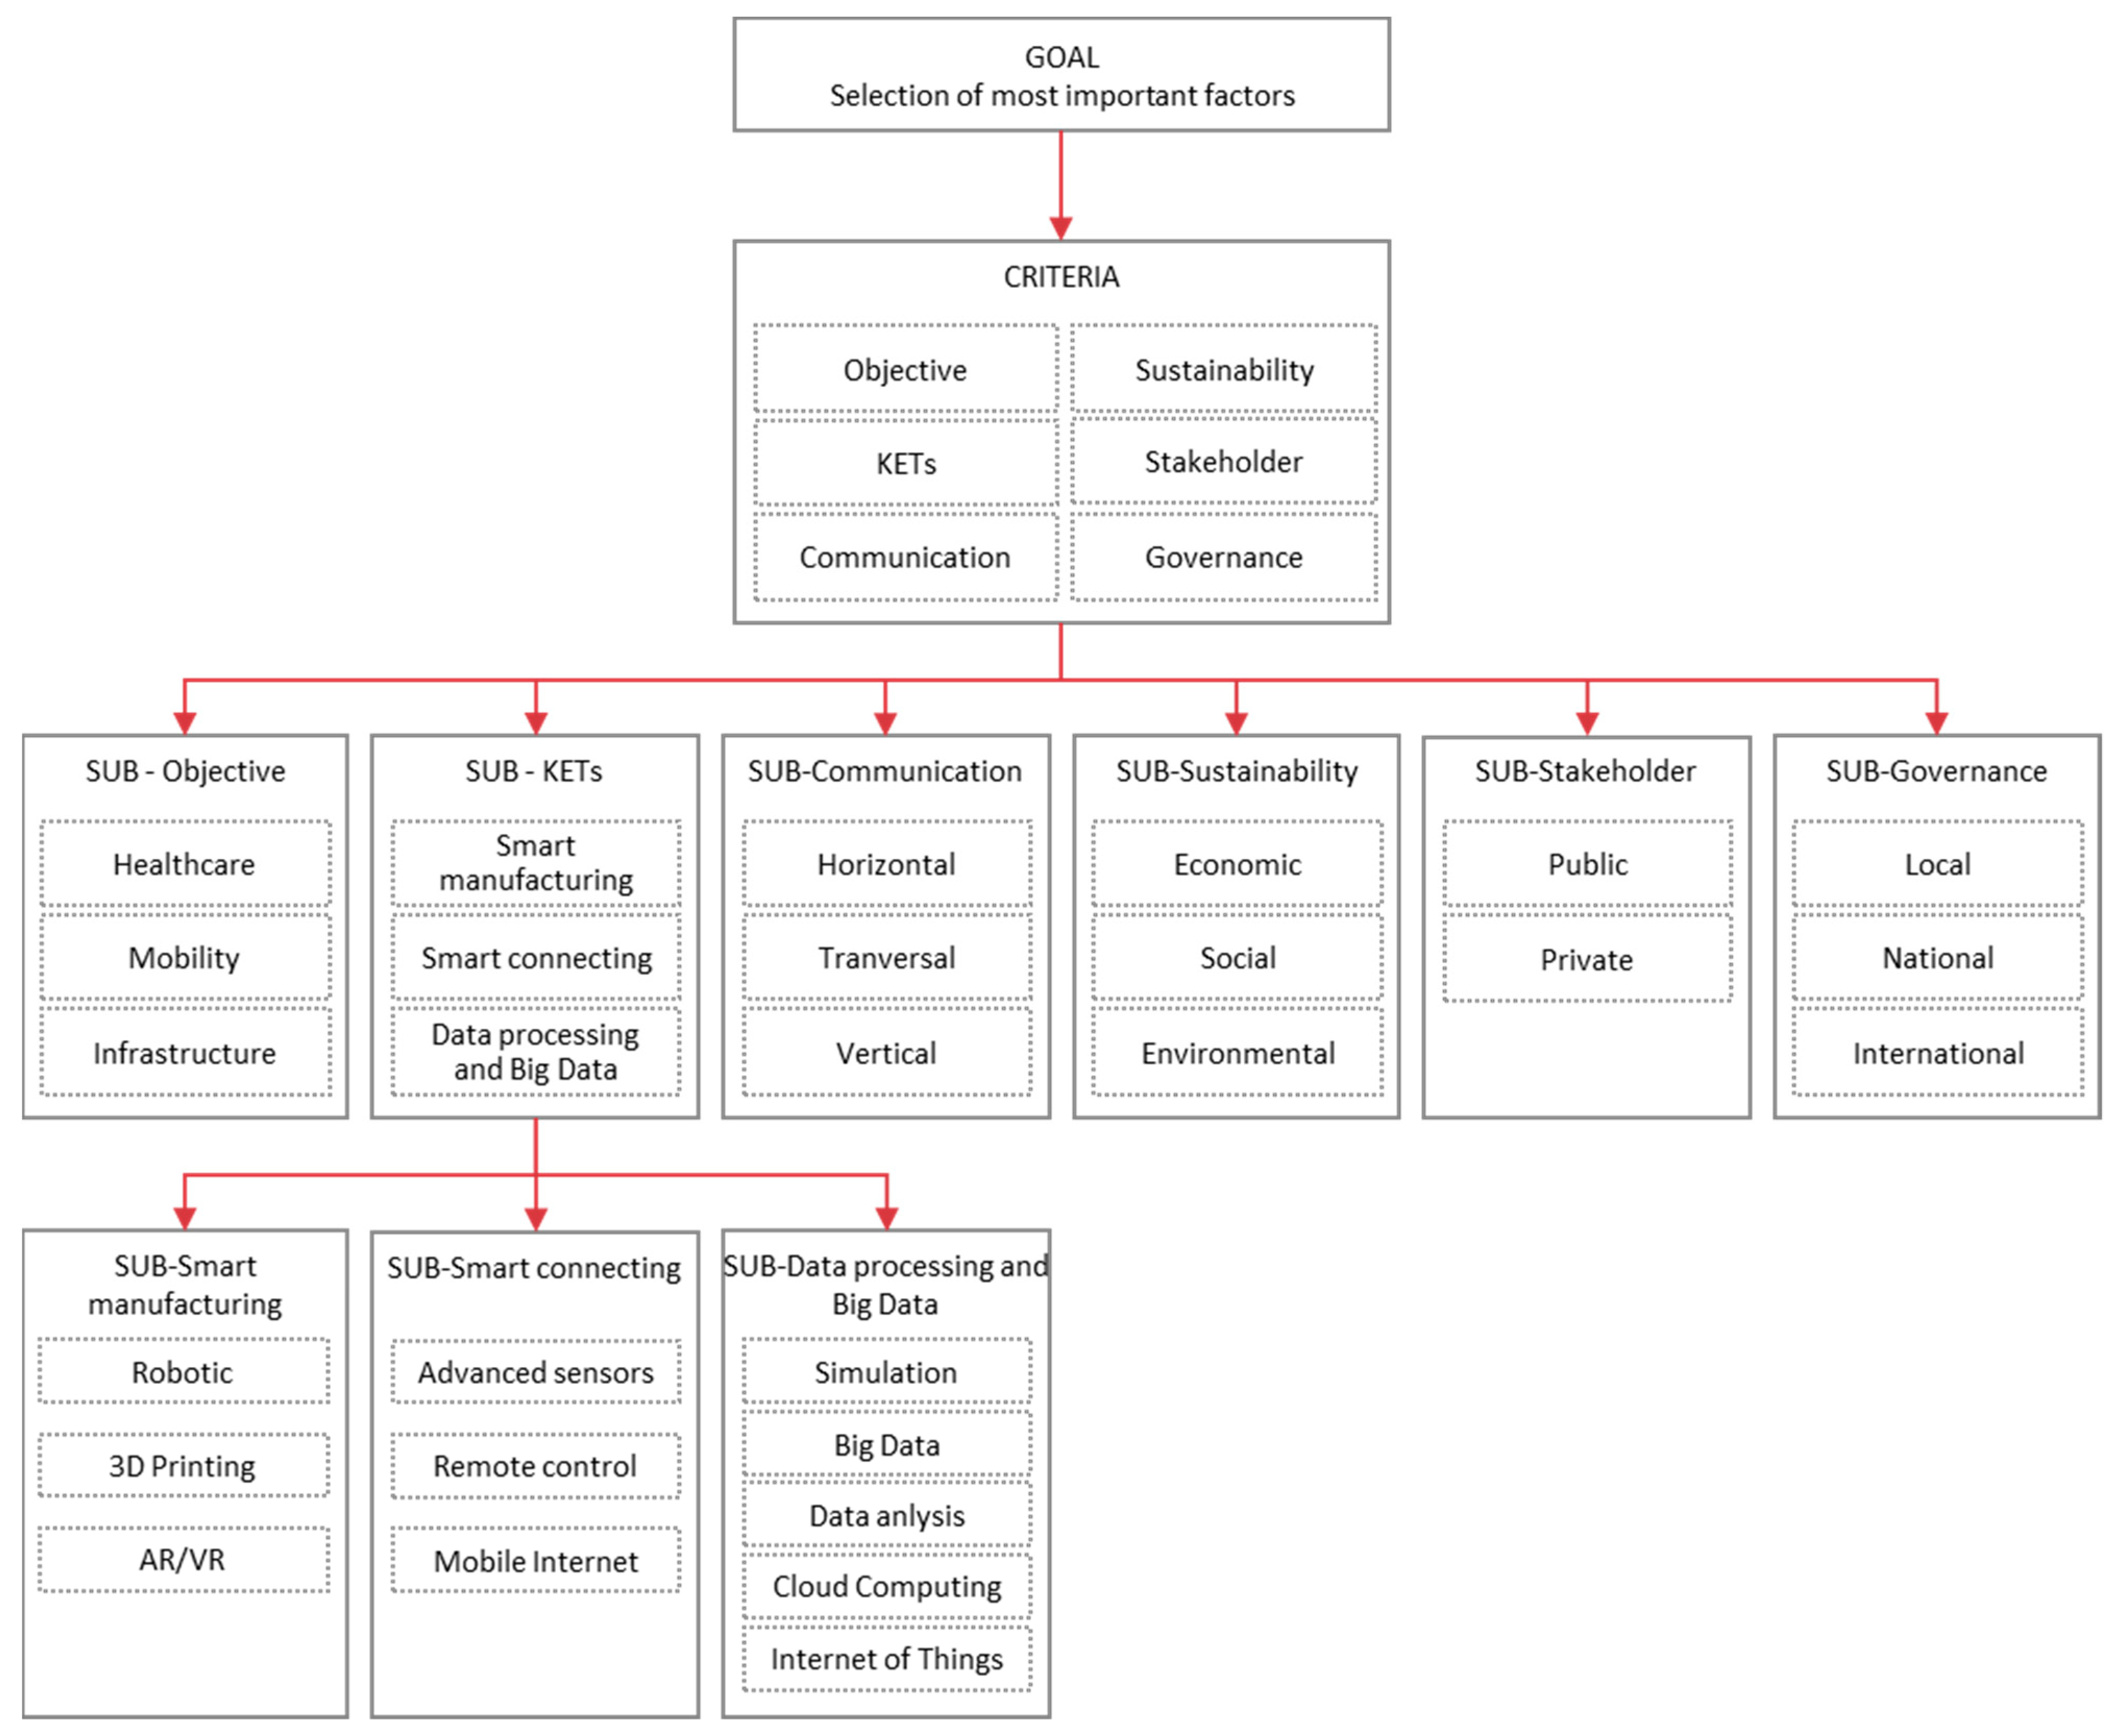
3.3. Factors Identification and Comparison: AHP

In the previous paragraph, the list of factors was extracted (Table 2). From there, the AHP was implemented. This methodology was implemented by the full team of experts led by the AHP experts.
In the first step, the goal of the problem was set. The goal was to rank the factors in order of importance. Therefore, the criteria influencing it were identified in the factor groups. At the same time, the hierarchical structure of the problem was defined. In particular, the chosen AHP hierarchy consists of a general objective at the first level, a set of criteria at the second level, and the subcriteria at the last level. The hierarchical composition is as follows:
  • Objective: selection of factors with greater influence;
  • Criteria: groups of factors;
  • Subcriteria: six subcriteria that collect the factors associated with each group;
  • Sub-subcriteria: three sub-subcriteria that collect the factors associated with the sub-criteria of the KETs.
For a better understanding of the model, the hierarchical structure of the problem is reported in Figure 7.
The next step was to make pairwise comparisons between the criteria, and between the factors, with reference to the group (or subgroup) to which they belong to the higher level, through the Saaty scale. The pairwise comparisons were carried out by the experts, each of whom expressed their own judgment. In making judgments, the experts may prioritize several of importance. The weighted geometric mean method was used to aggregate the individual judgment matrices and obtain a collective judgment matrix. Therefore, the judgments presented are the judgments aggregated through the geometric mean.
This step was implemented with the help of SuperDecisions software.
The first pairwise comparison was made between the criteria, which correspond to the groups of factors. The comparison occurs in a matrix, m×n-sized, where each element of a row (i) is compared with the element of a column (j), as shown in Table 3. The consistency ratio (CR) value was found to be 0.048 and was considered to be acceptable.
As reported in Table 3, a normalized weight was assigned to each criterion (which corresponds to a group of factors). This indicates the percentage of importance of each group. For example, sustainability has a weight of approximately 45%, while the least important group is the governance group, with 3% importance. However, this is still not enough to get the factor ranking. For this reason, pairwise comparisons were made for all subcriteria and sub-subcriteria.
All comparisons were made on the basis of the results of the literature analysis (par 3.2). When comparing the sustainability factors, priority was given to the social and environmental aspects in accordance with what emerged during the literature analysis. Indeed, the economic aspect is linked to environmental protection and social well-being. The comparison between the factors included in the objective group recognized the prevalence of healthcare, while mobility and infrastructure were assigned the same scores. As mentioned above, there is no technological change without communication between stakeholders. With a view to knowledge transfer, transversal communication was awarded a higher rating. In fact, this implies that the parties are science on the one hand, and society on the other. Vertical communication was also considered relevant since it involves teaching. On the contrary, peer-to-peer communication plays an important role in technology, without involving other interested parties.
The role of technology has been extensively described. Since Big Data and IoT have enormous potential to implement Society 5.0, the subgroup to which these factors are associated had a higher score. In addition to these two factors, the data analysis factor was also the most relevant factor within the subgroup. The other factors were secondary, when related to the use of Big Data. Afterwards, even the connection technologies were considered relevant since, without them, it is not possible to connect smart devices. As far as production technologies are concerned, they are relevant within the I4.0 paradigm, but are limited to improving labor productivity.
For governance, more importance was given to international and national policies. International governance is understood as supranationalism, that is, a method of decision-making in multinational political communities (for example, Europe) where all or part of national sovereignty is transferred or delegated to an authority by the governments of the member States.
Finally, in comparing stakeholder factors, the same importance was given to both, since they contribute equally to the achievement of Society 5.0.
At the end of the comparisons between the sub-criteria (and the sub-subcriteria), a normalized score was assigned. To calculate the cumulative weight of the factors, their relative weight was calculated (Table 4). This weight was used to identify which factors were the most important. The selection was made on the basis of the percentage of influence. The first 13 factors were selected, whose sum of relative weight represents a cumulative weight of 80%. The other factors have a lower importance, with an overall weight equal to 20%. Table 4 shows the list of factors in descending order with respect to the relative weight of each factor.

3.4. Factors Interrelation Analysis: ISM

In this section, the ISM methodology is applied. The same team of experts who dealt with the implementation of the AHP was involved in the ISM methodology, led by an ISM expert. The following subsections will follow the ISM method steps listed in Section 2.2.

3.4.1. Development of Structural SSIM

In accordance with the methodological theory of the ISM, an evaluation group was decided, involving 10 people in this phase. The group was made up of experts from academia (including authors) and industry. All the experts were familiar with the Society 5.0 paradigm. Therefore, the pairwise relationships between the factors were decided according to group judgment. All judgments were made on the basis of the keyword analysis (Section 3.2).
Therefore, the SSIM (Table 5) develops based on the contextual relationships between factors. To express the complex relationships between factors, four commonly used symbols were used. They indicate the direction of the relationship between the factors, i and j (where i < j).
  • V–Factor: i will assist to achieve factor j;
  • A–Factor: j will assist to achieve factor i;
  • X–Factors: i and j will assist to achieve each other;
  • O–Factors: i and j are unrelated.
On the basis of the interrelation between the identified factors, the SSIM was constructed, as shown in Table 5.

3.4.2. Building the Reachability Matrix

Following the steps of the ISM analysis (Section 2.3), the SSIM was converted into a binary matrix, called the initial reachability matrix. The symbols V, A, X, O were replaced with the values of 1 and 0, according to the following rules:
  • If item (i, j) in the SSIM is V, items (i, j) and (j, i) are set to 1 and 0, respectively.
  • If item (i, j) in the SSIM is A, items (i, j) and (j, i) are set to 0 and 1, respectively.
  • If item (i, j) in the SSIM is X, items (i, j) and (j, i) are set to 1 and 1, respectively.
  • If item (i, j) in the SSIM is O, items (i, j) and (j, i) are set to 0 and 0, respectively.
To the initial reachability matrix, driving power and dependence power were added to obtain the final reachability matrix (Table 6). The driving power represents the total number of factors (including itself) that it may help to achieve. The dependence power describes the total number of factors (including itself), which may help in achieving it. They are calculated as the sum of the row elements and the sum of the column elements, respectively. Following the rules, the final reachability matrix is shown in Table 6.

3.4.3. Partitioning the Reachability Matrix

The final reachability matrix obtained in the previous step was partitioned at different levels. From it, the reachability set and the antecedent set for each factor were derived. The reachability set consists of horizontal factors: for each factor, the set consists of itself and other row factors, which it may influence or help achieve. The antecedent set consists of vertical factors, which are the factor itself and the other column factors that may help to achieve it.
The intersection of the reachability set and the antecedent set occurs for all factors. The factors for which the reachability and intersection sets are the same occupy the highest level in the ISM hierarchy. The top-level element in the hierarchy would not help to achieve any other element above its level. Therefore, the first-level elements are separated from the other elements. The same process is repeated to obtain the items in the next level. The process is iterated until the level of each element is found. These levels will be used to make the diagram. By performing the partitioning level procedure, the 13 factors were classified into four levels obtained through four iterations. The following, Table 7, Table 8, Table 9 and Table 10, present the 13 factors, together with their reachability sets, antecedent sets, intersection sets, and calculated levels.

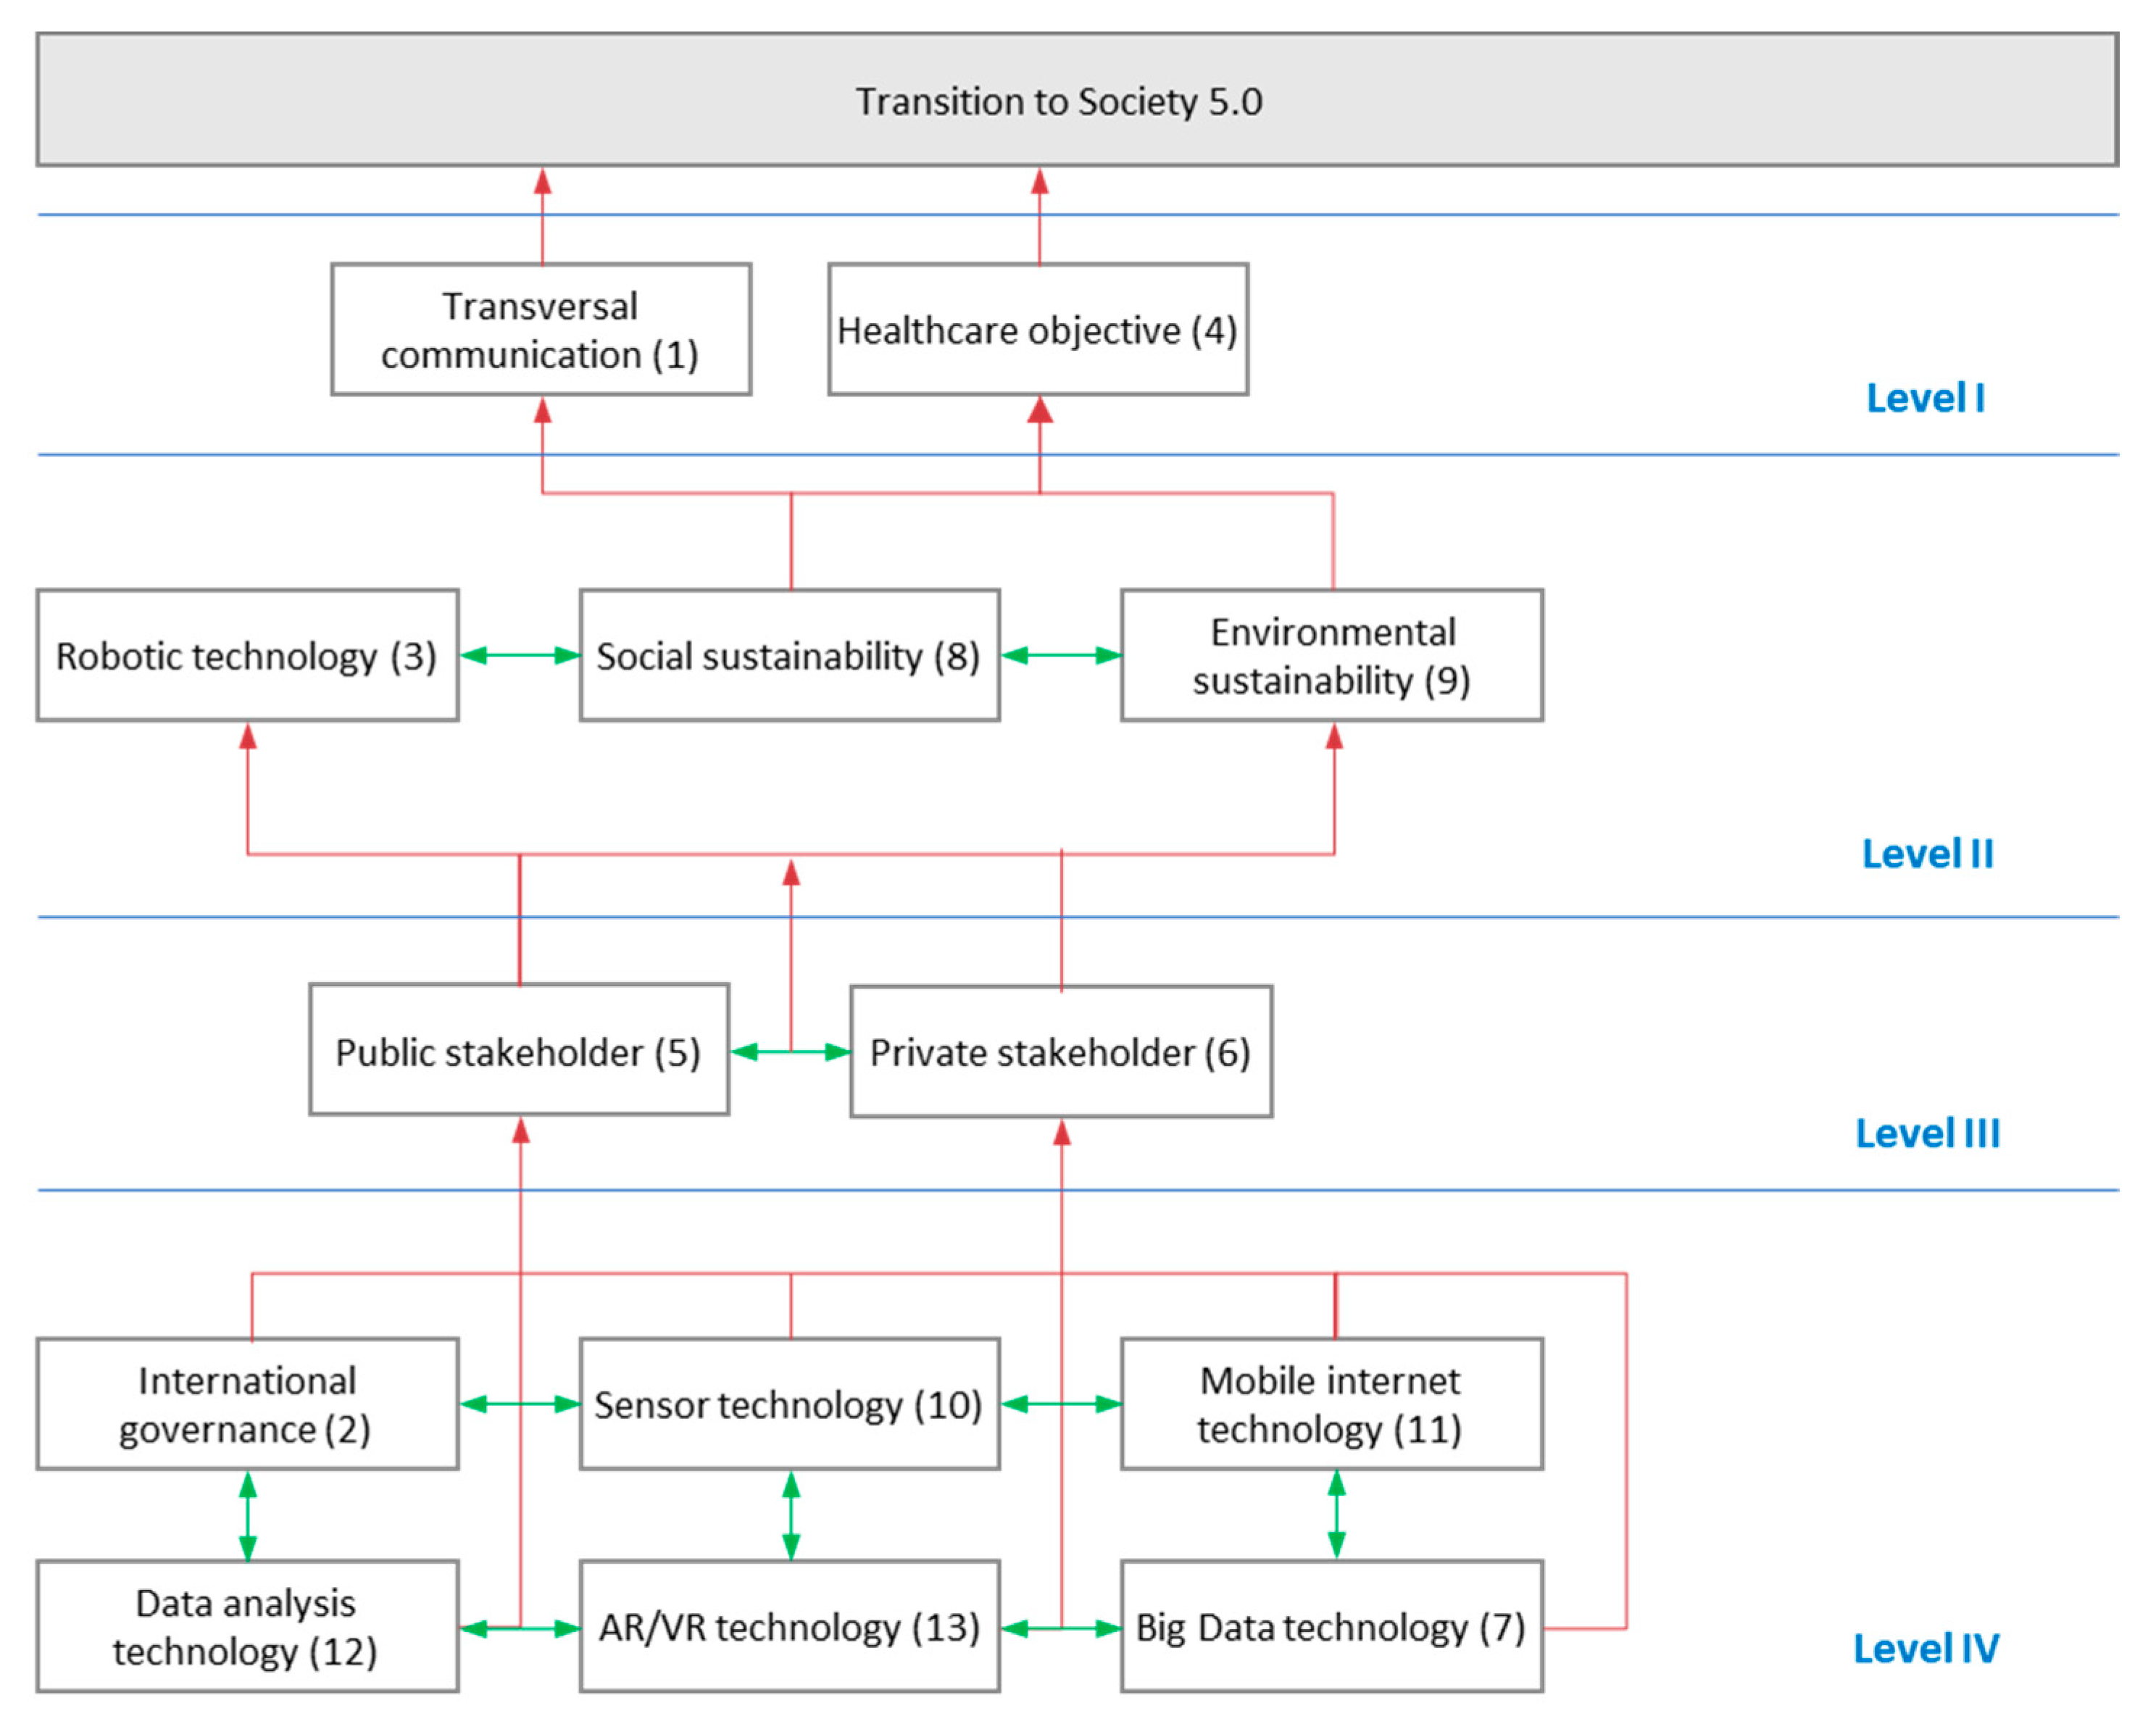
3.4.4. Development of ISM-Based Model

On the basis of the level partition of the factors obtained from the previous step, the hierarchical structural model was built. It is shown in Figure 8.
In this diagram (Figure 8), the factors are placed in a hierarchical structure from Level 1 to Level 4. The factors in the lower position achieve those in the higher positions. In general, factors with high driving power occupy a lower level, while those with a high dependence power appear at a higher level. The factors are connected with the red arrows if the factor occupying a level drives the factors of the higher levels. The green arrow describes the interrelation between factors in the same level (if a relation exists). The number that appears in brackets corresponds to the number of the factor (Table 4).

4. Results

This section presents the main research results proposed with respect to the composition of decision-makers, the domain and study variables, and the application of methodologies.

4.1. Domain and Variable of the Study

The literature review was carried out to examine previous research on the subject under study. The literature review recognized the work of previous researchers, through which a number of factors competing for the implementation of Society 5.0 were extracted. The results made it possible to identify 25 factors covering different fields (Table 2). The highest numbers of higher studies (Figure 9) were found in the areas of Big Data technology and data processing (23) and sustainability (21), Objective (16), connection technologies (13), manufacturing technologies (11), stakeholders (8), governance (7), and communication (2) (Table 2).
Figure 9 shows graphically the total number of studies per group of factors.
As shown in Figure 9, in the technology group, studies focused on Big Data with 12 papers, and IoT with 11. Within sustainability, the highest number of studies are in the environmental area with 15 studies, followed by the economic area with 10 studies. In the field of the objective, studies were carried out on infrastructure, in the broadest sense of the term, with 10 studies. Finally, the studies in the stakeholder, governance, and communication groups covered the relevant factors equally.
The AHP is applied in many fields, such as sustainability, social sciences, management, and engineering. The results obtained by the AHP return the ranking of the factors. A score is assigned to each factor through a process of pairwise comparison (Table 4). The final model of analysis produced 13 factors, which means that 12 factors were not selected in the final model. These 13 factors affect 80% overall in the transition to Society 5.0, while the other 12 factors contribute, with an overall weight of 20%. Therefore, these factors were removed. It is important to note that, in making all comparisons in pairs, the consistency ratio varied between 0 and 4.77%. The highest consistency ratio is associated with the comparison between all groups. In fact, the six groups gave rise to 12 pairwise comparisons. Nevertheless, the consistency ratio was well below 10% and, therefore, all comparisons were acceptable.
The 13 selected factors bring with them all of the above-mentioned groups of factors, showing that they are all strategically involved in the transition to Society 5.0.
For the technology group, all three subgroups (smart manufacturing, smart connection, and Big Data and data processing technologies) are included. For the smart manufacturing subgroup, two factors were selected, which were robotics and AR/VR. In the subgroup dealing with connection technologies, the factors included are sensors and mobile Internet. Finally, in the remaining subgroup, Big Data and data analysis are considered.
The factors selected by the sustainability group concern the environmental and social aspects. In the stakeholder group, both factors were selected, while the remaining groups selected one factor: healthcare in the case of the objective, transversal communication, and international governance groups.
In Table 11, the factors selected by AHP associated with groups are reported.

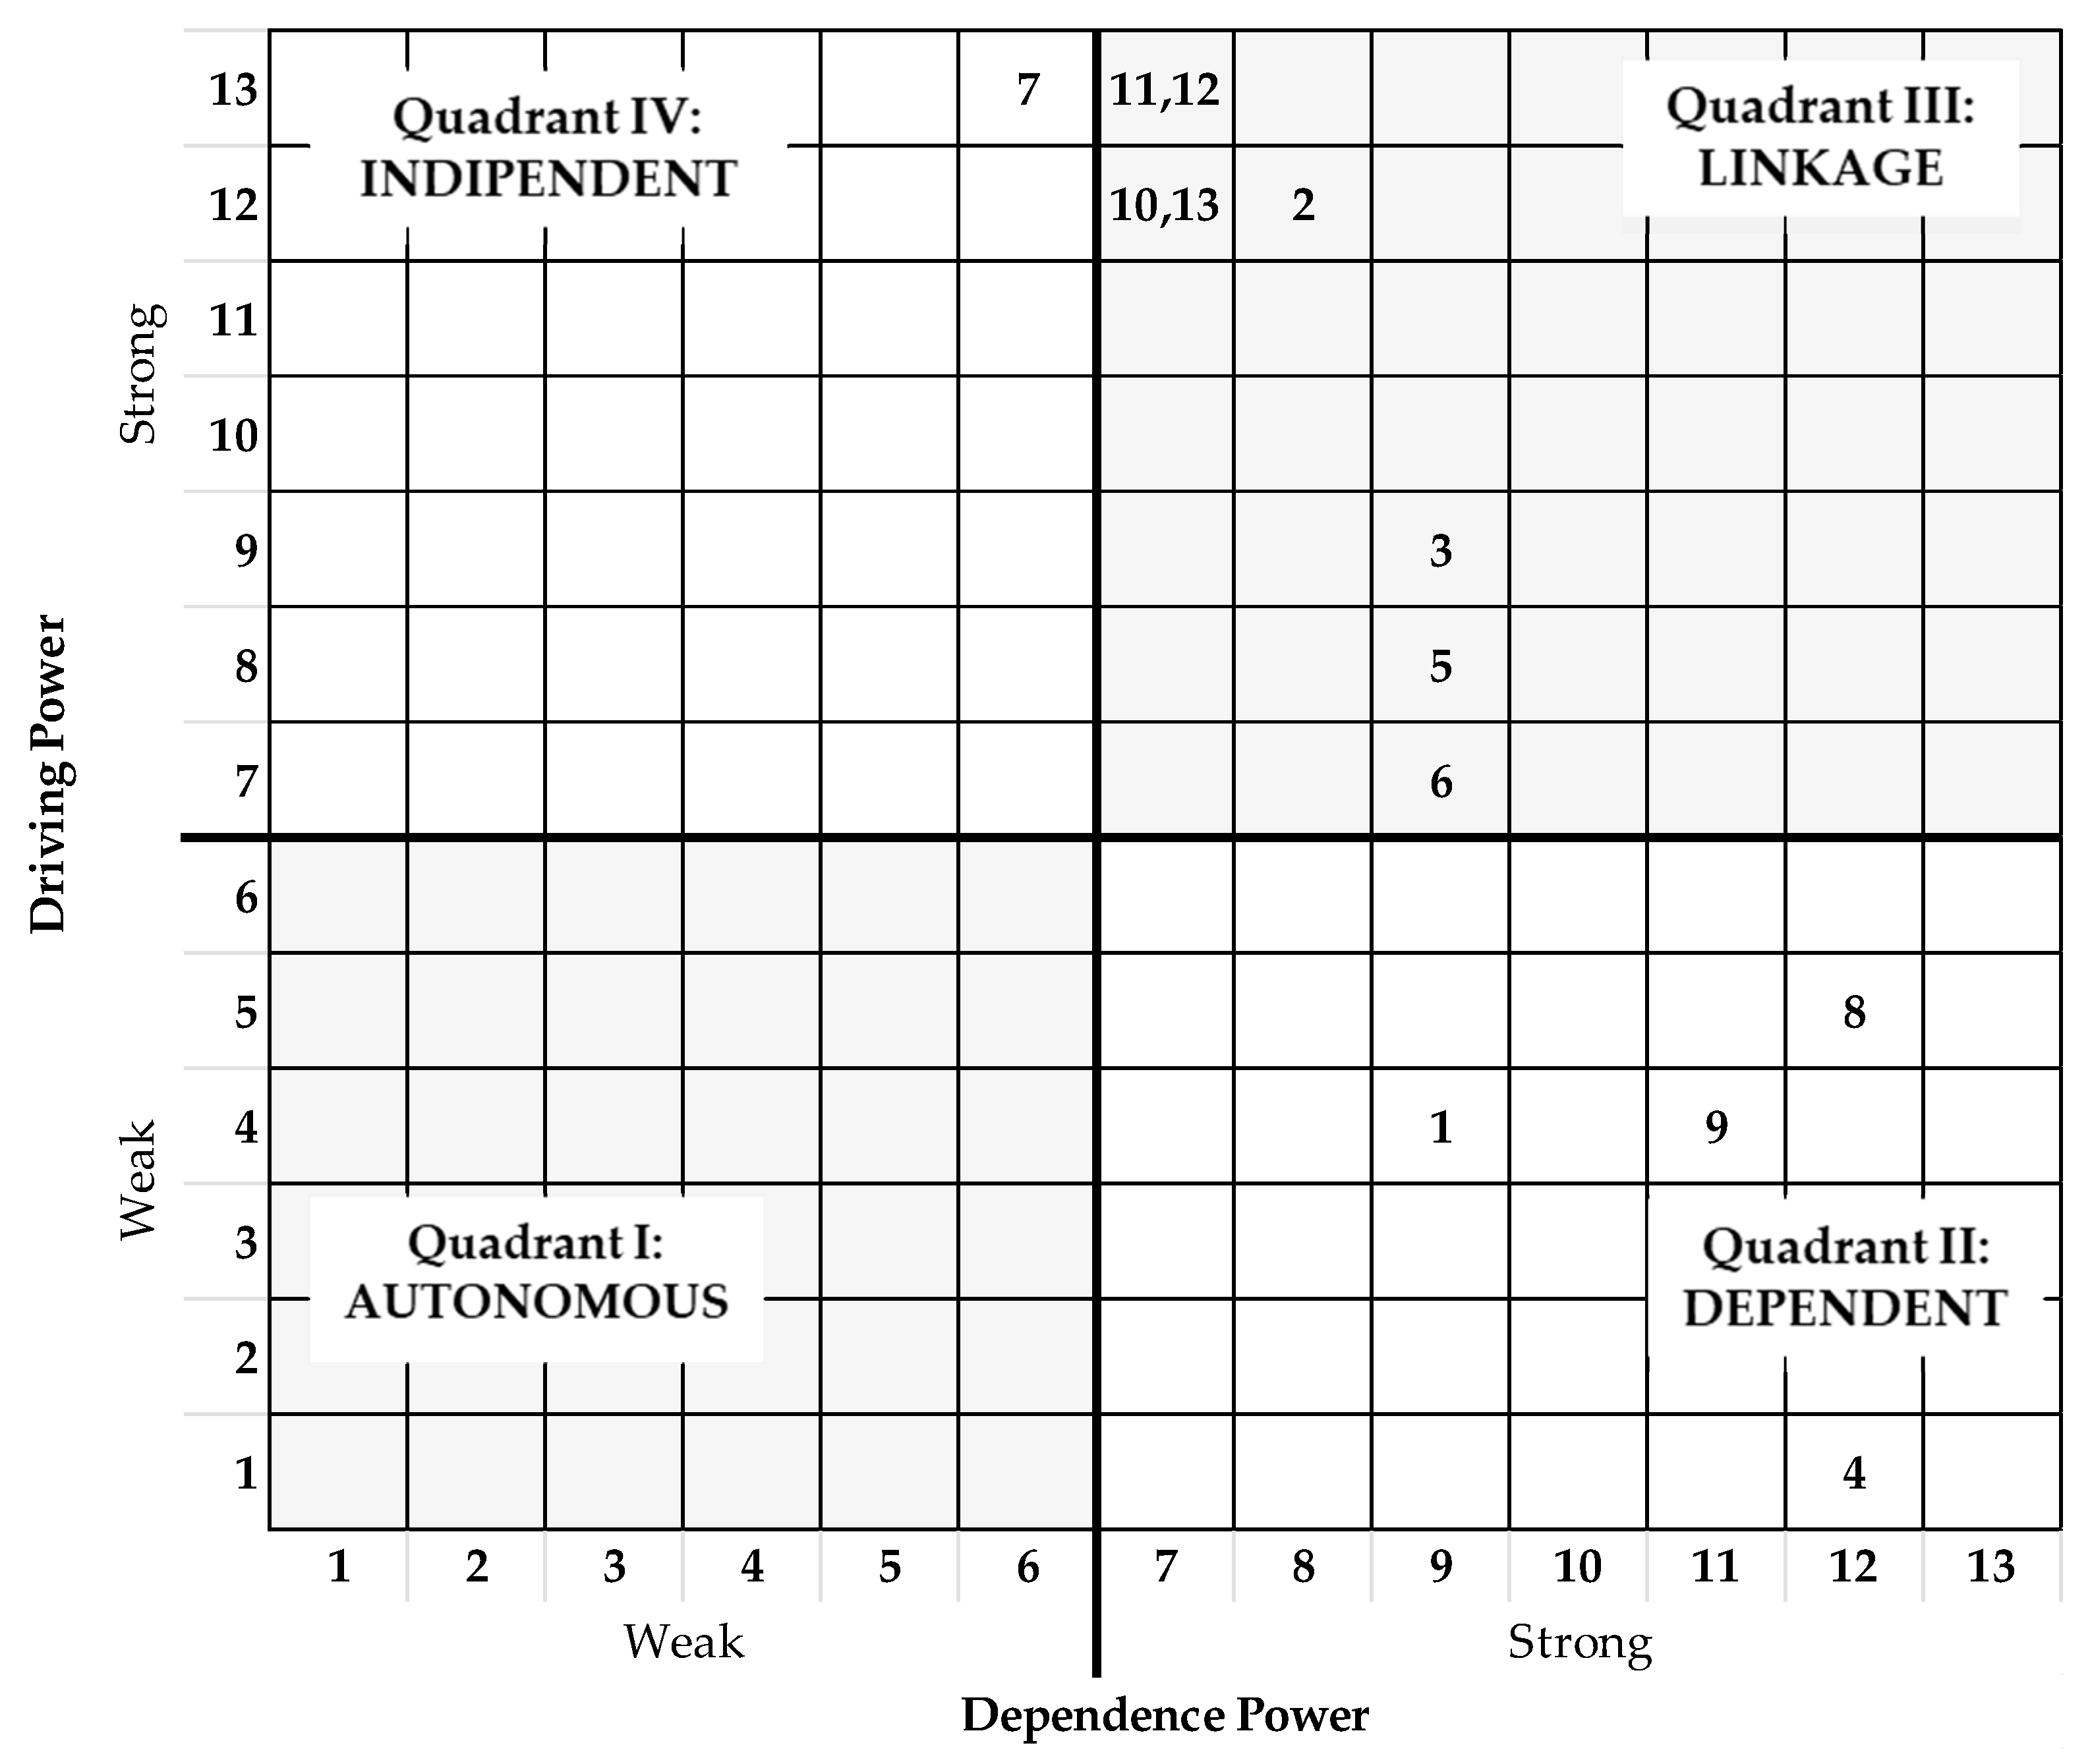
4.2. Assessment of Application of ISM Technique and MICMAC Analysis

On the basis of the AHP results, the ISM was implemented. In particular, all the methodological steps were carried out and, at the end of the last step, the hierarchical structural model was built (Figure 8). In this diagram, the 13 factors are arranged in a hierarchical structure from Level 1 to Level 4. Factors in the lower positions reach those in the higher positions. In general, factors with high driving power occupy a lower level, while those with a high dependence power appear at a higher level.
A MICMAC (cross-impact matrix multiplication applied to classification) analysis was also carried out to analyze the driving power and the dependence power of the factors in ISM. Starting from the final reachability matrix (Table 6), it is possible to conduct the MICMAC analysis on the effect of the 13 factors. Considering the previously calculated driving and dependency powers (Table 6), and based on their values, the factors were classified into four categories in a two-dimensional graph. These categories can be understood as follows:
  • Autonomous factors placed in Quadrant I: factors that have a weak driving power and a weak dependence;
  • Dependent factors placed in Quadrant II: factors that have a weak driving power but a strong dependence power;
  • Linkage factors located in Quadrant III: factors that have a strong driving power and a strong dependence;
  • Independent factors placed in Quadrant IV: factors that have a strong driving power but a weak addictive power.
In Figure 10, the factors classified through the MICMAC analysis are shown.
The independent factors included in Quadrant IV are critical to understanding the mechanism of the system, as most other factors depend on them. It is worth noting that Big Data has a high driving power and a medium-low dependence power. This means that Big Data helps to determine the system conditions. However, the mean-low dependency value causes Big Data to be affected by other system factors. The factors in Quadrant II have a low driving power but a high dependence power. These dependent factors are strongly influenced by independent factors. Four factors belong to this section: transversal and healthcare occupy Level 1; while social and economic sustainability occupy Level 2. These factors are affected by the other nine factors. The factors in Quadrant I have a low driving and dependence power. They have a weak influence on the system, which means that they do not have a strong interrelation with other factors. No factor is placed in this quadrant. Finally, in Quadrant III are included factors with high driving power and high dependence power. These factors are unstable, as any action on these factors will have an effect on others, and also a feedback effect on themselves. The factors within this quadrant have different values; therefore, they are on different levels and not all are directly affected. The factors regarding the technology are located in the lower positions, with a medium-high driving power and a high dependence power. The stakeholders are placed, instead, at the lower level with a high dependence power and a medium-low driving power.
By analyzing, in detail, the relationships between the factors at the lowest level, which correspond to Level 4 (Figure 8), technologies and international governance are classified. These factors are the most basic drivers that allow for the transition to Society 5.0. Governance and technologies are interrelated and, in turn, have a decisive impact on stakeholder behavior (Level 3). The creation of a fertile ground for innovation through an efficient policy management system, large-scale public–private partnerships, or efficient access to the capital market make it possible to allocate large amounts to scientific research; but they are also necessary to channel capital (human and nonhuman) and synergies to technological development, even basic. In addition, the incentives and provisions put in place are likely to increase the enthusiasm of stakeholders for sustainable development (Level 2). The construction of a relationship of mutual trust with stakeholders starts from the consideration of their interests and their compatibility with those of organizations. They are called to adopt responsible behavior, responding to environmental and social expectations, as well as all stakeholders. Environmental and social sustainability should become the guiding thread that unifies all actions in order to achieve social well-being, especially from the point of view of health. Cross-communication is therefore required. From the perspective of transversal communication, science and society cannot be conceived as separate actors but, rather, as two interacting units, so the changes of one side stimulate and allow the changes of the other so that there is a mutual synchronization.

5. Discussion

This study was carried out to answer three research questions (Section 1.3). The first question was addressed to the study of all the factors that can help the transition to Society 5.0. The second question was about which I4.0 technologies are eligible for transition. Finally, the third question referred to the ways in which the factors are related. Society 5.0 is anthropocentric; it follows that man is an integral part and is indirectly involved through the factors identified and analyzed.

5.1. Factors for the Transition to Society 5.0

An essential step in the direction of Society 5.0 is the social dialogue, the exploitation of technologies, and participation at all levels of society. Society 5.0 is a socially and environmentally sustainable society. Products and services supported by governance and stakeholders that meet sustainability requirements have greater credibility and are more likely to be recognized by society. This also provides a good environment for transversal communication. This type of communication allows greater involvement in the processes needed for sustainable innovation. Technological capabilities and the sharing of information and knowledge with stakeholders are essential for the implementation of sustainable development strategies. Therefore, it is necessary to build an incentive scheme to motivate all stakeholders. In this context, technology plays a key role in industry. The best prevention and quality measures for products and services can be implemented. The impacts of technology can also be found in the quality of life of the citizen. The digital space is one of the crucial topics of interest in research in the fields of intelligent transport, intelligent manufacturing, and medical care. Healthcare is one of the objectives of Society 5.0, which strongly depends on all the other factors. The ways in which citizens can interact with technology reflect the role that citizens may have in the future within society.

5.2. Framework of I4.0 Technologies Implementation in Society 5.0

This new model of society is based on I4.0 technology, which is embedded in infrastructure with intelligent processes.
The integration of technological infrastructures within Society 5.0 revolves around connections and data processing in order to create a relationship between users, Big Data, robotics, sensors, and personalized services, thanks to the use of Internet technology. Everything connected to the Internet features advanced technologies that identify accurate data from the physical space, facilitate the compilation of appropriate data in real time, and send this data to cyberspace. The information collected by multiple sensors is sent to central processing units, where it is integrated and stored in data management platforms. The development of a network of various sensors allows the automatic compilation of environmental data in order to exchange data with other organizations or within the same organization. Information is closely linked to Big Data. Big Data are the set of techniques that can be used to compile and process large amounts of data and conduct their immediate analysis through data analysis. Analysis for monitoring and information acquisition is applied to the data entered and managed through Big Data. This generates additional value related to Society 5.0. Data analysis is very important in robotics. Robotics can assist humans in performing various tasks, ranging from normal housework to industrial operations. In industry, robots create an intelligent working environment in which products can orient themselves. However, the output generated by robotics must always be under human direction. Important solutions, such as AR and VR, are key parts of the components, including maintenance, service, quality assurance, self-learning, and training. Perfectly implemented, AR/VR solutions are the key solutions in the digital production field. AR plays a key role in enabling workers to access information available electronically and connect it to the physical space.
These technologies are also aimed at personally oriented services, including healthcare. In particular, the technology transferred to the citizen represents an excellent opportunity to help transform data so that it is more useful to citizens. Robots in healthcare facilities are capable of supporting people’s independence. The connection and sharing of data information between users through the mobile Internet puts into practice remote medical assistance services. Through the mobile Internet, citizens can monitor data in real time. In general, data can be measured and managed, so that the healthy life expectancy can be extended.
Therefore, the technology in Society 5.0 does not establish its operations in individual sectors, as it crosses multiple fields and impacts different social models.

5.3. Relationship Framework between the Factors for The Success of Society 5.0

In general, the gap between I4.0 and Society 5.0 can be bridged and must be based on a joint activity of governance and technology, through intelligent solutions.
Society 5.0 is based on the requirement of active participation in social issues, with equal opportunities for all people, and an integration of innovative technologies and society, with a view to sustainable development. The integration between digital space and physical space in the social ecosystem concerns industries and governance.
In industry, technology plays a key role. Specifically, robotics and data analysis create an environment, with the use of technologies in I4.0, and offer the opportunity to also develop the skills of stakeholders. The evolution and innovative improvements of I4.0 have developed an increase in the data requirements for real-time analysis and processing. Through the involvement of stakeholders, the strengthening of data processing technologies has made it possible to improve all the activities carried out to achieve the objectives of sustainable development. Examples of such technologies include the sensor-based information industry, data analytics, and mobile Internet applications, which allow for the real-time monitoring of activities and the use of a computer interface for human–computer interaction. The practical implementation of I4.0 technologies connects smart manufacturing with smart data processing through communication and connection technologies.
The sustainable development of Industry 4.0 also creates an environment for the development of knowledge management strategies that take place through data processing technologies.
As for the governance ecosystem, institutions play a key role in pushing technology. In fact, in light of the results (Section 4), governance and technology occupy the same level of driving power. This means that decisionmakers shape conversations with industry sectors and with stakeholders. The intensity of the way they shape discourse varies according to the type of policy in place. An international policy will guide national and local policies.

6. Conclusions

The new Society 5.0 calls for the creation of highly developed systems that give all participants in society the optimal solutions in which human beings are at the center of the transformations, along with technological development and sustainability. The survey carried out confirmed that a path of innovation aimed at the transition to Society 5.0 cannot disregard the technological dimension. Society 5.0 is based on related cutting-edge technologies that merge physical spaces with cyberspace. The integration of cyberspace with the physical space contributes to the creation of structures that can solve the social problems of the population with the resources of the digital field. Advanced sensors are used to compile large amounts of data and store it optimally through big data. These data are processed by data analysis algorithms to extract information and generate value. In this way personalized services are created for anyone, anytime and anywhere. The flexibility of Society 5.0 is demonstrated by the offer of solutions that give all participants in the society the optimal solutions in which I4.0 technologies are used. The technological thrust must stick to the environmental dimension, without limiting prosperity. On the contrary, it must focus on the growth of social well-being. The progress of this new concept of society is highlighted by the influence of the inclusion of virtual systems and new models of work, the impact on healthcare, the future of production for developing sustainable processes, and on the active participation of all interested parties (stakeholders and governance). In this sense, this document offers a contribution to understanding the concept, structure, and impact of the implementation of Society 5.0, with a sustainability approach in all areas of society. According to the Society 5.0 paradigm, sustainable digital innovation addresses the challenges of modern society. The aim is to increase the potential of the relationship between man and technology and promote the improvement of people’s quality of life through a superintelligent society.
On the basis of the review of the literature and the AHP and ISM analyses, the results may be useful for several contexts (both in research and in organizations) with complex systemic dimensions. The institutions could intervene with their support in a more targeted way, being able to assess more precisely which solutions offer greater added value, and organizational professionals could base their decisions on the exploitation of their knowledge. A limitation of the research concerns the partially simulated estimation and the weight allocation to the selected AHP criteria. However, this necessary simulation assumes reasonable judgment parameters, resulting from a rigorous analysis of the contents. Therefore, future research should aim at improving the relationship between the identified factors in relation to each country. By adapting the model to the prerogatives of specific social dimensions, the identification of the driving factors towards Society 5.0 allows for the implementation of strategies in the territorial system in the growth policies of each country. Institutions, entrepreneurs, and managers should take these differences into account, and plan interventions that reflect the real conditions of their contexts.

Author Contributions

Conceptualization, F.D.F. and A.P.; Methodology, F.D.F., A.P. and M.T.; Software, M.T.; Validation, A.P., F.D.F and M.T.; Investigation, A.P., F.D.F. and M.T.; Resources, F.D.F. and A.P.; Data Curation, M.T.; Writing–Original Draft Preparation, M.T.; Writing–Review & Editing, A.P. and F.D.F; Supervision, A.P. and F.D.F.; Project Administration, A.P. and F.D.F. All authors have read and agreed to the published version of the manuscript.

Funding

This research received no external funding.

Institutional Review Board Statement

Not applicable.

Informed Consent Statement

Not applicable.

Data Availability Statement

Data sharing is not applicable to this article.

Conflicts of Interest

The authors declare no conflict of interest.

References

  1. Žižek, S.Š.; Mulej, M.; Potočnik, A. The sustainable socially responsible society: Well-being society 6.0. Sustainability 2021, 13, 9186. [Google Scholar] [CrossRef]
  2. Gurjanov, A.V.; Zakoldaev, D.A.; Shukalov, A.V.; Zharinov, I.O. The smart city technology in the super-intellectual Society 5.0. J. Physics Conf. Ser. 2020, 1679, 032029. [Google Scholar] [CrossRef]
  3. Haque, A.K.M.B.; Bhushan, B.; Dhiman, G. Conceptualizing smart city applications: Requirements, architecture, security issues, and emerging trends. Expert Syst. 2021, 1, 23. [Google Scholar] [CrossRef]
  4. Nunes, S.A.; Ferreira, F.A.; Govindan, K.; Pereira, L.F. “Cities go smart!”: A system dynamics-based approach to smart city conceptualization. J. Clean. Prod. 2021, 313, 127683. [Google Scholar] [CrossRef]
  5. Palumbo, R.; Manesh, M.F.; Pellegrini, M.M.; Caputo, A.; Flamini, G. Organizing a sustainable smart urban ecosystem: Perspectives and insights from a bibliometric analysis and literature review. J. Clean. Prod. 2021, 297, 126622. [Google Scholar] [CrossRef]
  6. Bibri, S.E.; Krogstie, J. Smart sustainable cities of the future: An extensive interdisciplinary literature review. Sustain. Cities Soc. 2017, 31, 183–212. [Google Scholar] [CrossRef]
  7. United Nations. Draft outcome document of the United Nations summit for the adoption of the post-2015 development agenda. In Draft Resolution Submitted by the President of the General Assembly, Sixty-Ninth Session, Agenda Items 13(a) and 115, A/69/L.85; United Nations: New York, NY, USA, 2015. [Google Scholar]
  8. Falanga, R.; Verheij, J.; Bina, O. Green(er) Cities and Their Citizens: Insights from the Participatory Budget of Lisbon. Sustainability 2021, 13, 8243. [Google Scholar] [CrossRef]
  9. Israilidis, J.; Odusanya, K.; Mazhar, M.U. Exploring knowledge management perspectives in smart city research: A review and future research agenda. Int. J. Inf. Manag. 2019, 56, 101989. [Google Scholar] [CrossRef]
  10. Yigitcanlar, T.; Kamruzzaman, M.; Foth, M.; Sabatini-Marques, J.; da Costa, E.; Ioppolo, G. Can cities become smart without being sustainable? A systematic review of the literature. Sustain. Cities Soc. 2018, 45, 348–365. [Google Scholar] [CrossRef]
  11. Yigitcanlar, T.; Corchado, J.; Mehmood, R.; Li, R.; Mossberger, K.; Desouza, K. Responsible Urban Innovation with Local Government Artificial Intelligence (AI): A Conceptual Framework and Research Agenda. J. Open Innov. Technol. Mark. Complex. 2021, 7, 71. [Google Scholar] [CrossRef]
  12. Yigitcanlar, T.; Cugurullo, F. The Sustainability of Artificial Intelligence: An Urbanistic Viewpoint from the Lens of Smart and Sustainable Cities. Sustainability 2020, 12, 8548. [Google Scholar] [CrossRef]
  13. Yigitcanlar, T.; DeSouza, K.C.; Butler, L.; Roozkhosh, F. Contributions and Risks of Artificial Intelligence (AI) in Building Smarter Cities: Insights from a Systematic Review of the Literature. Energies 2020, 13, 1473. [Google Scholar] [CrossRef] [Green Version]
  14. Yigitcanlar, T.; Foth, M. Kamruzzaman Towards Post-Anthropocentric Cities: Reconceptualizing Smart Cities to Evade Urban Ecocide. J. Urban Technol. 2017, 26, 147–152. [Google Scholar] [CrossRef] [Green Version]
  15. Yigitcanlar, T.; Kamruzzaman, M.; Buys, L.; Ioppolo, G.; Sabatini-Marques, J.; da Costa, E.M.; Yun, J.J. Understanding ‘smart cities’: Intertwining development drivers with desired outcomes in a multidimensional framework. Cities 2018, 81, 145–160. [Google Scholar] [CrossRef]
  16. Yigitcanlar, T.; Mehmood, R.; Corchado, J.M. Green Artificial Intelligence: Towards an Efficient, Sustainable and Equitable Technology for Smart Cities and Futures. Sustainability 2021, 13, 8952. [Google Scholar] [CrossRef]
  17. Santos, G.; Sá, J.; Félix, M.; Barreto, L.; Carvalho, F.; Doiro, M.; Zgodavová, K.; Stefanović, M. New Needed Quality Management Skills for Quality Managers 4.0. Sustainability 2021, 13, 6149. [Google Scholar] [CrossRef]
  18. Aquilani, B.; Piccarozzi, M.; Abbate, T.; Codini, A. The Role of Open Innovation and Value Co-creation in the Challenging Transition from Industry 4.0 to Society 5.0: Toward a Theoretical Framework. Sustainability 2020, 12, 8943. [Google Scholar] [CrossRef]
  19. Balaji, S.; Nathani, K.; Santhakumar, R. IoT Technology, Applications and Challenges: A Contemporary Survey. Wirel. Pers. Commun. 2019, 108, 363–388. [Google Scholar] [CrossRef]
  20. Verde, L.; De Pietro, G.; Alrashoud, M.; Ghoneim, A.; Al-Mutib, K.N.; Sannino, G. Leveraging Artificial Intelligence to Improve Voice Disorder Identification Through the Use of a Reliable Mobile App. IEEE Access 2019, 7, 124048–124054. [Google Scholar] [CrossRef]
  21. Chui, K.T.; Lytras, M.D.; Visvizi, A. Energy Sustainability in Smart Cities: Artificial Intelligence, Smart Monitoring, and Optimization of Energy Consumption. Energies 2018, 11, 2869. [Google Scholar] [CrossRef] [Green Version]
  22. Pundir, S.; Wazid, M.; Singh, D.P.; Das, A.K.; Rodrigues, J.J.P.C.; Park, Y. Intrusion Detection Protocols in Wireless Sensor Networks Integrated to Internet of Things Deployment: Survey and Future Challenges. IEEE Access 2019, 8, 3343–3363. [Google Scholar] [CrossRef]
  23. Bibri, S.E. The IoT for smart sustainable cities of the future: An analytical framework for sensor-based big data applications for environmental sustainability. Sustain. Cities Soc. 2018, 38, 230–253. [Google Scholar] [CrossRef]
  24. Talebkhah, M.; Sali, A.; Marjani, M.; Gordan, M.; Hashim, S.J.; Rokhani, F.Z. IoT and Big Data Applications in Smart Cities: Recent Advances, Challenges, and Critical Issues. IEEE Access 2021, 9, 55465–55484. [Google Scholar] [CrossRef]
  25. Francisco, A.; Taylor, J.E. Understanding citizen perspectives on open urban energy data through the development and testing of a community energy feedback system. Appl. Energy 2019, 256, 113804. [Google Scholar] [CrossRef]
  26. Lavalle, A.; Teruel, M.; Maté, A.; Trujillo, J. Improving Sustainability of Smart Cities through Visualization Techniques for Big Data from IoT Devices. Sustainability 2020, 12, 5595. [Google Scholar] [CrossRef]
  27. Yang, Z.; Jianjun, L.; Faqiri, H.; Shafik, W.; Abdulrahman, A.T.; Yusuf, M.; Sharawy, A. Green Internet of Things and Big Data Application in Smart Cities Development. Complexity 2021, 2021, 4922697. [Google Scholar] [CrossRef]
  28. Ben Atitallah, S.; Driss, M.; Boulila, W.; Ben Ghézala, H. Leveraging Deep Learning and IoT big data analytics to support the smart cities development: Review and future directions. Comput. Sci. Rev. 2020, 38, 100303. [Google Scholar] [CrossRef]
  29. Sołtysik-Piorunkiewicz, A.; Zdonek, I. How Society 5.0 and Industry 4.0 Ideas Shape the Open Data Performance Expectancy. Sustainability 2021, 13, 917. [Google Scholar] [CrossRef]
  30. Dautov, R.; Distefano, S.; Bruneo, D.; Longo, F.; Merlino, G.; Puliafito, A.; Buyya, R. Metropolitan intelligent surveillance systems for urban areas by harnessing IoT and edge computing paradigms. Softw. Pr. Exp. 2018, 48, 1475–1492. [Google Scholar] [CrossRef]
  31. Kuru, K.; Khan, W. A Framework for the Synergistic Integration of Fully Autonomous Ground Vehicles with Smart City. IEEE Access 2020, 9, 923–948. [Google Scholar] [CrossRef]
  32. Travaglioni, M.; Ferazzoli, A.; Petrillo, A.; Cioffi, R.; De Felice, F.; Piscitelli, G. Digital manufacturing challenges through open innovation perspective. Procedia Manuf. 2020, 42, 165–172. [Google Scholar] [CrossRef]
  33. Thyer, B.A. Preparing Research Articles; Oxford University Press: Oxford, UK, 2008. [Google Scholar]
  34. Saaty, T.L. How to make a decision: The analytic hierarchy process. Eur. J. Oper. Res. 1990, 48, 9–26. [Google Scholar] [CrossRef]
  35. Songur, N.H. Application of Analytical Hierarchy Process Method in Database Tool Selection. Master’s Thesis, Beykent University, Istanbul, Turkey, 2018. [Google Scholar]
  36. Mangla, S.K.; Kumar, P.; Barua, M.K. Flexible Decision Approach for Analysing Performance of Sustainable Supply Chains Under Risks/Uncertainty. Glob. J. Flex. Syst. Manag. 2014, 15, 113–130. [Google Scholar] [CrossRef]
  37. Lim, M.K.; Tseng, M.-L.; Tan, K.H.; Bui, T.D. Knowledge management in sustainable supply chain management: Improving performance through an interpretive structural modelling approach. J. Clean. Prod. 2017, 162, 806–816. [Google Scholar] [CrossRef]
  38. Diabat, A.; Govindan, K. An analysis of the drivers affecting the implementation of green supply chain management. Resour. Conserv. Recycl. 2011, 55, 659–667. [Google Scholar] [CrossRef]
  39. Sag, S.; Sezen, B.; Alpkan, L. Determinants of Open Innovation and their Interrelations. Int. J. Innov. Technol. Manag. 2019, 16, 1940001. [Google Scholar] [CrossRef] [Green Version]
  40. Zhou, F.; Lim, M.K.; He, Y.; Lin, Y.; Chen, S. End-of-life vehicle (ELV) recycling management: Improving performance using an ISM approach. J. Clean. Prod. 2019, 228, 231–243. [Google Scholar] [CrossRef]
  41. Bibri, S.E. Data-driven smart sustainable urbanism: The intertwined societal factors underlying its materialization, success, expansion, and evolution. GeoJournal 2019, 86, 43–68. [Google Scholar] [CrossRef]
  42. Kong, L.; Liu, Z.; Wu, J. A systematic review of big data-based urban sustainability research: State-of-the-science and future directions. J. Clean. Prod. 2020, 273, 123142. [Google Scholar] [CrossRef]
  43. Oliveira, T.A.; Oliver, M.; Ramalhinho, H. Challenges for Connecting Citizens and Smart Cities: ICT, E-Governance and Blockchain. Sustainability 2020, 12, 2926. [Google Scholar] [CrossRef] [Green Version]
  44. Anttiroiko, A.-V. City-as-a-Platform: The Rise of Participatory Innovation Platforms in Finnish Cities. Sustainability 2016, 8, 922. [Google Scholar] [CrossRef] [Green Version]
  45. Kumari, A.; Gupta, R.; Tanwar, S. Amalgamation of blockchain and IoT for smart cities underlying 6G communication: A comprehensive review. Comput. Commun. 2021, 172, 102–118. [Google Scholar] [CrossRef]
  46. Deakin, M.; Reid, A. Smart cities: Under-gridding the sustainability of city-districts as energy efficient-low carbon zones. J. Clean. Prod. 2018, 173, 39–48. [Google Scholar] [CrossRef]
  47. Wang, L.; Hu, S.; Betis, G.; Ranjan, R. A Computing Perspective on Smart City [Guest Editorial]. IEEE Trans. Comput. 2016, 65, 1337–1338. [Google Scholar] [CrossRef]
  48. Bouzidi, M.; Dalveren, Y.; Cheikh, F.A.; Derawi, M. Use of the IQRF Technology in Internet-of-Things-Based Smart Cities. IEEE Access 2020, 8, 56615–56629. [Google Scholar] [CrossRef]
  49. Hsiao, Y.-C.; Wu, M.-H.; Li, S.C. Elevated Performance of the Smart City—A Case Study of the IoT by Innovation Mode. IEEE Trans. Eng. Manag. 2019, 68, 1461–1475. [Google Scholar] [CrossRef]
  50. Huovila, A.; Bosch, P.; Airaksinen, M. Comparative analysis of standardized indicators for Smart sustainable cities: What indicators and standards to use and when? Cities 2019, 89, 141–153. [Google Scholar] [CrossRef]
  51. Pérez, F.M.; Martínez, J.B.; Fonseca, I.L. Modelling and Implementing Smart Universities: An IT Conceptual Framework. Sustainability 2021, 13, 3397. [Google Scholar] [CrossRef]
  52. Bibri, S.E.; Krogstie, J. A Novel Model for Data-Driven Smart Sustainable Cities of the Future: A Strategic Roadmap to Transformational Change in the Era of Big Data. Futur. Cities Environ. 2021, 7, 1–25. [Google Scholar] [CrossRef]
  53. Mora, H.; Pérez-Delhoyo, R.; Paredes-Pérez, J.F.; Mollá-Sirvent, R.A. Analysis of Social Networking Service Data for Smart Urban Planning. Sustainability 2018, 10, 4732. [Google Scholar] [CrossRef] [Green Version]
  54. Shamsuzzoha, A.; Nieminen, J.; Piya, S.; Rutledge, K. Smart city for sustainable environment: A comparison of participatory strategies from Helsinki, Singapore and London. Cities 2021, 114, 103194. [Google Scholar] [CrossRef]
  55. D’Amico, G.; Arbolino, R.; Shi, L.; Yigitcanlar, T.; Ioppolo, G. Digital Technologies for Urban Metabolism Efficiency: Lessons from Urban Agenda Partnership on Circular Economy. Sustainability 2021, 13, 6043. [Google Scholar] [CrossRef]
  56. Ye, C.; Cao, W.; Chen, S. Security challenges of blockchain in Internet of things: Systematic literature review. Trans. Emerg. Telecommun. Technol. 2020, 32, e4177. [Google Scholar] [CrossRef]
  57. Aggarwal, S.; Kumar, N.; Tanwar, S. Blockchain-Envisioned UAV Communication Using 6G Networks: Open Issues, Use Cases, and Future Directions. IEEE Internet Things J. 2020, 8, 5416–5441. [Google Scholar] [CrossRef]
  58. Bhushan, B.; Khamparia, A.; Sagayam, K.M.; Sharma, S.K.; Ahad, M.A.; Debnath, N.C. Blockchain for smart cities: A review of architectures, integration trends and future research directions. Sustain. Cities Soc. 2020, 61, 102360. [Google Scholar] [CrossRef]
  59. Yu, Z.; Song, L.; Jiang, L.; Sharafi, O.K. Systematic literature review on the security challenges of blockchain in IoT-based smart cities. Kybernetes 2021. Vol. ahead-of-print No. ahead-of-print. [Google Scholar] [CrossRef]
  60. Kakderi, C.; Oikonomaki, E.; Papadaki, I. Smart and Resilient Urban Futures for Sustainability in the Post COVID-19 Era: A Review of Policy Responses on Urban Mobility. Sustainability 2021, 13, 6486. [Google Scholar] [CrossRef]
  61. Alhasnawi, B.; Jasim, B.; Esteban, M.; Guerrero, J. A Novel Smart Energy Management as a Service over a Cloud Computing Platform for Nanogrid Appliances. Sustainability 2020, 12, 9686. [Google Scholar] [CrossRef]
  62. Freudendal-Pedersen, M.; Kesselring, S.; Servou, E. What is Smart for the Future City? Mobilities and Automation. Sustainability 2019, 11, 221. [Google Scholar] [CrossRef] [Green Version]
  63. Suartika, G.; Cuthbert, A. The Sustainable Imperative—Smart Cities, Technology and Development. Sustainability 2020, 12, 8892. [Google Scholar] [CrossRef]
  64. Wang, F.; Zhang, M.; Wang, X.; Ma, X.; Liu, J. Deep Learning for Edge Computing Applications: A State-of-the-Art Survey. IEEE Access 2020, 8, 58322–58336. [Google Scholar] [CrossRef]
  65. Antolín, J.; De Torre, C.; García-Fuentes, M.; Pérez, A.; Tomé, I.; Mirantes, M.L.; Hoyos, E. Development of an Evaluation Framework for Smartness and Sustainability in Cities. Sustainability 2020, 12, 5193. [Google Scholar] [CrossRef]
  66. Behrendt, F. Cycling the Smart and Sustainable City: Analyzing EC Policy Documents on Internet of Things, Mobility and Transport, and Smart Cities. Sustainability 2019, 11, 763. [Google Scholar] [CrossRef] [Green Version]
  67. Nižetić, S.; Šolić, P.; González-De-Artaza, D.L.-D.; Patrono, L. Internet of Things (IoT): Opportunities, issues and challenges towards a smart and sustainable future. J. Clean. Prod. 2020, 274, 122877. [Google Scholar] [CrossRef] [PubMed]
  68. Shmelev, S.E.; Shmeleva, I.A. Global urban sustainability assessment: A multidimensional approach. Sustain. Dev. 2018, 26, 904–920. [Google Scholar] [CrossRef]
  69. Alotaibi, I.; Abido, M.A.; Khalid, M.; Savkin, A.V. A Comprehensive Review of Recent Advances in Smart Grids: A Sustainable Future with Renewable Energy Resources. Energies 2020, 13, 6269. [Google Scholar] [CrossRef]
  70. Schraven, D.; Joss, S.; de Jong, M. Past, present, future: Engagement with sustainable urban development through 35 city labels in the scientific literature 1990–2019. J. Clean. Prod. 2021, 292, 125924. [Google Scholar] [CrossRef]
  71. Bibri, S.E. Data-Driven Smart Sustainable Cities of the Future: New Conceptions of and Approaches to the Spatial Scaling of Urban Form. Futur. Cities Environ. 2021, 7, 4. [Google Scholar] [CrossRef]
  72. Suliman, A.; Rankin, J.; Robak, A. CSR maturity model for smart city assessment. Can. J. Civ. Eng. 2021, 48, 785–802. [Google Scholar] [CrossRef]
  73. Deakin, M. The embedded intelligence of smart cities. Intell. Build. Int. 2011, 3, 189–197. [Google Scholar] [CrossRef]
  74. Jamei, E.; Mortimer, M.; Seyedmahmoudian, M.; Horan, B.; Stojcevski, A. Investigating the Role of Virtual Reality in Planning for Sustainable Smart Cities. Sustainability 2017, 9, 2006. [Google Scholar] [CrossRef] [Green Version]
  75. Magaia, N.; Fonseca, R.; Muhammad, K.; Segundo, A.H.F.N.; Neto, A.V.L.; de Albuquerque, V.H.C. Industrial Internet-of-Things Security Enhanced with Deep Learning Approaches for Smart Cities. IEEE Internet Things J. 2020, 8, 6393–6405. [Google Scholar] [CrossRef]
  76. Amini, M.H.; Imteaj, A.; Pardalos, P.M. Interdependent Networks: A Data Science Perspective. Gene Expr. Patterns 2020, 1, 100003. [Google Scholar] [CrossRef]
  77. Suchita, J.; Sujata, J. Role of Augmented Reality Applications for Smart City Planning. Int. J. Innov. Technol. Explor. Eng. 2019, 8, 41–46. [Google Scholar] [CrossRef]
  78. Mak, H.W.L.; Lam, Y.F. Comparative assessments and insights of data openness of 50 smart cities in air quality aspects. Sustain. Cities Soc. 2021, 69, 102868. [Google Scholar] [CrossRef]
  79. Pérez-Delhoyo, R.; Andújar-Montoya, M.; Mora, H.; Gilart-Iglesias, V.; Mollá-Sirvent, R. Participatory Management to Improve Accessibility in Consolidated Urban Environments. Sustainability 2021, 13, 8323. [Google Scholar] [CrossRef]
  80. Ke, R.; Zhuang, Y.; Pu, Z.; Wang, Y. A Smart, Efficient, and Reliable Parking Surveillance System with Edge Artificial Intelligence on IoT Devices. IEEE Trans. Intell. Transp. Syst. 2020, 22, 4962–4974. [Google Scholar] [CrossRef] [Green Version]
  81. Robaeyst, B.; Baccarne, B.; Duthoo, W.; Schuurman, D. The City as an Experimental Environment: The Identification, Selection, and Activation of Distributed Knowledge in Regional Open Innovation Ecosystems. Sustainability 2021, 13, 6954. [Google Scholar] [CrossRef]
  82. Pietruszka-Ortyl, A.; Ćwiek, M. Social Facilitators of Specialist Knowledge Dispersion in the Digital Era. Sustainability 2021, 13, 5759. [Google Scholar] [CrossRef]
  83. Kubina, M.; Šulyová, D.; Vodák, J. Comparison of Smart City Standards, Implementation and Cluster Models of Cities in North America and Europe. Sustainability 2021, 13, 3120. [Google Scholar] [CrossRef]
  84. Fletcher, A.L. Smart city visions: Pathways to participatory planning in two American cities. Foresight 2020, 22, 689–702. [Google Scholar] [CrossRef]
  85. Ortega-Fernández, A.; Martín-Rojas, R.; García-Morales, V. Artificial Intelligence in the Urban Environment: Smart Cities as Models for Developing Innovation and Sustainability. Sustainability 2020, 12, 7860. [Google Scholar] [CrossRef]
  86. Marsal-Llacuna, M.-L. How to succeed in implementing (smart) sustainable urban Agendas: “keep cities smart, make communities intelligent”. Environ. Dev. Sustain. 2018, 21, 1977–1998. [Google Scholar] [CrossRef]
  87. Al Nuaimi, E.; Al Neyadi, H.; Mohamed, N.; Al-Jaroodi, J. Applications of big data to smart cities. J. Internet Serv. Appl. 2015, 6, 1–15. [Google Scholar] [CrossRef] [Green Version]
  88. Zhao, L.; Tang, Z.-Y.; Zou, X. Mapping the Knowledge Domain of Smart-City Research: A Bibliometric and Scientometric Analysis. Sustainability 2019, 11, 6648. [Google Scholar] [CrossRef] [Green Version]
  89. Chen, D.; Wawrzynski, P.; Lv, Z. Cyber security in smart cities: A review of deep learning-based applications and case studies. Sustain. Cities Soc. 2020, 66, 102655. [Google Scholar] [CrossRef]
  90. Bibri, S.E. A methodological framework for futures studies: Integrating normative backcasting approaches and descriptive case study design for strategic data-driven smart sustainable city planning. Energy Inform. 2020, 3, 1–42. [Google Scholar] [CrossRef]
  91. Lytras, M.D.; Visvizi, A.; Chopdar, P.K.; Sarirete, A.; Alhalabi, W. Information Management in Smart Cities: Turning end users’ views into multi-item scale development, validation, and policy-making recommendations. Int. J. Inf. Manag. 2020, 56, 102146. [Google Scholar] [CrossRef]
  92. Przybyłowski, P.; Przybyłowski, A.; Kałaska, A. Utility Method as an Instrument of the Quality of Life Assessment Using the Examples of Selected European Cities. Energies 2021, 14, 2770. [Google Scholar] [CrossRef]
  93. MacLachlan, A.; Biggs, E.; Roberts, G.; Boruff, B. Sustainable City Planning: A Data-Driven Approach for Mitigating Urban Heat. Front. Built Environ. 2021, 6, 200. [Google Scholar] [CrossRef]
  94. Bibri, S.E. A foundational framework for smart sustainable city development: Theoretical, disciplinary, and discursive dimensions and their synergies. Sustain. Cities Soc. 2018, 38, 758–794. [Google Scholar] [CrossRef]
  95. Kumar, B. The (In) Security o Smart Cities: Vulnerabilities, Risks, Mitigation and Prevention. Int. J. Eng. Adv. Technol. 2019, 8, 464–470. [Google Scholar] [CrossRef]
  96. Babar, M.; Khattak, A.S.; Jan, M.A.; Tariq, M.U. Energy aware smart city management system using data analytics and Internet of Things. Sustain. Energy Technol. Assessments 2021, 44, 100992. [Google Scholar] [CrossRef]
  97. Heras, A.; Luque-Sendra, A.; Zamora-Polo, F. Machine Learning Technologies for Sustainability in Smart Cities in the Post-COVID Era. Sustainability 2020, 12, 9320. [Google Scholar] [CrossRef]
  98. Herraiz-Faixó, F.; Arroyo-Cañada, F.-J. Driving Municipal Recycling by Connecting Digital Value Endpoints in Smart Cities. Sustainability 2020, 12, 6433. [Google Scholar] [CrossRef]
  99. Biresselioglu, M.E.; Nilsen, M.; Demir, M.H.; Røyrvik, J.; Koksvik, G. Examining the barriers and motivators affecting European decision-makers in the development of smart and green energy technologies. J. Clean. Prod. 2018, 198, 417–429. [Google Scholar] [CrossRef]
  100. Ismagilova, E.; Hughes, L.; Dwivedi, Y.K.; Raman, K.R. Smart cities: Advances in research—An information systems perspective. Int. J. Inf. Manag. 2019, 47, 88–100. [Google Scholar] [CrossRef]
  101. Ferraris, A.; Santoro, G.; Papa, A. The cities of the future: Hybrid alliances for open innovation projects. Futures 2018, 103, 51–60. [Google Scholar] [CrossRef]
  102. Cantuarias-Villessuzanne, C.; Weigel, R.; Blain, J. Clustering of European Smart Cities to Understand the Cities’ Sustainability Strategies. Sustainability 2021, 13, 513. [Google Scholar] [CrossRef]
  103. von Schönfeld, K.; Ferreira, A. Urban Planning and European Innovation Policy: Achieving Sustainability, Social Inclusion, and Economic Growth? Sustainability 2021, 13, 1137. [Google Scholar] [CrossRef]
  104. Aceleanu, M.I.; Serban, A.C.; Suciu, M.-C.; Bitoiu, T.I. The Management of Municipal Waste through Circular Economy in the Context of Smart Cities Development. IEEE Access 2019, 7, 133602–133614. [Google Scholar] [CrossRef]
  105. Mosannenzadeh, F.; Di Nucci, M.R.; Vettorato, D. Identifying and prioritizing barriers to implementation of smart energy city projects in Europe: An empirical approach. Energy Policy 2017, 105, 191–201. [Google Scholar] [CrossRef]
  106. Bruzzone, M.; Dameri, R.; Demartini, P. Resilience Reporting for Sustainable Development in Cities. Sustainability 2021, 13, 7824. [Google Scholar] [CrossRef]
  107. Bibri, S.E. Backcasting in futures studies: A synthesized scholarly and planning approach to strategic smart sustainable city development. Eur. J. Futur. Res. 2018, 6, 13. [Google Scholar] [CrossRef]
  108. Toli, A.M.; Murtagh, N. The Concept of Sustainability in Smart City Definitions. Front. Built Environ. 2020, 6, 77. [Google Scholar] [CrossRef]
  109. Yin, Q.; Liu, G. Resource Scheduling and Strategic Management of Smart Cities under the Background of Digital Economy. Complexity 2020, 2020, 6624307. [Google Scholar] [CrossRef]
  110. Mills, D.E.; Izadgoshasb, I.; Pudney, S.G. Smart city collaboration: A review and an agenda for establishing sustainable collaboration. Sustainability 2021, 13, 9189. [Google Scholar] [CrossRef]
  111. Elsalam, M.F.A. Breaking through the classical determinants in the field of hyper urban planning. Constr. Innov. 2021, 21, 818–836. [Google Scholar] [CrossRef]
  112. Aurigi, A.; Odendaal, N. From “Smart in the Box” to “Smart in the City”: Rethinking the Socially Sustainable Smart City in Context. J. Urban Technol. 2020, 28, 55–70. [Google Scholar] [CrossRef]
  113. Haarstad, H.; Wathne, M.W. Are smart city projects catalyzing urban energy sustainability? Energy Policy 2019, 129, 918–925. [Google Scholar] [CrossRef]
  114. Liu, Q.; Ullah, H.; Wan, W.; Peng, Z.; Hou, L.; Rizvi, S.S.; Haidery, S.A.; Qu, T.; Muzahid, A.A.M. Categorization of Green Spaces for a Sustainable Environment and Smart City Architecture by Utilizing Big Data. Electronics 2020, 9, 1028. [Google Scholar] [CrossRef]
  115. Martin, C.; Evans, J.; Karvonen, A.; Paskaleva, K.; Yang, D.; Linjordet, T. Smart-sustainability: A new urban fix? Sustain. Cities Soc. 2018, 45, 640–648. [Google Scholar] [CrossRef]
  116. Carli, R.; Dotoli, M.; Pellegrino, R. Multi-criteria decision-making for sustainable metropolitan cities assessment. J. Environ. Manag. 2018, 226, 46–61. [Google Scholar] [CrossRef] [PubMed]
  117. Esmaeilian, B.; Wang, B.; Lewis, K.; Duarte, F.; Ratti, C.; Behdad, S. The future of waste management in smart and sustainable cities: A review and concept paper. Waste Manag. 2018, 81, 177–195. [Google Scholar] [CrossRef] [PubMed]
  118. Preston, S.; Mazhar, M.U.; Bull, R. Citizen Engagement for Co-Creating Low Carbon Smart Cities: Practical Lessons from Nottingham City Council in the UK. Energies 2020, 13, 6615. [Google Scholar] [CrossRef]
  119. Graziano, T. Smart Technologies, Back-to-the-Village Rhetoric, and Tactical Urbanism. Int. J. E-Plan. Res. 2021, 10, 80–93. [Google Scholar] [CrossRef]
  120. Hayes, B.; Kamrowska-Zaluska, D.; Petrovski, A.; Jiménez-Pulido, C. State of the Art in Open Platforms for Collaborative Urban Design and Sharing of Resources in Districts and Cities. Sustainability 2021, 13, 4875. [Google Scholar] [CrossRef]
  121. Suganthi, L.; Suganthi, L. Multi expert and multi criteria evaluation of sectoral investments for sustainable development: An integrated fuzzy AHP, VIKOR/DEA methodology. Sustain. Cities Soc. 2018, 43, 144–156. [Google Scholar] [CrossRef]
  122. Gil, M.T.N.; Carvalho, L.; Paiva, I. Determining factors in becoming a sustainable smart city: An empirical study in Europe. Econ. Sociol. 2020, 13, 24–39. [Google Scholar] [CrossRef]
  123. Patias, N.; Rowe, F.; Cavazzi, S.; Arribas-Bel, D. Sustainable urban development indicators in Great Britain from 2001 to 2016. Landsc. Urban Plan. 2021, 214, 104148. [Google Scholar] [CrossRef]
Figure 1. Flowchart of research methodology.
Data 06 00115 g001
Figure 2. Flow diagram for new systematic reviews that included searches of databases and registers only (adapted from PRISMA 2020).
Data 06 00115 g002
Figure 3. Publications per year from 2011 to 2021 (generated by Scopus).
Data 06 00115 g003
Figure 4. Publication per year by source (generated by Scopus).
Data 06 00115 g004
Figure 5. Publications by country.
Data 06 00115 g005
Figure 6. Mapping of index keywords used in articles.
Data 06 00115 g006
Figure 7. Hierarchical structure of the problem.
Data 06 00115 g007
Figure 8. ISM model for the drivers on the transition to Society 5.0.
Data 06 00115 g008
Figure 9. Number of studies per group of factors.
Data 06 00115 g009
Figure 10. MICMAC analysis for driving power and dependence power of factors.
Data 06 00115 g010
Table 1. Saaty scale definition and explanation.
Rating ScaleDefinitionExplanation
1Equal importanceTwo elements contribute equally to the objective
2WeakBetween equal and moderate
3Moderate importanceExperience and judgment slightly favor one element over another
4Moderate plusBetween moderate and strong
5Strong importanceExperience and judgment strongly favor one element over another
6Strong plusBetween strong and very strong
7Very strong or demonstrated importanceAn element is favored very strongly over another, its dominance demonstrated in practice
8Very, very strong Between very strong and extreme
9Extreme importanceThe evidence favoring one element over another is one of the highest possible order or affirmation
Table 2. Factors enabling Society 5.0.
GroupSubgroup FactorReference
ObjectiveHealthcare[20,45,49,58,59,76]
Mobility[30,31,46,62,77,84]
Infrastructure[19,22,28,31,46,56,57,59,62]
KETsSmart manufacturing technologies Robotics[12,13,20,21,85]
3D printing[18,19,31]
AR/VR[25,74,77]
Smart connecting
technologies
Advanced sensors[22,23,27,55,59,86]
Remote control[17,25,31,42,76]
Mobile Internet[20,61,87,88]
Data processing
and Big Data
Simulation[28,41,52,71,72]
Big Data[6,21,23,24,27,28,30,41,42,49,71,87,89,90,91,92]
Data analysis [6,13,23,31,91,93]
Cloud computing[22,23,30,91,94,95]
Internet of Things[22,23,24,27,28,30,31,48,49,61,67,80,89,95,96,97,98]
CommunicationHorizontal[55,78,99,100,101,102]
Transversal[55,78,99,100,101,102]
Vertical[55,78,99,100,101,102]
SustainabilityEconomic[5,41,42,44,46,53,70,97,98,100,103,104,105,106,107,108,109]
Social[5,22,41,42,46,47,53,55,91,97,98,100,102,103,106,108,110,111,112,113]
Environmental[5,20,23,31,41,42,47,53,67,68,92,100,103,106,108,110,114,115,116,117,118]
StakeholderPublic[42,46,53,62,81,82,83,101,103,119]
Private[42,46,53,62,81,82,83,101,103,119]
Governance Local[1,5,43,54,70,91,99,100,102,119,120,121,122,123]
National[1,5,43,54,70,91,99,100,102,119,120,121,122,123]
International[1,5,43,54,70,91,99,100,102,119,120,121,122,123]
Table 3. Criteria pairwise comparison according to the Saaty scale and normalized weights (Inconsistency = 4.8%).
CommunicationGovernanceKETsObjectiveStakeholderSustainabilityNormalized Weight
Communication1320.550.200.129
Governance0.3310.330.1720.140.045
KETs0.503.0010.2040.200.088
Objective265170.330.252
Stakeholder0.200.500.250.1410.130.031
Sustainability5753810.454
Table 4. Normalized weight and relative weight of factors.
No.GroupSubgroup FactorFactor WeightRelative Weight
1Communication Transversal0.6820.085
2Governance International0.6820.085
3KETsSmart manufacturing Robotics0.6690.084
4Objective Healthcare0.6670.083
5Stakeholder Public0.5000.063
6Stakeholder Private0.5000.063
7KETsData processing and Big DataBig Data0.4760.060
8Sustainability Social0.4290.054
9Sustainability Environmental0.4290.054
10KETsSmart connecting Advanced sensors0.4000.050
11KETsSmart connecting Mobile Internet0.4000.050
12KETsData processing and Big DataData analysis 0.2670.033
13KETsSmart manufacturing AR/VR0.2430.030
14Governance National0.2360.030
15Communication Vertical0.2360.030
16KETsSmart connecting Remote control0.2000.025
17Objective Mobility0.1670.021
18Objective Infrastructure0.1670.021
19Sustainability Economic0.1430.018
20KETsData processing and Big DataInternet of things0.1370.017
21KETsSmart manufacturing 3D printing0.0880.011
22Communication Horizontal0.0820.010
23Governance Local0.0820.010
24KETsData processing and Big DataSimulation0.0720.009
25KETsData processing and Big DataCloud computing0.0470.006
Total 8
Therefore, the first 13 factors will be subjected to ISM methodology to determine how they relate to ensure that Society 5.0 can be achieved.
Table 5. Structural self-interaction matrix (SSIM).
No.Determinants12345678910111213
1Transversal XOOAAAXXOAAO
2International OVXVXVVXXXX
3Robotics VXXAXOXXXX
4Healthcare XXAAAAAAA
5Public XAVVAAAA
6Private AVVAAAA
7Big Data VVXXXX
8Social XAAAA
9Environmental AAAA
10Advanced sensors XXX
11Mobile internet XX
12Data analysis X
13AR/VR
Table 6. Final reachability matrix.
No.Determinants12345678910111213Driving
Power
1Transversal11000001100004
2International110111111111112
3Robotics00111101011119
4Healthcare00010000000001
5Public11111101100008
6Private10111101100007
7Big Data111111111111113
8Social10110001100005
9Environmental10010001100004
10Advanced sensors011111111111112
11Mobile Internet111111111111113
12Data analysis 111111111111113
13AR/VR011111111111112
Dependence Power9891299612117777
Table 7. Iteration 1 of level partition of factors.
No.FactorsReachability SetAntecedent SetIntersection SetLevel
1Transversal1, 2, 8, 91, 2, 5, 6, 7, 8, 9, 11, 121, 2, 8, 9I
2International1, 2, 4, 5, 6, 7, 8, 9, 10, 11, 12, 131, 2, 5, 7, 10, 11, 12, 131, 2, 5, 7, 10, 11, 12, 13
3Robotics3, 4, 5, 6, 8, 10, 11, 12, 133, 5, 6, 7, 8, 10, 11, 12, 133, 5, 6, 8, 10, 11, 12, 13
4Healthcare42, 3, 4, 5, 6, 7, 8, 9, 10, 11, 12, 134I
5Public1, 2, 3, 4, 5, 6, 8, 92, 3, 5, 6, 7, 10, 11, 12, 132, 3, 5
6Private1, 3, 4, 5, 6, 8, 92, 3, 5, 6, 7, 10, 11, 12, 133, 5, 6
7Big Data1, 2, 4, 5, 6, 7, 8, 9, 10, 11, 12, 132, 7, 10, 11, 12, 132, 7, 10, 11, 12, 13
8Social1, 3, 4, 8, 91, 2, 3, 5, 6, 7, 8, 9, 10, 11, 12, 131, 3, 8, 9
9Environmental1, 3, 4, 8, 91, 2, 5, 6, 7, 8, 9, 10, 11, 12, 131, 8, 9
10Advanced sensors2, 4, 5, 6, 7, 8, 9, 10, 11, 12, 132, 3, 7, 10, 11, 12, 132, 7, 10, 11, 12, 13
11Mobile Internet1, 2, 4, 5, 6, 7, 8, 9, 10, 11, 12, 132, 3, 7, 10, 11, 12, 132, 7, 10, 11, 12, 13
12Data analysis 1, 2, 4, 5, 6, 7, 8, 9, 10, 11, 12, 132, 3, 7, 10, 11, 12, 132, 7, 10, 11, 12, 13
13AR/VR2, 4, 5, 6, 7, 8, 9, 10, 11, 12, 132, 3, 7, 10, 11, 12, 142, 7, 10, 11, 12, 13
Table 8. Iteration 2 of level partition of factors.
No.FactorsReachability SetAntecedent SetIntersection SetLevel
2International1, 3, 4, 5, 6, 7, 8, 9, 10, 111, 3, 5, 8, 9, 10, 111, 3, 5, 8, 9, 10, 11
3Robotics2, 3, 4, 6, 8, 9, 10, 112, 3, 4, 5, 6, 8, 9, 10 112, 3, 4, 6, 8, 9, 10, 11II
5Public1, 2, 3, 4, 6, 71, 2, 3, 4, 5, 8, 9, 10, 111, 2, 3, 4
6Private2, 3, 4, 6, 71, 2, 3, 4, 5, 8, 9, 10, 112, 3, 4
7Big Data1, 2, 3, 4, 5, 6, 7, 8, 9, 10, 111, 5, 8, 9, 10, 111, 5, 8, 9, 10, 11
8Social1, 6, 71, 2, 3, 4, 5, 6, 7, 8, 9, 10, 111, 6, 7II
9Environmental6, 71, 3, 4, 5, 6, 7, 8, 9, 10, 116, 7II
10Advanced sensors1, 2, 3, 4, 5, 6, 7, 8, 9, 10, 111, 2, 5, 8, 9, 10, 111, 2, 5, 8, 9, 10, 11
11Mobile Internet1, 2, 3, 4, 5, 6, 7, 8, 9, 10, 111, 2, 5, 8, 9, 10, 111, 2, 5, 8, 9, 10, 11
12Data analysis 1, 2, 3, 4, 5, 6, 7, 8, 9, 10, 111, 2, 5, 8, 9, 10, 111, 2, 5, 8, 9, 10, 11
13AR/VR1, 2, 3, 4, 5, 6, 7, 8, 9, 10, 111, 2, 5, 8, 9, 10, 111, 2, 5, 8, 9, 10, 11
Table 9. Iteration 3 of level partition of factors.
No.FactorsReachability SetAntecedent SetIntersection SetLevel
2International1, 2, 3, 4, 5, 6, 7, 81, 2, 4, 5, 6, 7, 81, 2, 4, 5, 6, 7, 8
5Public1, 2, 31, 2, 3, 4, 5, 6, 7, 81, 2, 3III
6Private2, 31, 2, 3, 4, 5, 6, 7, 82, 3III
7Big Data1, 2, 3, 4, 5, 6, 7, 81, 4, 5, 6, 7, 81, 4, 5, 6, 7, 8
10Advanced sensors1, 2, 3, 4, 5, 6, 7, 91, 4, 5, 6, 7, 91, 4, 5, 6, 7, 9
11Mobile Internet1, 2, 3, 4, 5, 6, 7, 101, 4, 5, 6, 7, 101, 4, 5, 6, 7, 10
12Data analysis 1, 2, 3, 4, 5, 6, 7, 111, 4, 5, 6, 7, 111, 4, 5, 6, 7, 11
13AR/VR1, 2, 3, 4, 5, 6, 7, 121, 4, 5, 6, 7, 121, 4, 5, 6, 7, 12
Table 10. Iteration 4 of level partition of factors.
No.FactorsReachability SetAntecedent SetIntersection SetLevel
1International1, 2, 3, 4, 5, 61, 2, 3, 4, 5, 61, 2, 3, 4, 5, 6IV
11Big Data1, 2, 3, 4, 5, 71, 2, 3, 4, 5, 71, 2, 3, 4, 5, 7IV
12Advanced sensors1, 2, 3, 4, 5, 81, 2, 3, 4, 5, 81, 2, 3, 4, 5, 8IV
13Mobile Internet1, 2, 3, 4, 5, 91, 2, 3, 4, 5, 91, 2, 3, 4, 5, 9IV
Table 11. List of factors and their implication in Society 5.0.
No.GroupSubgroup FactorImplication
1Communication TransversalInvolvement of customers; increased quality of life
2Governance InternationalOpportunities for economic growth, creating more jobs for citizens.
3KETsSmart manufacturing RoboticsIncrease in quality of life (citizen independence in the health sector, occupational safety)
4Objective HealthcareRemote health care, increase in life expectancy
5Stakeholder PublicInterest in the overall digital path; involves the citizen.
6Stakeholder Private
7KETsData processing and Big DataBig DataAggregation of a larger amount of data to connect cyberspace with physical space; greater control of goods and services by the citizen.
8Sustainability SocialCommunity involvement, human resources, physical resources, environmental contributions and contributions by product or service to society and customers.
9Sustainability Environmental
10KETsSmart connecting Advanced sensorsAggregation of a larger amount of data to connect cyberspace with physical space; greater control of goods and services by the citizen.
11KETsSmart connecting Mobile internet
12KETsData processing and Big DataData analysis
13KETsSmart manufacturing AR/VR
Publisher’s Note: MDPI stays neutral with regard to jurisdictional claims in published maps and institutional affiliations.

