Visual Analytics Approach to Comprehensive Meteorological Time-Series Analysis


Abstract
1. Introduction
1.1. Background
1.2. Overview
2. Data Sources
3. Methods
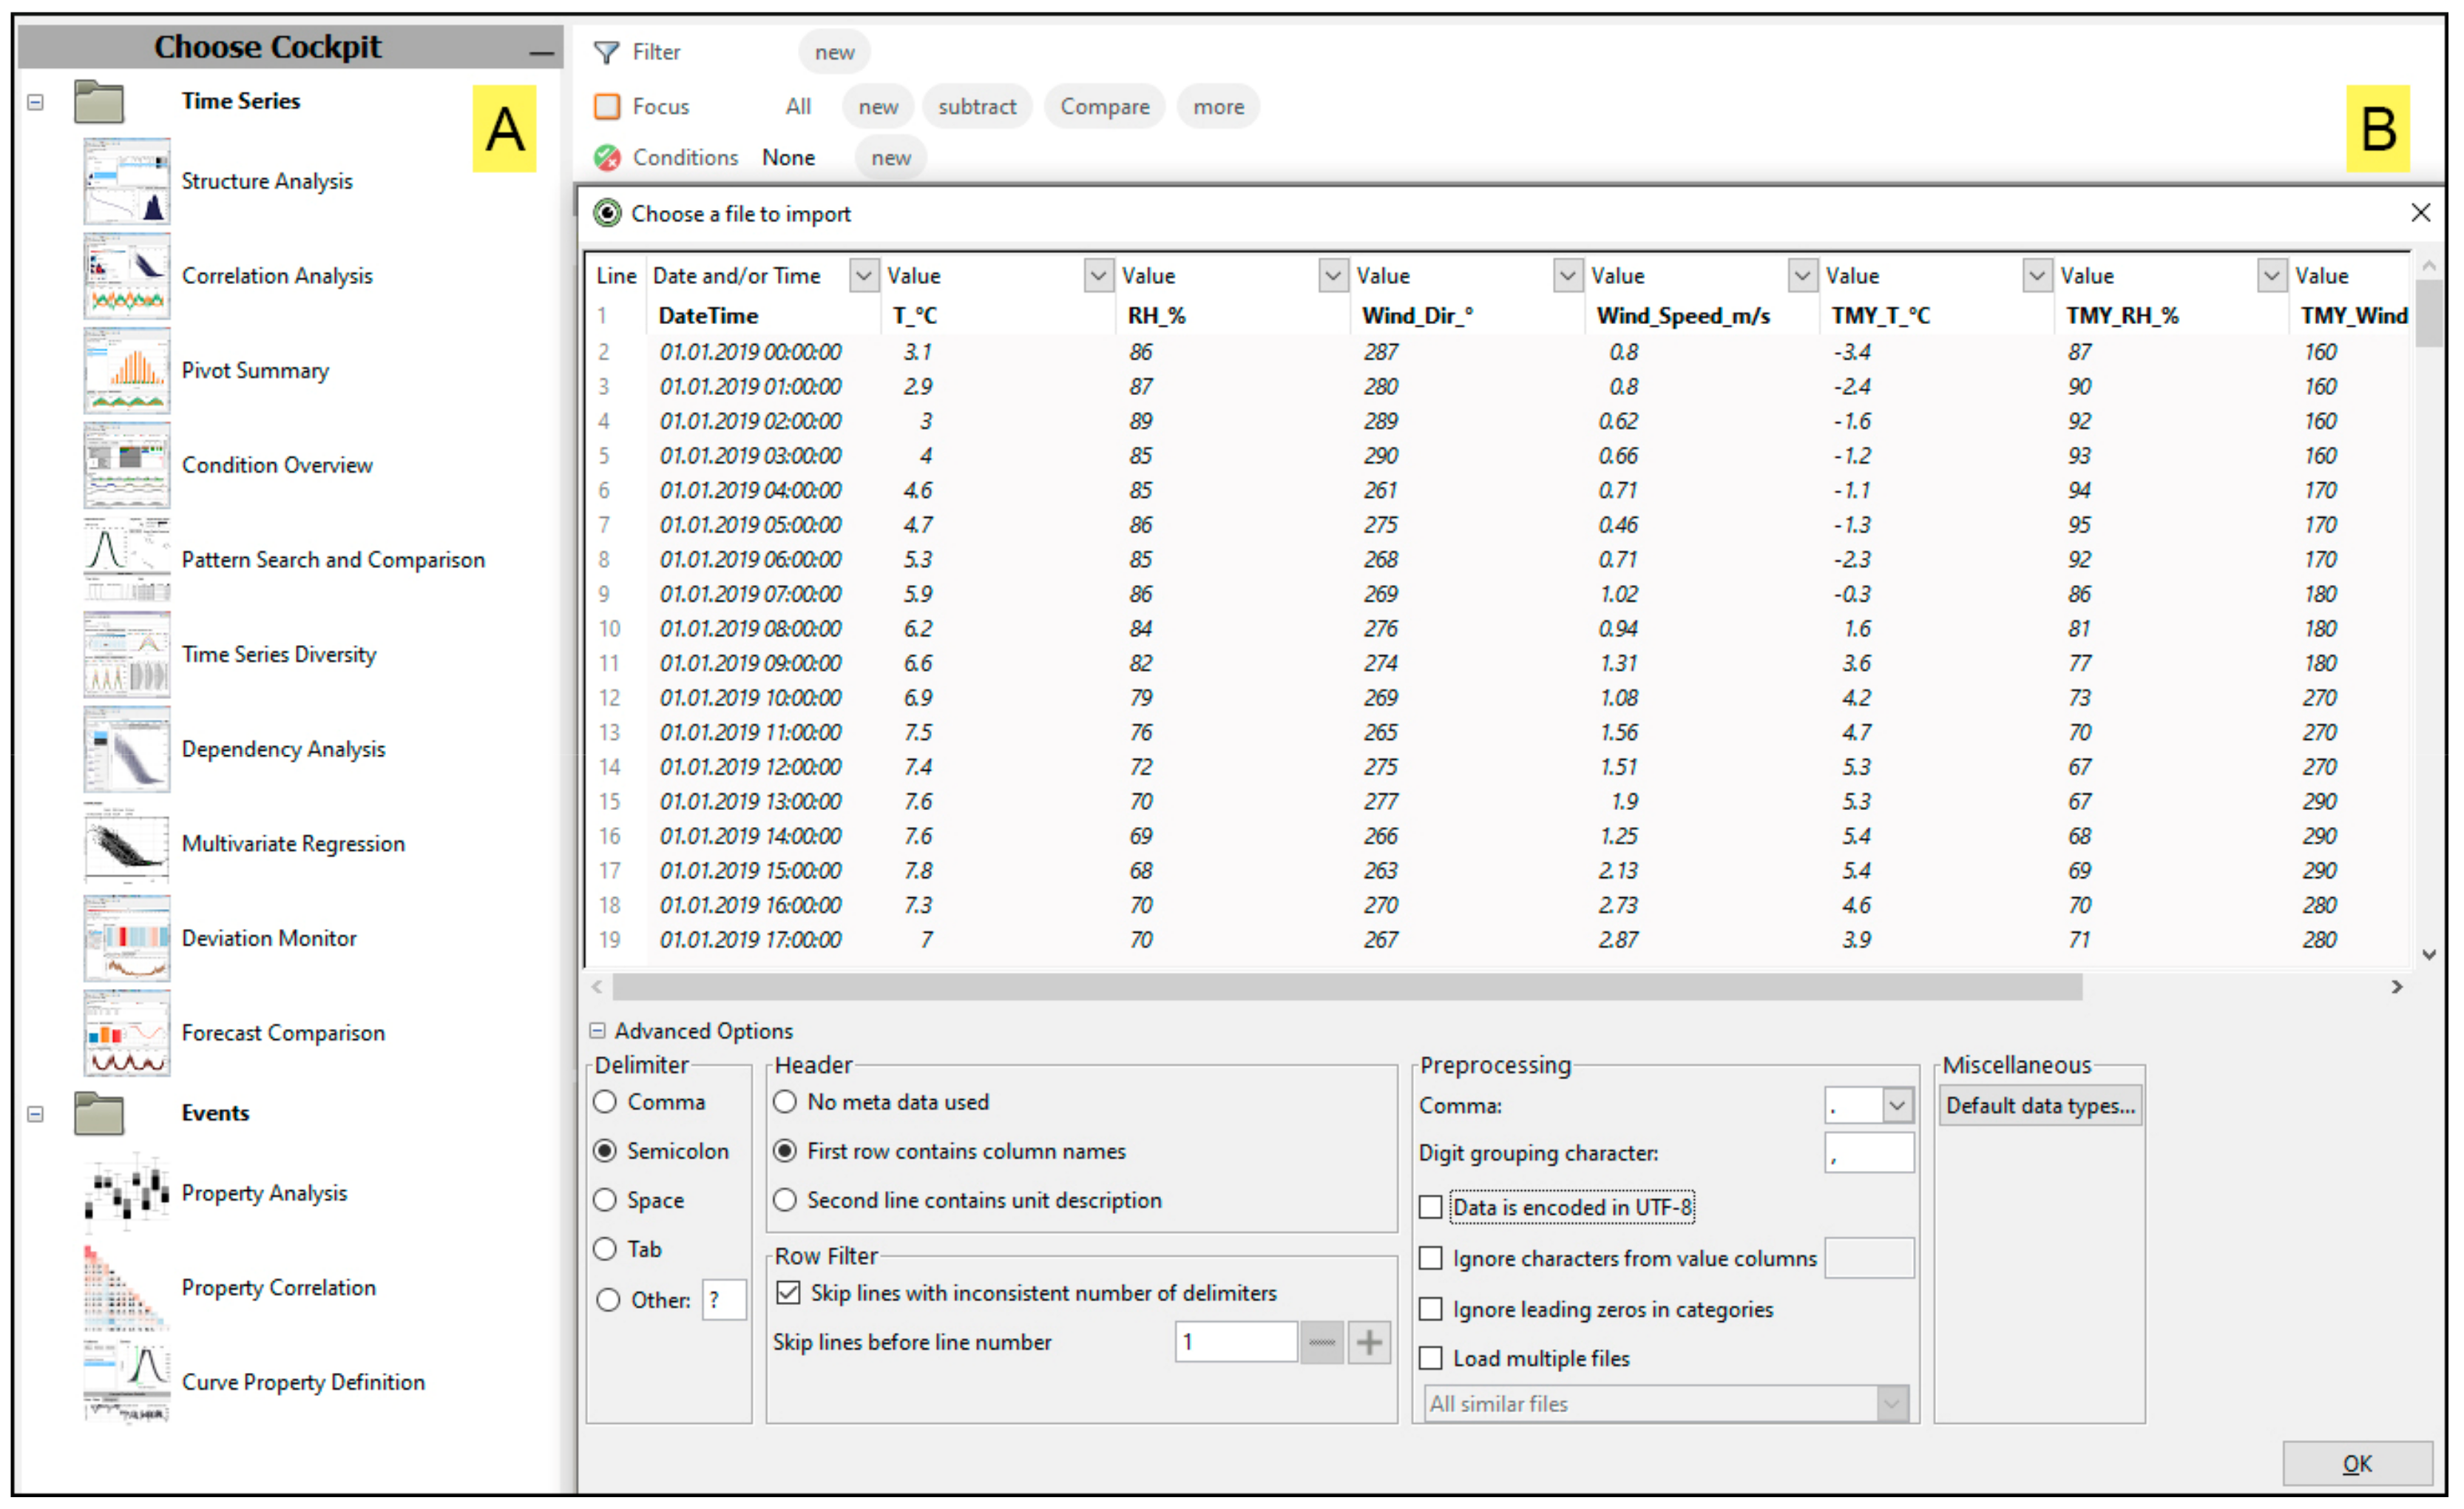
3.1. Data Import
3.2. Data Structure and Quality Check
3.3. Data Diversity, Pattern Search, and Anomaly Detection
3.4. Communicating Insights and Findings
4. Results and Discussion
4.1. Advantages of Visual Analytics Approach over Traditional Descriptive Methods
4.2. Comprehensive Analysis of Meteorological Time Series
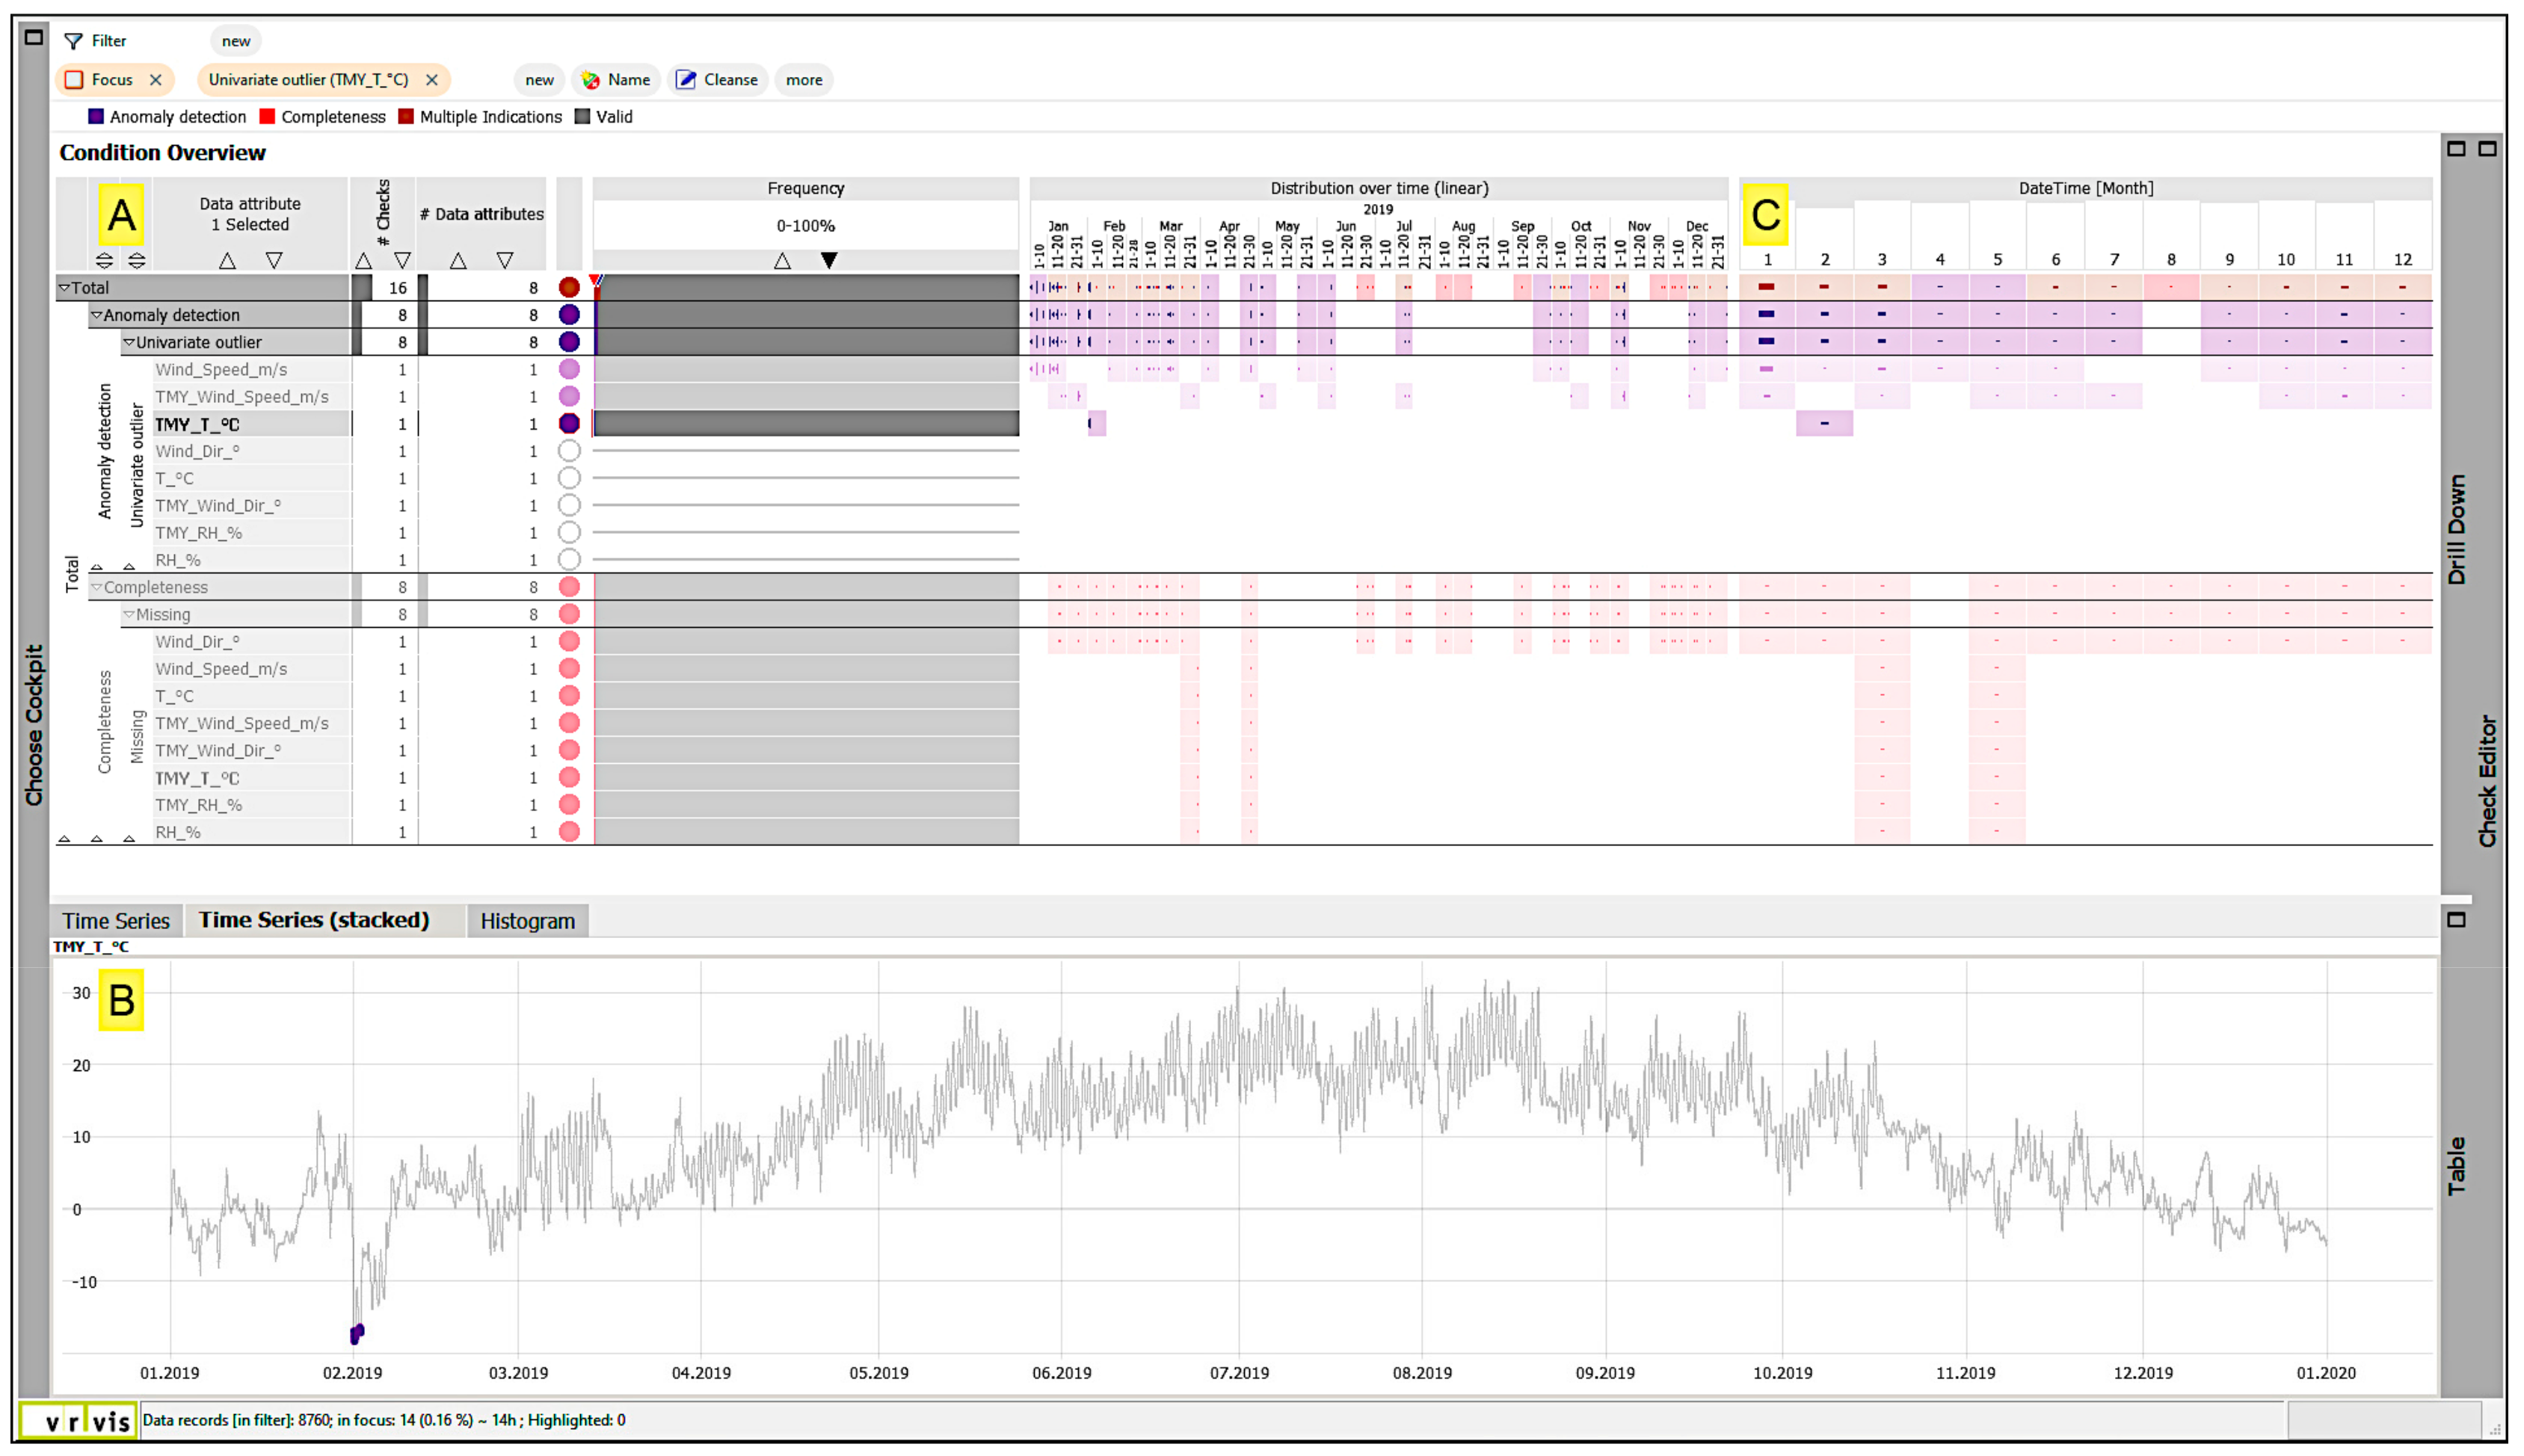
4.2.1. Completeness Check and Anomaly Detection
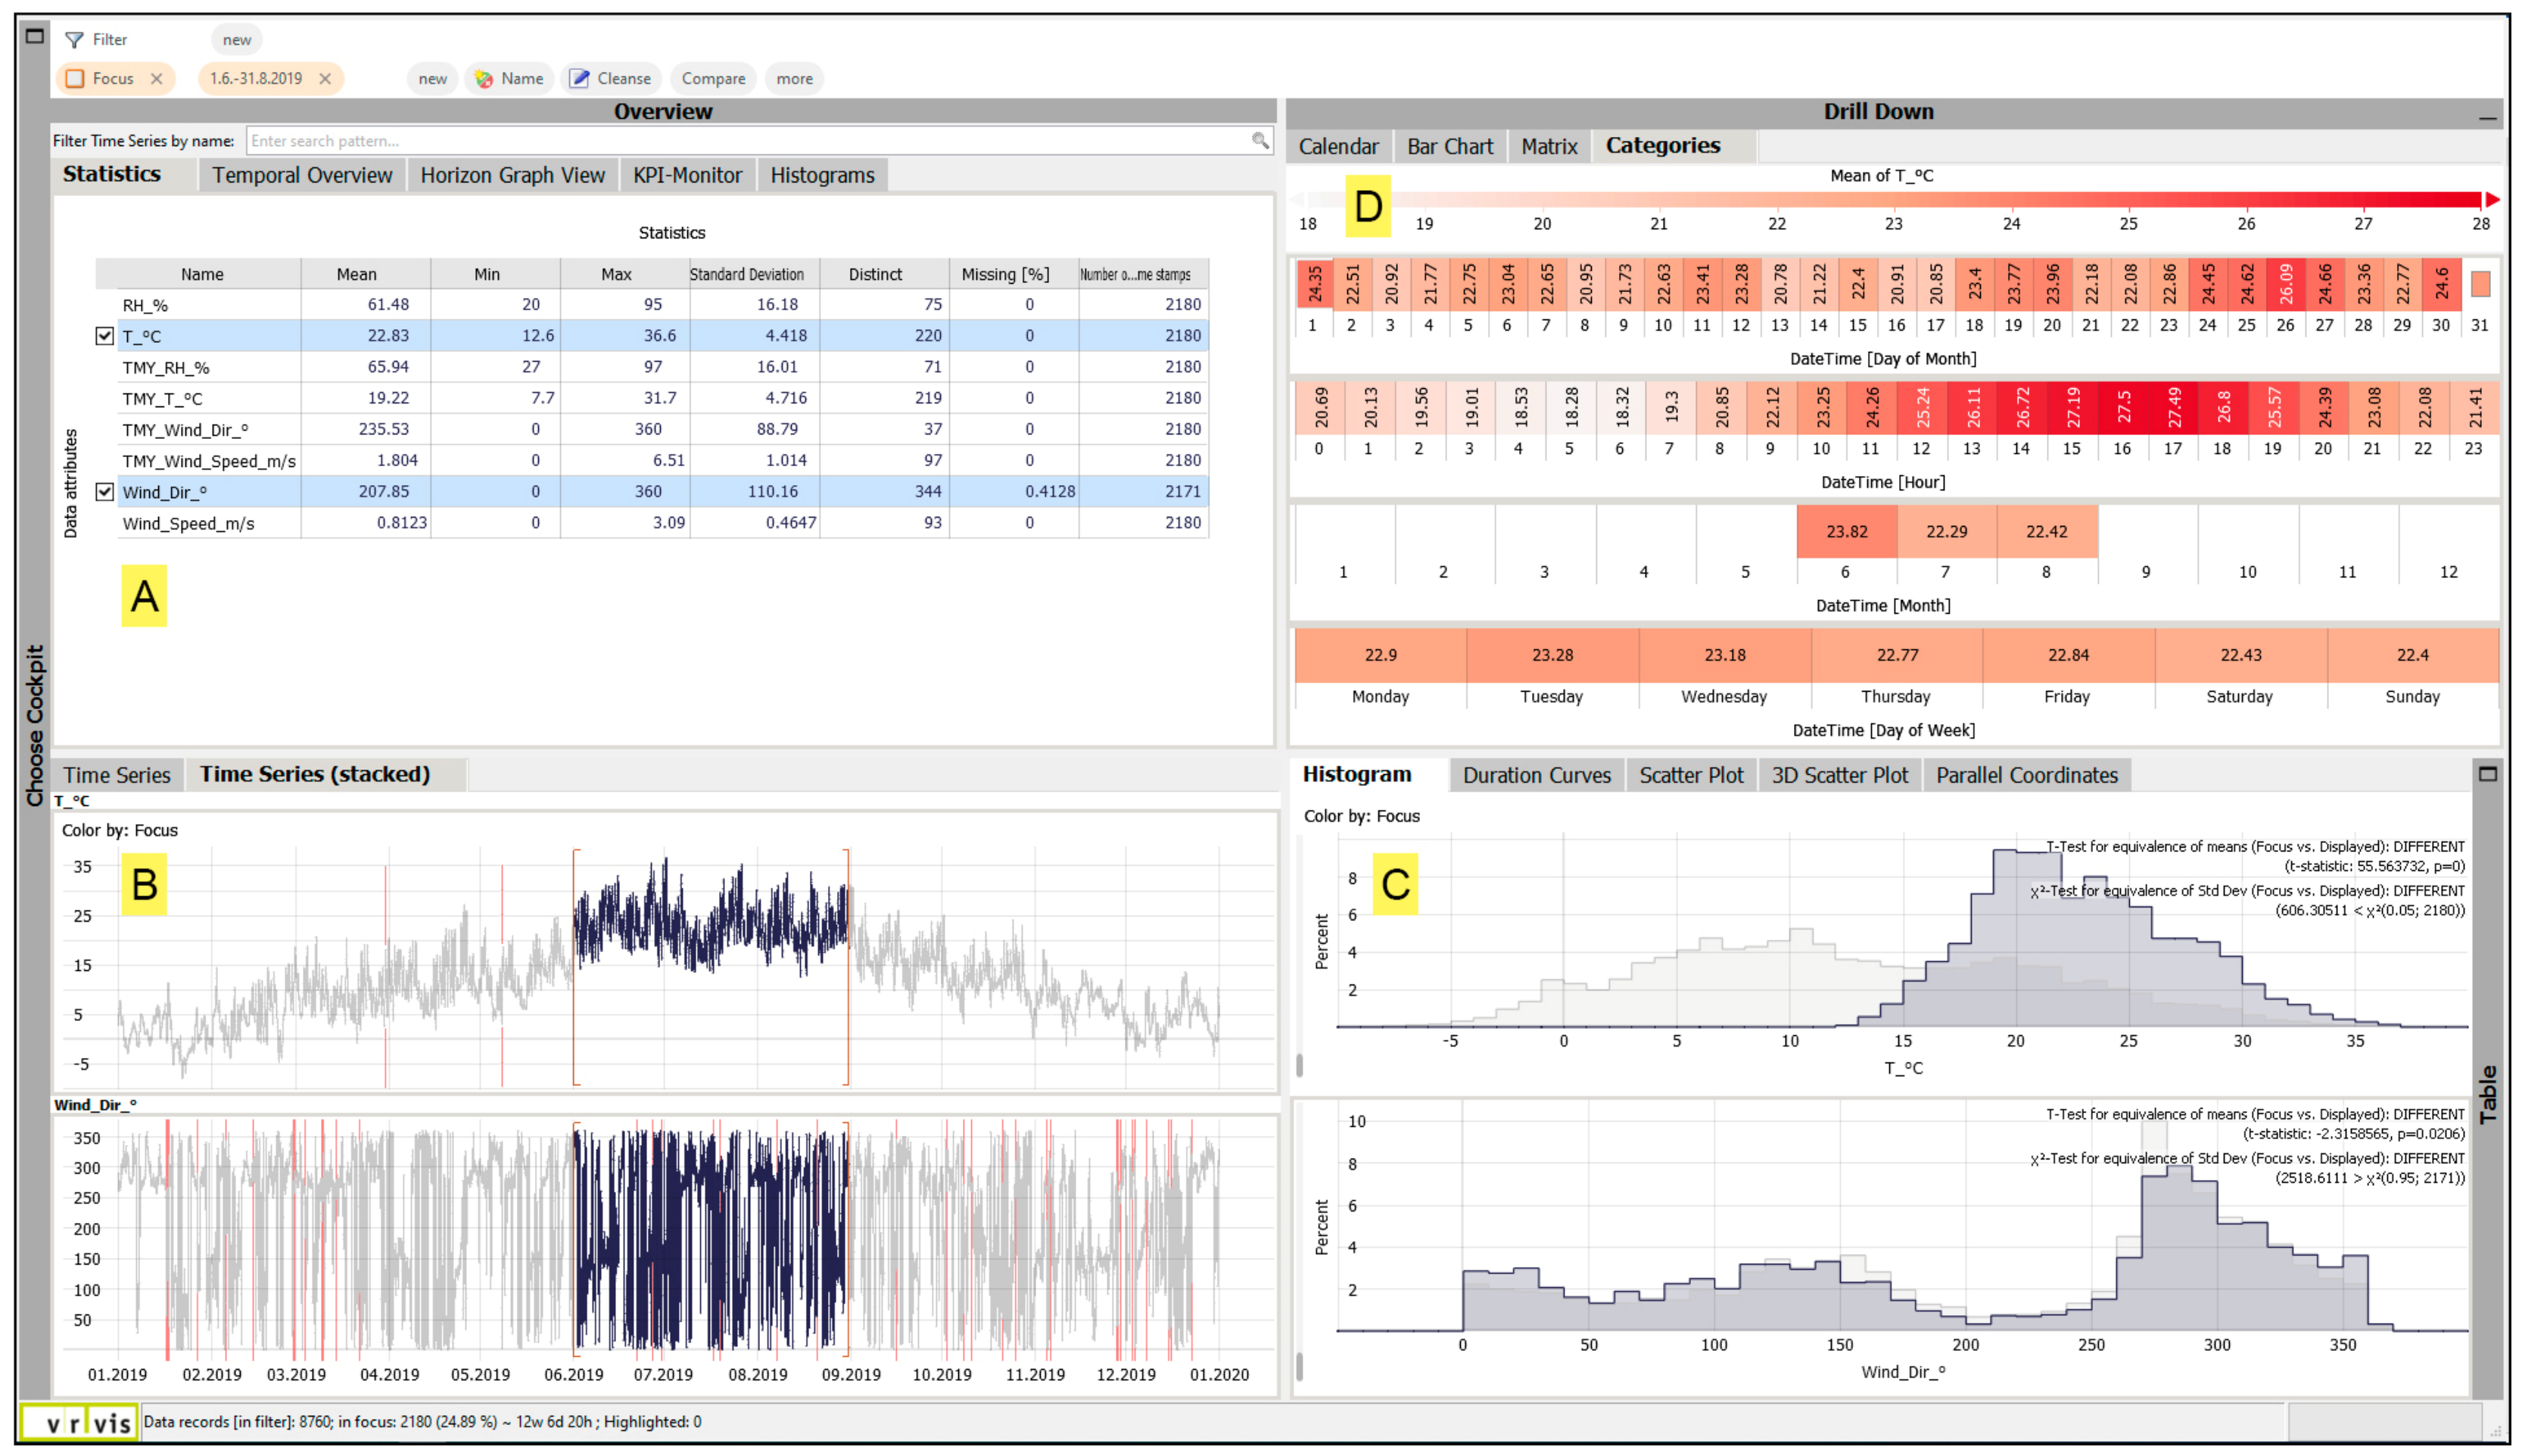
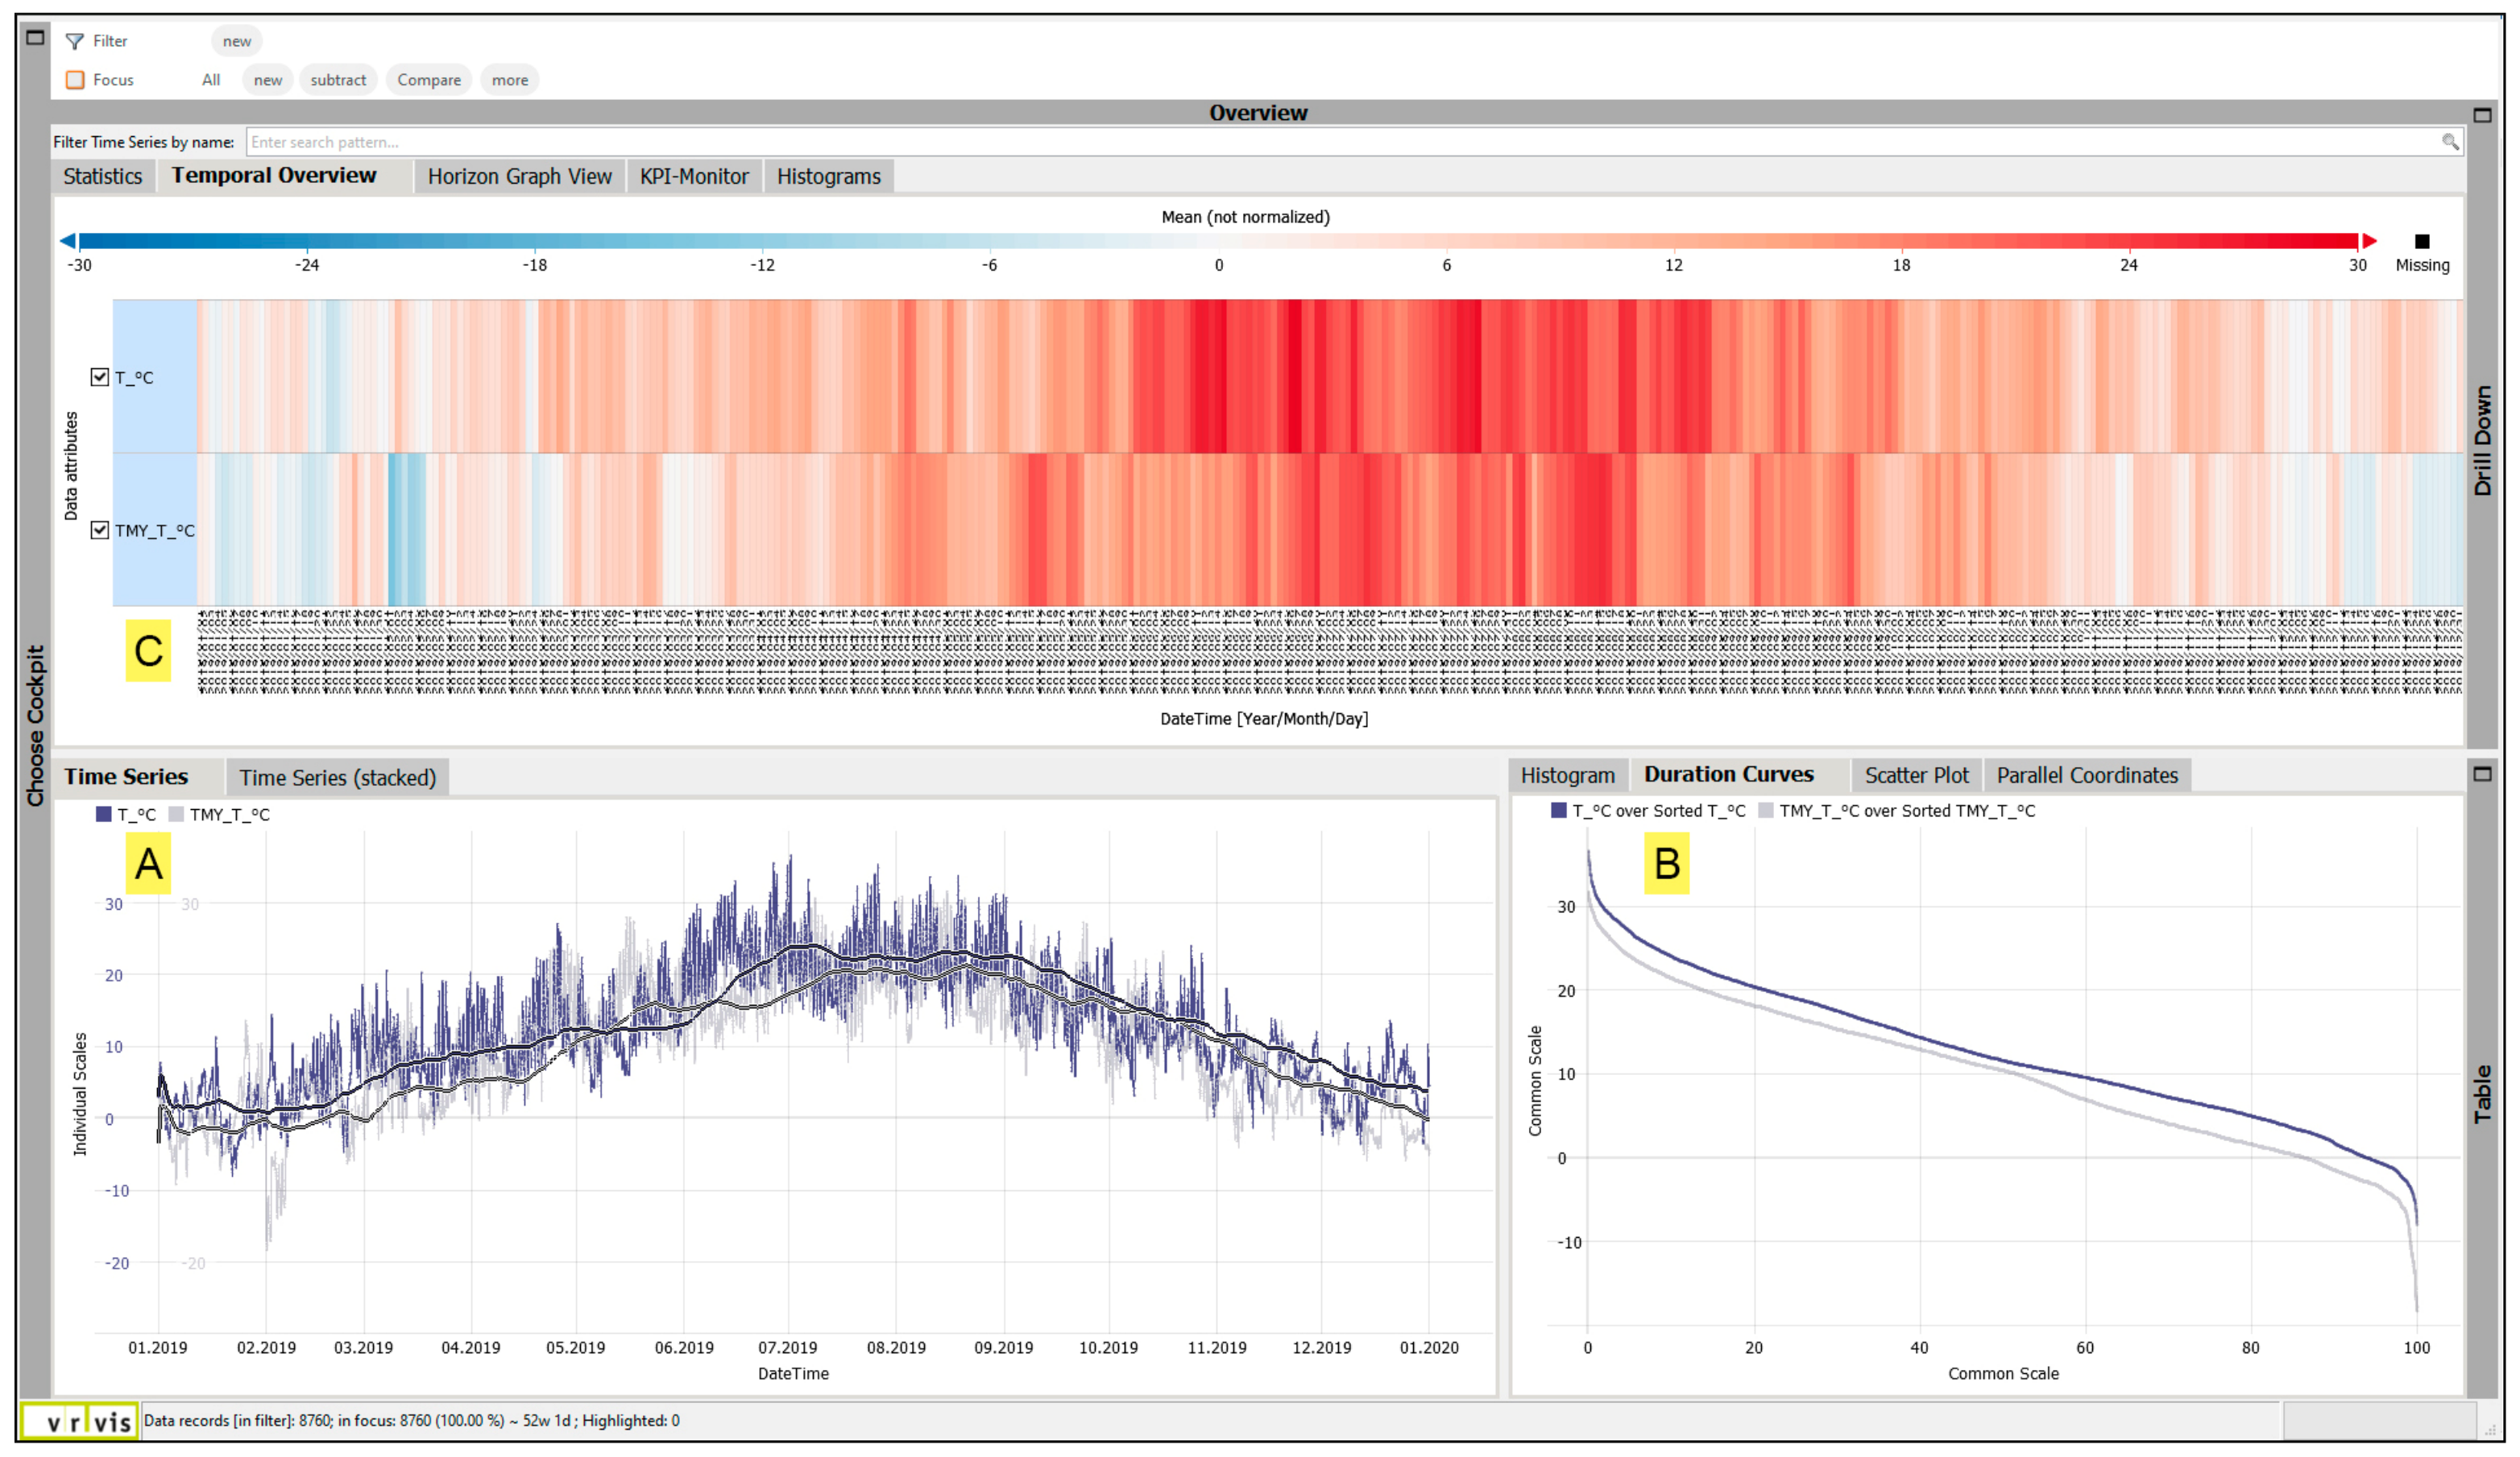
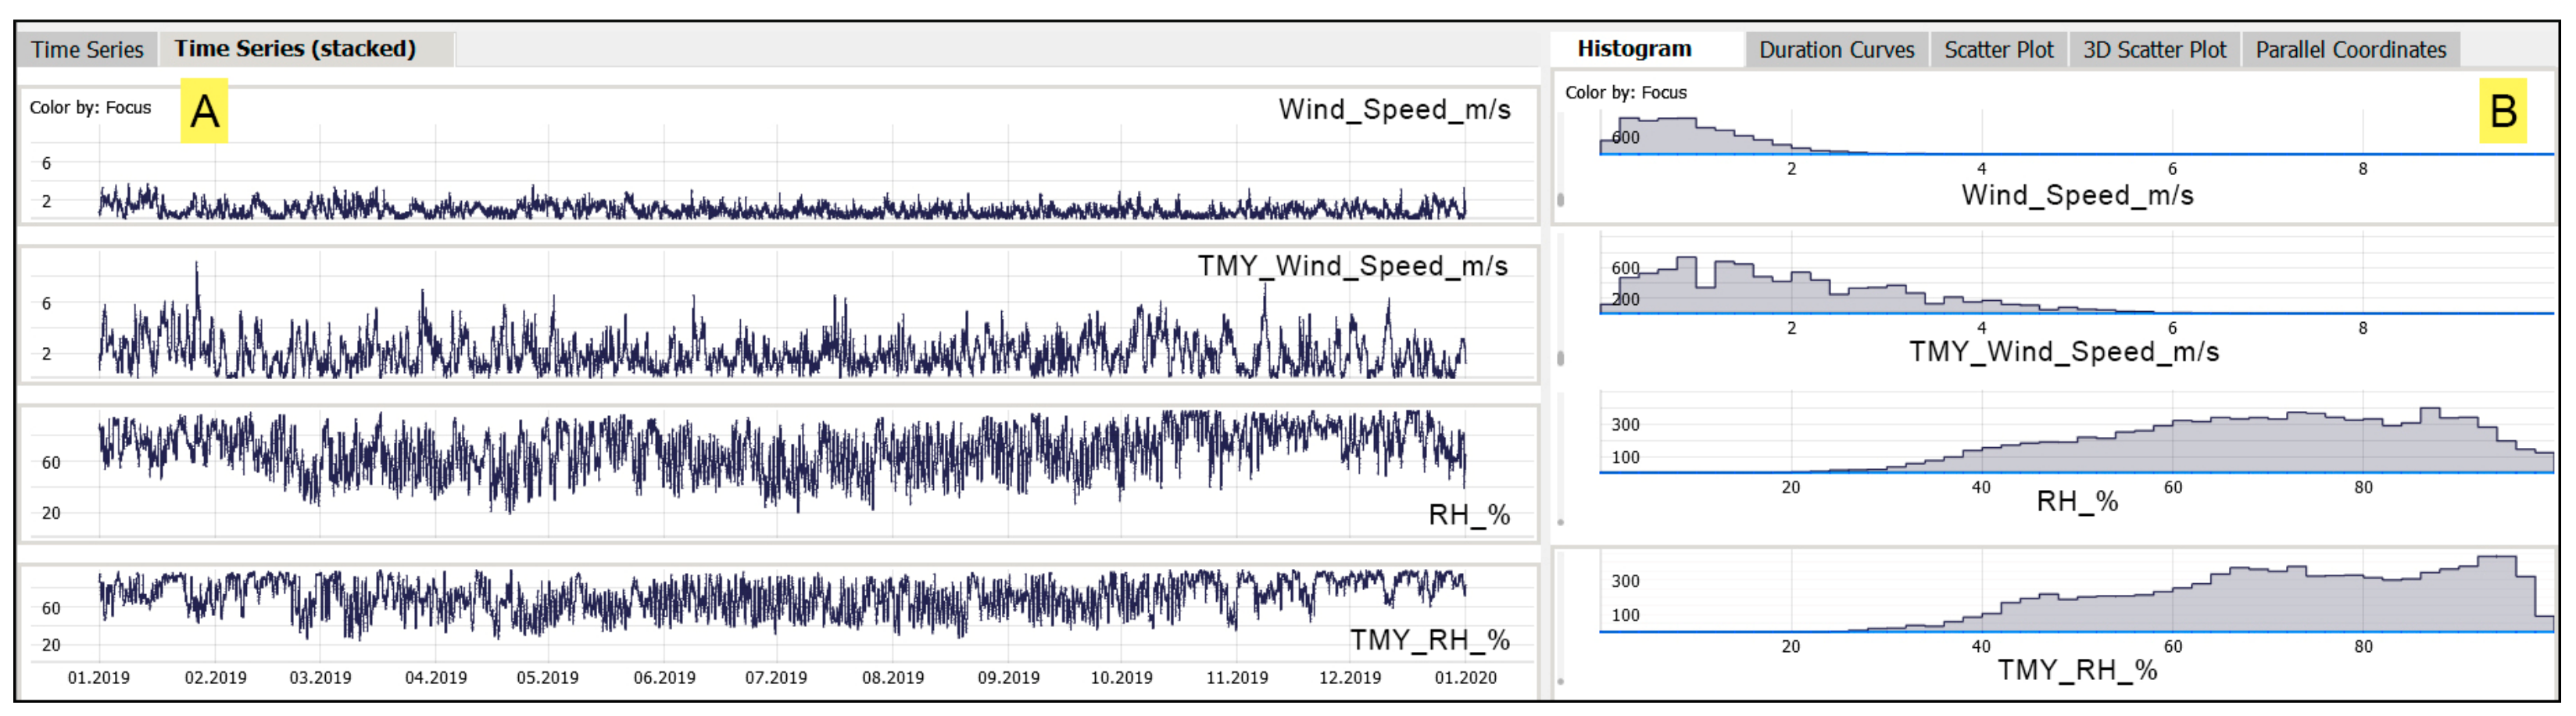
4.2.2. Data Diversity and Pattern Search
Annual Analysis
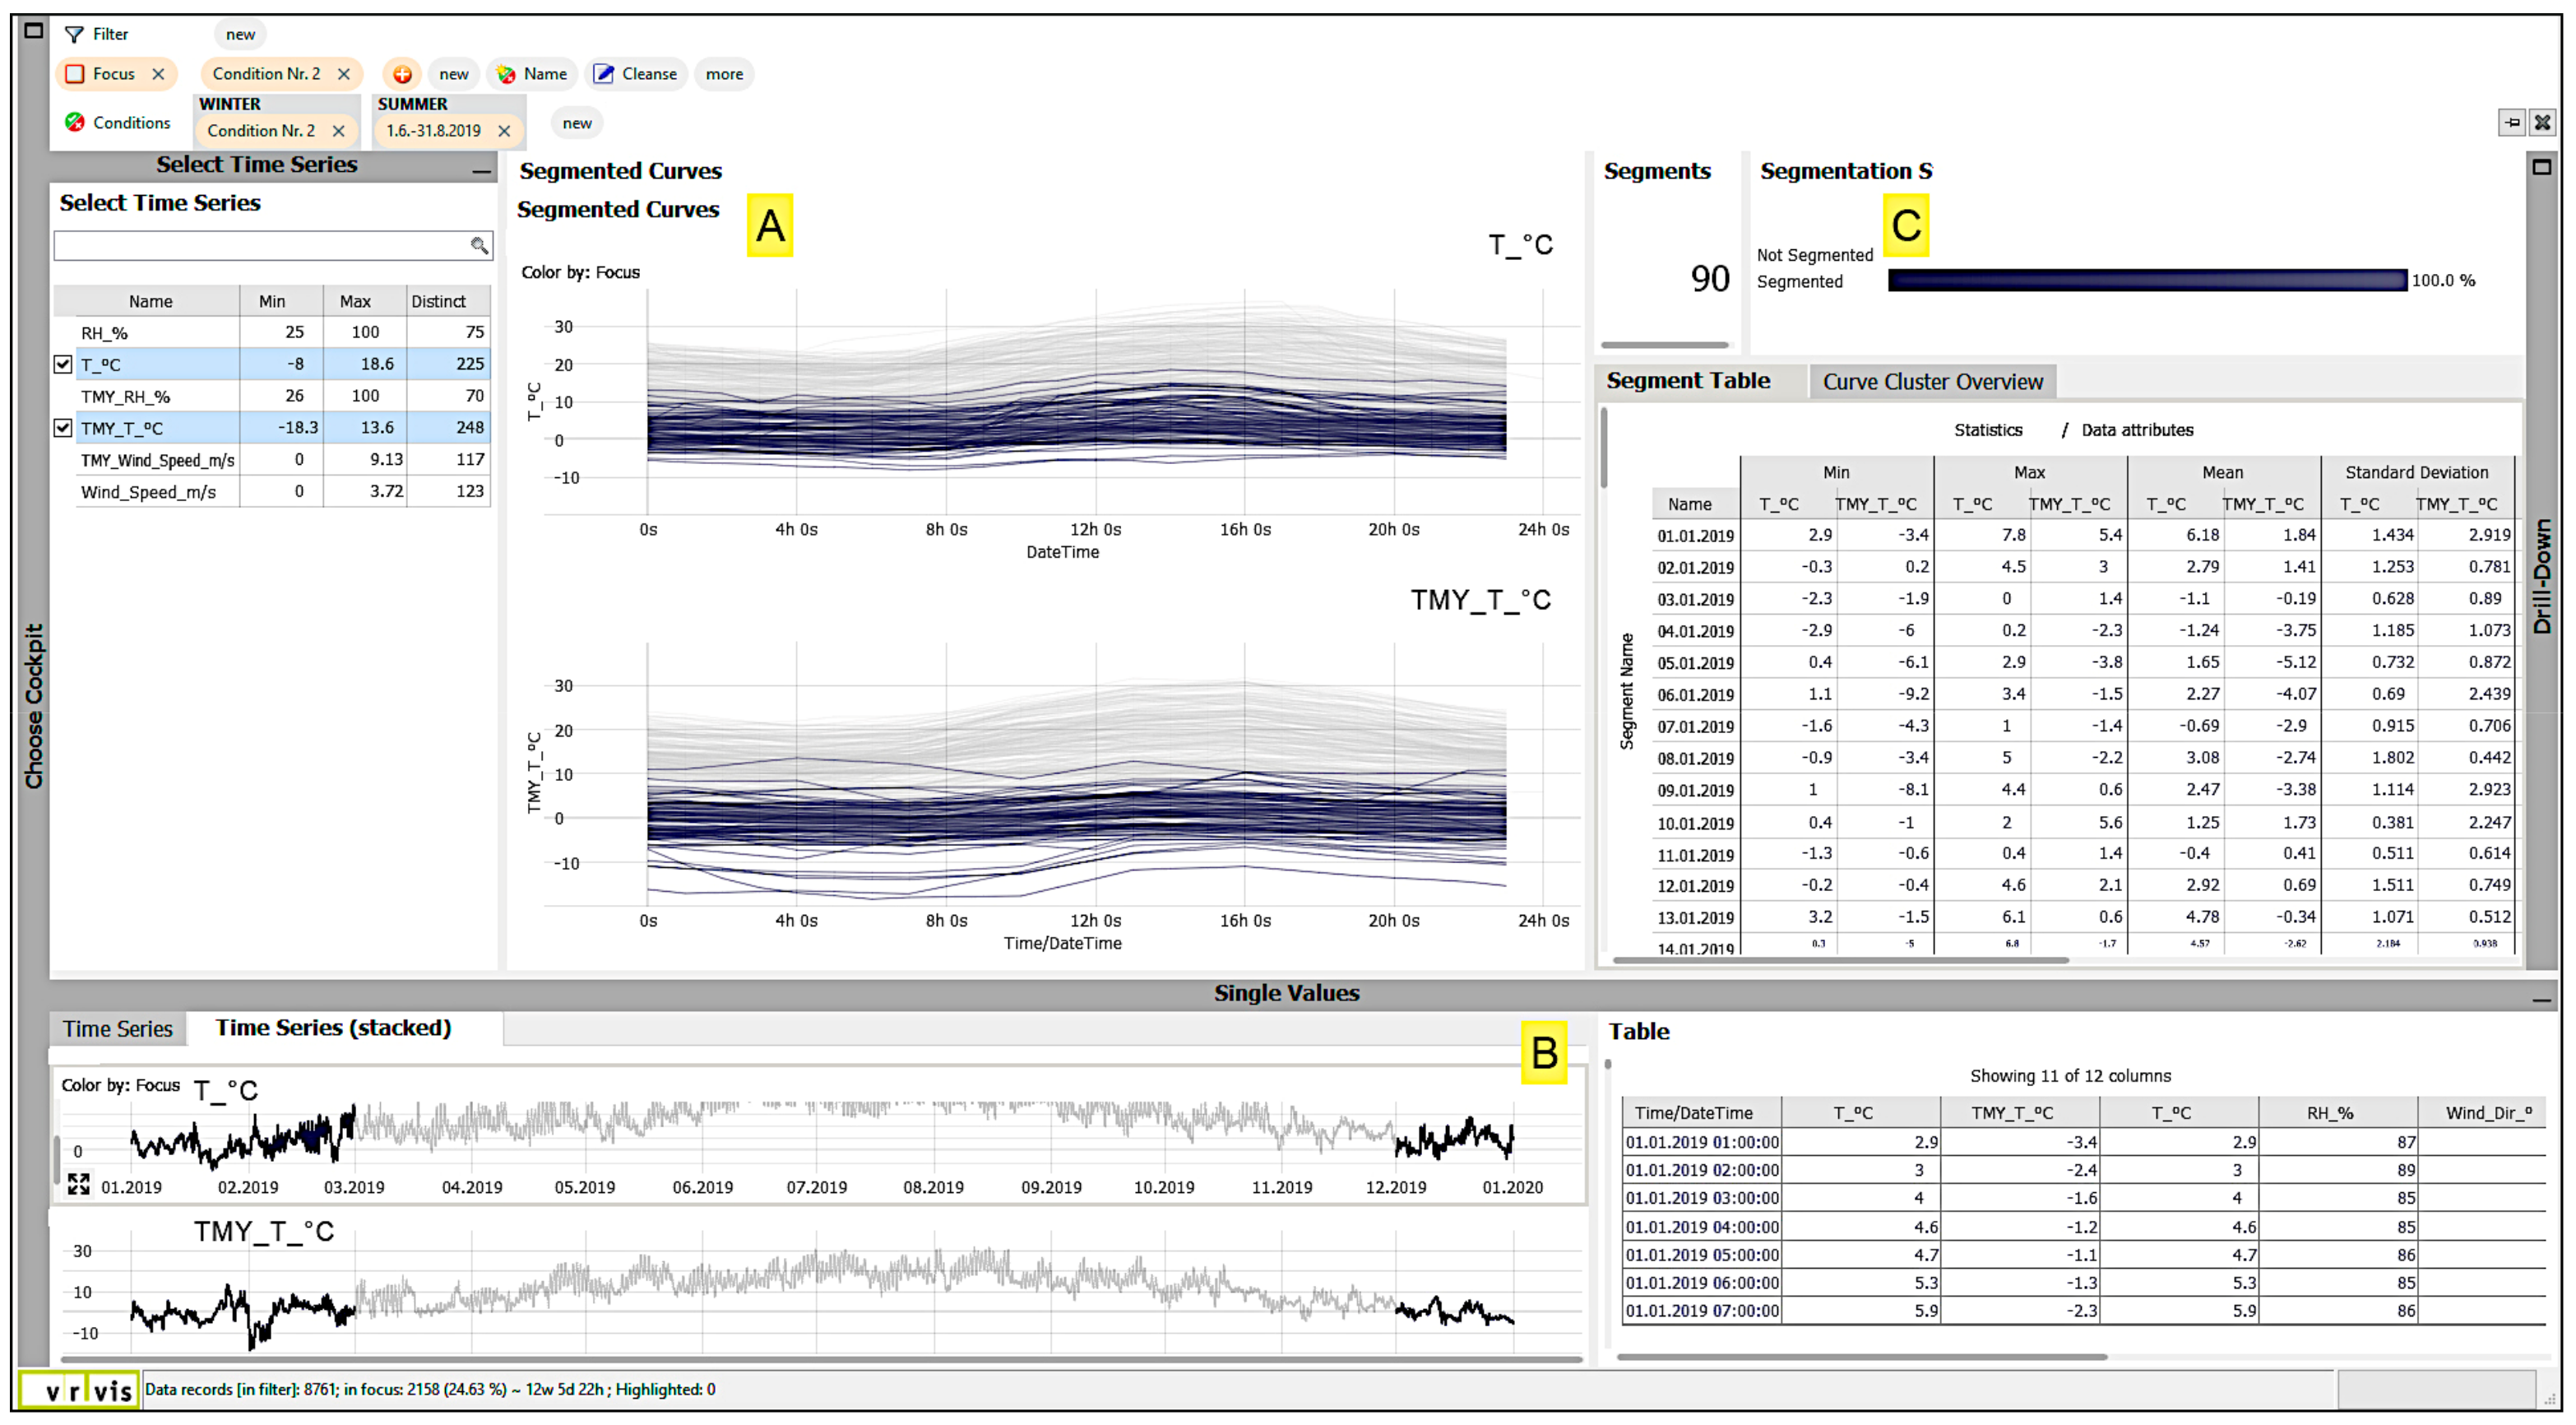
Seasonal Analysis
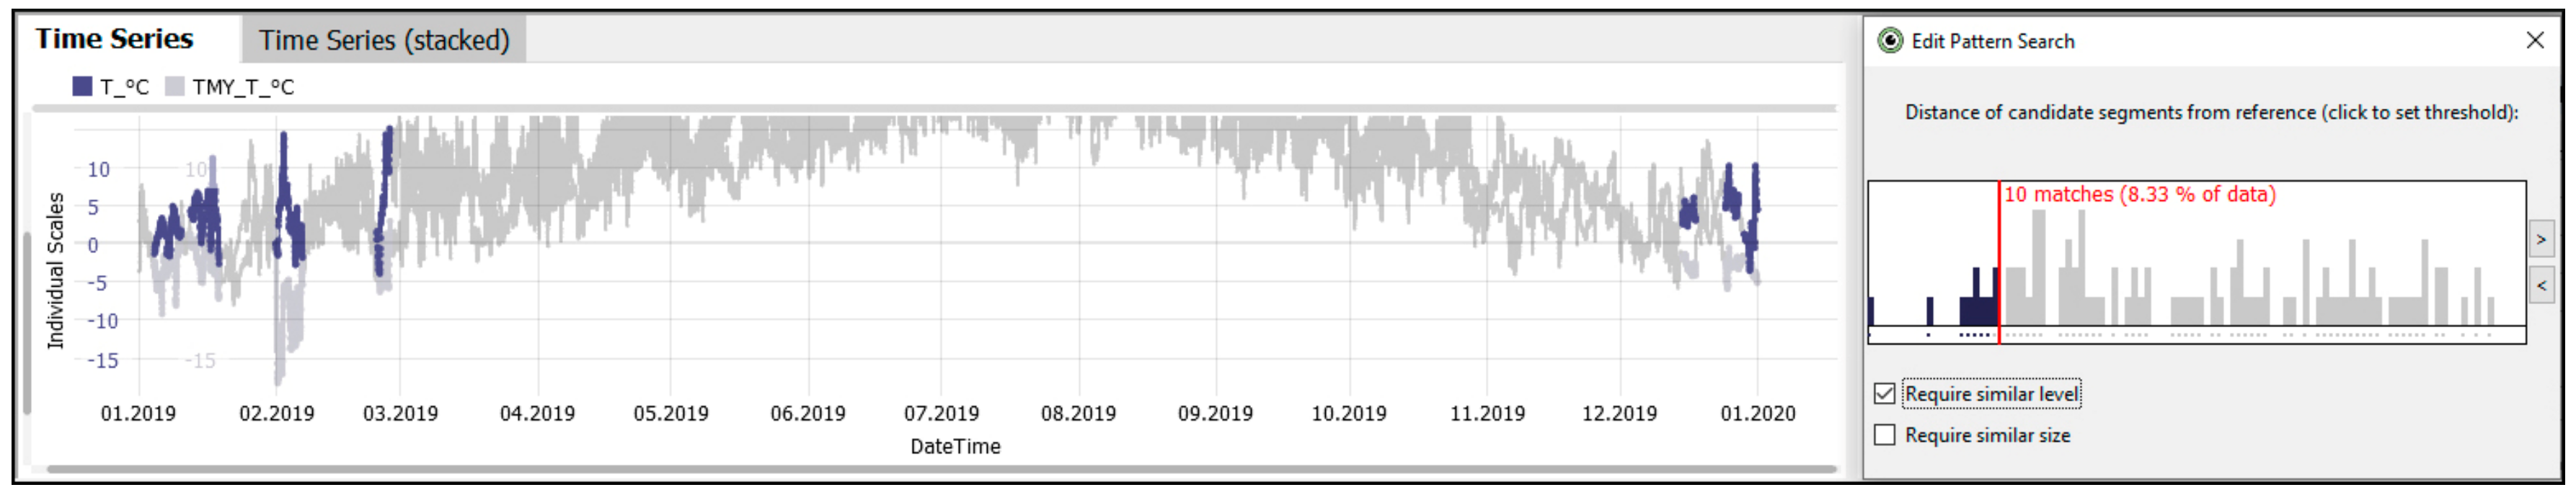
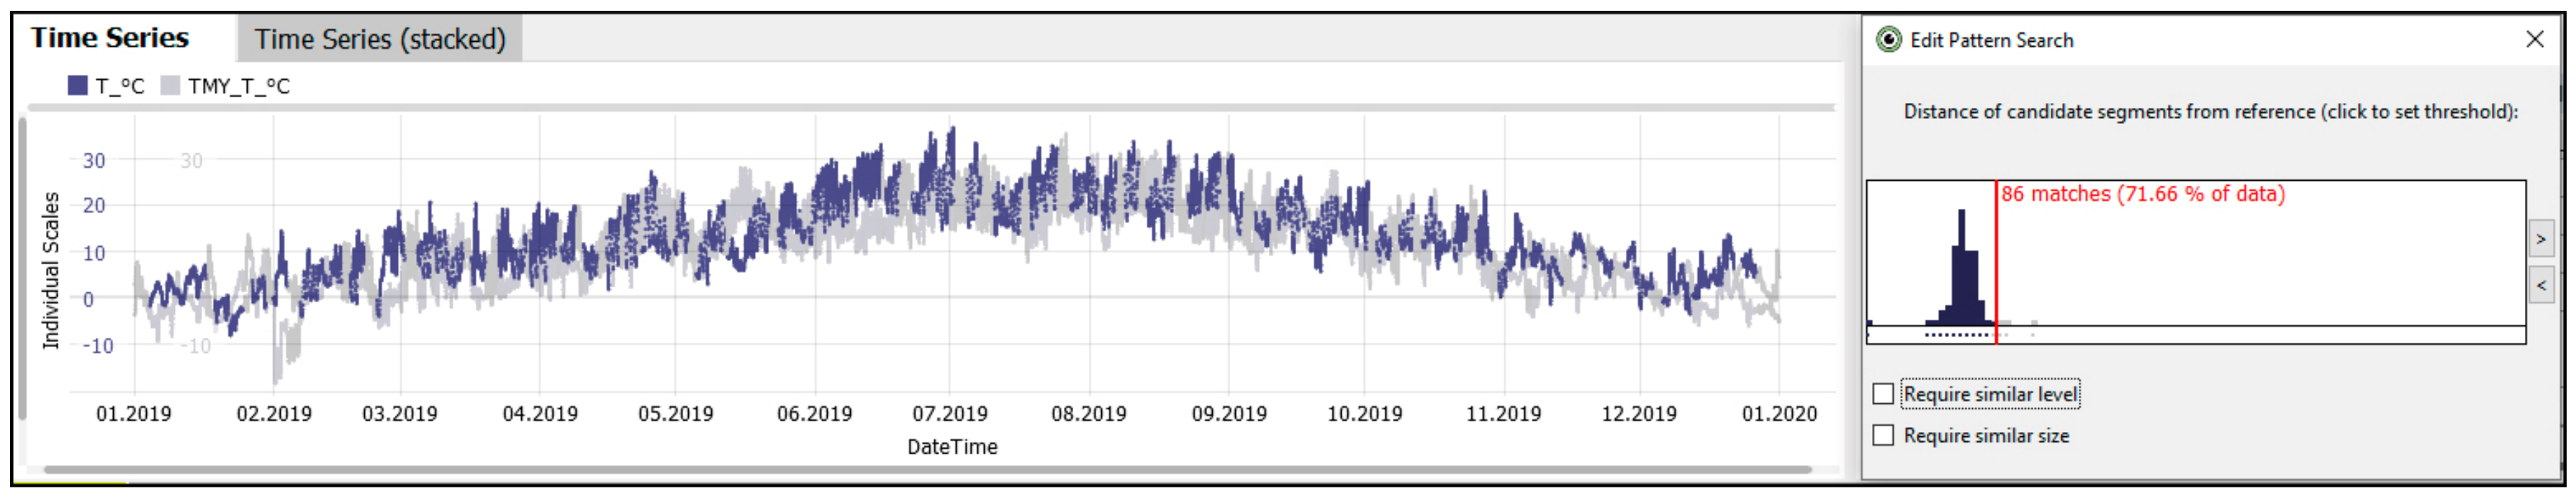
Hot and Cold Events
5. Supporting Case Study
6. Future Development Prospects
7. Conclusions
Author Contributions
Funding
Acknowledgments
Conflicts of Interest
References
- Obama, B. Open Government Directive. 2009. Available online: https://obamawhitehouse.archives.gov/sites/default/files/omb/assets/memoranda_2010/m10-06.pdf (accessed on 14 July 2020).
- Zuiderwijk, A.; Janssen, M. Open data policies, their implementation and impact: A framework for comparison. Gov. Inf. Q. 2014, 31, 17–29. [Google Scholar] [CrossRef]
- NOAA. Available online: https://www.ncdc.noaa.gov/cdo-web/ (accessed on 14 July 2020).
- Open Data Austria. Available online: https://www.data.gv.at/ (accessed on 14 July 2020).
- DWD, Deutscher Wetterdienst. Available online: https://www.dwd.de/DE/leistungen/opendata/opendata.html (accessed on 14 July 2020).
- TMY, EnergyPlus. Available online: https://energyplus.net/weather/sources (accessed on 14 July 2020).
- ISO 15927-4:2005. Available online: https://www.iso.org/standard/41371.html (accessed on 1 September 2020).
- Hensen, J.L.M. Simulation of building energy and indoor environmental quality—Some weather data issues. In Proceedings of the International Workshop on Climate Data and Their Applications in Engineering, Prague, Czech Republic, 4–6 October 1999. [Google Scholar]
- Vuckovic, M.; Hammerberg, K.; Mahdavi, A. Urban weather modeling applications: A Vienna case study. Build. Simul. 2020, 13, 99–111. [Google Scholar] [CrossRef]
- Vuckovic, M.; Kiesel, K.; Mahdavi, A. The extent and implications of the microclimatic conditions in the urban environment: A Vienna case study. Sustainability 2017, 9, 177. [Google Scholar] [CrossRef]
- Schmidt, J. Usage of visualization techniques in data science workflows. In Proceedings of the 15th International Joint Conference on Computer Vision, Imaging and Computer Graphics Theory and Applications, Valletta, Malta, 27–29 February 2020; Volume 3, pp. 309–316, ISBN 978-989-758-402-2. [Google Scholar] [CrossRef]
- Tableau. Available online: https://www.tableau.com/ (accessed on 14 July 2020).
- QlikView. Available online: http://www.qlik.com/ (accessed on 14 July 2020).
- MS Power BI. Available online: https://powerbi.microsoft.com/ (accessed on 14 July 2020).
- Behrisch, M.; Streeb, D.; Stoffel, F.; Seebacher, D.; Matejek, B.; Weber, S.H.; Mittelstädt, S.; Pfister, H.; Keim, D. Commercial visual analytics systems–Advances in the big data analytics field. IEEE Trans. Vis. Comput. Graph. 2019, 25, 3011–3031. [Google Scholar] [CrossRef] [PubMed]
- Visplore. Available online: http://www.visplore.com/ (accessed on 14 July 2020).
- Piringer, H.; Tominski, C.; Muigg, P.; Berger, W. A multi-threading architecture to support interactive visual exploration. IEEE Trans. Vis. Comput. Graph. 2009, 15, 1113–1120. [Google Scholar] [CrossRef] [PubMed]
- EnergyPlus. Available online: https://energyplus.net/ (accessed on 14 July 2020).
- TMY Vienna. Available online: https://energyplus.net/weather-location/europe_wmo_region_6/AUT//AUT_Vienna.Schwechat.110360_IWEC/all (accessed on 14 July 2020).
- ASHRAE. International Weather for Energy Calculations (IWEC Weather Files) Users Manual and CD-ROM; ASHRAE: Atlanta, GA, USA, 2001. [Google Scholar]
- ZAMG. Available online: https://www.zamg.ac.at/ (accessed on 14 July 2020).
- CC BY 3.0 AT. Available online: https://creativecommons.org/licenses/by/3.0/at/deed.en (accessed on 14 July 2020).
- Open Data Austria, ZAMG. Available online: https://www.data.gv.at/katalog/dataset/zamg_meteorologischemessdatenderzamg (accessed on 14 July 2020).
- AT-Wetter. Available online: http://at-wetter.tk/ (accessed on 14 July 2020).
- API Vienna. Available online: http://at-wetter.tk/api/v1/station/11035/t/2019-12-31/364 (accessed on 14 July 2020).
- Kandel, S.; Paepcke, A.; Hellerstein, J.M.; Heer, J. Enterprise data analysis and visualization: An interview study. IEEE Trans. Vis. Comput. Graph. 2012, 18, 2917–2926. [Google Scholar] [CrossRef] [PubMed]
- R. Available online: https://cran.r-project.org/ (accessed on 14 July 2020).
- RStudio. Available online: https://rstudio.com/ (accessed on 14 July 2020).
- Zare, S.; Hasheminejad, N.; Shirvan, H.E.; Hemmatjo, R.; Sarebanzadeh, K.; Ahmadi, S. Comparing Universal Thermal Climate Index (UTCI) with selected thermal indices/environmental parameters during 12 months of the year. Weather Clim. Extrem. 2018, 19, 49–57. [Google Scholar] [CrossRef]
- Haynes, W. Tukey’s test. In Encyclopedia of Systems Biology; Dubitzky, W., Wolkenhauer, O., Cho, K.H., Yokota, H., Eds.; Springer: New York, NY, USA, 2013. [Google Scholar]
- Kaufmann, H.; Tran, H.V.; Orlik, A.; Pokorny, S. Windzonierungskarte für Kleinwindkraftanlagen für Wien; 2015. Report; Zentralanstalt für Meteorologie und Geodynamik (ZAMG): Vienna, Austria, 2015. [Google Scholar]
- Müller, M. Dynamic time warping. In Information Retrieval for Music and Motion; Springer: Berlin/Heidelberg, Germany, 2007. [Google Scholar]


| Data Attribute | Missing [%] | Min. | Max. | Mean | Standard Deviation | Coeff. of Variation | |
|---|---|---|---|---|---|---|---|
| API 1 | T | 0.05 | −8.0 | 36.6 | 12.5 | 8.38 | 0.67 |
| RH | 0.05 | 19 | 100 | 69 | 17.2 | 0.25 | |
| WS | 0.05 | 0 | 3.72 | 0.96 | 0.61 | 0.63 | |
| WD | 54 | 0 | 360 | - | 102.25 | 0.48 | |
| TMY 2 | T | 0.05 | −18.3 | 31.7 | 9.9 | 8.76 | 0.88 |
| RH | 0.05 | 24 | 100 | 72 | 16.94 | 0.24 | |
| WS | 0.05 | 0 | 9.13 | 1.97 | 1.28 | 0.65 | |
| WD | 0.05 | 0 | 360 | - | 97.93 | 0.47 | |
© 2020 by the authors. Licensee MDPI, Basel, Switzerland. This article is an open access article distributed under the terms and conditions of the Creative Commons Attribution (CC BY) license (http://creativecommons.org/licenses/by/4.0/).
Share and Cite
Vuckovic, M.; Schmidt, J. Visual Analytics Approach to Comprehensive Meteorological Time-Series Analysis. Data 2020, 5, 94. https://doi.org/10.3390/data5040094
Vuckovic M, Schmidt J. Visual Analytics Approach to Comprehensive Meteorological Time-Series Analysis. Data. 2020; 5(4):94. https://doi.org/10.3390/data5040094
Chicago/Turabian StyleVuckovic, Milena, and Johanna Schmidt. 2020. "Visual Analytics Approach to Comprehensive Meteorological Time-Series Analysis" Data 5, no. 4: 94. https://doi.org/10.3390/data5040094
APA StyleVuckovic, M., & Schmidt, J. (2020). Visual Analytics Approach to Comprehensive Meteorological Time-Series Analysis. Data, 5(4), 94. https://doi.org/10.3390/data5040094