Data Descriptor

Standartox: Standardizing Toxicity Data

by
Andreas Scharmüller
1,2,*,
Verena C. Schreiner
1 and
Ralf B. Schäfer
1
1
iES Landau, Institute for Environmental Sciences, University of Koblenz-Landau, D-76829 Landau, Germany
2
Laboratoire d’Hydrologie et de Géochimie de Strasbourg, UMR 7517 CNRS-Université de Strasbourg, 1 rue Blessig, CEDEX, 67084 Strasbourg, France
*
Author to whom correspondence should be addressed.
Submission received: 10 April 2020 / Revised: 4 May 2020 / Accepted: 12 May 2020 / Published: 16 May 2020

Abstract

:
An increasing number of chemicals such as pharmaceuticals, pesticides and synthetic hormones are in daily use all over the world. In the environment, chemicals can adversely affect populations and communities and in turn related ecosystem functions. To evaluate the risks from chemicals for ecosystems, data on their toxicity, which are typically produced in standardized ecotoxicological laboratory tests, is required. The results from ecotoxicological tests are compiled in (meta-)databases such as the United States Environmental Protection Agency (EPA) ECOTOXicology Knowledgebase (ECOTOX). However, for many chemicals, multiple ecotoxicity data are available for the same test organism. These can vary strongly, thereby causing uncertainty of related analyses. Given that most current databases lack aggregation steps or are confined to specific chemicals, we developed Standartox, a tool and database that continuously incorporates the ever-growing number of test results in an automated process workflow that ultimately leads to a single aggregated data point for a specific chemical-organism test combination, representing the toxicity of a chemical. Standartox can be accessed through a web application and an R package.
Data Set License: MIT

1. Summary

An increasing number of chemicals such as pharmaceuticals, pesticides and synthetic hormones are in daily use all over the world. In Europe alone, some 100,000 chemicals are estimated to be in current use, whereof 30,000 are produced in quantities larger than one ton per year [1]. Except for pesticides that are released into the environment deliberately, most chemicals enter the environment as a result of their use through different paths (e.g., atmospheric emission and deposition or discharge through wastewater) [2]. In the environment, chemicals can adversely affect populations and communities and in turn related ecosystem functions [3,4,5,6,7]. Ultimately, this may compromise natures contribution to human well-being, for example the ecosystem services clean drinking and irrigation water as well as food production [8,9,10]. Pollution with man-made chemicals has been identified as one of three major environmental problems for which research gaps hamper the derivation of planetary boundaries, i.e., thresholds beyond which irreversible state shifts may occur [11,12]. Bernhardt et al. [13] argue that the knowledge gap how chemicals affect populations, communities and in turn ecosystem functions and services, may impede the accomplishment of the Sustainable Development Goals [14] of the United Nations. Even highly regulated chemicals, such as pesticides have been shown to cause strong adverse effects on non-target organisms, such as birds [5], aquatic insects [15] or fish [10], questioning the current regulation efforts [16].
To evaluate the risks from chemicals to ecosystems, data on their toxicity are required, which is typically produced in standardized ecotoxicological laboratory tests. For example, Morrissey et al. [17] used ecotoxicological test results from 49 insects and crustaceans to evaluate the effect of neonicotinoid insecticides in the aquatic ecosystem. Furthermore, Malaj et al. [4] compiled experimental toxicity test results for 223 chemicals to assess the risk from chemicals to freshwater ecosystems in Europe. Similarly, permissible environmental concentrations are often derived from these test data, typically by a combination with safety factors to account for uncertainties. The test data mainly relate to a few, well tested, standard organisms, such as the brown rat Rattus norvegicus, the water flea Daphnia magna and the microalga Raphidocelis subcapitata. Nevertheless, a much greater variety of organisms has been used in ecotoxicological experiments.
To date, only few initiatives exist that aim to create a public resource of ecotoxicological data, such as the United States Environmental (EPA) Protection Agency ECOTOXicology Knowledgebase (ECOTOX) (ca. 1,000,000 test results, 13,000 taxa, 12,000 chemicals) [18], the German Environmental Agency’s Information System Ecotoxicology and Environmental Quality Targets (ETOX) [19], the Pesticides Properties DataBase (PPDB) (ca. 2000 pesticides) [20] or the EnviroTox database [21,22]. The former two compile all available results from experiments into a database. However, for many chemicals, multiple ecotoxicity values are available for the same test organism. These can vary strongly, thereby causing uncertainty of related analyses [23,24]. Moreover, the lack of associated quality information and heterogeneous units hamper reproducible science. The PPDB database, in contrast, provides single ecotoxicity values only for pesticides and a few selected test organisms, thereby covering only a minor fraction of the vast amount of ecotoxicological data. The EnviroTox database is limited to aquatic organisms. Moreover, data analyses often require links to additional data resources, for example to append additional chemical and species information (e.g., chemical properties, habitat of species), which calls for more automated procedures.
We therefore developed Standartox, a tool and database that aims to overcome the limitations of other databases by continuously incorporating the ever-growing number of test results in an automated process workflow that ultimately leads to a harmonized ecotoxicity data collection and provides methods to derive single aggregated ecotoxicity values for a specific chemical-organism test combination. Standartox makes use of the publicly available and quarterly updated ECOTOX database [25] and restricts the data to commonly used endpoints in ecotoxicology, such as half maximal effective concentrations (EC50) or no-observed-adverse-effect concentrations (NOEC), leading to about 600,000 ecotoxicological test results, including about 8000 chemicals, tested on about 10,000 taxa in the current version. Standartox users can filter test results according to several parameters, e.g., refining a search for ecotoxicity data on organisms occurring in specific habitats or regions of the world. Above all, Standartox aggregates ecotoxicological test results in a standardized way, by calculating the minimum, the geometric mean and the maximum of the results for each chemical and the associated, user-defined test parameters. Hence, this reduces the variability between risk assessments that are due to the selection of different ecotoxicological test data [23]. Thereby, Standartox provides the basis for reproducible science and combines information from different sources to simplify the derivation of risk indicators such as Species Sensitivity Distributions (SSD) and Toxic Units (TU), which represent two prominent concepts to assess effects on organisms in ecotoxicology [26,27,28]. Besides aggregating ecotoxicological test results, Standartox provides a concise overview of the tested chemicals, allowing the identification of potential knowledge gaps. Moreover, Standartox could help in reducing the millions of animals used for toxicity testing each year by facilitating access to ecotoxicity data, which are in favor of, for example, the guidelines by the Organisation for Economic Co-operation and Development (OECD) [29,30]. Standartox comes with two front-ends, a web application (http://standartox.uni-landau.de) and the R [31] package standartox, providing convenience structures and thereby largely reducing processing time for users.

2. Data Description

Standartox constitutes a collection of quality checked ecotoxicological test results. It is build on the ECOTOX database [25] whose data are processed, cleaned and harmonized to retrieve comparable toxicity endpoints. Subsequently, filter and aggregation methods are created to allow for the retrieval of single toxicity equivalents for specific experimental conditions. The ECOTOX database is updated quarterly, providing on average 5228 (2014–2019) new toxicity entries. These are included in Standartox with each update.

2.1. Filters

The data can be restricted to the three endpoint groups, namely half maximal effective/lethal concentration/dose values (e.g., EC50, LD50), henceforth abbreviated as XX50, lowest observed effect concentrations/levels (LOEC/L), henceforth abbreviated as LOEX and no observed effect concentrations/levels (NOEC/L), henceforth abbreviated as NOEX (Table A2). Standartox allows the ecotoxicity data to be filtered by effect groups (e.g., mortality, population, growth) (Figure 1A) and concentration types (e.g., formulation, active ingredient) as well as test durations (in hours). In addition to these test-specific parameters, Standartox data entries can be filtered by chemical-specific parameters such as the CAS number and chemical roles (e.g., pesticides, metals, drugs) (Figure 1B) and classes (e.g., organochlorine, triazine) (Figure 1C). Furthermore, the Standartox data can be refined to certain taxonomic groups (Figure 1D) as well as organism-specific parameters, such as the organisms’ habitat (e.g., freshwater, marine, terrestrial) (Figure 1E) and distribution (e.g., Europe, South America) (Figure 1F).

2.2. Aggregation

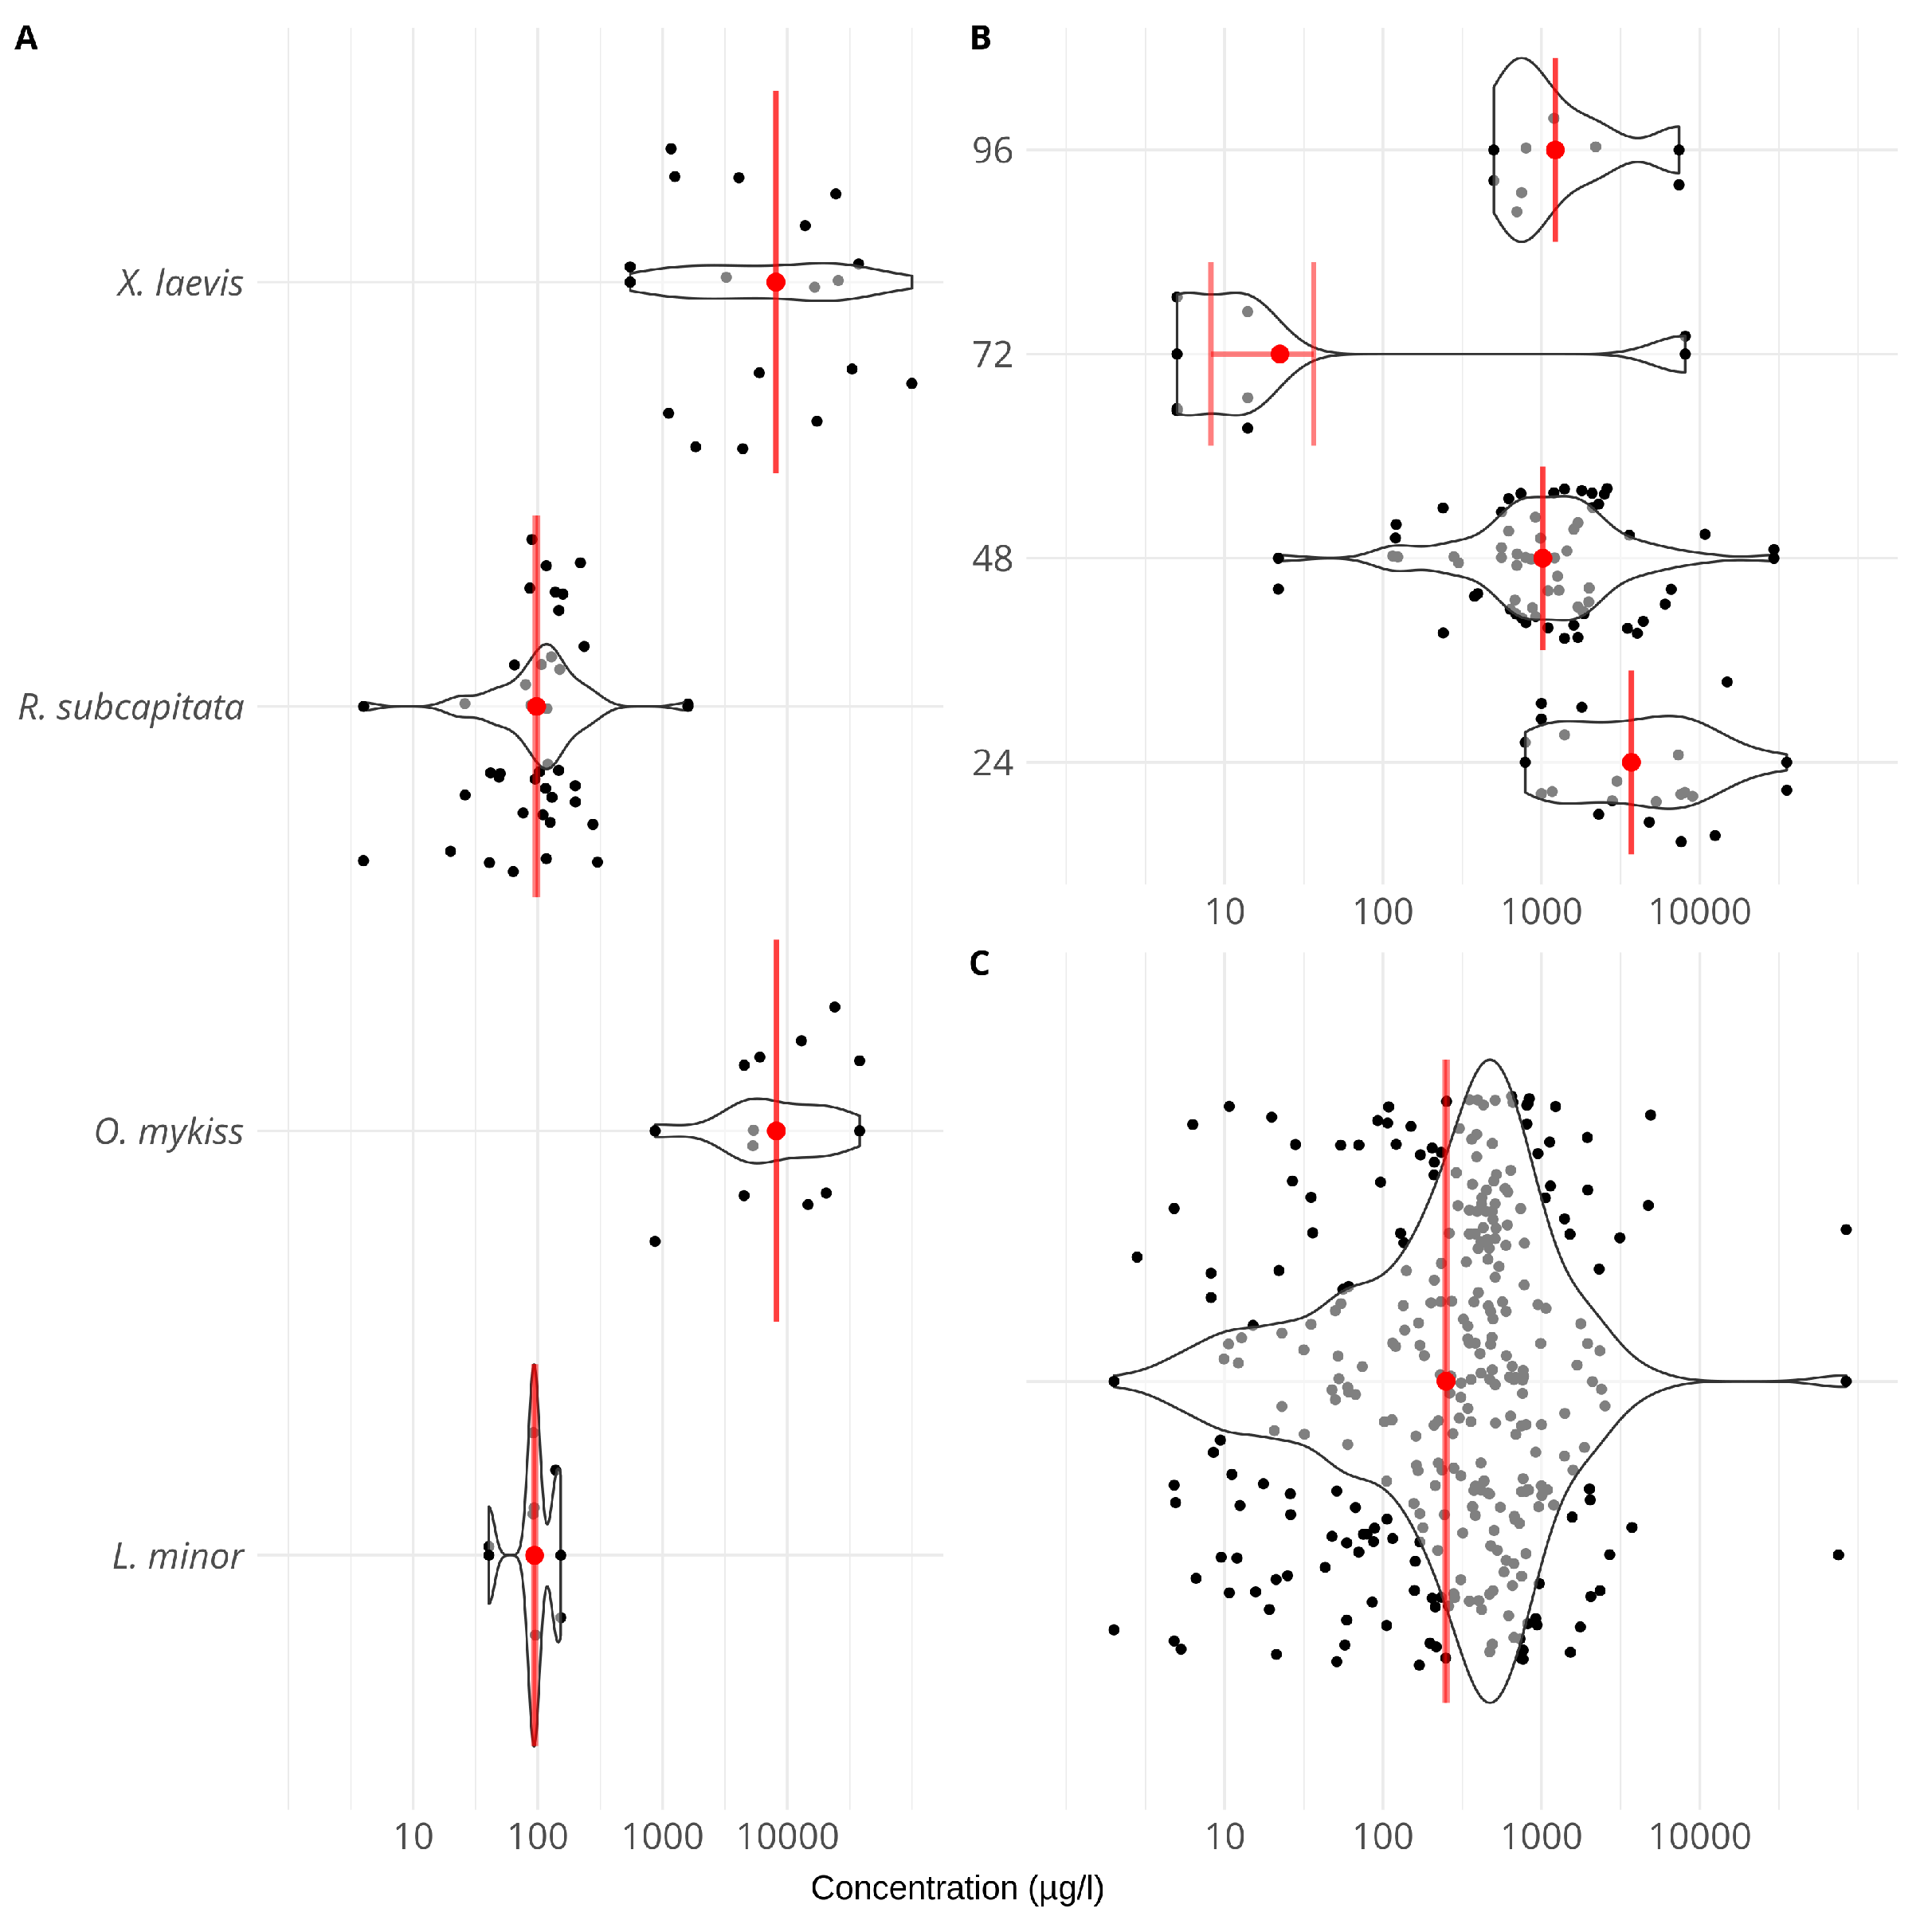
Typically, species exhibit a differential sensitivity towards chemicals (Figure 2A). Moreover, multiple ecotoxicity values are available for individual species-chemical combinations and these can also exhibit high variability due to several factors such as durations of ecotoxicity tests (Figure 2B), experimental conditions and physiological or genetic fitness differences between test individuals or populations. Not every factor is recorded though, leading to unexplainable variability (Figure 2C). To aggregate multiple ecotoxicity values into a single value on the desired taxonomic level (e.g., for an individual species, across species of a genus or family), and chemical grouping (e.g., across all pesticides), Standartox provides several aggregation methods including the minimum, the maximum and the geometric mean allowing to aggregate the filtered data set. The geometric mean is preferred in comparison to the arithmetic mean, because it is less influenced by outliers and is suitable for skewed data. Furthermore, the geometric mean is preferable over the median, because the median completely ignores the tails of the data distribution, making it unreliable for small data sets [32]. Posthuma et al. [33] showed the usefulness of SSDs and its underlying geometric mean aggregations when assessing environmental effects of chemicals. In the course of the aggregation process, outliers that exceed 1.5 times the interquartile range are flagged to caution Standartox users. However, they are considered in the aggregation, given that the geometric mean is relatively robust against outliers. Overall, Standartox provides a harmonized and reproducible approach to aggregate ecotoxicity data.

2.3. Accuracy Assessment

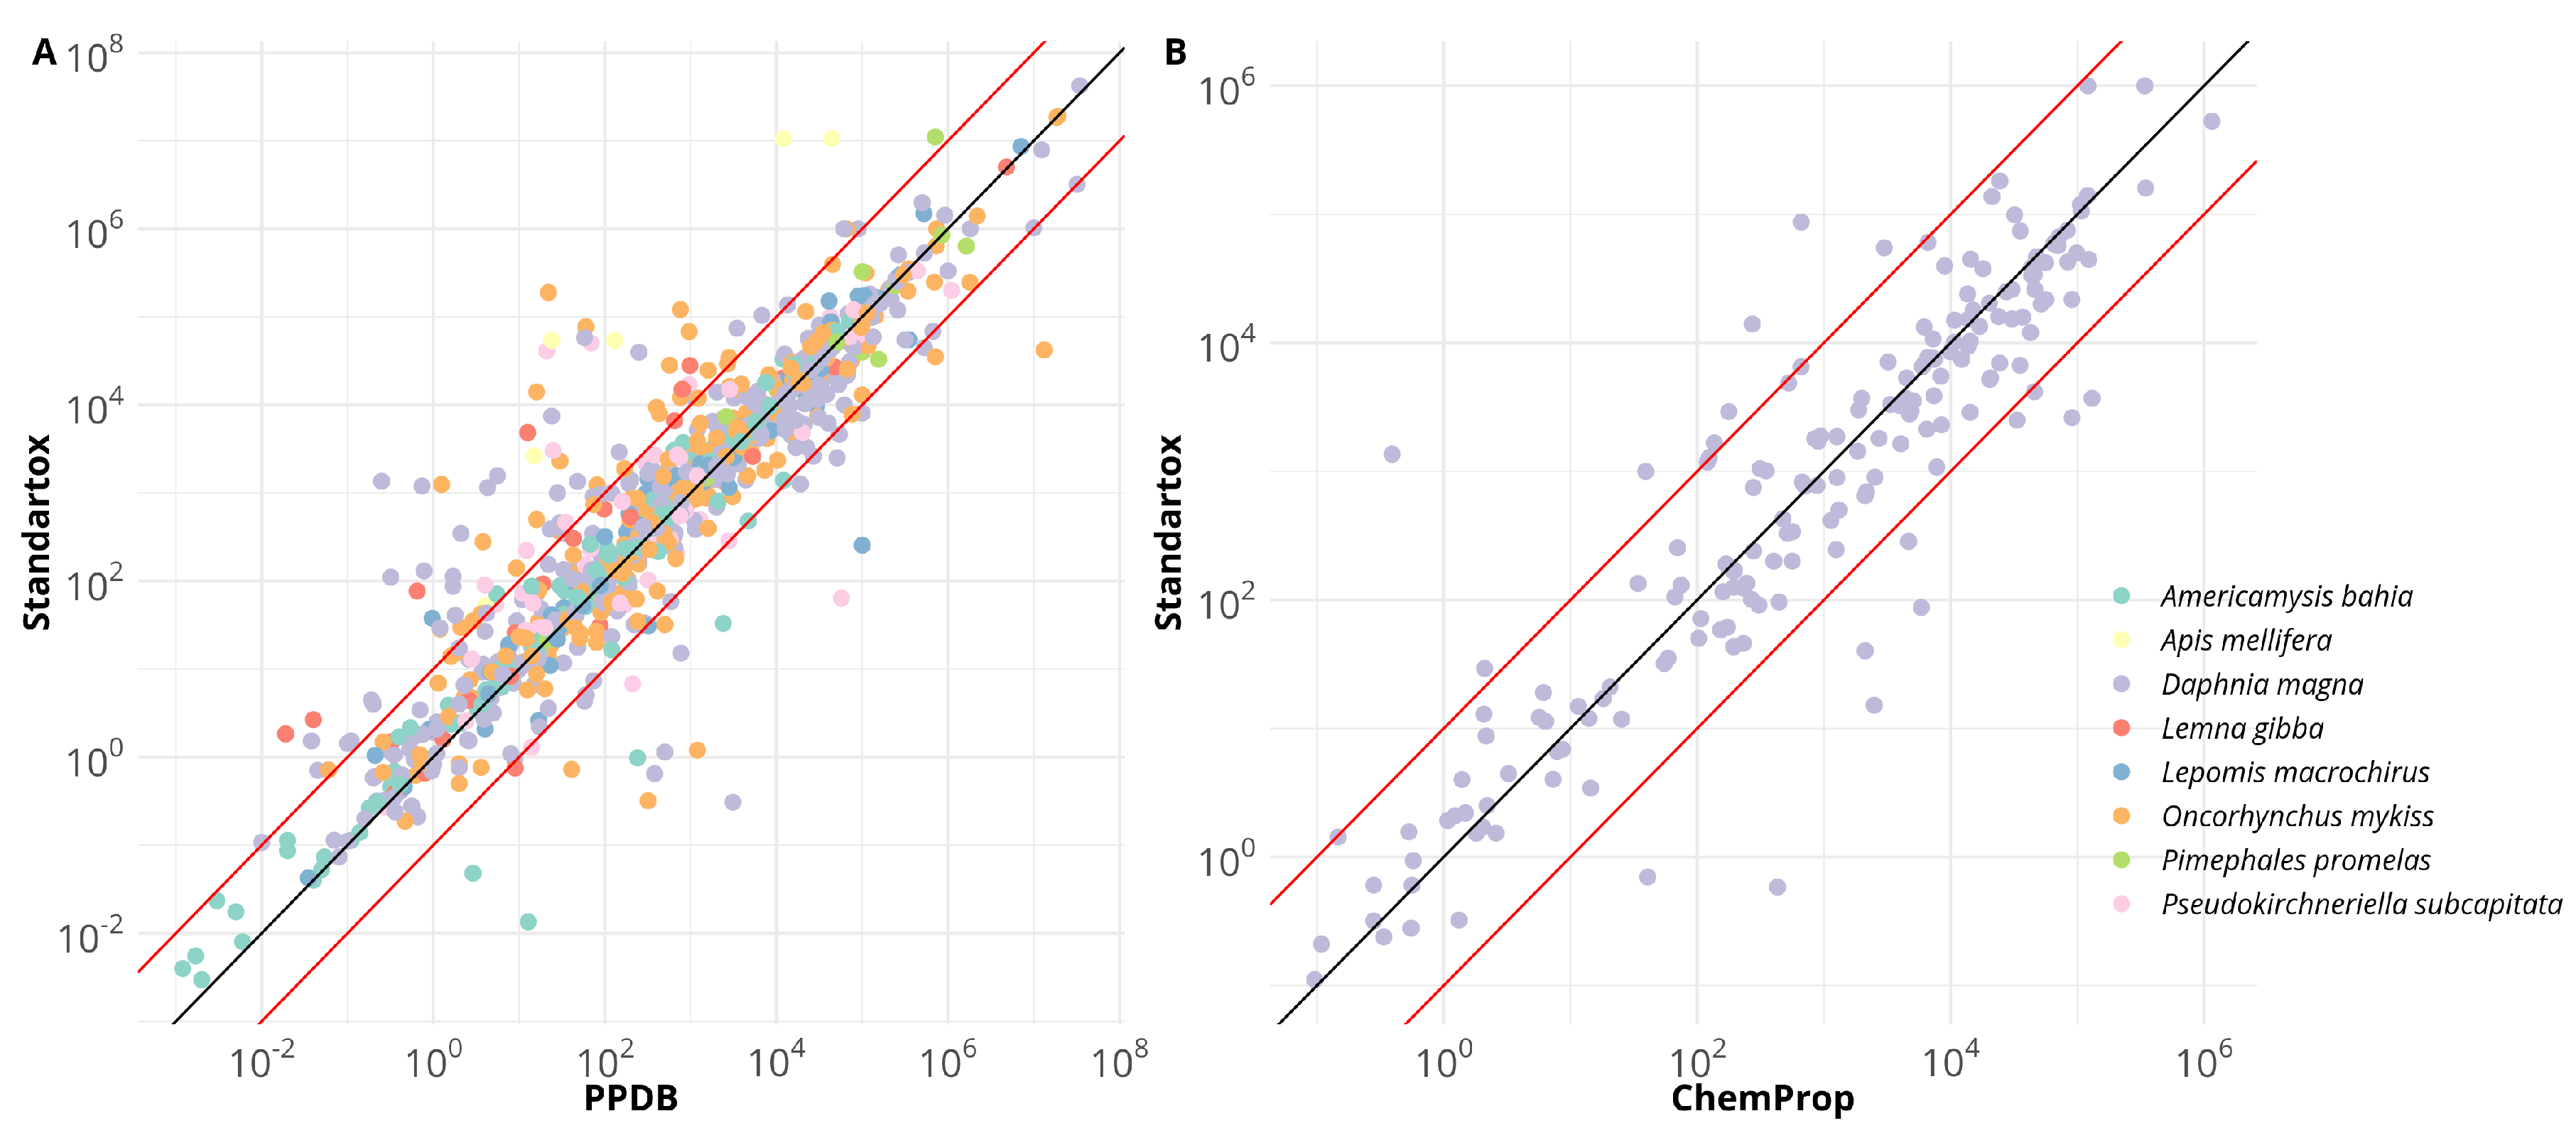
To validate Standartox results we compared geometric means resulting from the aggregation in Standartox to the corresponding values from other databases, for chemicals where data were available in both resources. The PPDB provides ecotoxicity data on a few selected species commonly used in chemical risk assessment, that have been manually quality controlled through expert judgment [20]. The vast majority of aggregated values (91.9%) of Standartox lie within one order of magnitude of the corresponding PPDB values (n = 3601). This would increase to 92.6%, when restricting the comparison to Standartox values where data from at least five experiments are available. Similarly, we compared Standartox to ecotoxicity values for Daphnia magna from the ChemProp [34] software, which estimates LC50 values via quantitative structure-activity relationship (QSAR) models [35]. We found that 95% of Standartox values lie within one order of magnitude of the ChemProp (n = 179) values. However, the difference is not necessarily an indication of lower quality of Standartox estimates but may also reflect the wider range of experimental conditions for which data are available in the database underlying Standartox as well as inaccurate predictions for QSAR models, respectively (Figure 3).

2.4. Perspectives

Novel predictive frameworks incorporating chemical mode of action and species traits emphasize the need for holistic and automated analyses of large-scale ecotoxicological data [36,37]. Indeed, the increasing amount of data from ecotoxicological tests and experiments that is becoming available has elicited several initiatives to harmonize these data. These initiatives partly aim for overlapping goals, yet have limitations or objectives that distinguish them from Standartox:
Comptox, is a web tool published by the EPA which, similar to Standartox allows for filtering test results, the retrieval of additional chemical information as well as predicted toxicity data [38], such as 48 h Daphnia magna LC50 values. However, toxicity estimations are limited to standard test organisms, and the tool lacks the possibility for automated data retrieval [39]. Comptox is built on the Aggregated Computational Toxicology Resource (ACToR) database, which constitutes the basis for several applications published by the EPA. It collects physicochemical and toxicological data on more than 500,000 environmental chemicals and pharmaceutical compounds from various resources and presents them in a curated list on the web [40,41]. However, no filter mechanisms or aggregation methods are provided in ACToR per se.
The EnviroTox database which also uses, amongst others the ECOTOX database as an input has recently been published [21,22]. In contrast to Standartox, EnviroTox is restricted to selected aquatic organisms (i.e., fish, amphibians, invertebrates and algae) and experimental durations (at least 24 h) and uses a rule-based algorithm to derive single ecotoxicity values. Besides, EnviroTox provides additional information on toxicity endpoints, such as acute or chronic classifications and mode of action assignments. We intentionally omitted such classifications given that the approach to classification may vary with the purpose of the study or because of different classification schemes [42]. The EnviroTox database allows for an aggregation into single toxicity values for individual taxa, whereas Standartox performs this aggregation for individual chemical-taxa combinations. However, the Standartox results for individual taxa-chemical combinations could easily be aggregated across chemicals in a second step to provide a similar aggregation as that performed in EnviroTox.
The Etox database collects ecotoxicity test information and provides methods to filter those. Like the ECOTOX database, it also lacks methods to perform aggregations of the ecotoxicity data and only provides manual (non-automated) access. In contrast to the latter, the Etox database can not be downloaded as a whole.
The PPDB provides data only on pesticides, and as mentioned before, it provides single quality controlled values only for commonly used taxa, e.g., Daphnia magna or Raphidocelis subcapitata.
In summary, none of the above mentioned initiatives aim for an automated and standardized aggregation method of exposure endpoints for individual chemicals. In addition, they lack the possibility to access the databases through a common high level programming language, such as R. An overview of the filter and aggregation methods as well as the accessibility of the presented databases is presented in Table 1.
As outlined above, toxicity estimates from different studies can vary strongly due to a wide range of experimental conditions such as pH, temperature and conductivity [43,44]. Integrating these conditions into the aggregated estimates would certainly improve toxicity estimates. However, the current implementation of Standartox omits these conditions, because the ECOTOX database only provides sparse records on experimental conditions. The most frequently provided experimental conditions are temperature (77%), pH (56%), hardness (27%), dissolved oxygen (18%), Alkalinity (15%) and salinity (9%). For all other conditions less than 5% of data entries are available. A text-mining approach, where a literature reference is associated with ecotoxicity raw data, iterating through the individual publications could potentially increase this number, e.g., Compson et al. [45] successfully applied text-mining techniques to retrieve species trait data.

3. Methods

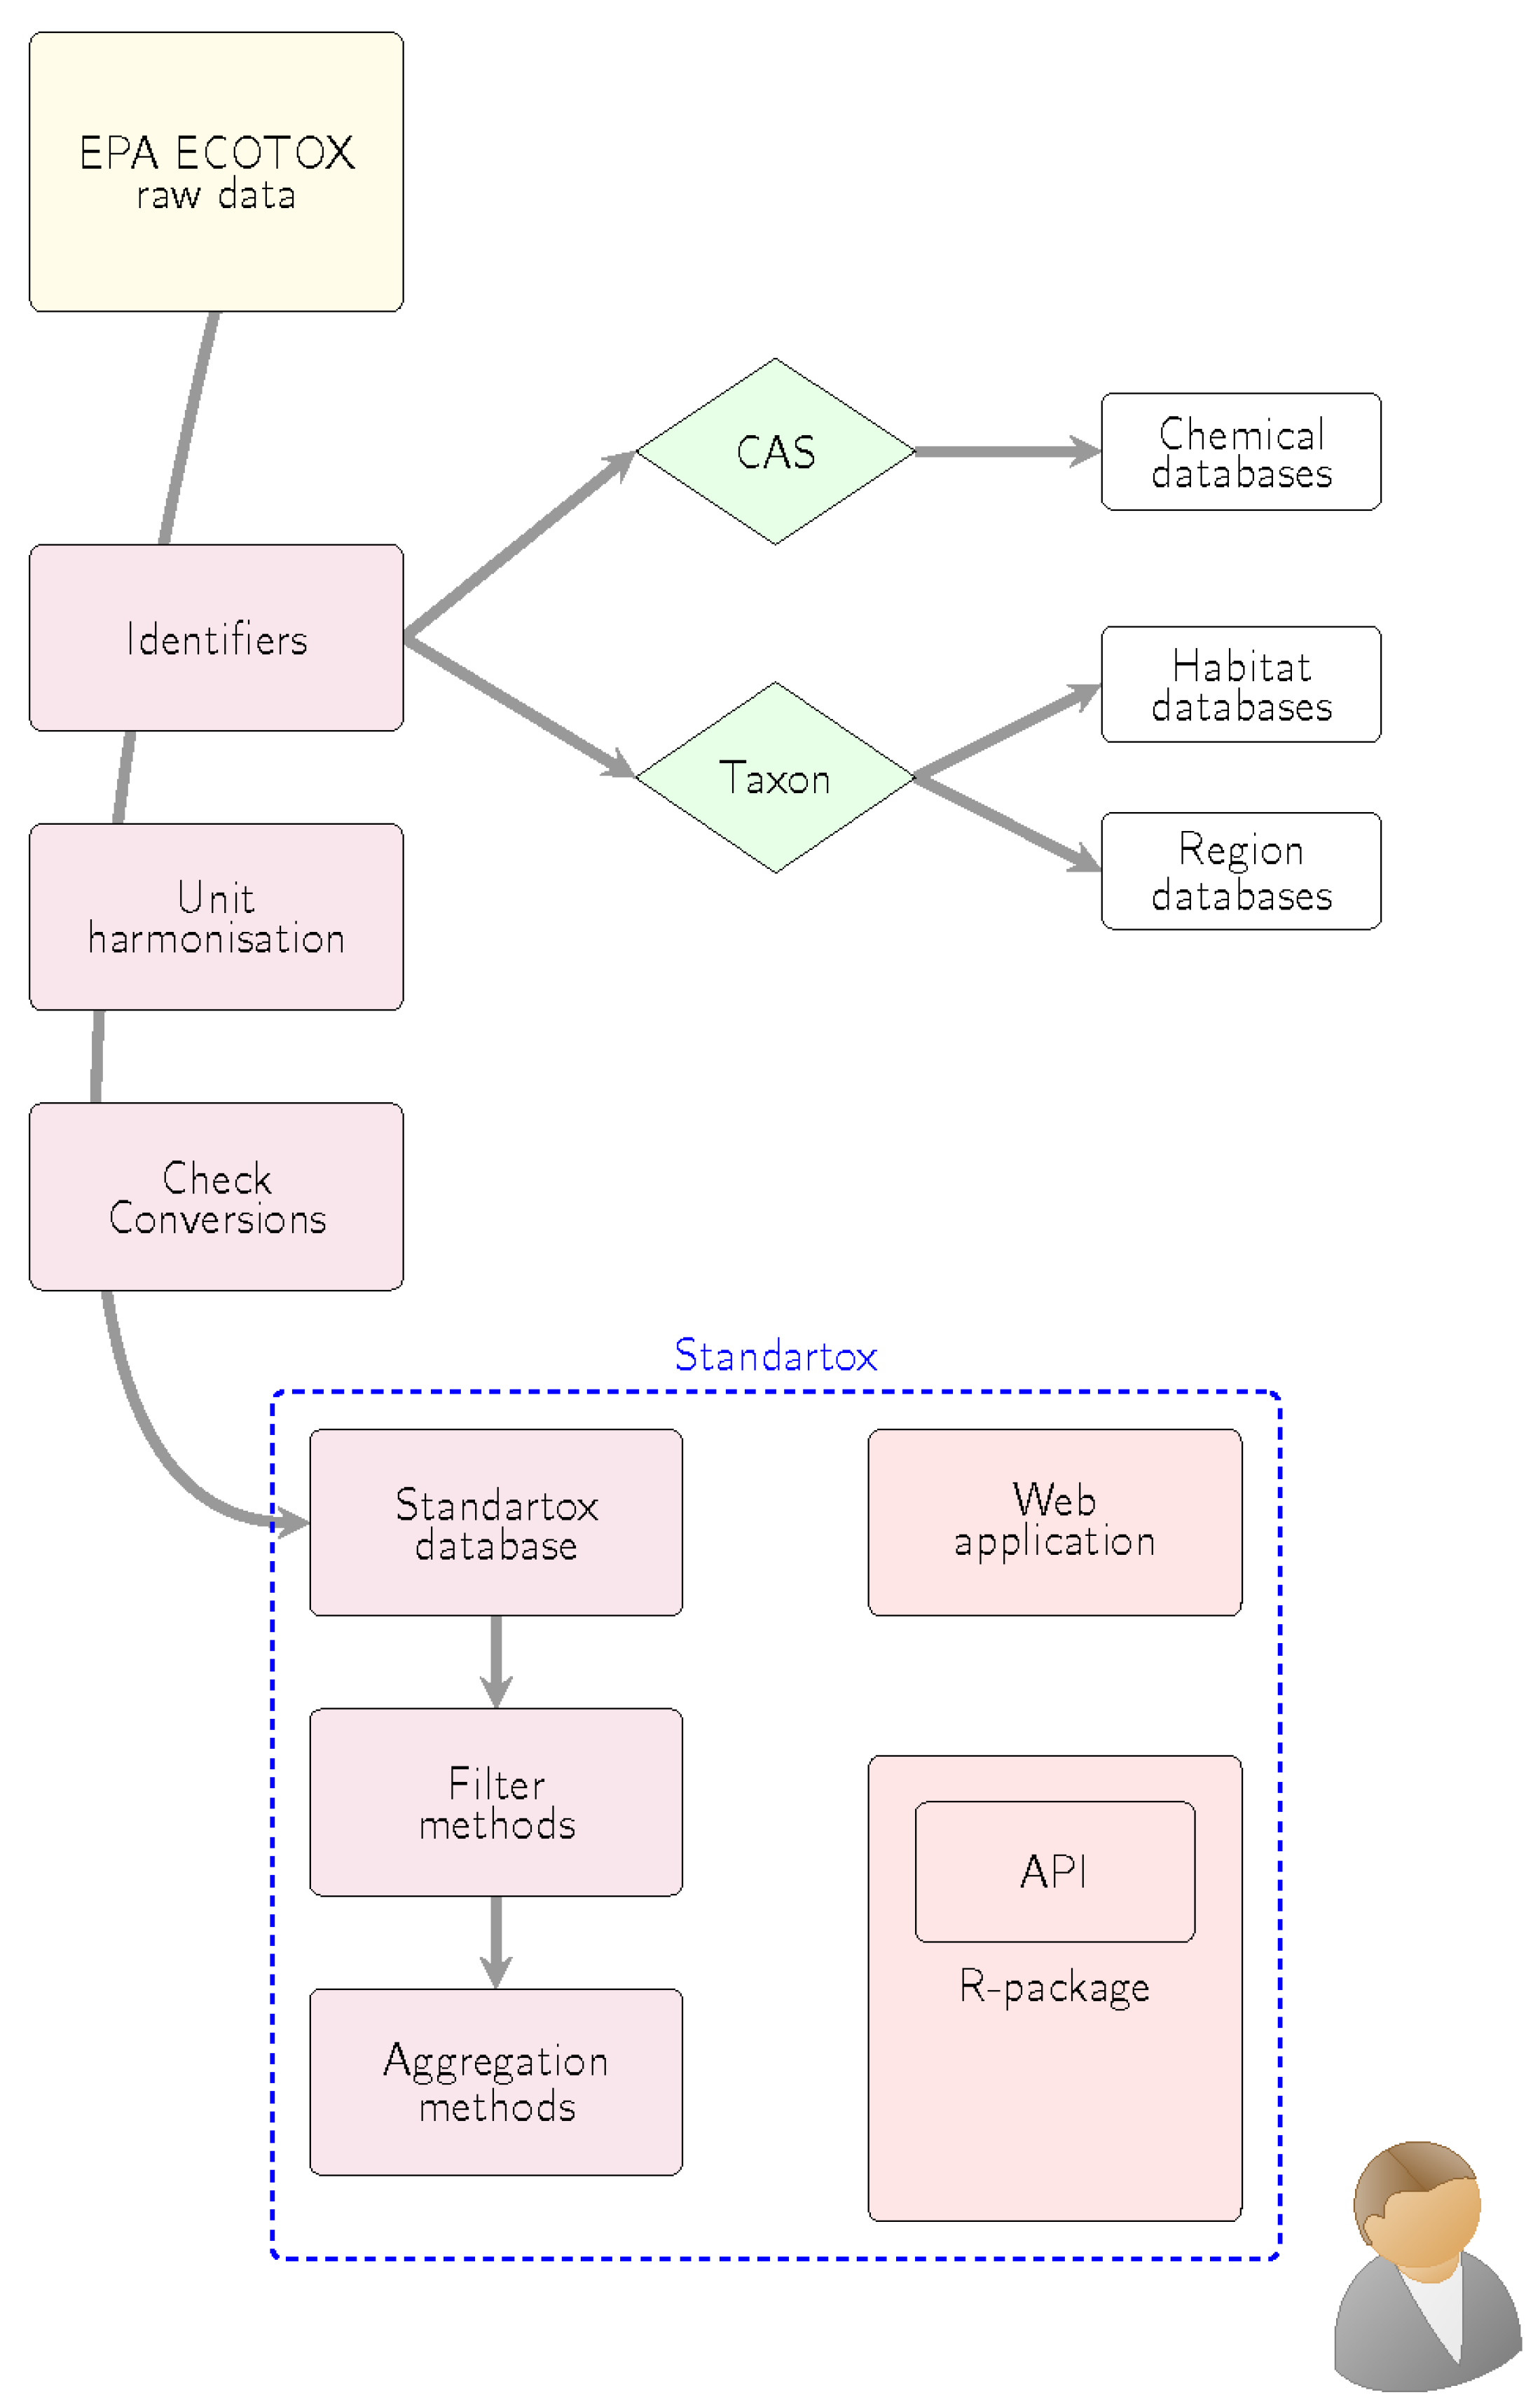
An automated processing pipeline downloads the quarterly released ECOTOX database, performs several preparation steps on it and exports a final Standartox data set. This data set is accessible via a web application and an application programming interface (API). An API provides the means for machine communication between a host and a client and thus allows scriptable data queries. To facilitate the API access, the R [31] package standartox is built. All data presented in this paper are derived from the Standartox build, based on the ECOTOX release from the 12.12.2019. The code for Standartox is located in the two Github repositories andschar/standartox-build (https://github.com/andschar/standartox-build) and andschar/standartox (https://github.com/andschar/standartox). The former contains code to process the data and to build the web application and the API, the latter contains code to build the R package. Most of the code is written in R 3.6.1 and associated packages (List: Table A4) and in Structured Query Language (SQL) for PostgreSQL 9.6.1. A graphical overview of the most important processing steps is given in Figure 4.

3.1. Processing

Standartox downloads the quarterly released ECOTOX database and builds it into a local PostgreSQL database. Subsequently, SQL functions for further processing the data are implemented. In addition lookup tables that enable the conversion of units such as duration and concentration are created. A meta-table providing information, such as the release version of the ECOTOX database is added. Then, provided Chemical Abstracts Service (CAS) numbers and taxonomic names are used to query additional information from publicly available databases on chemicals and organisms, respectively. This includes the Compendium of Pesticide Common Names [46], the Chemical Entities of Biological Interest (ChEBI) database [47], the Chemical Identifier Resolver (CIR) service [48], the Pubchem database [49], Eurostat [50] and Wikidata [51] for chemicals and the World Register of Marine Species (WoRMS) [52], the Global Biodiversity Information Facility (GBIF) [53] and the freshwaterecology.info database [54] for habitat and spatial distribution of organisms (Table A1). Given that taxonomic names can be ambiguous, e.g., the genus Eisenia can refer to an algae and a worm, we first match the taxa names against specific database identifiers and subsequently check their accordance with the underlying ECOTOX data taxonomy. Then, we query the actual data by using the identifiers. In a next step, the data are added to Standartox to enable filtering for specific chemical roles (e.g., drug, metal, pesticide, personal care product) and classes (e.g., pyrethroid, carbamate) as well as spatial distribution (i.e., continents) and habitat preferences (e.g., freshwater) of individual taxa. Taxa that were not identified to at least genus level are excluded, because relative toxicity comparisons have been shown to be not meaningful for higher taxonomic levels [24,55,56]. Finally, the Standartox data set is compiled, which includes the harmonisation of data, e.g., through conversion of test concentration and duration units. 1237 distinct concentration units are converted to six harmonized ones (i.e., g/L, g/m2, ppb, g/g, L/L and L/m2) when conversion is possible. Likewise, the 126 distinct duration units are converted to hours whenever this is unambiguously possible. To guarantee appropriate unit conversion and harmonisation, we compared the results of an automated unit conversion to a manual one for each of the distinct concentration and duration units. This assures that 652 of the 1237 concentration units (95.3% of the data) are converted correctly. The remainder could not be converted and is removed. Furthermore, the units are cleaned, for example through removing additional information in the field such as food, soil, ai that are also coded in other variables and hinder the processing of units. Concentrations that are given as rates such as per day (e.g., mg/kg/day) are multiplied by the days of the test and then converted. Experimental endpoints are restricted to three groups, namely NOEX, LOEX and XX50. Other endpoints, such as Bioconcentration factors, non-half maximal effective concentrations (e.g., IC10, EC25, LD99) or maximum acceptable toxicant concentrations are removed. Along with that, a catalog, listing all distinct entries and value ranges, for categorical and continuous variables, respectively, is created. The compiled Standartox data set together with the catalog is exported and accessible via the web application and the API, through the R package.

3.2. Application Methods

When accessed, the web application and the API load the compressed serialized Standartox data into memory and allows the user to interact with them. The user can then call the functions stx_filter() and stx_aggregate() that filter and aggregate the data according to specific parameters (Table 2). The interactive web application is built in R using the shiny framework, which runs with the help of a shiny server [57]. The API is built by using the R package plumber [58], which allows for the creation of Representational State Transfer (REST) APIs from R. REST is a software architectural style that defines web service communication rules. The API is reachable via the Internet Protocol (IP) address 139.14.20.252 and port 8000. Three API-endpoints (/catalog, /filter, and /meta) can be queried (Table A3). The /catalog API-endpoint returns a JavaScript Object Notation (JSON) file containing a catalog of possible filter parameters to choose from. The /filter returns the filtered Standartox table as a compressed serialized binary file created by the R package fst [59], to reduce size and allow for fast user queries. Lastly, the /meta API-endpoint returns a JSON file with meta information, such as the timestamp of the request and the used Standartox version. The API is designed to be used with the R package standartox and therefore uses serialization methods specific to R (rds() from the R package base and fst() from the R package fst). To facilitate the API usage the R package standartox is created.

4. User Notes

Users can access Standartox either via the web application (http://standartox.uni-landau.de) or via the R package standartox. By accessing the web application, users can filter and download the resulting data sets as a comma-separated values (csv) file. Users of the R package can directly load the data within R. The R package provides the two functions stx_catalog() and stx_query(). The first command queries a catalog of possible Standartox parameters into an R list object. The latter allows users to set the Standartox filter parameters and to fetch the actual data. It returns an R list of three tables (i.e., R data.frames) containing the filtered data set, the aggregated data set and a table with the meta information retrieved from the API endpoints. A short R-code example is given below (Listing 1) and a detailed description on the usage of the R package is provided on its Github page (https://github.com/andschar/standartox).
Listing 1: Sample code to access the Standartox database through the API and the the R package standartox. stx_catalog() returns a catalog of possible filter and aggregation parameters. stx_query() returns the Standartox object, a list of the filtered and the aggregated data as well as a meta data entry. Example for XX50 tests on the chemical glyphosate (CAS number: 1071-83-6) and the taxon Oncorhynchus lasting 24 h to 120 h.
Data 05 00046 i001

5. Conclusions

Due to the steady incorporation of new ecotoxicity data, the aggregated values produced by Standartox can be subject to change with future updates. We regard this as an advantage rather than a drawback because other published works that aim in a similar direction often constitute a singular effort or require manual work for each update. Standartox, in contrast, automates the update process, yet still provides access to its older versions, assuring reproducibility and version control. In comparison to rule-based approaches for the derivation of single ecotoxicity values, Standartox has the advantage to be free from the subjectivity of a set of human-induced rules. Above all, Standartox provides quick access through its design to be queried via the R language. Due to an increased amount of available ecotoxicological test data, it becomes fundamental to provide and distribute ecotoxicity information in adequate formats, both easily accessible for humans and easily processable for machines. Standartox meets these requirements and puts its focus on the aggregation of toxicity data, thereby adding a piece to the puzzle of modern ecotoxicological data analyses.

Author Contributions

Conceptualization and methods, A.S., R.B.S. and V.C.S.; software development and validation, A.S.; data curation and analysis, A.S.; writing—original draft preparation, A.S.; writing—review and editing, A.S., V.C.S. and R.B.S.; supervision, R.B.S. All authors have read and agreed to the published version of the manuscript.

Funding

This research was funded by the German Environment Agency (UBA) grant number 3714 67 4040/2.

Acknowledgments

The authors thank Eduard Szöcs for inspiration through a blog post on how to build a local version of the EPA ECOTOX database.

Conflicts of Interest

The authors declare no conflict of interest.

Abbreviations

The following abbreviations are used in this manuscript:
APIApplication programming interface
CASChemical abstracts service registry number
ChEBIChemical Entities of Biological Interest database
CIRChemical Identifier Resolver service
E/LC/D50Half maximal effective/lethal concentration/dose
XX50Summarizes E/LC/D50 (Table A2)
ECOTOXUS EPA ECOTOXicology Knowledgebase
GBIFGlobal Biodiversity Information Facility
JSONJavaScript Object Notation file format
LOEC/LLowest observed effect concentrations/levels
LOEXSummarizes LOEC/L (Table A2)
NOEC/LNo observed effect concentrations/levels
NOEXSummarizes NOEC/L (Table A2)
PPDBPesticides Properties DataBase
QSARQuantitative structure-activity relationship
RESTRepresentational state transfer software architectural style
SSDSpecies sensitivity distribution
TUToxic unit
WoRMSWorld Register of Marine Species

Appendix A

Table A1. Table of additionally queried publicly available databases and their URLs.
DatabaseURL
Chemical Entities of
Biological Interest (ChEBI)
https://www.ebi.ac.uk/chebi
Chemical Identifier Resolverhttps://cactus.nci.nih.gov/chemical/structure
ChemSpiderhttp://www.chemspider.com
Eurostathttps://ec.europa.eu/eurostat/home
PubChemhttps://pubchem.ncbi.nlm.nih.gov
Wikidatahttps://www.wikidata.org/wiki/Wikidata:Main_Page
Global Biodiversity
Information Facility (GBIF)
https://www.gbif.org
World Register of
Marine Species (WoRMS)
http://marinespecies.org
freshwaterecology.infohttps://www.freshwaterecology.info
Table A2. Table of how Standartox endpoints are derived from EPA ECOTOX endpoints.
Standartox EndpointEcotox EndpointEcotox Endpoint Description
XX50LC50Lethal concentration to 50% of test organisms
XX50LD50Lethal dose to 50% of test organisms
XX50EC50Effective concentration to 50% of test organisms
XX50ED50Effective dose to 50% of test organisms
XX50IC50Inhibition concentration to 50% of test organisms
XX50ID50Inhibition dose to 50% of test organisms
XX50ET50Effective response time to 50% of test organisms
XX50LT50Time to 50% mortality of test organisms
NOEXNOECNo-observable-effect-concentration
NOEXNOELNo-observable-effect-level
LOEXLOECLowest observable effect concentration
LOEXLOELLowest-observable-effect-level
Table A3. Application programming interface (API) endpoints, HTTP methods, Requests and Response objects. JSON—Javascript opject notation file.
EndpointHTTP MethodRequestResponse
/catalogPOSTStandartox version stringCatalog object (JSON)
/filterPOSTStandartox filter parametersFiltered Standartox data (serialized)
/metaPOSTStandartox version stringMeta data on request (JSON)

Appendix B

Table A4. R packages used for the compilation of the Standartox database.
PackageDescriptionCitation
bib2dfParse a BibTeX File to a Data Frame [60]
countrycodeConvert Country Names and Country Codes [61]
cowplotStreamlined Plot Theme and Plot Annotations for ’ggplot2’ [62]
data.tableExtension of ‘data.frame‘ [63]
DBIR Database Interface [64]
dbreportAutomated reports from tables [65]
devtoolsTools to Make Developing R Packages Easier [66]
doParallelForeach Parallel Adaptor for the ’parallel’ Package [67]
DTA Wrapper of the JavaScript Library ’DataTables’ [68]
foreachProvides Foreach Looping Construct for R [69]
fstLightning Fast Serialization of Data Frames for R [59]
ggplot2Create Elegant Data Visualisations Using the Grammar of Graphics [70]
httrTools for Working with URLs and HTTP [71]
jsonliteA Robust, High Performance JSON Parser and Generator for R [72]
knitrA General-Purpose Package for Dynamic Report Generation in R [73]
openxlsxRead, Write and Edit xlsx Files [74]
plotlyCreate Interactive Web Graphics via ’plotly.js’ [75]
plumberAn API Generator for R [58]
R.utilsVarious Programming Utilities [76]
RColorBrewerColorBrewer Palettes [77]
reactlogReactivity Visualizer for ’shiny’ [78]
readxlRead Excel Files [79]
rgbifInterface to the Global ’Biodiversity’ Information Facility API [80]
RPostgreSQLR Interface to the ’PostgreSQL’ Database System [81]
rvestEasily Harvest (Scrape) Web Pages [82]
scalesScale Functions for Visualization [83]
shinyWeb Application Framework for R [57]
shinydashboardCreate Dashboards with ’Shiny’ [84]
shinydashboardPlusAdd More ’AdminLTE2’ Components to ’shinydashboard’ [85]
shinyjsEasily Improve the User Experience of Your Shiny Apps in Seconds [86]
shinyWidgetsCustom Inputs Widgets for Shiny [87]
stringiCharacter String Processing Facilities [88]
stringrSimple, Consistent Wrappers for Common String Operations [89]
taxizeTaxonomic Information from Around the Web [90]
treemapTreemap Visualization [91]
treemapifyDraw Treemaps in ’ggplot2’ [92]
udunits2Udunits-2 Bindings for R [93]
webchemChemical Information from the Web [94]

References

  1. Breithaupt, H. The Costs of REACH. REACH Is Largely Welcomed, but the Requirement to Test Existing Chemicals for Adverse Effects Is Not Good News for All. EMBO Rep. 2006, 7, 968–971. [Google Scholar] [CrossRef] [PubMed]
  2. Schwarzenbach, R.P. The Challenge of Micropollutants in Aquatic Systems. Science 2006, 313, 1072–1077. [Google Scholar] [CrossRef] [PubMed]
  3. Schäfer, R.B.; von der Ohe, P.C.; Rasmussen, J.; Kefford, B.J.; Beketov, M.A.; Schulz, R.; Liess, M. Thresholds for the Effects of Pesticides on Invertebrate Communities and Leaf Breakdown in Stream Ecosystems. Environ. Sci. Technol. 2012, 46, 5134–5142. [Google Scholar] [CrossRef] [PubMed] [Green Version]
  4. Malaj, E.; von der Ohe, P.C.; Grote, M.; Kühne, R.; Mondy, C.P.; Usseglio-Polatera, P.; Brack, W.; Schäfer, R.B. Organic Chemicals Jeopardize the Health of Freshwater Ecosystems on the Continental Scale. Proc. Natl. Acad. Sci. USA 2014, 111, 9549–9554. [Google Scholar] [CrossRef] [Green Version]
  5. Hallmann, C.A.; Foppen, R.P.B.; van Turnhout, C.A.M.; de Kroon, H.; Jongejans, E. Declines in Insectivorous Birds Are Associated with High Neonicotinoid Concentrations. Nature 2014, 511, 341–343. [Google Scholar] [CrossRef]
  6. Barra Caracciolo, A.; Topp, E.; Grenni, P. Pharmaceuticals in the Environment: Biodegradation and Effects on Natural Microbial Communities. A Review. J. Pharm. Biomed. Anal. 2015, 106, 25–36. [Google Scholar] [CrossRef]
  7. Johnston, E.L.; Mayer-Pinto, M.; Crowe, T.P. REVIEW: Chemical Contaminant Effects on Marine Ecosystem Functioning. J. Appl. Ecol. 2015, 52, 140–149. [Google Scholar] [CrossRef] [Green Version]
  8. Peters, K.; Bundschuh, M.; Schäfer, R. Review on the Effects of Toxicants on Freshwater Ecosystem Functions. Environ. Pollut. 2013, 180, 324–329. [Google Scholar] [CrossRef]
  9. Van der Sluijs, J.P.; Simon-Delso, N.; Goulson, D.; Maxim, L.; Bonmatin, J.M.; Belzunces, L.P. Neonicotinoids, Bee Disorders and the Sustainability of Pollinator Services. Curr. Opin. Environ. Sustain. 2013, 5, 293–305. [Google Scholar] [CrossRef]
  10. Yamamuro, M.; Komuro, T.; Kamiya, H.; Kato, T.; Hasegawa, H.; Kameda, Y. Neonicotinoids Disrupt Aquatic Food Webs and Decrease Fishery Yields. Science 2019, 366, 620–623. [Google Scholar] [CrossRef]
  11. Steffen, W.; Crutzen, P.J.; McNeill, J.R. The Anthropocene: Are Humans Now Overwhelming the Great Forces of Nature. AMBIO J. Hum. Environ. 2007, 36, 614–621. [Google Scholar] [CrossRef]
  12. Steffen, W.; Richardson, K.; Rockstrom, J.; Cornell, S.E.; Fetzer, I.; Bennett, E.M.; Biggs, R.; Carpenter, S.R.; de Vries, W.; de Wit, C.A.; et al. Planetary Boundaries: Guiding Human Development on a Changing Planet. Science 2015, 347, 1259855. [Google Scholar] [CrossRef] [PubMed] [Green Version]
  13. Bernhardt, E.S.; Rosi, E.J.; Gessner, M.O. Synthetic Chemicals as Agents of Global Change. Front. Ecol. Environ. 2017, 15, 84–90. [Google Scholar] [CrossRef]
  14. Rosa, W. (Ed.) Transforming Our World: The 2030 Agenda for Sustainable Development. In A New Era in Global Health; Springer Publishing Company: New York, NY, USA, 2017. [Google Scholar] [CrossRef]
  15. Beketov, M.A.; Kefford, B.J.; Schäfer, R.B.; Liess, M. Pesticides Reduce Regional Biodiversity of Stream Invertebrates. Proc. Natl. Acad. Sci. USA 2013, 110, 11039–11043. [Google Scholar] [CrossRef] [PubMed] [Green Version]
  16. Schäfer, R.B.; Liess, M.; Altenburger, R.; Filser, J.; Hollert, H.; Roß-Nickoll, M.; Schäffer, A.; Scheringer, M. Future Pesticide Risk Assessment: Narrowing the Gap between Intention and Reality. Environ. Sci. Eur. 2019, 31, 21. [Google Scholar] [CrossRef] [Green Version]
  17. Morrissey, C.A.; Mineau, P.; Devries, J.H.; Sanchez-Bayo, F.; Liess, M.; Cavallaro, M.C.; Liber, K. Neonicotinoid Contamination of Global Surface Waters and Associated Risk to Aquatic Invertebrates: A Review. Environ. Int. 2015, 74, 291–303. [Google Scholar] [CrossRef]
  18. ECOTOX User Guide: ECOTOXicology Knowledgebase System. Version 5.0. Available online: https://www.epa.gov/ecotox (accessed on 1 February 2020).
  19. Umweltbundesamt. ETOX: Information System Ecotoxicology and Environmental Quality Targets. 2019. Available online: https://webetox.uba.de/webETOX (accessed on 18 December 2019).
  20. Lewis, K.A.; Tzilivakis, J.; Warner, D.J.; Green, A. An International Database for Pesticide Risk Assessments and Management. Hum. Ecol. Risk Assess. Int. J. 2016, 22, 1050–1064. [Google Scholar] [CrossRef] [Green Version]
  21. Health and Environmental Sciences Institute (HESI). EnviroTox Database & Tools; Version 1.1.0; HESI: Washington, DC, USA, 2019. [Google Scholar]
  22. Connors, K.A.; Beasley, A.; Barron, M.G.; Belanger, S.E.; Bonnell, M.; Brill, J.L.; de Zwart, D.; Kienzler, A.; Krailler, J.; Otter, R.; et al. Creation of a Curated Aquatic Toxicology Database: EnviroTox. Environ. Toxicol. Chem. 2019, 38, 1062–1073. [Google Scholar] [CrossRef] [Green Version]
  23. Mark, U.; Solbé, J. Analysis of the Ecetoc Aquatic Toxicity (EAT) Database V— The Relevance of Daphnia Magna as a Representative Test Species. Chemosphere 1998, 36, 155–166. [Google Scholar] [CrossRef]
  24. Malaj, E.; Grote, M.; Schäfer, R.B.; Brack, W.; von der Ohe, P.C. Physiological Sensitivity of Freshwater Macroinvertebrates to Heavy Metals. Environ. Toxicol. Chem. 2012, 31, 1754–1764. [Google Scholar] [CrossRef]
  25. US EPA. ECOTOX Knowledgebase; US EPA: Washington, DC, USA, 2019.
  26. Posthuma, L.; Suter, G.W.; Traas, T.P. (Eds.) Species Sensitivity Distributions in Ecotoxicology; Environmental and Ecological Risk Assessment; Lewis Publishers: Boca Raton, FL, USA, 2002. [Google Scholar]
  27. Kefford, B.J.; Marchant, R.; Schäfer, R.B.; Metzeling, L.; Dunlop, J.E.; Choy, S.C.; Goonan, P. The Definition of Species Richness Used by Species Sensitivity Distributions Approximates Observed Effects of Salinity on Stream Macroinvertebrates. Environ. Pollut. 2011, 159, 302–310. [Google Scholar] [CrossRef] [PubMed]
  28. Schäfer, R.B.; Pettigrove, V.; Rose, G.; Allinson, G.; Wightwick, A.; von der Ohe, P.C.; Shimeta, J.; Kühne, R.; Kefford, B.J. Effects of Pesticides Monitored with Three Sampling Methods in 24 Sites on Macroinvertebrates and Microorganisms. Environ. Sci. Technol. 2011, 45, 1665–1672. [Google Scholar] [CrossRef] [PubMed]
  29. OECD. OECD Guidelines for the Testing of Chemicals; OECD: Paris, France, 2020. [Google Scholar]
  30. Hartung, T.; Rovida, C. Chemical Regulators Have Overreached. Nature 2009, 460, 1080–1081. [Google Scholar] [CrossRef] [PubMed]
  31. R Core Team. R: A Language and Environment for Statistical Computing; R Foundation for Statistical Computing: Vienna, Austria, 2020. [Google Scholar]
  32. Leith, K.F.; Bowerman, W.W.; Wierda, M.R.; Best, D.A.; Grubb, T.G.; Sikarske, J.G. A Comparison of Techniques for Assessing Central Tendency in Left-Censored Data Using PCB and p,PDDE Contaminant Concentrations from Michigan’s Bald Eagle Biosentinel Program. Chemosphere 2010, 80, 7–12. [Google Scholar] [CrossRef]
  33. Posthuma, L.; van Gils, J.; Zijp, M.C.; van de Meent, D.; de Zwart, D. Species Sensitivity Distributions for Use in Environmental Protection, Assessment, and Management of Aquatic Ecosystems for 12 386 Chemicals. Environ. Toxicol. Chem. 2019, 38, 905–917. [Google Scholar] [CrossRef] [Green Version]
  34. UFZ Department of Ecological Chemistry. ChemProp 6.5. 2016. Available online: http://www.ufz.de/ecochem/chemprop (accessed on 1 February 2016).
  35. Schüürmann, G.; Ebert, R.U.; Kühne, R. Quantitative Read-Across for Predicting the Acute Fish Toxicity of Organic Compounds. Environ. Sci. Technol. 2011, 45, 4616–4622. [Google Scholar] [CrossRef]
  36. Malaj, E.; Guénard, G.; Schäfer, R.B.; von der Ohe, P.C. Evolutionary Patterns and Physicochemical Properties Explain Macroinvertebrate Sensitivity to Heavy Metals. Ecol. Appl. 2016, 26, 1249–1259. [Google Scholar] [CrossRef]
  37. Van den Berg, S.J.P.; Baveco, H.; Butler, E.; De Laender, F.; Focks, A.; Franco, A.; Rendal, C.; Van den Brink, P.J. Modeling the Sensitivity of Aquatic Macroinvertebrates to Chemicals Using Traits. Environ. Sci. Technol. 2019, 53, 6025–6034. [Google Scholar] [CrossRef] [Green Version]
  38. Martin, T.M.; Young, D.M. Prediction of the Acute Toxicity (96-h LC 50) of Organic Compounds to the Fathead Minnow (PimephalesPromelas) Using A Group Contribution Method. Chem. Res. Toxicol. 2001, 14, 1378–1385. [Google Scholar] [CrossRef]
  39. Williams, A.J.; Grulke, C.M.; Edwards, J.; McEachran, A.D.; Mansouri, K.; Baker, N.C.; Patlewicz, G.; Shah, I.; Wambaugh, J.F.; Judson, R.S.; et al. The CompTox Chemistry Dashboard: A Community Data Resource for Environmental Chemistry. J. Cheminform. 2017, 9, 61. [Google Scholar] [CrossRef]
  40. Judson, R.; Richard, A.; Dix, D.; Houck, K.; Elloumi, F.; Martin, M.; Cathey, T.; Transue, T.R.; Spencer, R.; Wolf, M. ACToR—Aggregated Computational Toxicology Resource. Toxicol. Appl. Pharmacol. 2008, 233, 7–13. [Google Scholar] [CrossRef] [PubMed]
  41. Judson, R.S.; Martin, M.T.; Egeghy, P.; Gangwal, S.; Reif, D.M.; Kothiya, P.; Wolf, M.; Cathey, T.; Transue, T.; Smith, D.; et al. Aggregating Data for Computational Toxicology Applications: The U.S. Environmental Protection Agency (EPA) Aggregated Computational Toxicology Resource (ACToR) System. Int. J. Mol. Sci. 2012, 13, 1805–1831. [Google Scholar] [CrossRef] [PubMed]
  42. Kienzler, A.; Barron, M.G.; Belanger, S.E.; Beasley, A.; Embry, M.R. Mode of Action (MOA) Assignment Classifications for Ecotoxicology: An Evaluation of Approaches. Environ. Sci. Technol. 2017, 51, 10203–10211. [Google Scholar] [CrossRef] [PubMed] [Green Version]
  43. Rosenkrantz, R.T.; Cedergreen, N.; Baun, A.; Kusk, K.O. Influence of pH, Light Cycle, and Temperature on Ecotoxicity of Four Sulfonylurea Herbicides towards Lemna Gibba. Ecotoxicology 2013, 22, 33–41. [Google Scholar] [CrossRef] [Green Version]
  44. Li, D.; Zhou, D.; Wang, P.; Li, L. Temperature Affects Cadmium-Induced Phytotoxicity Involved in Subcellular Cadmium Distribution and Oxidative Stress in Wheat Roots. Ecotoxicol. Environ. Saf. 2011, 74, 2029–2035. [Google Scholar] [CrossRef]
  45. Compson, Z.G.; Monk, W.A.; Curry, C.J.; Gravel, D.; Bush, A.; Baker, C.J.; Al Manir, M.S.; Riazanov, A.; Hajibabaei, M.; Shokralla, S.; et al. Linking DNA Metabarcoding and Text Mining to Create Network-Based Biomonitoring Tools: A Case Study on Boreal Wetland Macroinvertebrate Communities. Adv. Ecol. Res. 2018, 59, 33–74. [Google Scholar] [CrossRef]
  46. Wood, A. Compendium of Pesticide Common Names. 2019. Available online: http://www.alanwood.net/pesticides (accessed on 1 April 2020).
  47. Hastings, J.; Owen, G.; Dekker, A.; Ennis, M.; Kale, N.; Muthukrishnan, V.; Turner, S.; Swainston, N.; Mendes, P.; Steinbeck, C. ChEBI in 2016: Improved Services and an Expanding Collection of Metabolites. Nucleic Acids Res. 2016, 44, D1214–D1219. [Google Scholar] [CrossRef]
  48. National Institutes of Health (NIH). Chemical Identifier Resolver; NIH: Bethesda, MD, USA, 2019. [Google Scholar]
  49. Kim, S.; Thiessen, P.A.; Bolton, E.E.; Chen, J.; Fu, G.; Gindulyte, A.; Han, L.; He, J.; He, S.; Shoemaker, B.A.; et al. PubChem Substance and Compound Databases. Nucleic Acids Res. 2016, 44, D1202–D1213. [Google Scholar] [CrossRef]
  50. European Commission. Eurostat; European Commission: Brussels, Belgium, 2019. [Google Scholar]
  51. Vrandečić, D.; Krötzsch, M. Wikidata: A Free Collaborative Knowledgebase. Commun. ACM 2014, 57, 78–85. [Google Scholar] [CrossRef]
  52. WoRMS Editorial Board. World Register of Marine Species (WoRMS); WoRMS Editorial Board: Worms, Germany, 2020; Available online: http://www.marinespecies.org (accessed on 1 April 2020).
  53. GBIF: The Global Biodiversity Information Facility. What Is GBIF? 2020. Available online: https://www.gbif.org/what-is-gbif (accessed on 1 April 2020).
  54. Schmidt-Kloiber, A.; Hering, D. www.Freshwaterecology.Info—An Online Tool That Unifies, Standardises and Codifies More than 20,000 European Freshwater Organisms and Their Ecological Preferences. Ecol. Indic. 2015, 53, 271–282. [Google Scholar] [CrossRef]
  55. Rainbow, P.S. Trace Metal Concentrations in Aquatic Invertebrates: Why and so What? Environ. Pollut. 2002, 120, 497–507. [Google Scholar] [CrossRef]
  56. Buchwalter, D.B.; Luoma, S.N. Differences in Dissolved Cadmium and Zinc Uptake among Stream Insects: Mechanistic Explanations. Environ. Sci. Technol. 2005, 39, 498–504. [Google Scholar] [CrossRef] [PubMed]
  57. Chang, W.; Cheng, J.; Allaire, J.; Xie, Y.; McPherson, J. Shiny: Web Application Framework for R, R package version 1.4.0.2; 2020. Available online: https://CRAN.R-project.org/package=shiny (accessed on 1 April 2020).
  58. Trestle Technology, LLC. plumber: An API Generator for R, R package version 0.4.6; Trestle Technology, LLC: Dallas, TX, USA, 2018; Available online: https://CRAN.R-project.org/package=plumber (accessed on 1 April 2020).
  59. Klik, M. fst: Lightning Fast Serialization of Data Frames for R, R package version 0.9.2; 2020. Available online: https://CRAN.R-project.org/package=fst (accessed on 1 April 2020).
  60. Ottolinger, P. bib2df: Parse a BibTeX File to a Data Frame, R package version 1.1.1; 2019. Available online: https://CRAN.R-project.org/package=bib2df (accessed on 1 April 2020).
  61. Arel-Bundock, V. Countrycode: Convert Country Names and Country Codes, R package version 1.1.1; 2020. Available online: https://CRAN.R-project.org/package=countrycode (accessed on 1 April 2020).
  62. Wilke, C.O. cowplot: Streamlined Plot Theme and Plot Annotations for ‘ggplot2’, R package version 0.9.4; 2019. Available online: https://CRAN.R-project.org/package=cowplot (accessed on 1 April 2020).
  63. Dowle, M.; Srinivasan, A. data.table: Extension of ‘data.frame’, R package version 1.12.8; 2019. Available online: https://CRAN.R-project.org/package=data.table (accessed on 1 April 2020).
  64. R Special Interest Group on Databases (R-SIG-DB); Wickham, H.; Müller, K. DBI: R Database Interface, R package version 1.1.0; 2019. Available online: https://CRAN.R-project.org/package=DBI (accessed on 1 April 2020).
  65. Scharmüller, A. dbreport: Automated Reports from Tables, R package version 0.0.0.9007; 2020. Available online: https://github.com/andschar/dbreport (accessed on 1 April 2020).
  66. Wickham, H.; Hester, J.; Chang, W. devtools: Tools to Make Developing R Packages Easier, R package version 2.2.1; 2019. Available online: https://CRAN.R-project.org/package=devtools (accessed on 1 April 2020).
  67. Corporation, M.; Weston, S. doParallel: Foreach Parallel Adaptor for the ‘Parallel’ Package, R package version 1.0.14; 2018. Available online: https://CRAN.R-project.org/package=doParallel (accessed on 1 April 2020).
  68. Xie, Y.; Cheng, J.; Tan, X. DT: A Wrapper of the JavaScript Library ‘DataTables’, R package version 0.7; 2019. Available online: https://CRAN.R-project.org/package=DT (accessed on 1 April 2020).
  69. Microsoft; Weston, S. foreach: Provides Foreach Looping Construct for R, R package version 1.4.4; 2017. Available online: https://CRAN.R-project.org/package=foreach (accessed on 1 April 2020).
  70. Wickham, H.; Chang, W.; Henry, L.; Pedersen, T.L.; Takahashi, K.; Wilke, C.; Woo, K.; Yutani, H.; Dunnington, D. ggplot2: Create Elegant Data Visualisations Using the Grammar of Graphics, R package version 3.3.0; 2020. Available online: https://CRAN.R-project.org/package=ggplot2 (accessed on 1 April 2020).
  71. Wickham, H. httr: Tools for Working with URLs and HTTP, R package version 1.4.1; 2019. Available online: https://CRAN.R-project.org/package=httr (accessed on 1 April 2020).
  72. Ooms, J. jsonlite: A Robust, High Performance JSON Parser and Generator for R, R package version 1.6.1; 2020. Available online: https://CRAN.R-project.org/package=jsonlite (accessed on 1 April 2020).
  73. Xie, Y. knitr: A General-Purpose Package for Dynamic Report Generation in R, R package version 1.28; 2020. Available online: https://CRAN.R-project.org/package=knitr (accessed on 1 April 2020).
  74. Schauberger, P.; Walker, A. openxlsx: Read, Write and Edit xlsx Files, R package version 4.1.4; 2019. Available online: https://CRAN.R-project.org/package=openxlsx (accessed on 1 April 2020).
  75. Sievert, C.; Parmer, C.; Hocking, T.; Chamberlain, S.; Ram, K.; Corvellec, M.; Despouy, P. plotly: Create Interactive Web Graphics via ‘plotly.js’, R package version 4.9.0; 2019. Available online: https://CRAN.R-project.org/package=plotly (accessed on 1 April 2020).
  76. Bengtsson, H. utils: Various Programming Utilities, R package version 2.9.0; 2019. Available online: https://CRAN.R-project.org/package=R.utils (accessed on 1 April 2020).
  77. Neuwirth, E. RColorBrewer: ColorBrewer Palettes, R package version 1.1-2; 2014. Available online: https://CRAN.R-project.org/package=RColorBrewer (accessed on 1 April 2020).
  78. Schloerke, B. reactlog: Reactivity Visualizer for ‘Shiny’, R package version 1.0.0; 2019. Available online: https://CRAN.R-project.org/package=reactlog (accessed on 1 April 2020).
  79. Wickham, H.; Bryan, J. readxl: Read Excel Files, R package version 1.3.1; 2019. Available online: https://CRAN.R-project.org/package=readxl (accessed on 1 April 2020).
  80. Chamberlain, S. rgbif: Interface to the Global ‘Biodiversity’ Information Facility API, R package version 1.3; 2019. Available online: https://CRAN.R-project.org/package=rgbif (accessed on 1 April 2020).
  81. Conway, J.; Eddelbuettel, D.; Nishiyama, T.; Prayaga, S.K.; Tiffin, N. RPostgreSQL: R Interface to the ‘PostgreSQL’ Database System, R package version 0.6-2; 2017. Available online: https://CRAN.R-project.org/package=RPostgreSQL (accessed on 1 April 2020).
  82. Wickham, H. rvest: Easily Harvest (Scrape) Web Pages, R package version 0.3.5; 2019. Available online: https://CRAN.R-project.org/package=rvest (accessed on 1 April 2020).
  83. Wickham, H.; Seidel, D. scales: Scale Functions for Visualization, R package version 1.1.0; 2019. Available online: https://CRAN.R-project.org/package=scales (accessed on 1 April 2020).
  84. Chang, W.; Borges Ribeiro, B. shinydashboard: Create Dashboards with ‘Shiny’, R package version 0.7.1; 2018. Available online: https://CRAN.R-project.org/package=shinydashboard (accessed on 1 April 2020).
  85. Granjon, D. shinydashboardPlus: Add More ‘AdminLTE2’ Components to ‘shinydashboard’, R package version 0.7.0; 2019. Available online: https://CRAN.R-project.org/package=shinydashboardPlus (accessed on 1 April 2020).
  86. Attali, D. shinyjs: Easily Improve the User Experience of Your Shiny Apps in Seconds, R package version 1.0; 2018. Available online: https://CRAN.R-project.org/package=shinyjs (accessed on 1 April 2020).
  87. Perrier, V.; Meyer, F.; Granjon, D. shinyWidgets: Custom Inputs Widgets for Shiny, R package version 0.4.8; 2019. Available online: https://CRAN.R-project.org/package=shinyWidgets (accessed on 1 April 2020).
  88. Gagolewski, M.; Tartanus, B. stringi: Character String Processing Facilities, R package version 1.4.6; 2020. Available online: https://CRAN.R-project.org/package=stringi (accessed on 1 April 2020).
  89. Wickham, H. stringr: Simple, Consistent Wrappers for Common String Operations, R package version 1.4.0; 2019. Available online: https://CRAN.R-project.org/package=stringr (accessed on 1 April 2020).
  90. Chamberlain, S.; Szoecs, E.; Foster, Z.; Arendsee, Z. taxize: Taxonomic Information from Around the Web, R package version 0.9.7; 2019. Available online: https://CRAN.R-project.org/package=taxize (accessed on 1 April 2020).
  91. Tennekes, M. treemap: Treemap Visualization, R package version 2.4-2; 2017. Available online: https://CRAN.R-project.org/package=treemap (accessed on 1 April 2020).
  92. Wilkins, D. treemapify: Draw Treemaps in ‘ggplot2’, R package version 2.5.3; 2019. Available online: https://CRAN.R-project.org/package=treemapify (accessed on 1 April 2020).
  93. Hiebert, J. udunits2: Udunits-2 Bindings for R, R package version 0.13; 2016. Available online: https://CRAN.R-project.org/package=udunits2 (accessed on 1 April 2020).
  94. Szöcs, E. webchem: Chemical Information from the Web. 2020. R package version 0.5.0; 2020. Available online: https://CRAN.R-project.org/package=webchem (accessed on 1 April 2020).
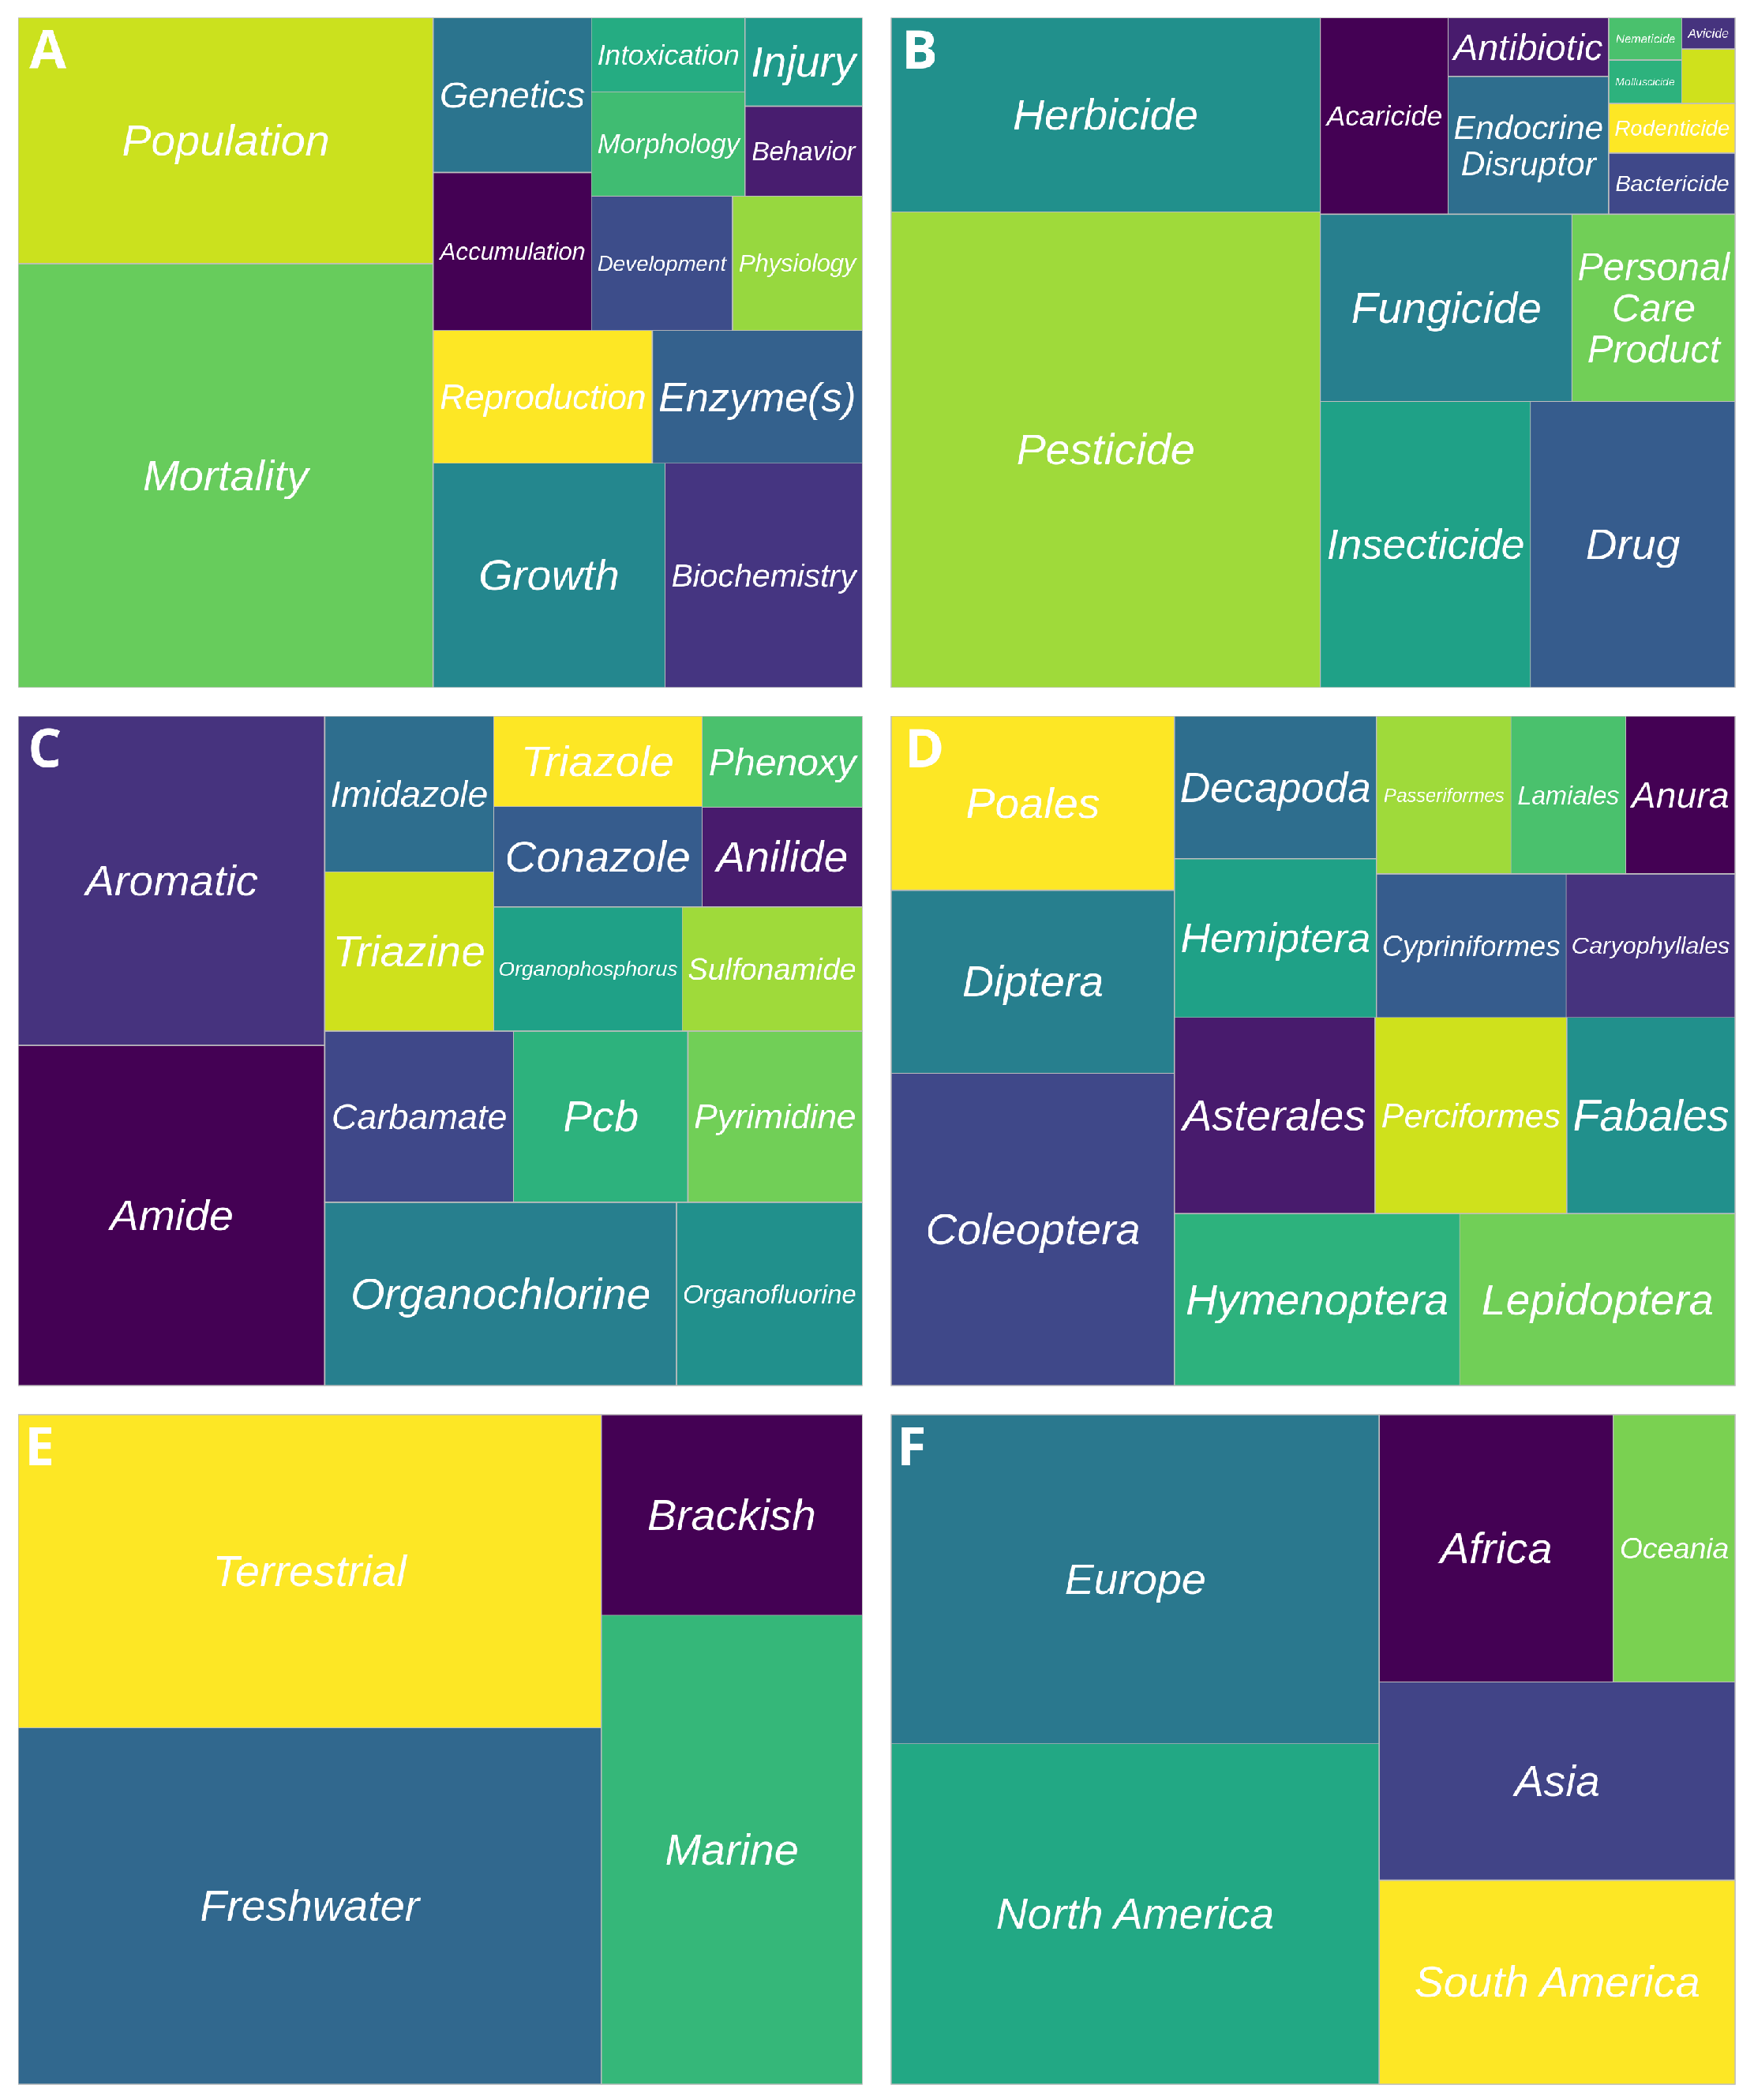
Figure 1. Share of 10 most frequent entries for the parameters (A) effect group, (B) chemical role, (C) chemical class, (D) taxonomic order, (E) organism habitat and (F) organism distribution in Standartox. Multiple classifications are possible (e.g. a chemical can be a fungicide and a pesticide).
Data 05 00046 g001
Figure 2. Violin plots of of test results (XX50) in Standartox illustrating (A) differential variability and data distribution between species (i.e., Xenopus laevis—Amphibian, Raphidocelis subcapitata—Algae, Oncorhynchus mykiss—Fish, Lemna minor—Macrophyte) for the chemical atrazine in 96 h tests, (B) how the variability in toxicity tests with zinc sulfate and Daphnia magna varies with test duration and (C) high variability that is not explained by the available test characteristics in the case of cupric sulfate tested on Pimephales promelas for 96 h. Red dots depict Standartox geometric mean estimates and red error bars show the associated standard deviation. Black dots depict the raw data. To facilitate readability, data points are randomly scattered along a hypothetical y-axis and are greyed out if within the violins.
Data 05 00046 g002
Figure 3. Comparison between Standartox, (A) the Pesticides Properties DataBase (PPDB) and (B) ChemProp values. The black lines indicate identity and red lines mark a divergence of a factor of 10. Compared species are color coded.
Data 05 00046 g003
Figure 4. Organigram of Standartox. The U.S. Environmental Protection Agency (EPA) ECOTOXicology Knowledgebase (ECOTOX) is downloaded quarterly and processed (i.e., query additional information with Chemical Abstracts Service (CAS) numbers and taxa names and conversion of concentration and duration units). Subsequently, a Standartox data set is compiled together with filter and aggregation methods. Thus, users can access the Standartox data set and filter and aggregate through a web application and an R package.
Data 05 00046 g004
Table 1. Overview on databases that provide ecotoxicological data. Abbreviations: ALL: Most important test parameters, including chemical, taxon, duration for filtering ecotoxicological data are incorporated. Web: Accessible via a web application through a graphical user interface. API: Accessible via an application programming interface.
DatabaseFilterAggregation, SelectionAccess
Comptox [39]ChemicalnoWeb, file
Ecotox [25]ALLnoWeb, file
EnviroTox [21]ALLchemical, organismWeb
Etox [19]ALLnoWeb
Pesticides Properties DataBase (PPDB) [20]fixed valuesmanual selectionWeb, file
StandartoxALLchemical, organismAPI, Web
Table 2. Input parameters for the Standartox web application and the R package standartox (CAS—Chemical Abstracts Service Registry number, NOEX and XX50—Standartox endpoints Table A2), vers—Standartox version).
ParameterExample
cas7758987, 2921-88-2, 1912-24-9
concentration_typeActive ingredient, Formulation
chemical_roleAntibiotic, Fungicide, Drug
chemical_classConazole, Neonicotinoid, Triazine
taxaOncorhynchus mykiss, Rattus norvegicus, Daphnia magna
habitatMarine, Brackish, Freshwater
regionEurope, Africa, Asia
duration24, 96
effectMortality, Population, Growth
endpointNOEX, XX50
exposureauquatic, diet
vers20191212