Article

Guidelines for a Standardized Filesystem Layout for Scientific Data

by
Florian Spreckelsen
1,2,3,
Baltasar Rüchardt
1,2,3,
Jan Lebert
1,2,3,4,
Stefan Luther
1,2,3,5,
Ulrich Parlitz
1,2,3 and
Alexander Schlemmer
1,3,*
1
Max Planck Institute for Dynamics and Self-Organization, 37077 Göttingen, Germany
2
Institute for the Dynamics of Complex Systems, Georg-August-Universität, 37077 Göttingen, Germany
3
German Center for Cardiovascular Research (DZHK), partner site Göttingen, 37075 Göttingen, Germany
4
Department of Cardiology and Pneumology, University Medical Center Göttingen, 37075 Göttingen, Germany
5
Institute of Pharmacology and Toxicology, University Medical Center Göttingen, 37075 Göttingen, Germany
*
Author to whom correspondence should be addressed.
Submission received: 1 April 2020 / Revised: 17 April 2020 / Accepted: 21 April 2020 / Published: 24 April 2020
(This article belongs to the Special Issue Data Quality and Data Access for Research)

Abstract

:
Storing scientific data on the filesystem in a meaningful and transparent way is no trivial task. In particular, when the data have to be accessed after their originator has left the lab, the importance of a standardized filesystem layout cannot be underestimated. It is desirable to have a structure that allows for the unique categorization of all kinds of data from experimental results to publications. They have to be accessible to a broad variety of workflows, e.g., via graphical user interface as well as via command line, in order to find widespread acceptance. Furthermore, the inclusion of already existing data has to be as simple as possible. We propose a three-level layout to organize and store scientific data that incorporates the full chain of scientific data management from data acquisition to analysis to publications. Metadata are saved in a standardized way and connect original data to analyses and publications as well as to their originators. A simple software tool to check a file structure for compliance with the proposed structure is presented.

1. Introduction

1.1. Motivation

One of the most frequent issues in data management is the organization of files within a meaningful hierarchical structure. Modern filesystems offer many possibilities regarding the choice of names and complexity of folder hierarchies which can lead to many omnipresent problems in scientific data management:
  • Finding specific folders in deep folder structures can become a time-consuming task, especially when dealing with large file sizes and a huge number of individual files.
  • The tree-like nature of folder hierarchies can highly impede findability. The hierarchy of folders itself is in many cases arbitrary and therefore difficult to define in a general way.
  • The lack of standards often leads to diverging and unnecessarily expanded folder structures that are impossible to understand by collaborators or new lab members.
Sophisticated solutions to address these problems can involve databases or object storage systems. Although these systems can provide a clean interface to data on higher levels, the low-level structuring problems often remain, as data files need to be accessible on traditional filesystems in many cases.
From the need for a simple, but generic and standardized filesystem layout we designed an approach that allows easy implementation. We apply this approach in the Research Group Biomedical Physics at the Max Planck Institute for Dynamics and Self-Organization in Göttingen. But we believe it is applicable and beneficial to a much wider variety of disciplines and research groups, especially, where there is no standardized structure available. Since adoption by scientific users is the main focus of this effort, several considerations were important for the design:
  • The new layout should be compatible with existing structures and at least allow for a smooth integration of existing file structures.
  • The filesystem layout should allow access through very different scientific workflows. Usage by databases should be similarly possible as an intuitive access of the raw file structure. It should be accessible via graphical user interfaces as well as command line interfaces and thus allow for automation, e.g. via shell scripts.
  • Simplicity of the layout definition itself in order to lower the threshold for adopting a standardized way of storing data and metadata in the first place.
In view of the experience, that establishing a standardized filesystem layout in a work group is not only a technical challenge, but also requires concerted action by all participants, we consider that these design criteria are extremely relevant. In our experience, the simplicity of the definition in particular, can be very beneficial to comprehensibility and thus lead to increased acceptance.
When using more sophisticated software such as databases, filesystem structures are often replaced by random numbers or arbitrary identifiers that are not intended for use by end-users. However, we believe it is very important to retain traditional filesystem structures and human-readable filenames, as they have proven to be robust and also provide a fail-safe option in case other specific software systems fail. The filesystem layout proposed in this article can be integrated into workflows involving research data management systems.

1.2. Comparison to Other Approaches

There are existing approaches to standardize filesystem structures. To the knowledge of the authors they are, however, either very specific and tied to a single scientific field (e.g., BIDS [1]) or very abstract (e.g., ISA-Tab [2]). Abstractness is not a problem itself, but grants much freedom to individual workgroups which again causes diverging systems and non-standardized filesystem structures. Thus neither the specific nor the abstract approaches that already exist achieve wide-spread adoption. Some of our aims intersect with those of metadata models like ISA-Tab. Especially, in that ISA-Tab also links individual experiments (assays) to the larger context (investigations, studies) and possible publications and provides a systematic documentation of metadata. ISA-Tab, however, does not (and does not aim to) specify how the actual data collected in individual assays is stored on the filesystem1. Connections between assays and data files, but also between assays, studies and investigations have to be extracted from the respective metadata files instead, which in our view limits the usability. Furthermore, it is designed mainly for experiments in biology, medicine, and life sciences and is thus not directly applicable to e.g., numerical simulations in solid state physics.
Our approach can be seen as complementary to large metadata repositories (e.g., https://earthdata.nasa.gov or [3]) and repositories for data publication (e.g., PANGAEA [4]). Metadata repositories and data repositories aim at gathering and collecting information about complete scientific fields, while our approach aims at a standardized organization of files, folders and metadata on the local level (e.g., network drives for workgroups, individual computers of scientists, file storage servers). Another important difference is that data and metadata are typically published in global repositories, after data acquisition has ended, data analysis is finalized, or articles are submitted, whereas our approach can be effective during data acquisition and may be particularly helpful for data, that is actively worked on, too. It is highly desirable to submit consolidated and final data to large-scale repositories which can be done in addition to our scheme. For this purpose, persistent identifiers (PIDs) commonly used in such repositories can be added to the metadata files in our layout.

1.3. Aims

The implementation of the filesystem layout we present in this manuscript should achieve the following design principles:
  • Allow for a mapping of the complete chain of scientific data management:
    • Data acquisition (Experiment / Simulation)
    • Data analysis
    • Publication
    Links between the different stages must be possible.
  • Encourage transparency: The data structure should be understandable and searchable. Folders and files should have meaningful names. The folder hierarchy should be readily apparent to persons unfamiliar with it.
  • Support of reproducibility: Ideally the structure should enable reproducibility of data analysis and publications from raw experimental and simulation data.
  • All data must remain accessible, understandable, and reusable even when original creators are not present anymore.
  • The structure must provide a possibility for saving metadata.
  • Integration of existing structures must be feasible rather than having to adapt to our structure.
These design principles comply with the FAIR [5] guiding principles of data management.

2. Results

2.1. Implementation

The actual implementation of the filesystem layout consists of two parts: the structure of the directories on the filesystem itself and the storage of metadata. The former determines where data of individual experiments, simulations, and analyses are stored, while the latter contains necessary information about the data and is the only strict requirement for the actual contents of the directories.

2.1.1. Data Structure

All data stored in our filesystem structure are categorized as experimental data, simulation data, data analysis, or publication. Each category has two levels, as shown in Table 1: The top level specifies the general project, while the lower level contains individual experiments, simulations, analyses, or publications belonging to the respective projects. As explained above, we decided to include information into the directory names themselves to make the structure as accessible as possible. The naming conventions for experiments, simulations, and analyses are identical; the naming conventions for publications differ slightly (cf. Table 1) and will be discussed later.
The directories that belong to the categories themselves are simply named ExperimentalData, SimulationData, DataAnalysis, and Publications. The directory names at project level must be chosen carefully, especially if more than one person is involved in working on a project. Due to the hierarchical structure, they must be sufficiently general to prevent single experiments or analyses from being assigned to more than one project, while at the same time giving a clear impression of the contents of the project. Project names for experiments, simulations, or analyses belonging to the same project should be identical within the respective category directories. We suggest that the names of project directories start with the beginning year of the project, followed by an underscore that separates the year from the project name. Figure 1 shows the two examples 2020_SpeedOfLight and 2019_ElementaryCharge for two fictitious projects for the experimental determination of the speed of light and the elementary charge.
The entries in the project directories correspond to individual experiments, simulations, or analyses. Their names should begin with their (start) date. In addition, a descriptor can be given which further explains the content of the particular entry in more detail. Again, an underscore separates the date from the descriptor. Three example experiments, each consisting of the measurements of the speed of light, are shown in Figure 1 as entries of the project 2020_SpeedOfLight. Two of them, 2020-01-01_TimeOfFlight and 2020-01-01_Cavity, contain the experimental method as a descriptor in their directory names, while the third one, 2020-01-03, is named after the date only. These directories contain all collected data and metadata (see Section 2.1.4) in almost arbitrary structure. In particular, if the proposed filesystem layout is used for already existing data, any structure that may have been previously defined, can be retained within these directories.
Publications include journal articles, but also dissertations and (conference) lectures or posters, as well as internal reports. We have found that there are usually only a few publications per project so there is little point in collecting them in project directories. Instead, we have decided to group them according to the type of publication, i.e., article, lecture, poster, etc. The directories on the project level are thus called Articles, Presentations, and so on. The individual entries correspond to individual publications and should be named (as above) with date and descriptor. For journal articles, a good descriptor could consist of the first author and the (short) title of the journal.

2.1.2. Dates and Years

In the proposed filesystem layout, dates and years play an important role, as all entries must contain a date, and project names preferably the year. While choosing the “correct” date or year is very natural in many cases, it can be difficult in some cases. For a single session of an experiment, it would be very natural to choose the date of that experiment as the date for the folder name. However, this choice is less obvious, e.g., for measurements that extend over a period of several days or weeks.
We think that it is also very advantageous to save a date in difficult cases, as it can often be a helpful hint for finding data. In cases where the exact contents or names of projects cannot be remembered, it is often at least clear when approximately a project was carried out.
We therefore propose to consider the date of a folder as an approximate date that helps to locate data, rather than an exact timestamp with reliably interpretable meaning. A good standard rule for selecting dates is to simply take the start date, e.g. the start date of a measurement lasting several days, for naming the folder or project.

2.1.3. Categories

Note that there may be cases where it is difficult to assign a unique category to an entry. A numerical simulation could be considered a numerical experiment, and more complex forms of data collection could also be considered a form of analysis, too. Measurements of e.g., climatic or geological data are observations rather than experiments and therefore do not really fit into any of the above categories. The same is true for data collected during field studies. We still decided to use the four categories experiments, simulations, analyses, and publications since in our experience, most studies can be sorted into one of them. Ultimately, the use of such human-readable categories will always lead to certain ambiguities in special cases. We use these four for reasons of generality and readability, and thus, ultimately, also for user-friendliness. Of course, they can be extended or replaced if necessary. Additional categories such as MeasuredData or FieldData could be introduced in addition to or instead of ExperimentalData. The structure of all additional categories has to be the same as in ExperimentalData, i.e., it hast to contain the projects that in turn contain the individual entries, as explained above and depicted in Figure 1. We will consider ExperimentalData only in the following, but it can be read as a proxy for all possible other categories for raw data.

2.1.4. Metadata

After the introduction of the directory structure in which the data is stored on the filesystem, the second part of our proposed data structure concerns the standardization of metadata. This is the only strict requirement for the contents of each entry that we propose. We require that each entry contain a text file called README.md in markdown style following the pandoc implementation [6]. This file consists of a YAML [7] header in which metadata are stored in the form key: value. The minimal requirements to the keys are shown in Listing 1. It must contain at least the name of a person responsible for the data under the key responsible and a short description following the key description. While of course more metadata could and should be stored, we have found that the combination of these minimal requirements and project and date from the filesystem structure already greatly improves the accessibility of stored data.
Listing 1. Contents of a minimal YAML header of a README.md containing the responsible person and a short description. Both pieces of information are given in the form of key: value pairs following YAML notation. The header starts with three hyphens --- and ends with three periods ....
Data 05 00043 i001
Depending on the respective entry, there can be any number of meaningful tags for saving the metadata to be selected. In the following, some recurring tags are explained, especially those, that are associated with the linking of the elements of the chain of data management, as explained in Section 1.3. Experiments, simulations, and analyses often require a description of the files in which the results are saved. This is done using the results tag as shown in Listing 2. This is where the YAML syntax comes in handy, since a list of value or a list of key-value pairs can be used instead of a single value. Since the results are stored in files that may require further explanation, we suggest that these files be listed in a list of the specific key-value pairs file: <path> and description: <short description>. Paths can be given either relative or absolute. They may contain wildcards following Python’s glob syntax2, e.g., if all files of one type in a given directory contain the same type of results. Instead of individual files, entire directories may be given if all files in this directory contain the same type of results.
Listing 2. The files in which the results of, e.g., an analysis are stored, are listed and described under the results tag as a list of key: value pairs.
Data 05 00043 i002
Analyses e.g. of experimental data are linked in a similar way to the respective experiments. For this purpose, the sources tag is used. Similarly, the publications are linked to the respective analyses, experiments, and simulations. Listing 3 shows how this looks like for a publication based on several experiments and the analysis based on them.
Listing 3. A publication links to the corresponding experimental results and data analysis using the sources tag. Paths to the sources are given as relative paths.
Data 05 00043 i003
As mentioned above, depending on the metadata requirements, many more tags can be included. An additional tag that has proven useful is the revisionOf tag. For example, if an analysis contains errors and needs to be recreated, the metadata of the new, corrected analysis should be linked to the incorrect analysis using revisionOf.
Listing 4. The analysis in 2020_SpeedOfLight/2020-01-05_average-all-exp-corr corrects the errors made in 2020_SpeedOfLight/2020-01-04_average-all-exp. This is contained in the README.md of the new, corrected analysis using the revisionOf tag.
Data 05 00043 i004
The tags listed above and in the examples in Section 2.2 represent those that we consider the most general and relevant. They can be extended as needed or desired. Note that, with the exception of responsible and description, all tags are optional. Thus, project-specific tags, e.g. those describing the sample in a type of experiment, can be easily integrated. In this way, also persistent identifiers (PIDs) can be intuitively included if required, e.g., if the data is published in a larger repository. In this case, the PID can be added to the metadata file in the form PID: <identifier>.

2.1.5. Remarks on Archiving and Purging Data

At the end of the life cycle of scientific data, they should be archived and then deleted from the working filesystem. This is especially necessary for possible large original data sets from experiments or simulations. However, archiving and purging the original data should not break the links between publications and the corresponding analyses, simulations, and experiments. We therefore recommend that the contents of the entries are deleted after archiving with the exception of the metadata file README.md. A tag archived: <date-of-archiving> must be added to its header. Depending on the details of the archiving, additional information can be specified, such as who archived it and where exactly the data is located in the archive. This ensures that the archived data remains linked to the original projects and publications. If necessary, this makes it easier to retrieve original data from old projects that have already been archived.

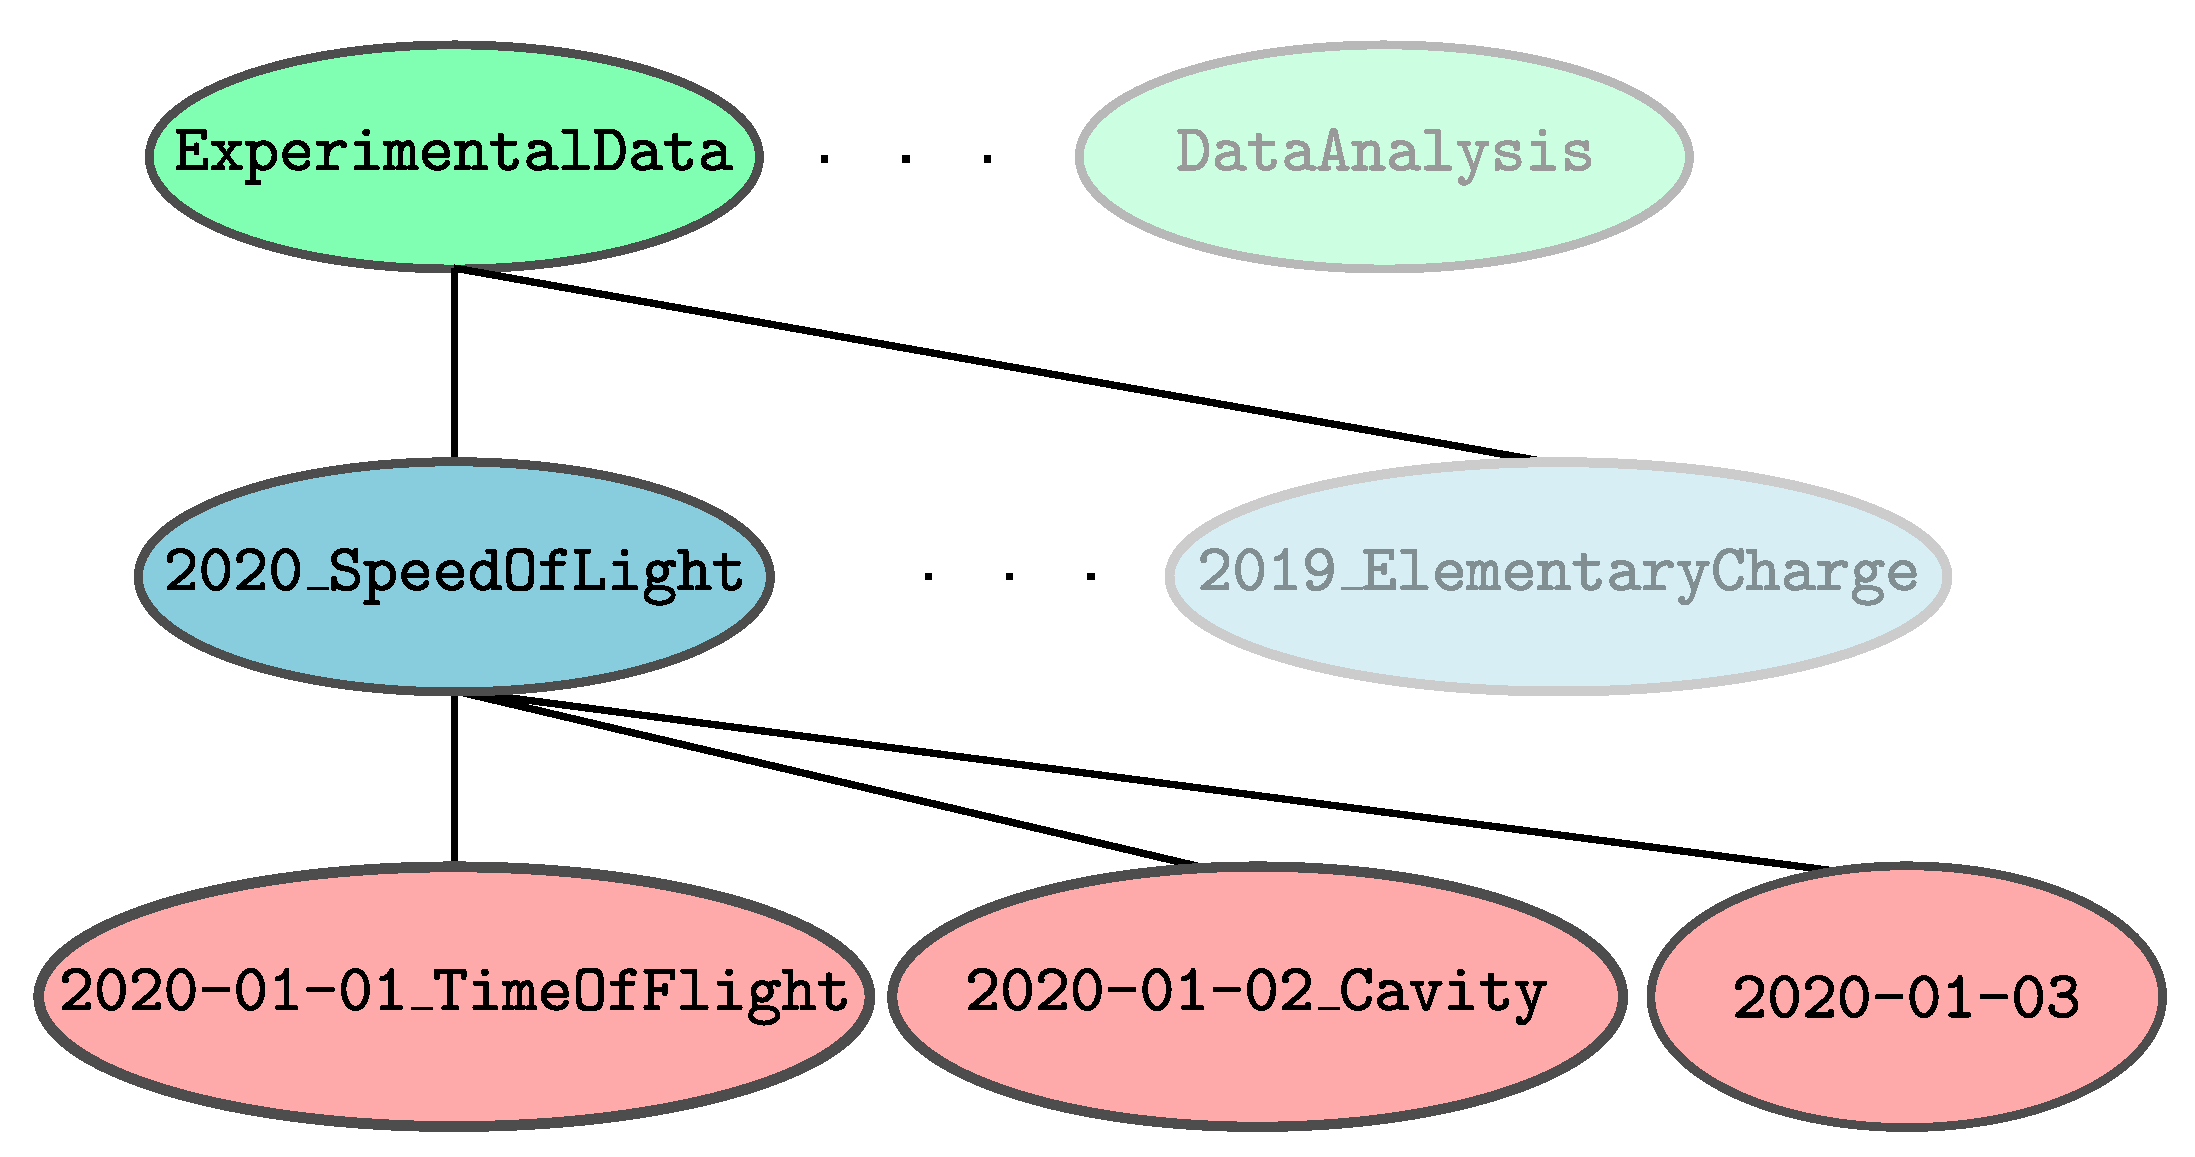
2.2. Example Data Chains

Two examples of publications, a journal article and a conference presentation, will be inspected in more detail below. Both will represent the entire chain of data management; one in a top-down manner, starting with the publication and retrieving the experimental data published therein, the other in a bottom-up manner, i.e., from individual measurements and simulations to the conference talk.

2.2.1. Finding the Experimental Data for a Publication

Suppose AuthorA, AuthorB, and AuthorC published an article about a comparative study of different experimental methods for determining the speed of light in the renowned (fictitious) Journal of Relativity in 2020. To achieve maximum transparency, the experiments whose data actually appeared in the publication as well as the analysis of these experimental data must be linked to the publication itself. According to the structure proposed in Section 2.1.1, the article is stored in Publications/Articles/2020_AuthorA-JourRel. As explained above, the directory name is chosen by date, (first) author, and journal. This directory contains the PDF of the article as well as the metadata in a README.md file. Its content is shown in Listing 5. In addition to the authors as responsible persons and a short description, experimental results and analyses are listed under the sources tag. After the end of the YAML header, i.e., after the closing ..., an additional markdown text can be added for further notes. In Listing 5, a note about a corrected analysis was added.
Listing 5. Contents of the README.md corresponding to the journal article in /Publications/Articles/2020_AuthorA-JourRel. All three authors are listed as responsible persons. Both experimental data and the analysis conducted on them are listed as sources. Note that arbitrary (markdown) text may be added after the end of the YAML header for further notes and remarks.
Data 05 00043 i005
This corrected analysis can be found following the entry under the sources tag. When visiting the metadata file of DataAnalysis/2020_SpeedOfLight/2020-01-05_average-all-exp-corr which is shown in Listing 6, this correction is taken into account by the revisionOf tag. It links to the previous, incorrect analysis that is replaced by the corrected one. Note that the README.md file associated with the analysis links to the same experimental sources as the one belonging to the publication. This redundancy is intended because in this way the experimental data are directly visible from the publication without having to visit the analysis. The results of the analysis and the scripts containing the analysis are further described using the file and description tags as explained in Section 2.1.4.
Listing 6. The YAML header containing metadata of the analysis stored in 2020_SpeedOfLight/2020-01-05_average-all-exp-corr. Note the quotation marks in line 13 required by YAML for values starting with a wildcard character.
Data 05 00043 i006
The analysis links to the original experimental data on which it was conducted. The content of the metadata file of one of these experiments, contained in ExperimentalData/2020_SpeedOfLight/2020-01-03, is shown in Listing 7. Depending on the setup, the contents could be extended by, e.g., details of the instruments used in the experiment or of the environmental conditions during the measurement.
Listing 7. The YAML header of the metadata file of the experimental data stored in 2020_SpeedOfLight/2020-01-03.
Data 05 00043 i007

2.2.2. From Data Generation to a Conference Talk

Suppose that a new numerical climate model is created in a new project to predict the annual mean temperatures. This climate model uses historical climate data from 1980 to 2010 as training data. From this training set, the temperatures from 2010 to 2019 are predicted. Its accuracy is tested by comparing these predictions to actual measured data from the same years. This project therefore contains experiments (the measured climate data from 1980 to 2019), simulations (the predictions by the new climate model), and analysis (comparison of prediction and measurements for the years 2010 to 2019). Before data can be stored, a name for the project directory in all three categories must be defined. According to the above convention, the name 2020_climate-model-predict is chosen. It starts with the year of the project start followed by a descriptor for its topic.
AuthorD is responsible for obtaining the historical temperature data provided by the service weatherdata.example. The data are stored in ExperimentalData3 in separate directories for each decade. As explained in Section 2.1.2, it is not immediately clear how to define the date for a measurement covering a decade. As proposed above, the starting date, i.e. 1980-01-01 for temperatures from 1980-1989, is used in the following. Another reasonable option would be to use the date on which the data were obtained instead. Since the historical temperatures are the only project-related measurements, the date is a sufficient directory name for each single entry, so data from the 80ies are stored in ExperimentalData/2020_climate-model-predict/1980-01-01 and so on. The annual average temperatures for different measurement stations are contained in separate files together with their respective geographical locations. This information is condensed into the metadata file shown in Listing 8, again in the example of the data from 1980 to 1989. Together with AuthorD as the person responsible for transferring the data and a short description, the file contains the description of the individual files for each year using a wildcard expression.
Listing 8. Example metadata file of the temperature data stored in ExperimentalData/2020_climate-model-predict/1980-01-01.
Data 05 00043 i008
The temperature data from 1980 to 2009 are then used as training data for a new predictive climate model. The model parameters resulting from the fit to the training data are stored in SimulationData/2020_climate-model-predict/2020-02-01. Again, only the date is used as directory name at the entry level. The training data are listed under the sources tag in the metadata file as in Listing 9. The model parameters obtained by the fit are then used to predict the temperature development in the years 2010 to 2019. The predictions are stored in the same directory as well as the python code used for the fit and the prediction.
Listing 9. YAML header of the metadata file of the temperature predictions stored in SimulationData/2020_climate-model-predict/2020-02-01. Here, the sources tag is used to denote the training data used to find the optimal model parameters. Note that instead of a single line, a YAML multiline block indicated by the greater-than sign > is used for the description in lines 4 to 7.
Data 05 00043 i009
In a subsequent analysis, the model predictions are compared with the measured data. The prediction error is determined by calculating absolute and relative differences between measurements and predictions. The metadata file of this analysis is shown in Listing 10 and references both the simulation and the measurement as sources. The results are displayed graphically and saved in the same directory.
Listing 10. Contents of the metadata file of the analysis comparing the predictions of the new climate model to the measured temperatures of the years 2010 to 2019. Measurements and simulation results are both listed as sources. It is stored in DataAnalysis/2020_climate-model-predict/2020-02-08_prediction-errors.
Data 05 00043 i010
The new model will be presented together with the analysis of the prediction errors by AuthorD as a conference paper at the (fictitious) Climate Modeling Conference 2020 in Berlin. The presentation slides of this presentation are therefore stored in Publications/Presentations/2020-03-01_AuthorD_climate-model-conf together with their metadata, which are shown in Listing 11. They link the presentation to the training and test data as well as to the simulations and analysis that compares predictions and measurements.
Listing 11. The slides of the conference talk presenting the new climate model and its performance are stored in Publications/Presentations/2020-03-01_AuthorD_climate-model-conf. All measurements, simulations and analysis including the training data are listed in the metadata file.
Data 05 00043 i011

3. Discussion

The filesystem layout presented here is implemented in the Research Group Biomedical Physics at the Max Planck Institute for Dynamics and Self-Organization in Göttingen. Currently, 10 experimental project folders, 17 folders for data analysis, 49 folders with publications and 15 project folders containing simulation data are stored according to this specification. These include numerical studies of dynamical systems as well as biomedical experiments. Many more data sets are in a transition phase from previous heterogeneous structures. In our workgroup, we employ the RDMS CaosDB [8]. The CaosDB crawler is able to index all data which complies with the proposed filesystem layout. CaosDB provides a high-level interface to the data and allows for manual or automatic semantic queries.
The approach presented here is not intended to cover any detail of possible data structures. It is rather intended to be a first step towards a standardized data structure that can be extended in many ways. In our experience, this first step already provides a great advantage in terms of findability and is most likely compatible with more sophisticated data management solutions.
It has also proven to be a valuable workflow to introduce new users within the workgroup directly to this data structure. In many cases, they have not yet decided on a fixed file naming scheme, so that they can adopt the approach presented here directly.
To make the transition to this standardized file structure smoother, we have created an open source validation tool (see Appendix A). This program is written in Python and can be executed on a file tree. The program checks whether the structure contained in this tree complies with this file structure definition and issues detailed notes in case of deviations. To make it easier to use, we plan to extend this tool in the future with a graphical user interface, that also allows the transfer and conversion of existing data into this structure.

Author Contributions

Conceptualization, F.S., B.R., J.L. and A.S.; software, J.L. and A.S.; writing—original draft preparation, F.S. and A.S.; writing—review and editing, F.S., B.R., J.L., S.L., U.P. and A.S.; supervision, F.S. and A.S.; project administration, S.L., U.P. and A.S.; funding acquisition, S.L. and U.P. All authors have read and agreed to the published version of the manuscript.

Funding

We acknowledge support from the German Federal Ministry of Education and Research (BMBF) (project FKZ 031A147, GO-Bio), the German Research Foundation (DFG) (Collaborative Research Centers SFB 1002 Project C03) and the German Center for Cardiovascular Research (DZHK e.V.).

Acknowledgments

We thank all members of the Research Group Biomedical Physics for their support in the design and implementation of this file structure.

Conflicts of Interest

A.S. is co-founder of IndiScale GmbH, a company providing commercial services for CaosDB (mentioned in the discussion and in Appendix A). IndiScale GmbH was neither involved in the design of the study, nor in the collection, analysis or interpretation of the data, nor in the writing of the manuscript or the decision to publish the results.

Abbreviations

The following abbreviations are used in this manuscript:
RDMSResearch Data Management System
YAMLYAML ain’t markup language
mdMarkdown
FAIRFindable, Accessible, Interoperable and Reusable
PIDPersistent identifier

Appendix A. Supporting Software

There are currently two software projects which make use of the file structure proposed here:
  • CaosDB [8] is an Open Source scientific research data management system that uses automated crawling for inserting data. The CaosDB standard crawler is able to insert and update data based on this specification.
  • Check SFS is a collection of software tools for creating and checking file structures according to this specification. It is released as Open Source software here: https://gitlab.com/salexan/check-sfs.

References

  1. Gorgolewski, K.J.; Auer, T.; Calhoun, V.D.; Craddock, R.C.; Das, S.; Duff, E.P.; Flandin, G.; Ghosh, S.S.; Glatard, T.; Halchenko, Y.O.; et al. The brain imaging data structure, a format for organizing and describing outputs of neuroimaging experiments. Sci. Data 2016, 3, 1–9. [Google Scholar] [CrossRef] [PubMed]
  2. Sansone, S.A.; Rocca-Serra, P.; Field, D.; Maguire, E.; Taylor, C.; Hofmann, O.; Fang, H.; Neumann, S.; Tong, W.; Amaral-Zettler, L.; et al. Toward interoperable bioscience data. Nat. Genet. 2012, 44, 121. [Google Scholar] [CrossRef] [PubMed]
  3. Ma, X.; Fox, P.; Tilmes, C.; Jacobs, K.; Waple, A. Capturing provenance of global change information. Nat. Clima. Chang. 2014, 4, 409–413. [Google Scholar] [CrossRef]
  4. Diepenbroek, M.; Grobe, H.; Reinke, M.; Schindler, U.; Schlitzer, R.; Sieger, R.; Wefer, G. PANGAEA—An information system for environmental sciences. Comput. Geosci. 2002, 28, 1201–1210. [Google Scholar] [CrossRef] [Green Version]
  5. Wilkinson, M.D.; Dumontier, M.; Aalbersberg, I.J.; Appleton, G.; Axton, M.; Baak, A.; Blomberg, N.; Boiten, J.W.; da Silva Santos, L.B.; Bourne, P.E.; et al. The FAIR Guiding Principles for scientific data management and stewardship. Sci. Data 2016, 3, 160018. [Google Scholar] [CrossRef] [PubMed] [Green Version]
  6. Dominici, M. An overview of Pandoc. TUGboat 2014, 35, 44–50. [Google Scholar]
  7. Ben-Kiki, O.; Evans, C.; döt Net, I. YAML Ain’t Markup Language (YAML™) Version 1.2, 3rd ed. 2009. Available online: https://yaml.org/spec/1.2/spec.html (accessed on 23 April 2020).
  8. Fitschen, T.; Schlemmer, A.; Hornung, D.; tom Wörden, H.; Parlitz, U.; Luther, S. CaosDB—Research Data Management for Complex, Changing, and Automated Research Workflows. Data 2019, 4. [Google Scholar] [CrossRef] [Green Version]
1
2
3
As explained in Section 2.1.3, such data are not experimental data in a strict sense but rather observations or measurements. For reasons of simplicity we are using ExperimetalData here. The category could of course be renamed if desired.
Figure 1. The example project 2020_SpeedOfLight contains data from three different experiments each of which is identified by date and the experimental method used to determine the speed of light.
Data 05 00043 g001
Table 1. The two levels of the file structure for each category together with suggested names in the filesystem. Round brackets in the suggested names denote optional parts.
CategoryExperimentsSimulationsData analysisPublications
ExperimentalDataSimulationDataDataAnalysisPublications
ProjectDescriptive project names (possibly with starting year of the project) but sufficiently general such that individual experiments, analyses, ... belong to one single project.Publications include articles, conference talks, posters, ...
(yyyy_)projectnamepublicationtype
EntriesSpecific containers with actual results of experiment, simulation, analysis. Have to contain metadata, otherwise no restrictions on substructure.Individual publications with date and title.
yyyy-mm-dd(_descriptor)yyyy(-mm-dd)_title

