Changes in the Building Stock of Da Nang between 2015 and 2017

 ,
, 
 , and
, and 
Abstract
1. Summary
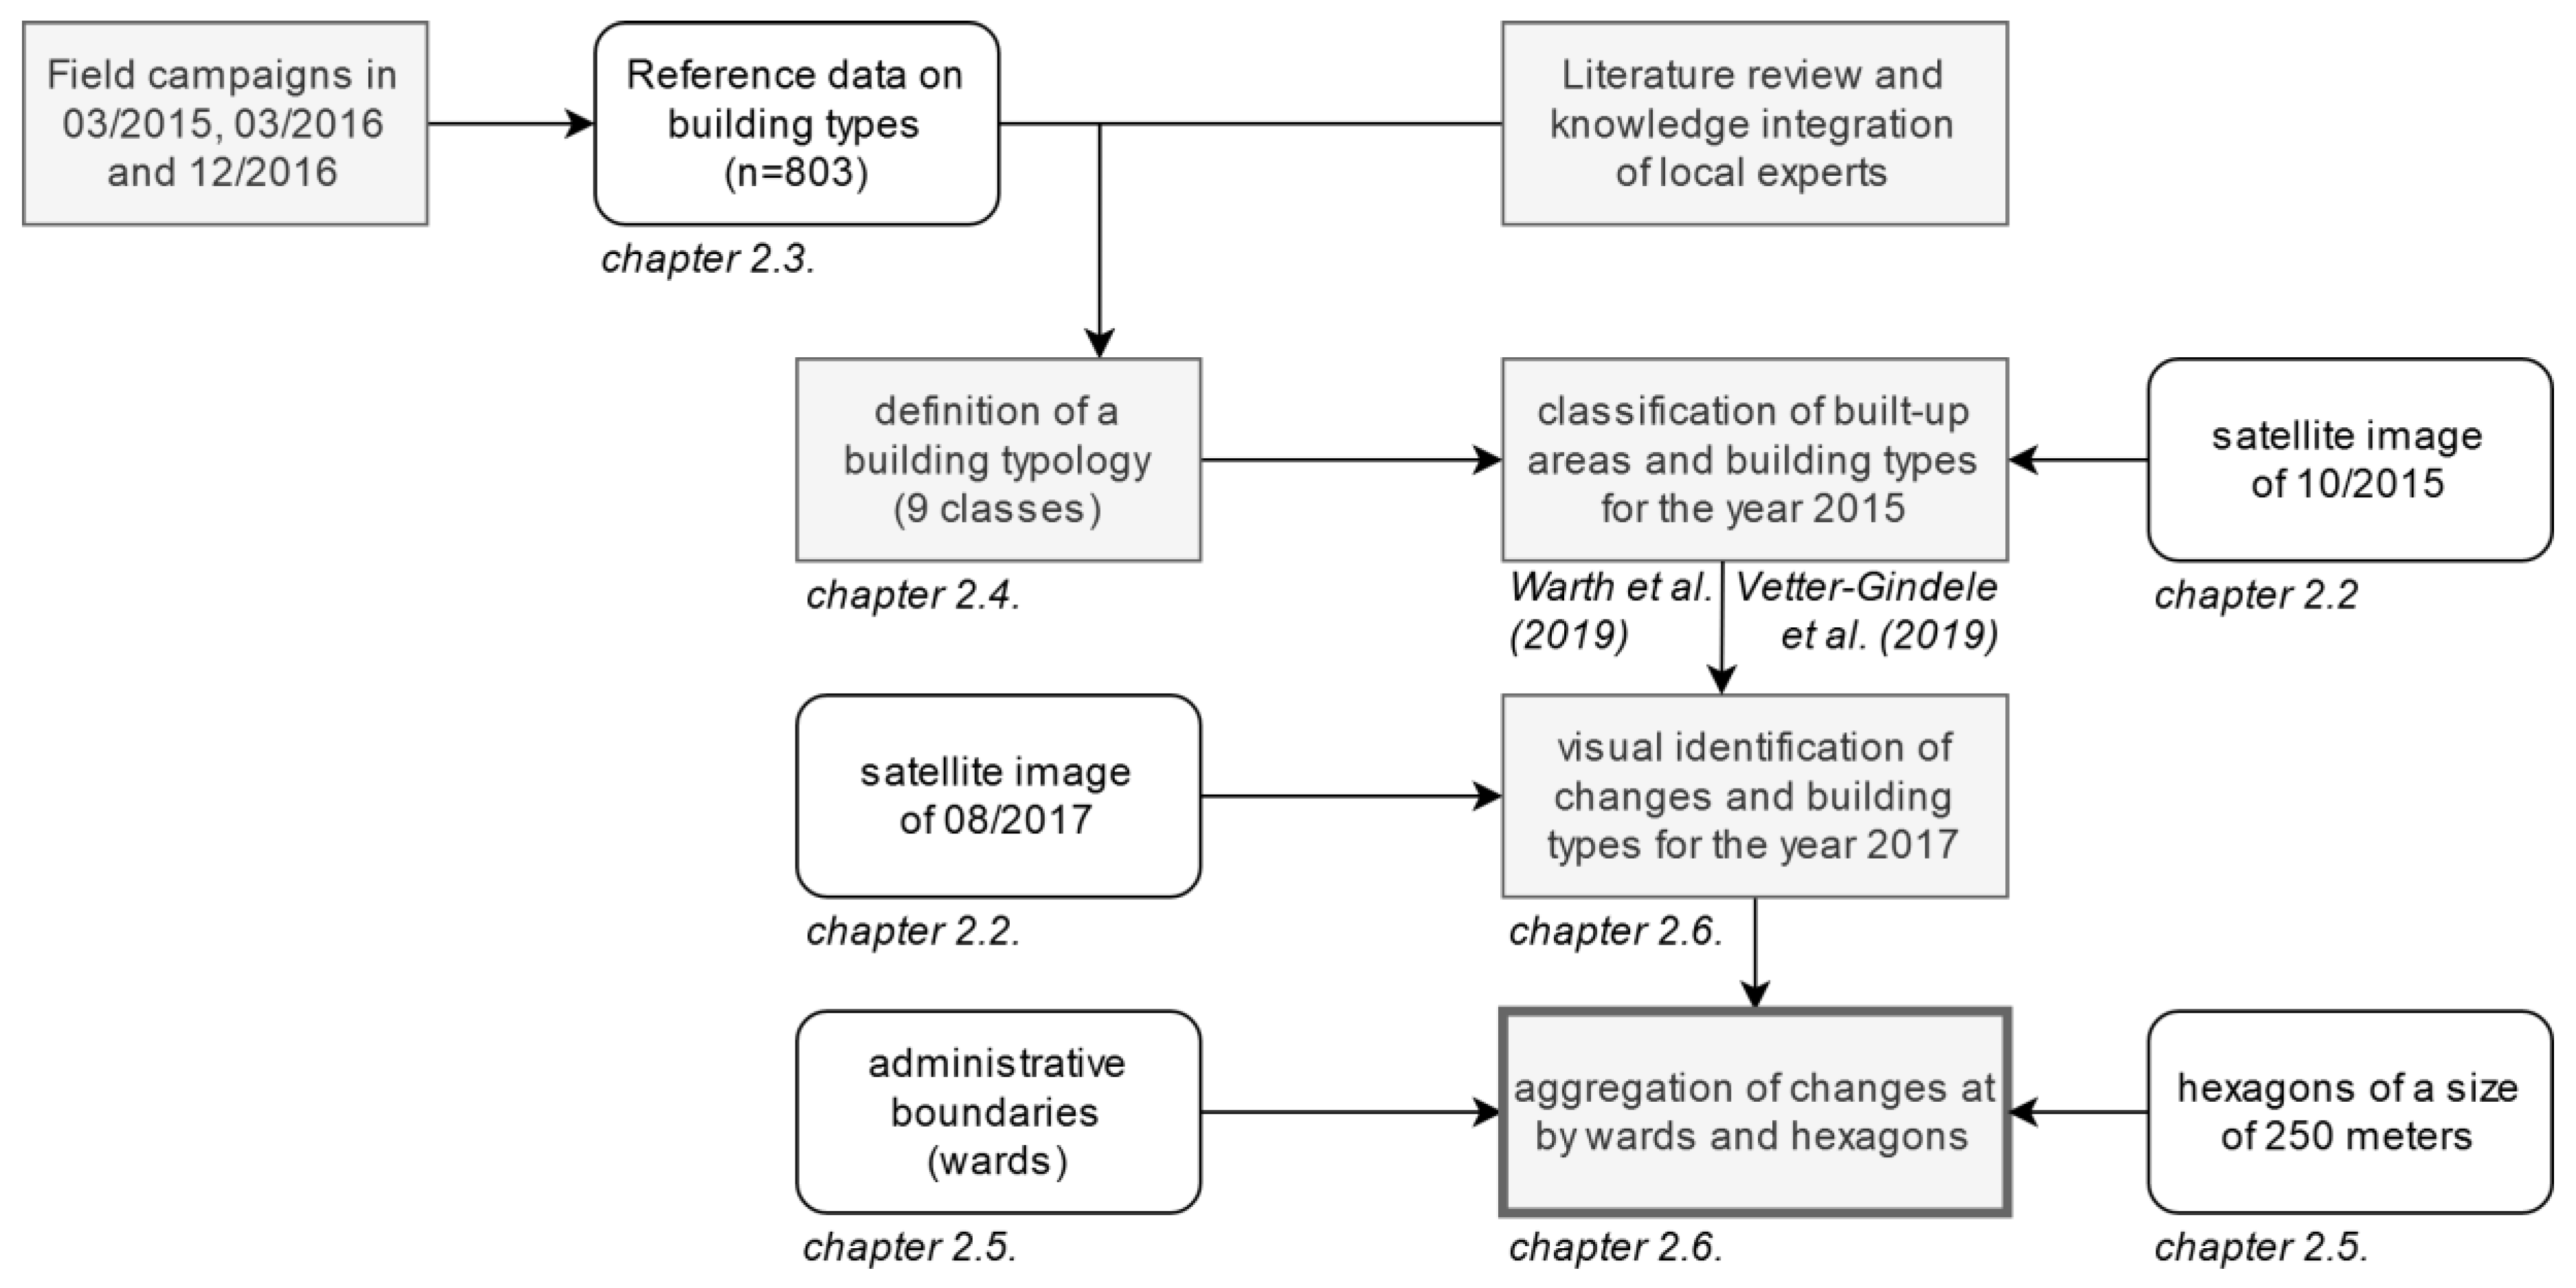
2. Methods
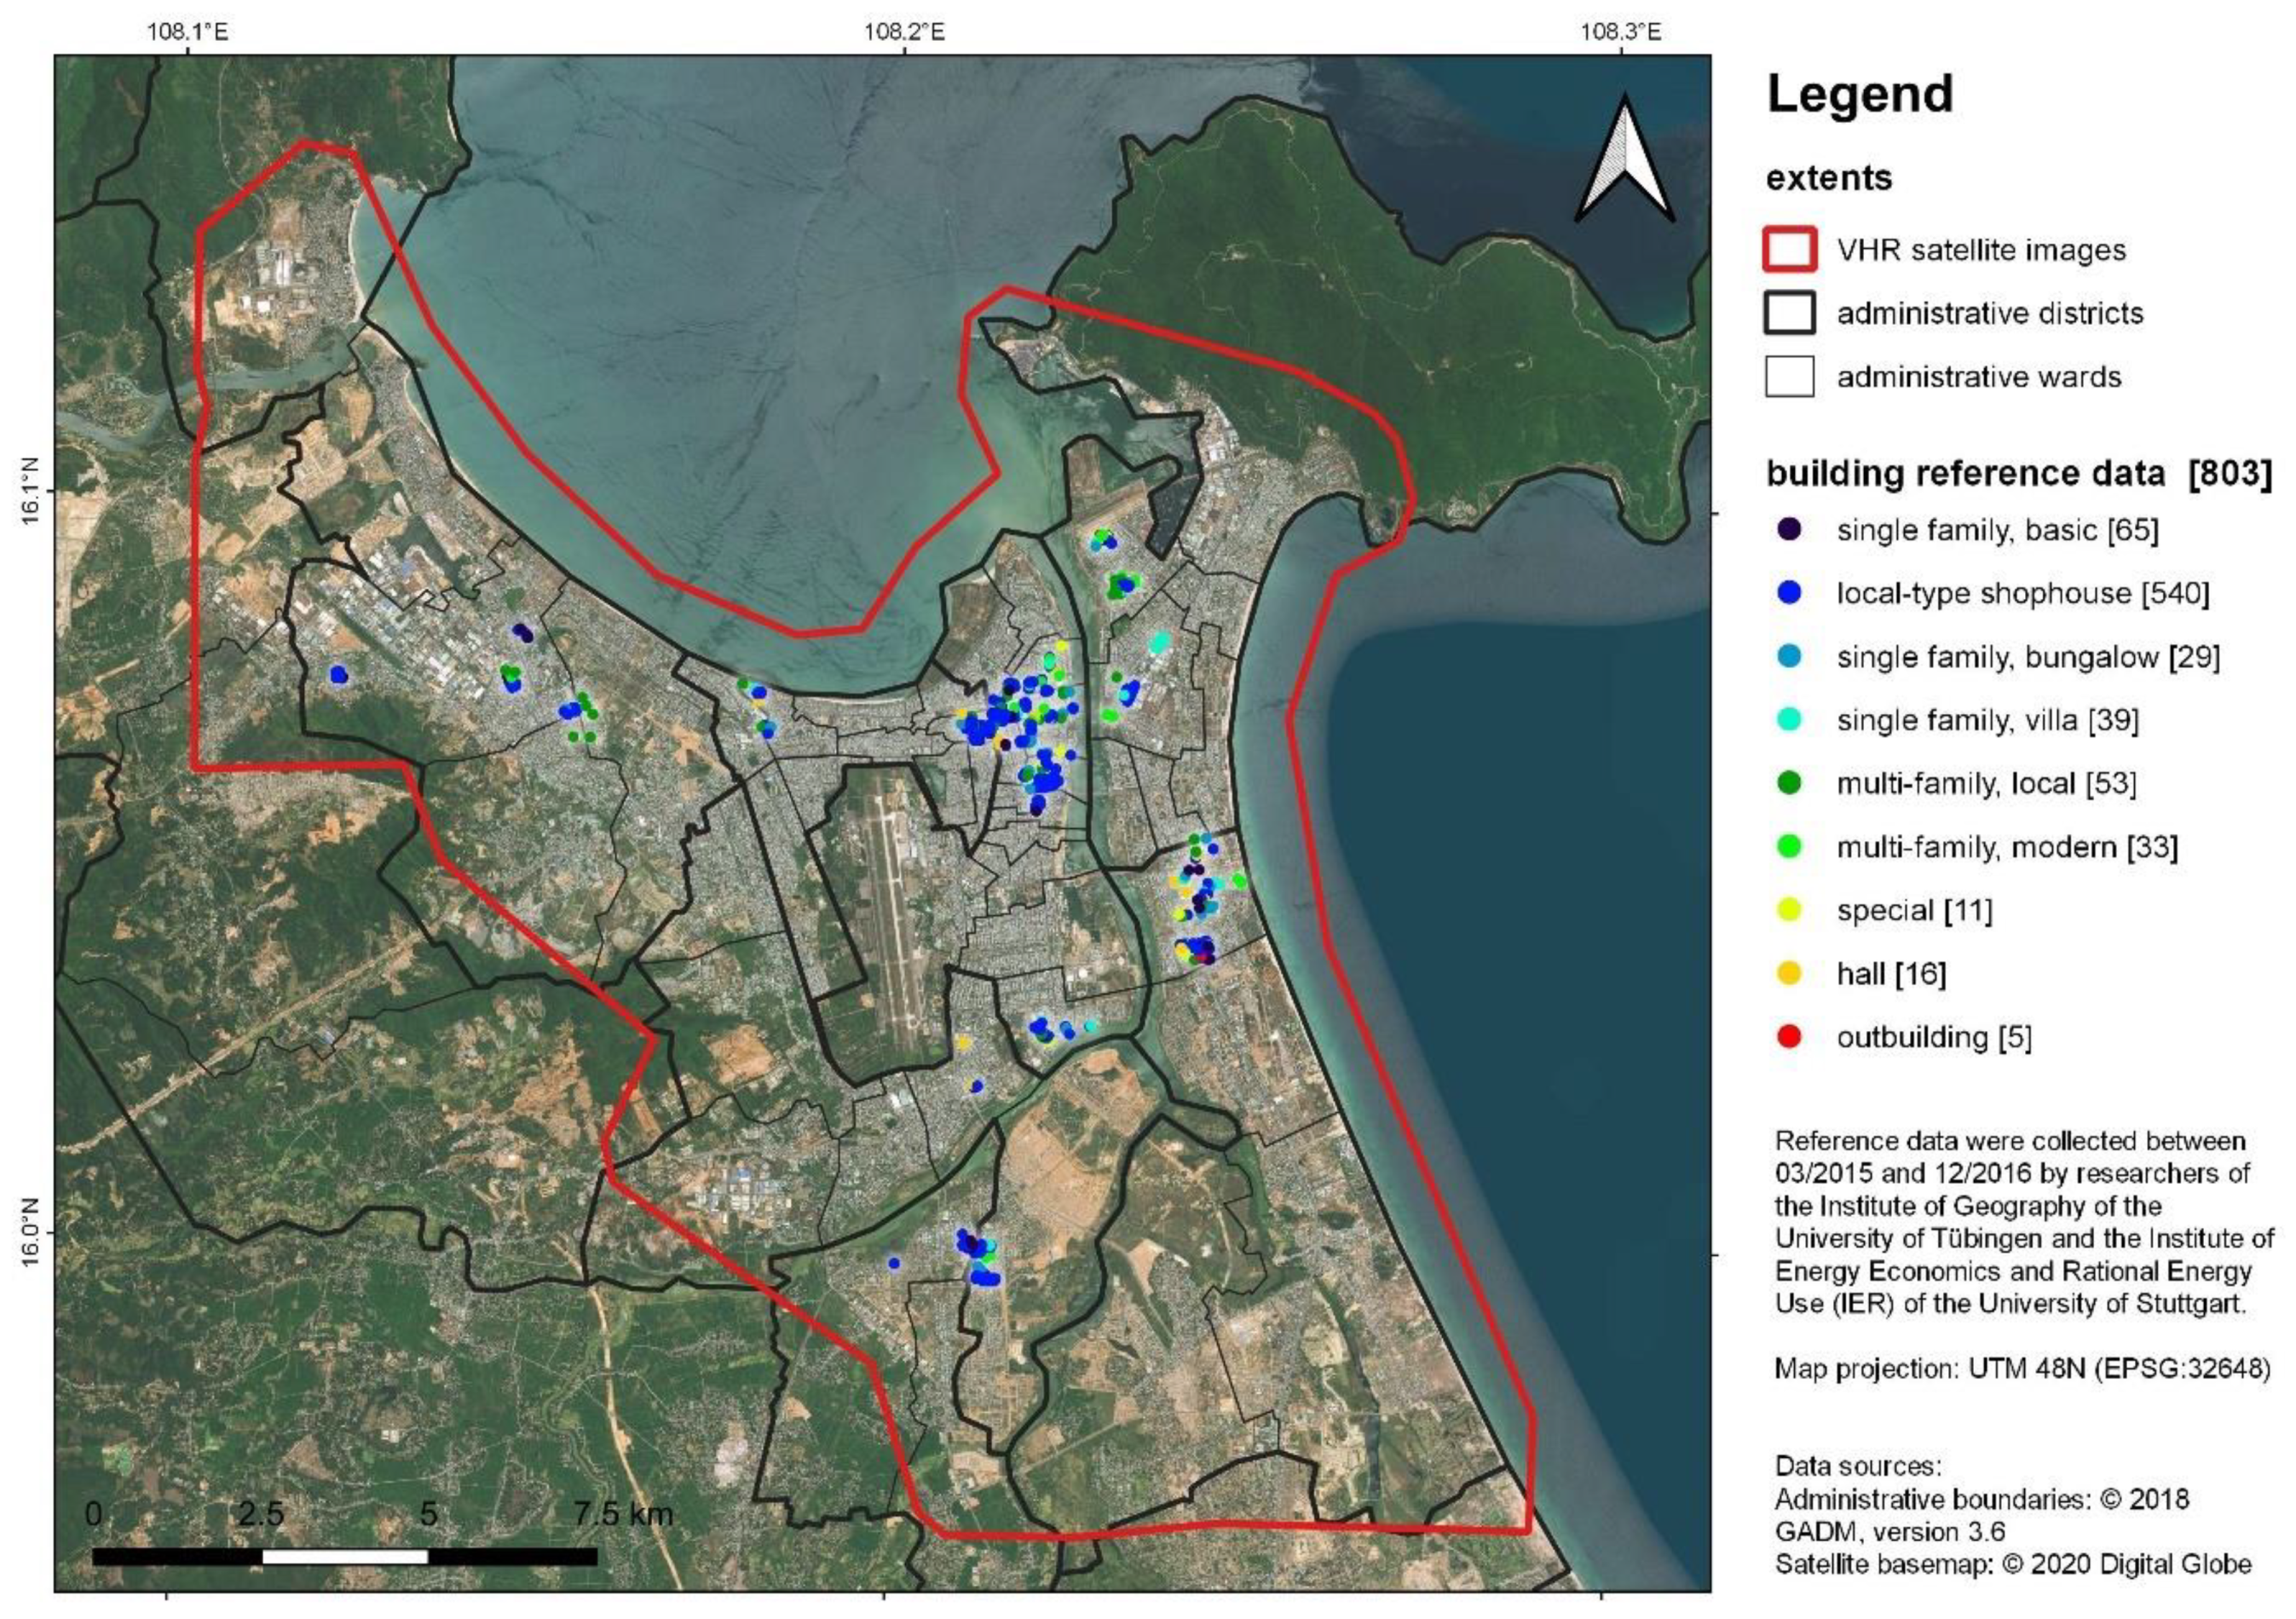
2.1. Study Area
2.2. Satellite Data
2.3. Reference Data
2.4. Building Typology
2.5. External Data
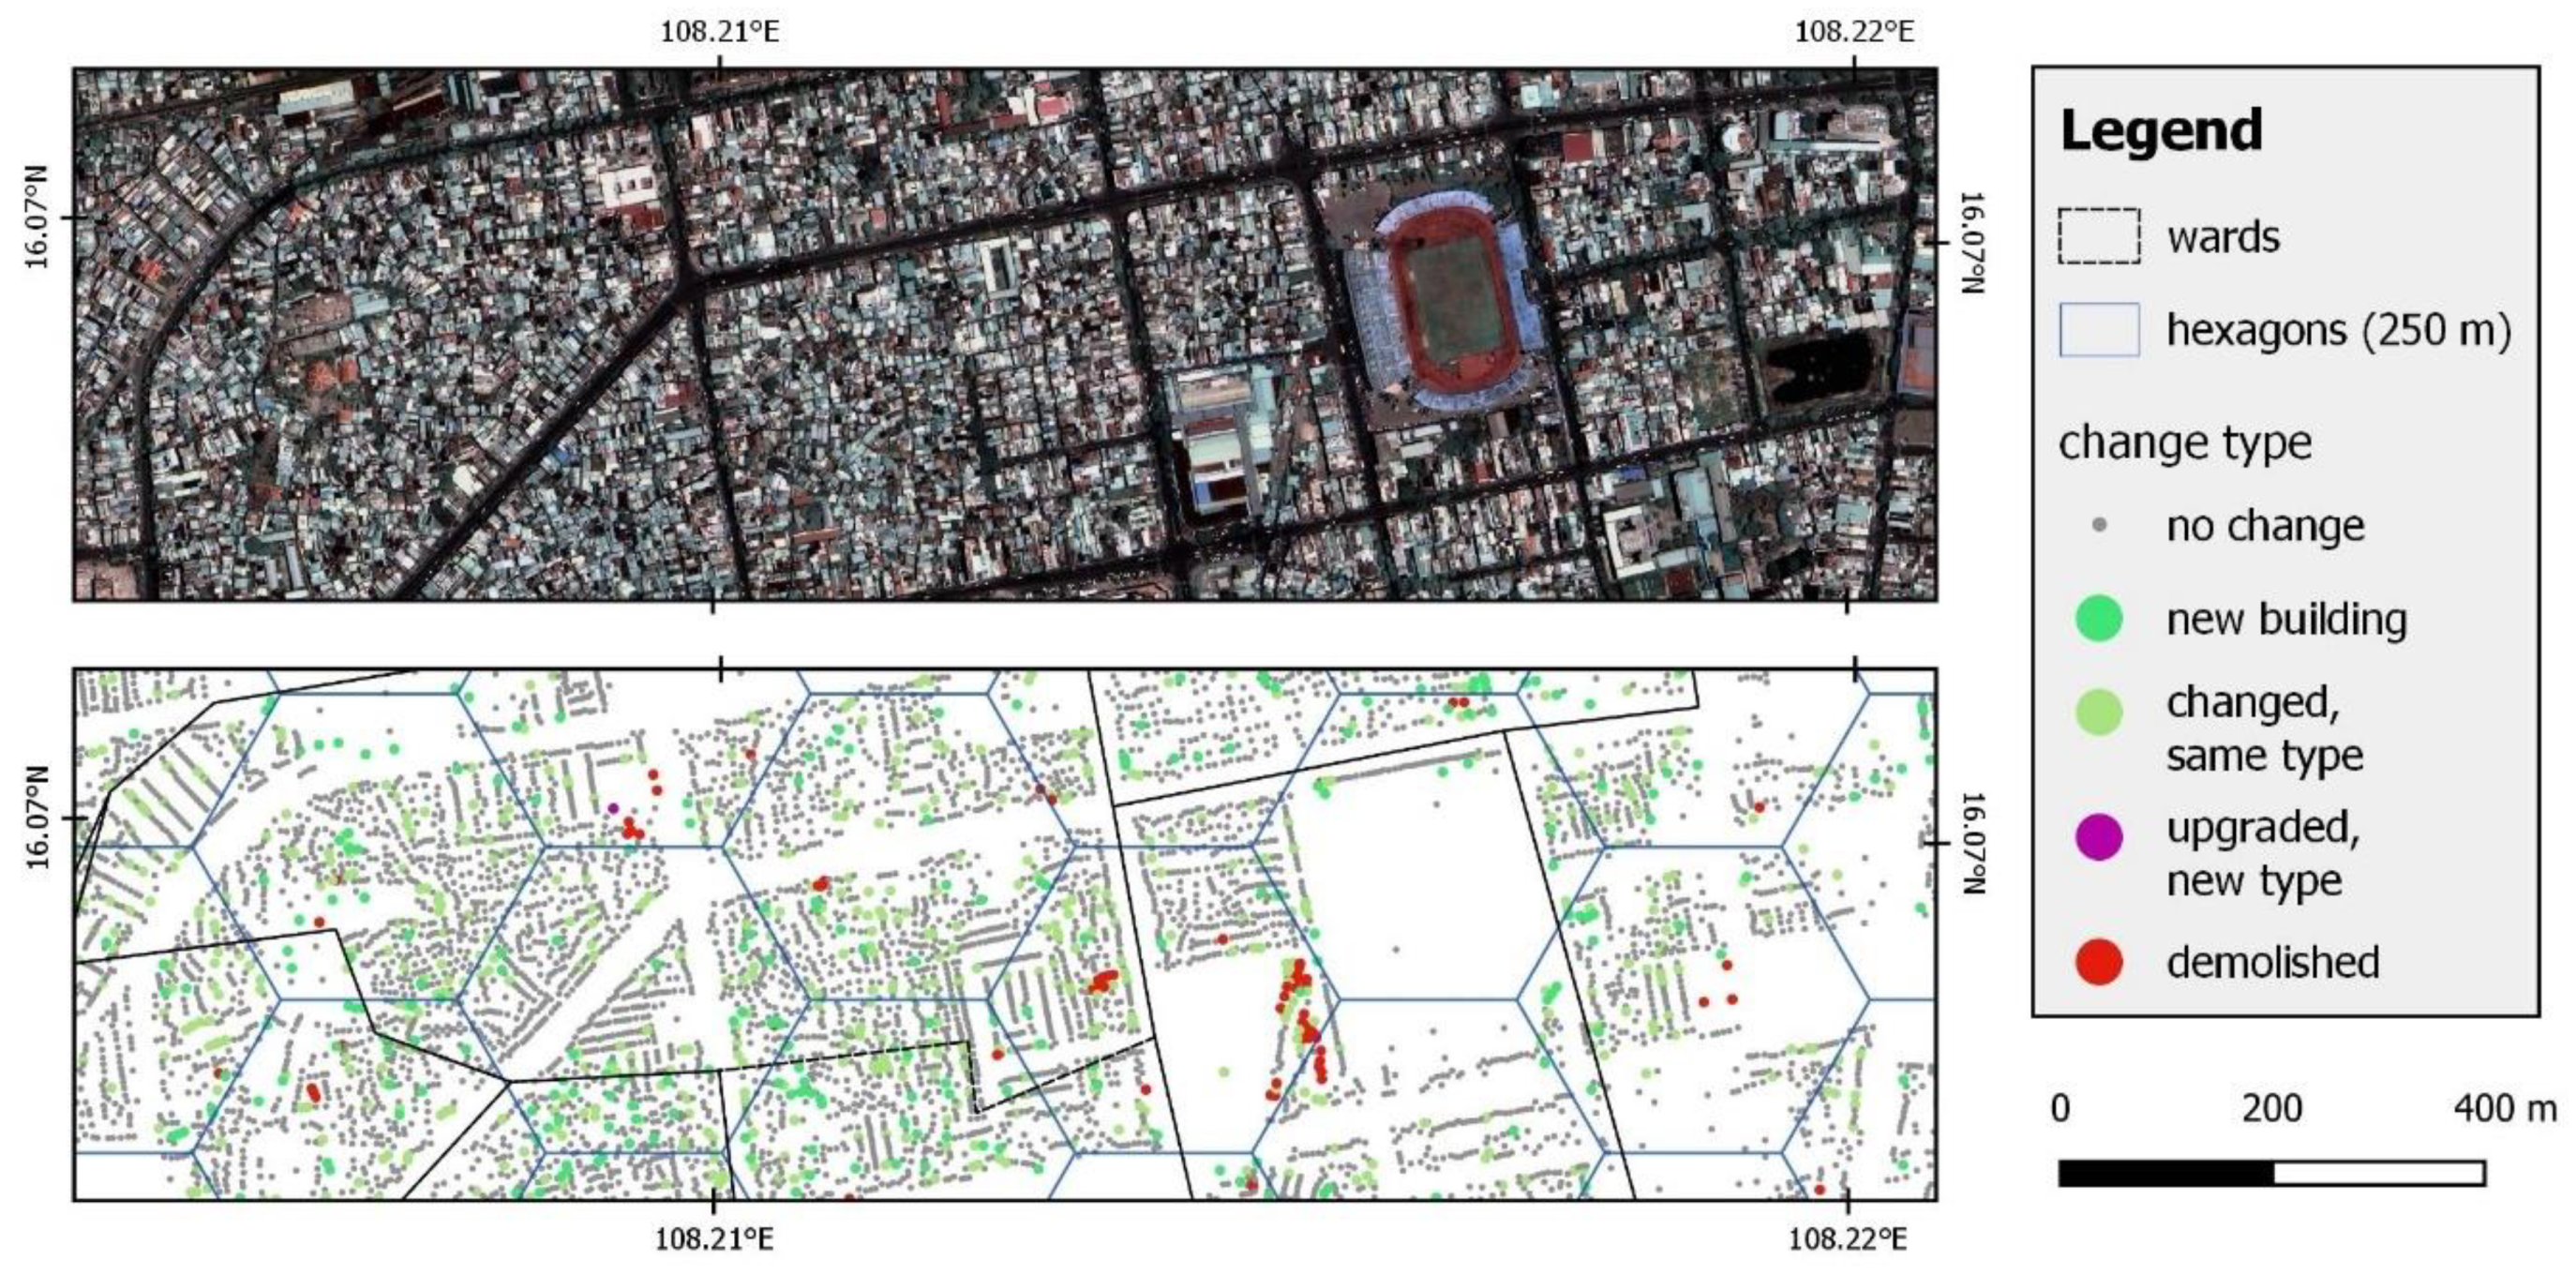
2.6. Data Processing and Change Detection
3. Data Description
3.1. Datatype
3.2. Data Structure
3.3. Administrative Level
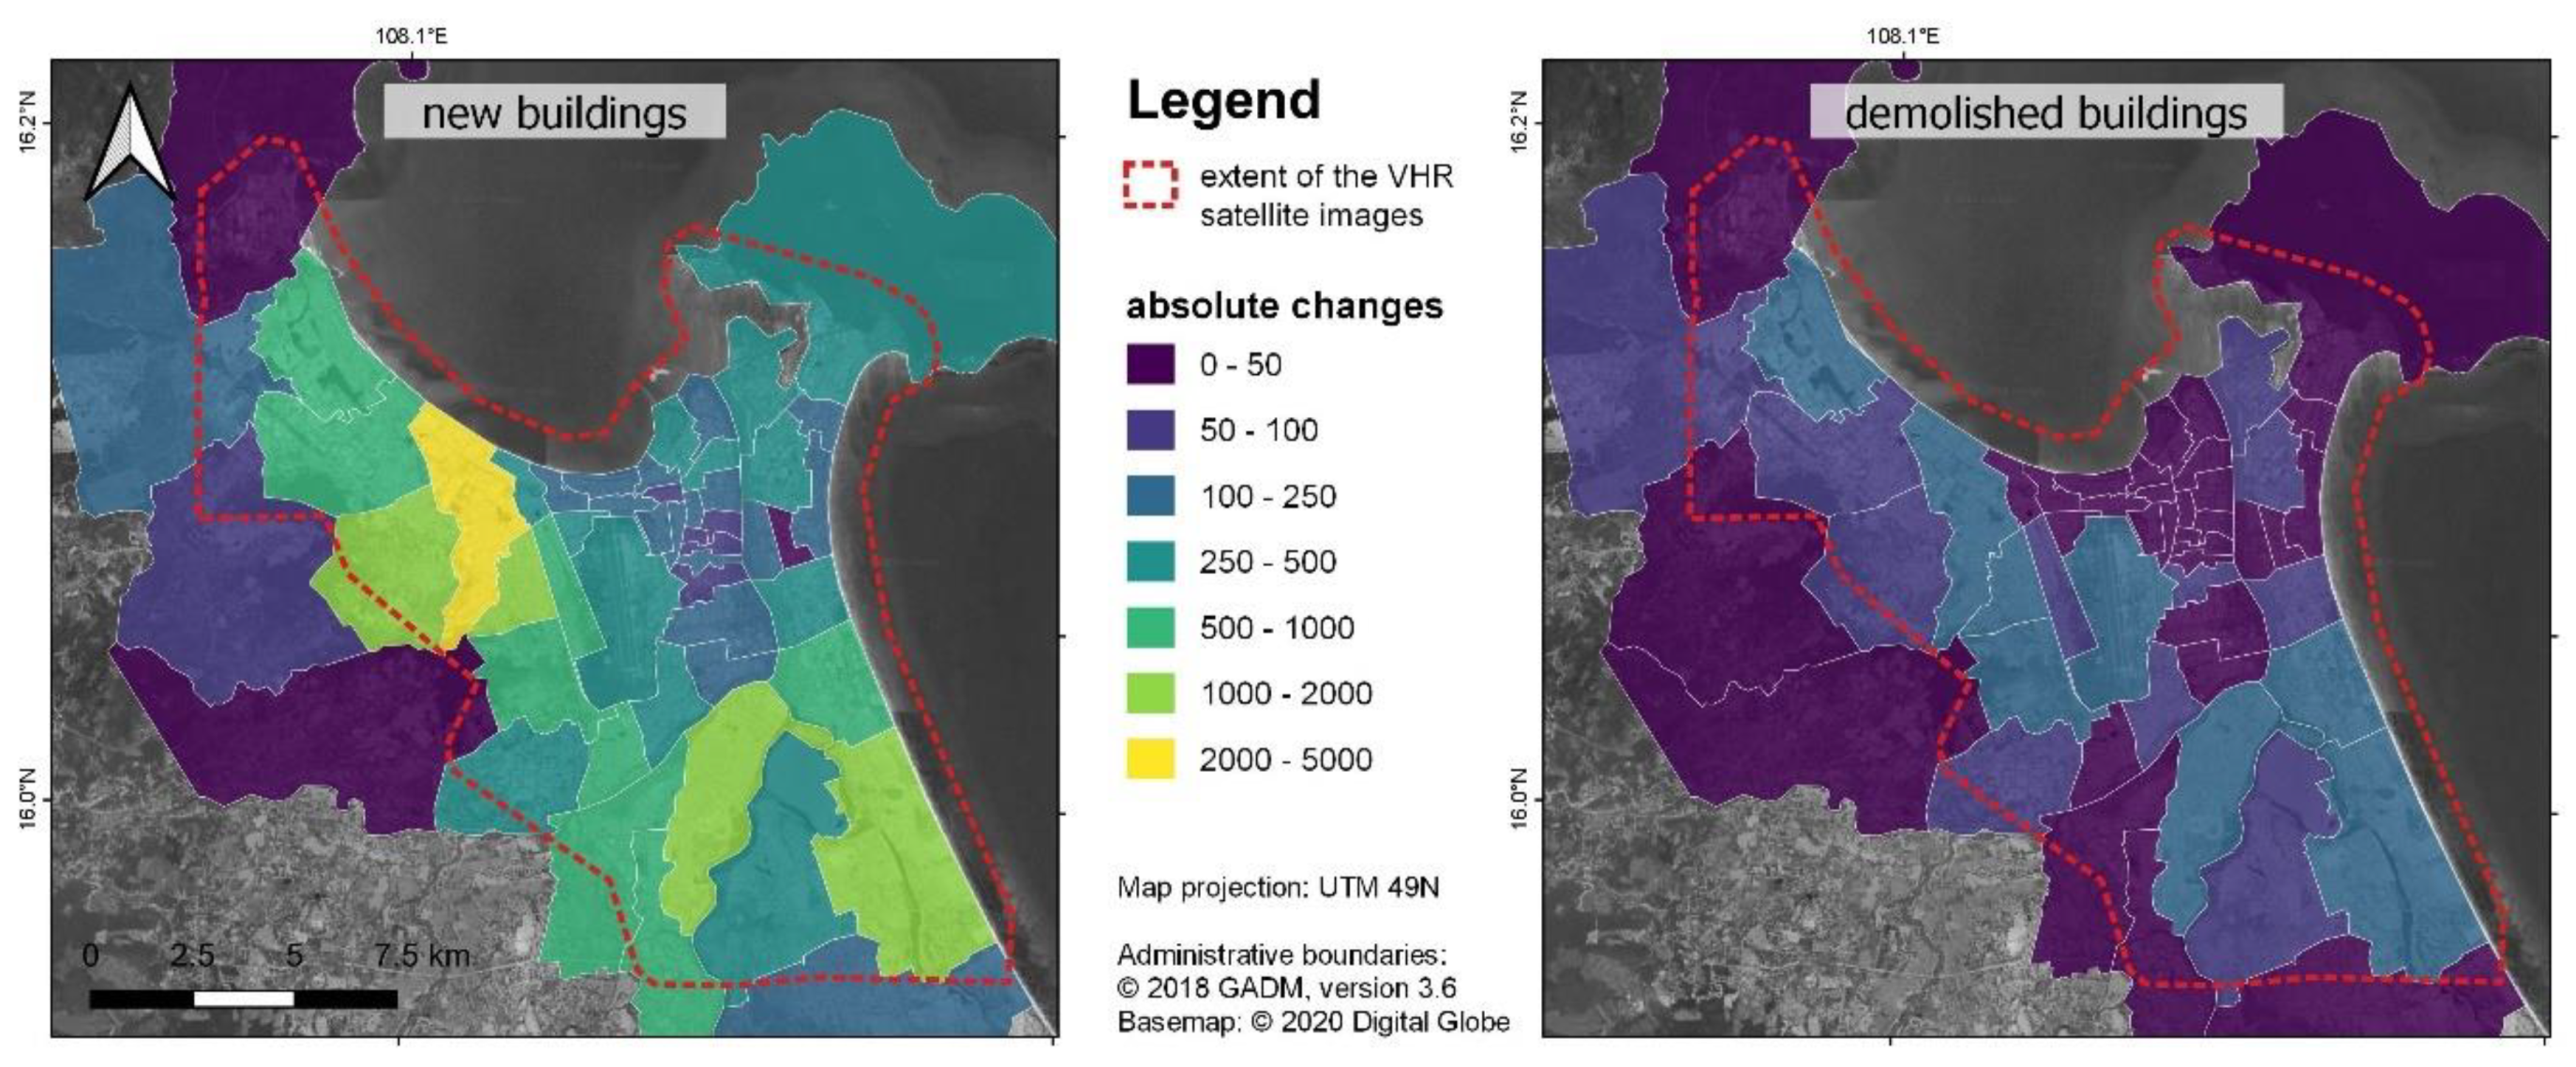
3.4. Spatial Aggregation
3.5. Statistical Description
3.6. Discussions on Data Quality
Supplementary Materials
Author Contributions
Funding
Acknowledgments
Conflicts of Interest
Appendix A. Accuracy Assessment for the Building Dataset of 2015

| Reference Data | ||||||||||||
|---|---|---|---|---|---|---|---|---|---|---|---|---|
| BT1 | BT2 | BT3 | BT4 | BT5 | BT6 | BT7 | BT8 | BT9 | Sum | UA | ||
| Classification | BT1 | 57 | 10 | 0 | 0 | 0 | 0 | 0 | 0 | 3 | 70 | 81.4% |
| BT2 | 3 | 519 | 3 | 3 | 0 | 0 | 2 | 0 | 1 | 531 | 97.7% | |
| BT3 | 2 | 6 | 21 | 5 | 0 | 0 | 0 | 0 | 0 | 34 | 61.8% | |
| BT4 | 0 | 0 | 4 | 28 | 1 | 0 | 0 | 0 | 0 | 33 | 84.8% | |
| BT5 | 0 | 0 | 2 | 48 | 6 | 0 | 3 | 0 | 59 | 81.4% | ||
| BT6 | 0 | 0 | 0 | 0 | 4 | 27 | 0 | 2 | 0 | 33 | 81.8% | |
| BT7 | 0 | 0 | 0 | 0 | 0 | 0 | 6 | 0 | 0 | 6 | 100.0% | |
| BT8 | 0 | 0 | 0 | 1 | 0 | 0 | 2 | 12 | 0 | 15 | 80.0% | |
| BT9 | 3 | 5 | 1 | 0 | 0 | 0 | 1 | 0 | 12 | 22 | 54.5% | |
| sum | 65 | 540 | 29 | 39 | 53 | 33 | 11 | 17 | 16 | 803 | ||
| PA | 87.7% | 96.1% | 72.4% | 71.8% | 90.6% | 81.8% | 54.5% | 70.6% | 75.0% | 90.9% | ||
Appendix B. Additional Maps


References
- Zhang, B.-G. Application of remote sensing technology to population estimation. Chin. Geogr. Sci. 2003, 13, 267–271. [Google Scholar] [CrossRef]
- Xie, Y.; Weng, A.; Weng, Q. Population estimation of urban residential communities using remotely sensed morphologic data. IEEE Geosci. Remote Sens. Lett. 2015, 12, 1111–1115. [Google Scholar]
- Vetter-Gindele, J.; Braun, A.; Warth, G.; Bui, T.T.Q.; Bachofer, F.; Eltrop, L. Assessment of Household Solid Waste Generation and Composition by Building Type in Da Nang, Vietnam. Resources 2019, 8, 171. [Google Scholar] [CrossRef]
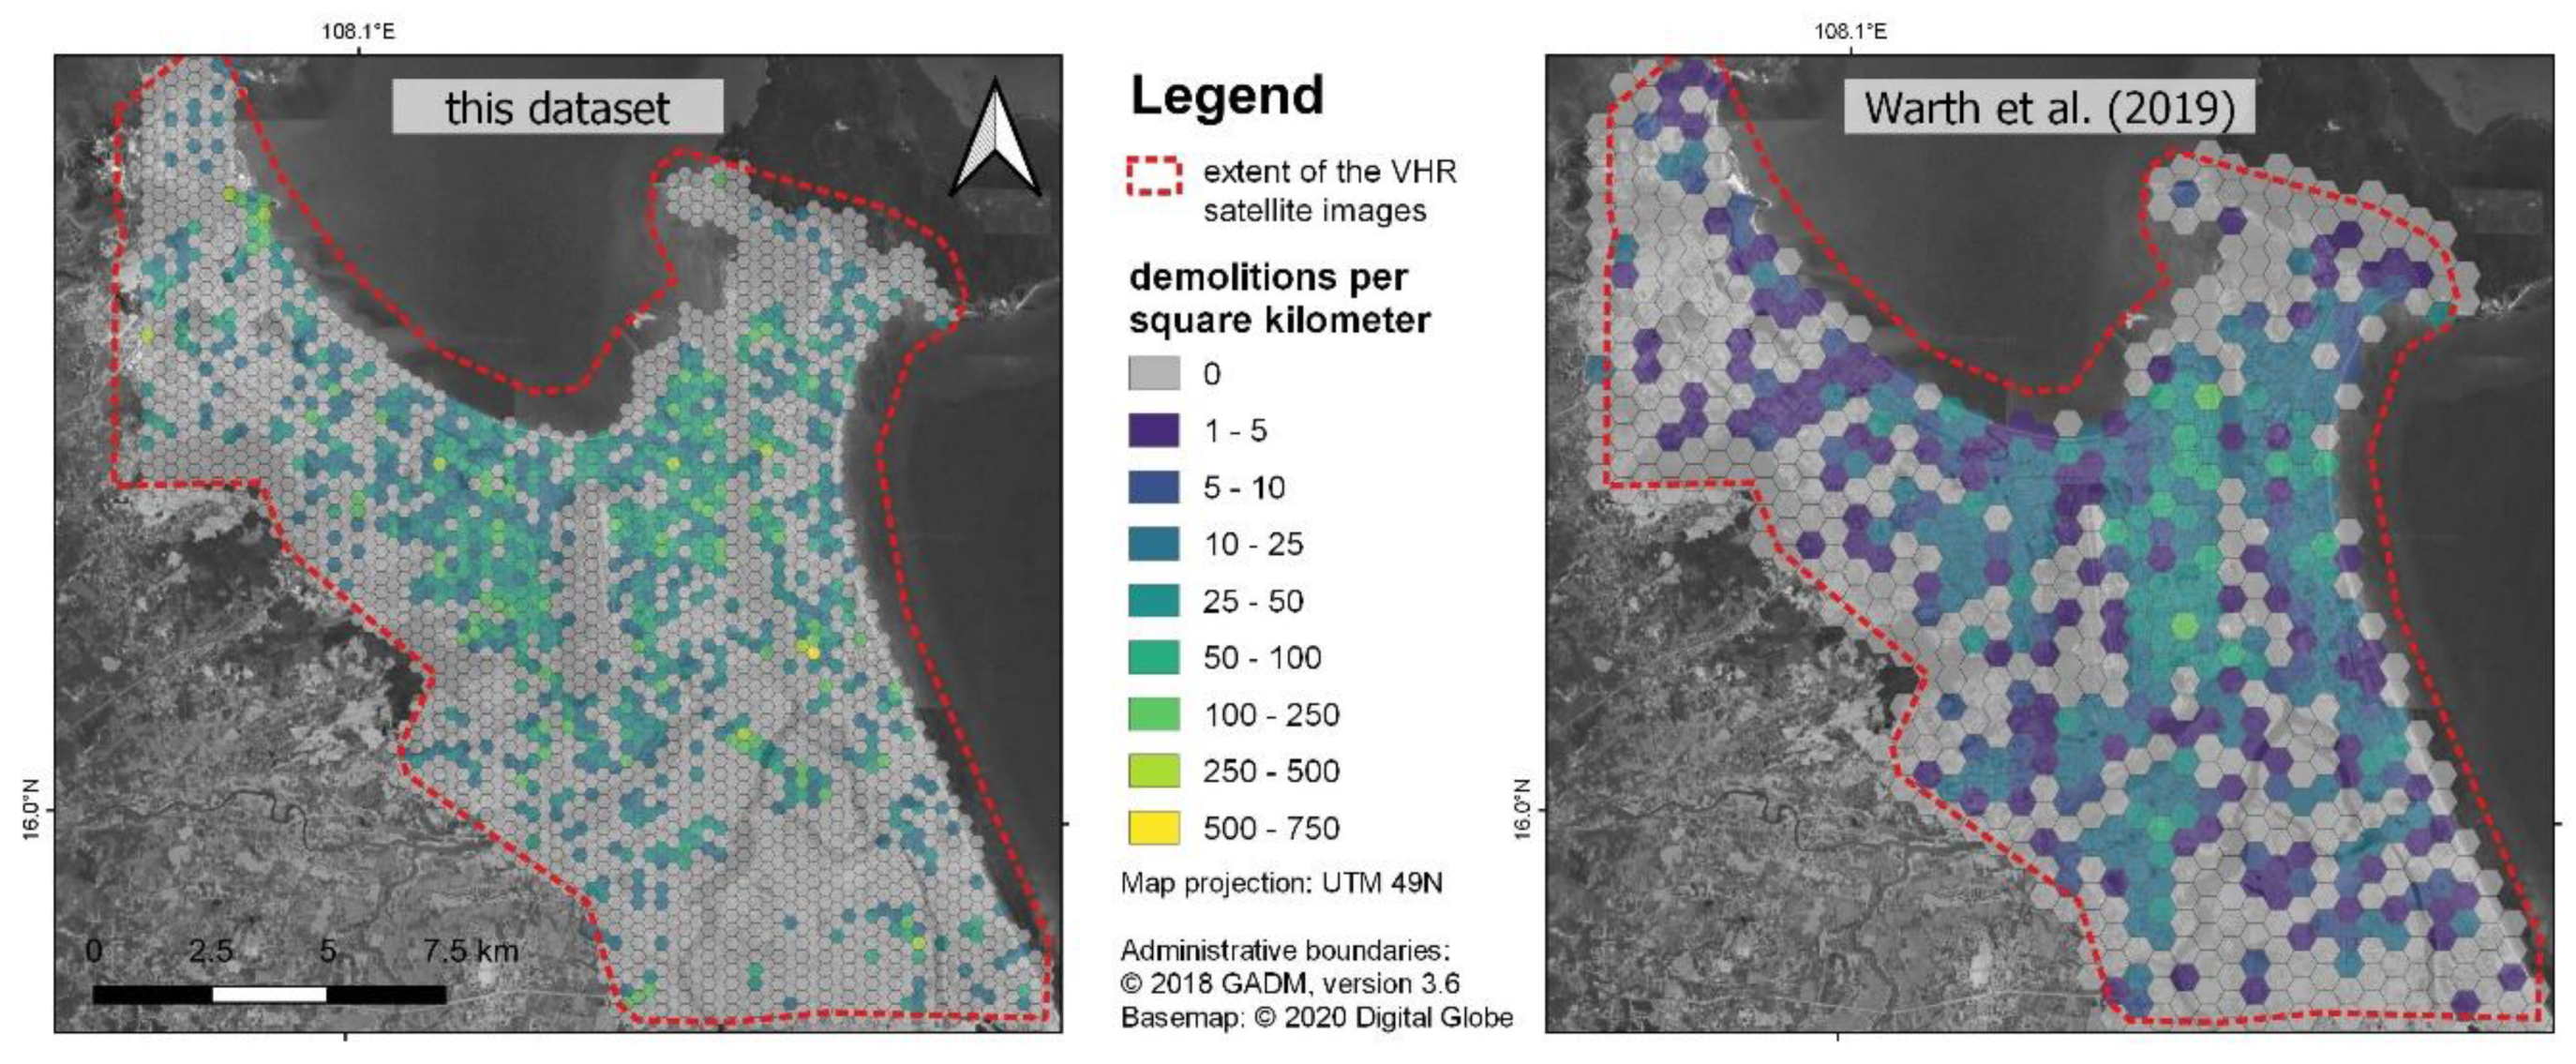
- Warth, G.; Braun, A.; Bödinger, C.; Hochschild, V.; Bachofer, F. DSM-based identification of changes in highly dynamic urban agglomerations. Eur. J. Remote Sens. 2019, 52, 322–334. [Google Scholar] [CrossRef]
- United Nations. World Population Prospects: Revision of 2019. Available online: https://population.un.org/wpp/ (accessed on 23 February 2020).
- Ostojic, D.R.; Bose, R.K.; Krambeck, H.; Lim, J.; Zhang, Y. Energizing Green Cities in Southeast Asia; The World Bank: Washington, DC, USA, 2013; ISBN 978-0-8213-9837-1. [Google Scholar]
- Burnett, M.G. Hexagon (KH-9). Mapping Camera Program and Evolution; United States Secretary of the Air Force: Washington, DC, USA, 2012. [Google Scholar]
- Moon, K.; Downes, N.; Rujner, H.; Storch, H. Adaptation of the urban structure type approach for vulnerability assessment of climate change risks in Ho Chi Minh City. In Congress Report, Low Carbon Cities; International Planning Congress: Porto, Portugal, 2009. [Google Scholar]
- Downes, N.K.; Storch, H.; Schmidt, M.; Nguyen, T.C.V.; Tran, T.N. Understanding Ho Chi Minh City’s urban structures for urban land-use monitoring and risk-adapted land-use planning. In Sustainable Ho Chi Minh City: Climate Policies for Emerging Mega Cities; Katzschner, A., Waibel, M., Schwede, D., Katzschner, L., Schmidt, M., Storch, H., Eds.; Springer: Heidelberg, Germany, 2016; pp. 89–116. ISBN 978-3-319-04615-0. [Google Scholar]
- Bachofer, F.; Braun, A.; Adamietz, F.; Murray, S.; d’Angelo, P.; Kyazze, E.; Mumuhire, A.P.; Bower, J. Building Stock and Building Typology of Kigali, Rwanda. Data 2019, 4, 105. [Google Scholar] [CrossRef]
- GADM. Database of Global Administrative Areas: Version 3.6. Available online: https://gadm.org (accessed on 15 January 2020).
- Birch, C.P.D.; Oom, S.P.; Beecham, J.A. Rectangular and hexagonal grids used for observation, experiment and simulation in ecology. Ecol. Model. 2007, 206, 347–359. [Google Scholar] [CrossRef]
- Canny, J. A computational approach to edge detection. IEEE Trans. Pattern Anal. Mach. Intell. 1986, 679–698. [Google Scholar] [CrossRef]
- Panagiotakis, E.; Chrysoulakis, N.; Charalampopoulou, V.; Poursanidis, D. Validation of Pleiades Tri-Stereo DSM in urban areas. ISPRS Int. J. Geo Inf. 2018, 7, 118. [Google Scholar] [CrossRef]
- General Statistics Office of Vietnam. The 2009 Vietnam Population and Housing Census: Major Findings. Available online: https://www.gso.gov.vn/default_en.aspx?tabid=515&idmid=5&ItemID=9813 (accessed on 15 January 2020).
- Hằng, N.H. Da Nang city development. In Knowledge Creation in Community Development; Nishihara, A.H., Matsunaga, M., Nonaka, I., Yokomichi, K., Eds.; Springer: Heidelberg, Germany, 2018; pp. 85–106. [Google Scholar]
- Bachofer, F.; Rau, H. Change monitoring of a heterogeneous urban landscape using RapidEye data—DaNang, Vietnam. In Proceedings of the GIS 2015 Conference, Hue, Vietnam, 8–11 December 2016; pp. 702–707. [Google Scholar]
- Linh, N.H.K.; Chuong, H.V. Assessing the impact of urbanization on urban climate by remote sensing perspective: A case study in DaNang city, Vietnam. Int. Arch. Photogramm. Remote Sens. Spat. Inf. Sci. 2015, XL-7/W3, 207–212. [Google Scholar] [CrossRef]
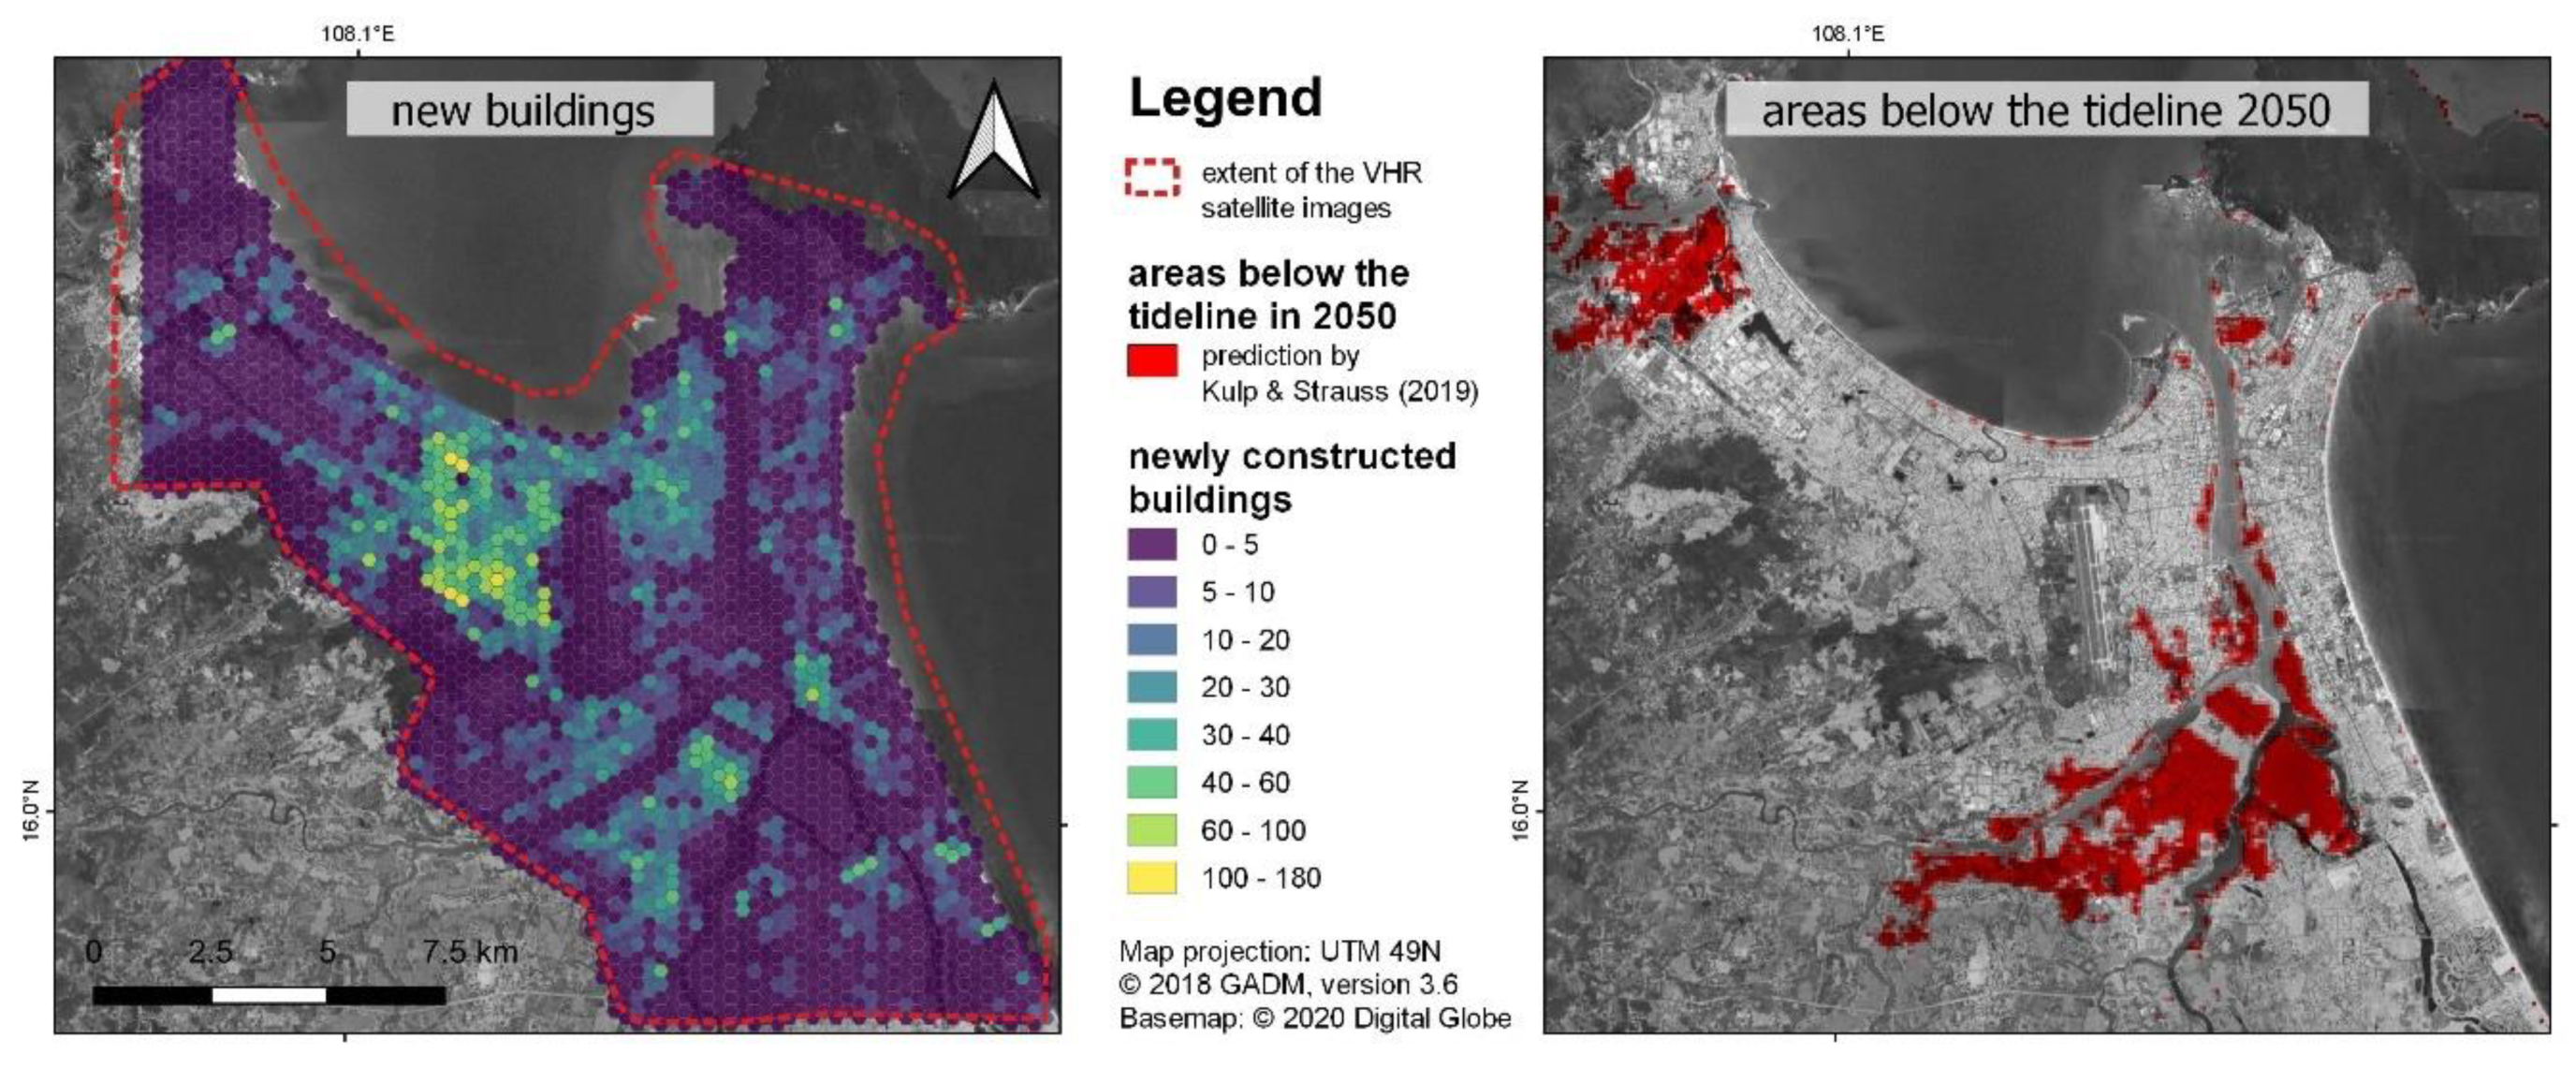
- Kulp, S.A.; Strauss, B.H. New elevation data triple estimates of global vulnerability to sea-level rise and coastal flooding. Nat. Commun. 2019, 10, 4844. [Google Scholar] [CrossRef] [PubMed]


| ID | Building Type and Statistics | Description | Representative Reference Picture |
|---|---|---|---|
| 1 | Single family, basic (n = 65) average (standard deviation) of: height: 2.3 m (2.6 m) size1: 57.7 m2 (39.1 m2) length1: 16.5 m (13.2 m) width1: 8.0 m (7.2 m) persons/household2: 4.3 (0.9) | Detached housing, with a mix of residential and commercial use. Low-rise with one to two floors. Comprised of wood, brickwork, and reinforced concrete, tin roof. Often located along small alleyways or in peri-urban locations. |  |
| 2 | Local-type shophouse (n = 540) average (standard deviation) of: height: 3.9 m (3.1 m) size1: 85.1 m2 (60.3 m2) length1: 16.4 m (7.0 m) width1: 7.2 m (4.2 m) persons/household2: 5.8 (2.4) | Typical building type in Da Nang. Detached/semi- detached/terraced shophouse. It is a two to five story urban building, which allows for a shop or other public activity at the street level, with residential accommodation on the upper floors. |  |
| 3 | Single family, bungalow (n = 29) average (standard deviation) of: height: 4.0 m (1.5 m) size1: 101.6 m2 (55.4 m2) length1: 25.1 m (16.8 m) width1: 14.5 m (9.1 m) persons/household2: 4.7 (2.4) | Single family detached dwelling, low-rise, two to three floors, built from brickwork and concrete, located in new urban districts. |  |
| 4 | Single family, villa (n = 39) average (standard deviation) of: height: 5.1 m (3.7 m) size1: 211.8 m2 (174.1 m2) length1: 21.8 m (8.5 m) width1: 13.1 m (5.3 m) persons/household2: 4.3 (1.6) | Mostly a single-family detached dwelling, sometimes two to three attached multifamily buildings, low rise, two to four floors, built from brickwork or concrete, located in newly developed urban areas. |  |
| 5 | Multifamily, local (n = 53) average (standard deviation) of: height: 5.5 m (4.8 m) size1: 346.2 m2 (249.1 m2) length1: 30.3 m (14.1 m) width1: 14.6 m (7.3 m) persons/household2: 5.0 (1.8) | Multistory/multiunit apartments with more than three units. Commercial and/or public usage is possible. Traditional style of construction and local inhabitants. |  |
| 6 | Multifamily, modern (n = 33) average (standard deviation) of: height: 8.3 m (10.0 m) size1: 854 m2 (1517.9 m2) length1: 43.4 m (28.3 m) width1: 23.8 m (19.4 m) persons/household3: - | Multistory/multiunit apartments with more than three units. Modern style of construction. This class only contains hotels and other mixed-use commercial buildings with non-local residents. |  |
| 7 | Special structure/other (n = 11) average (standard deviation) of: height: 5.4 m (5.0 m) size1: 552.1 m2 (928 m2) length1:39.3 m (24.0 m) width1: 22.1 m (14.8 m) persons/household3: - | Wide range of built-up structures with a predominant non-residential use. |  |
| 8 | Hall (n = 17) average (standard deviation) of: height: 5.1 m (3.8 m) size1: 917.6 m2 (1654.0 m2)length1: 44.3 m (31.4 m) width1: 22.8 m (15.8 m) persons/household3: - | Large buildings with one to multiple stores, non-residential use. Mostly markets, warehouses or industrial buildings. |  |
| 9 | Outbuilding/shack (n = 16) average (standard deviation) of: height: 2.3 m (2.7 m) size1: 94.0 m2 (144.8 m2) length1: 16.8 m (17.0 m) width1: 7.9 m (4.6 m) persons/household3: - | A small, often rundown, non-residential building or an outbuilding with non-residential usage (e.g., storage, bicycle racks). |  |
| ID | Change | Example 2015 | Example 2017 |
|---|---|---|---|
| 1 | No change |  |  |
| 2 | New building |  |  |
| 3 | Change/renovation without a significant change in the building type or footprint |  |  |
| 4 | Upgrading including a significant change in the building type/footprint |  |  |
| 5 | Demolition of the building |  |  |
| Attribute | Description | adm | hex | Source |
|---|---|---|---|---|
| province | name of the province | x | GADM | |
| dist_ID | id of the district | x | GADM | |
| district | name of the district | x | GADM | |
| ward_ID | id of the ward | x | GADM | |
| ward | name of the ward | x | GADM | |
| ward_en | name of the ward without special characters | x | GADM | |
| area | area of the ward in square kilometers | x | GIS analysis | |
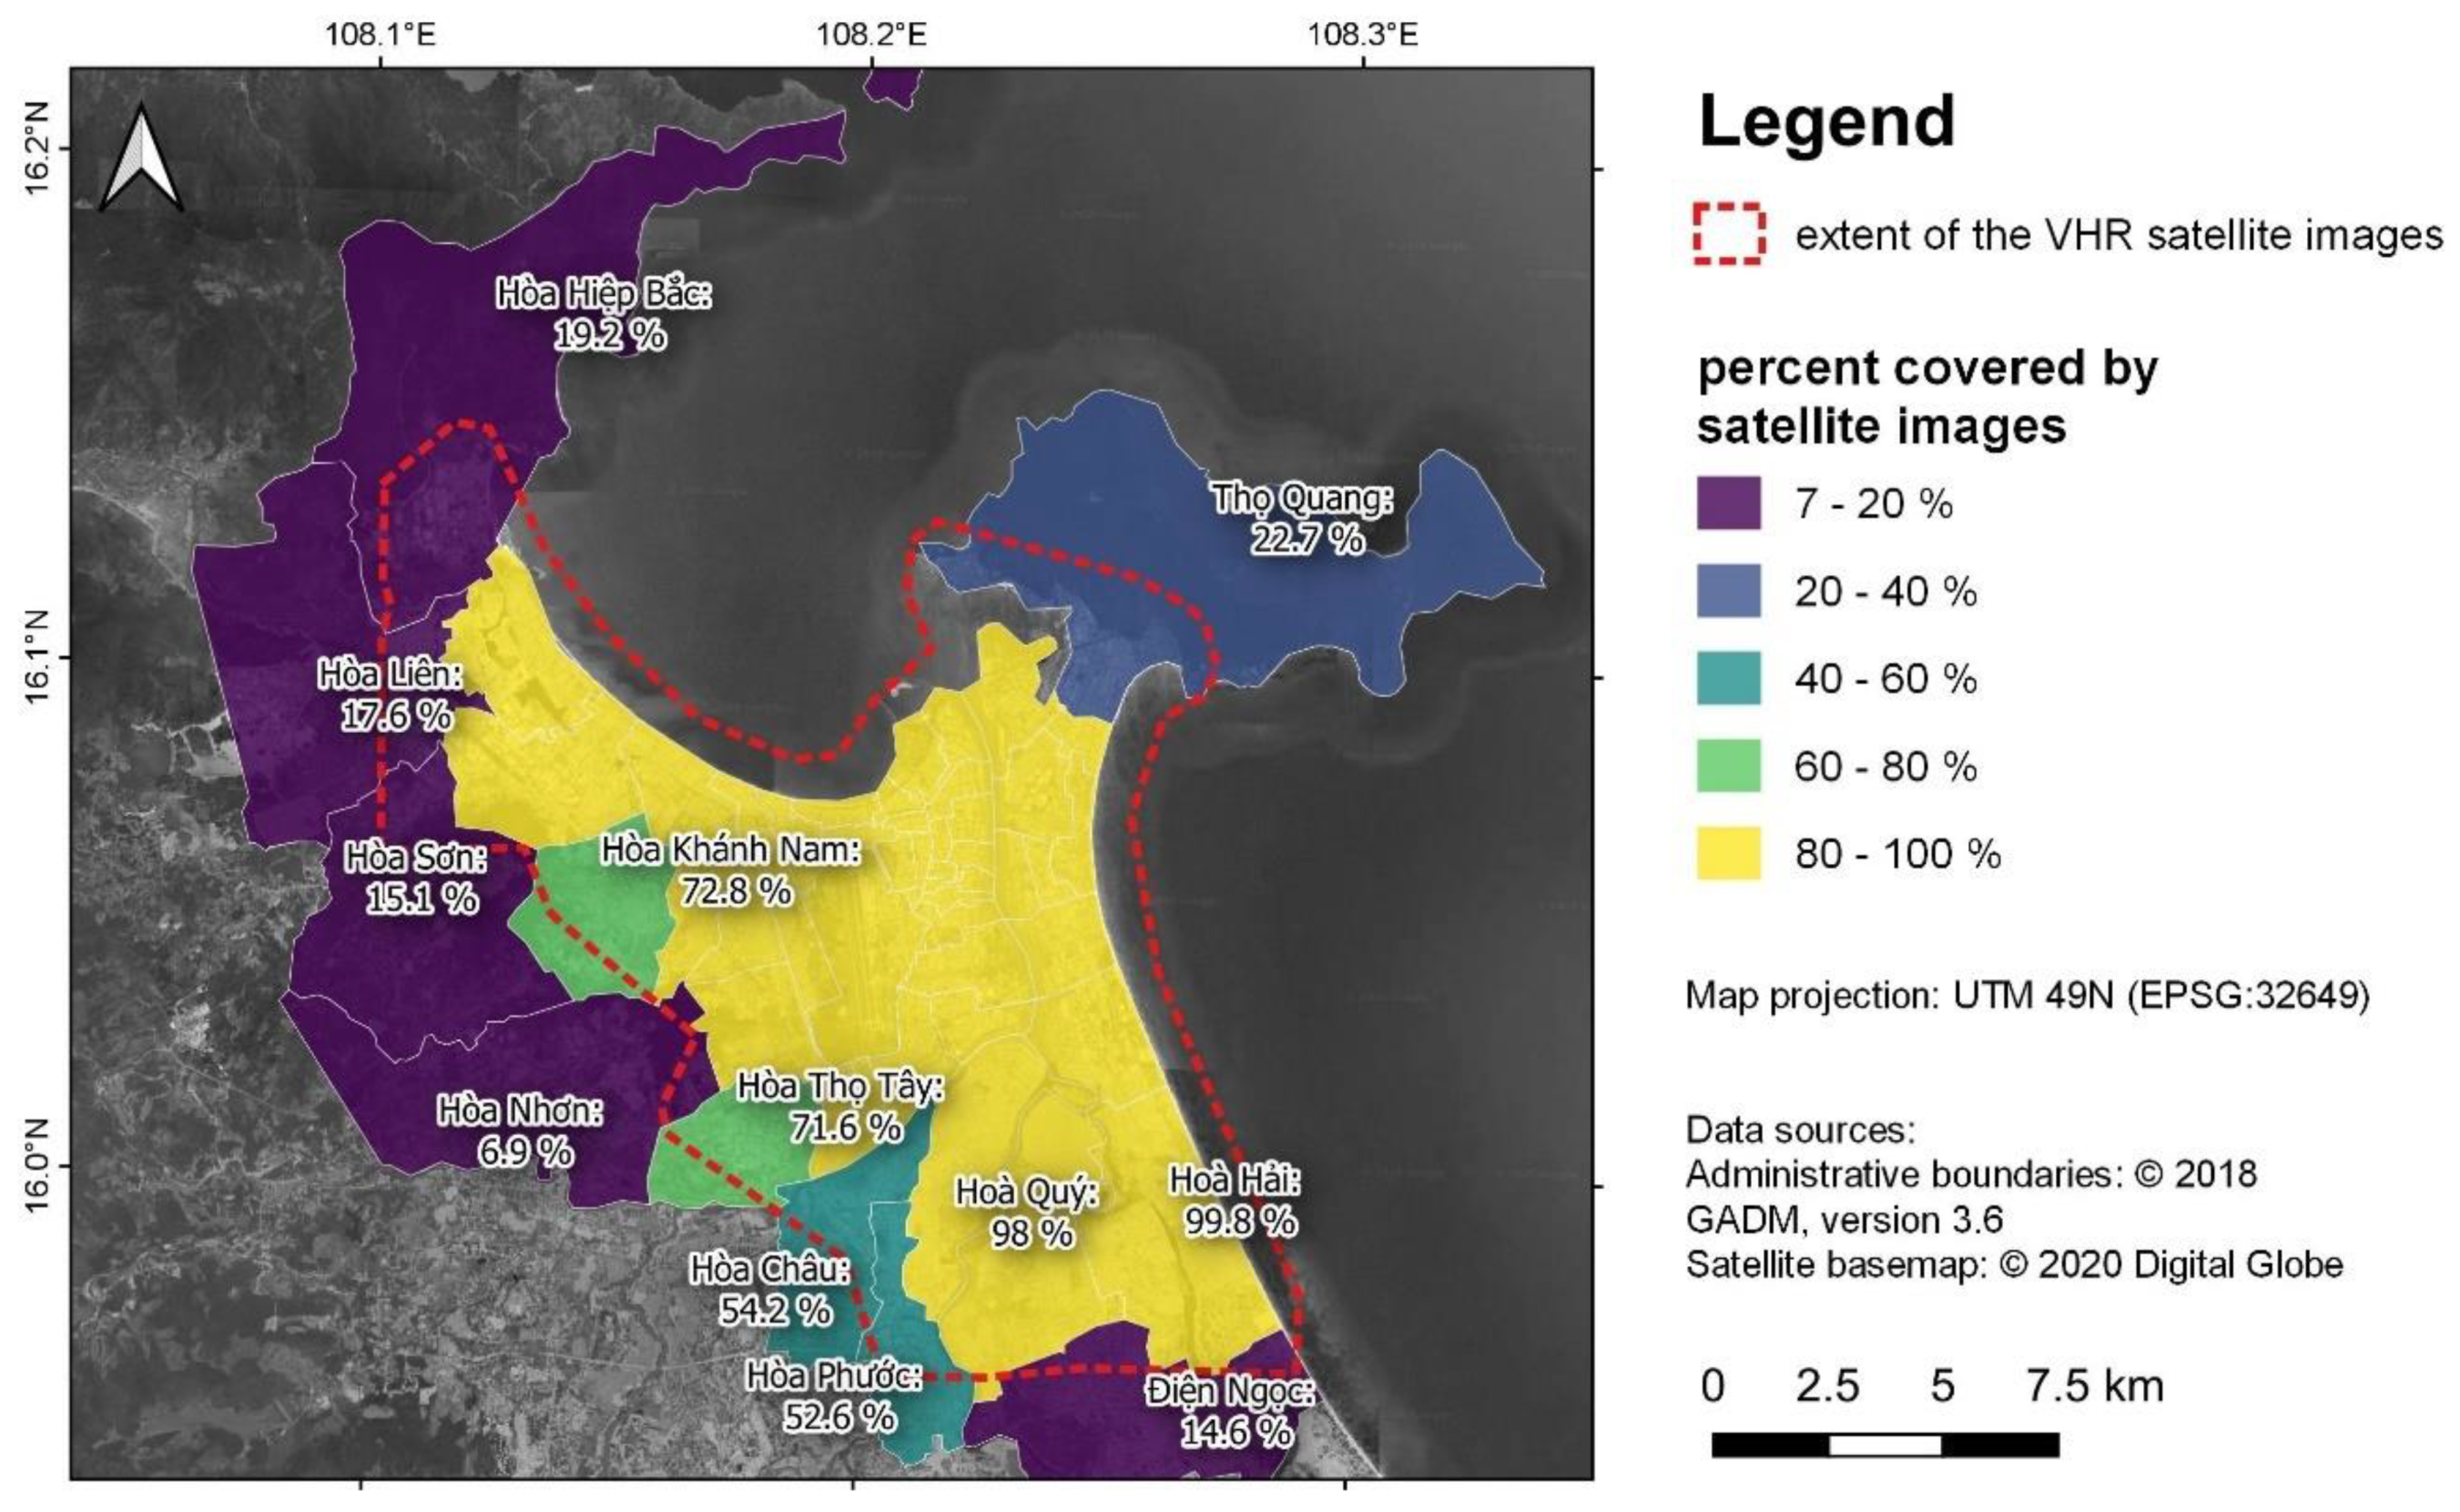
| per_cover | % of ward area covered by satellite | x | GIS analysis | |
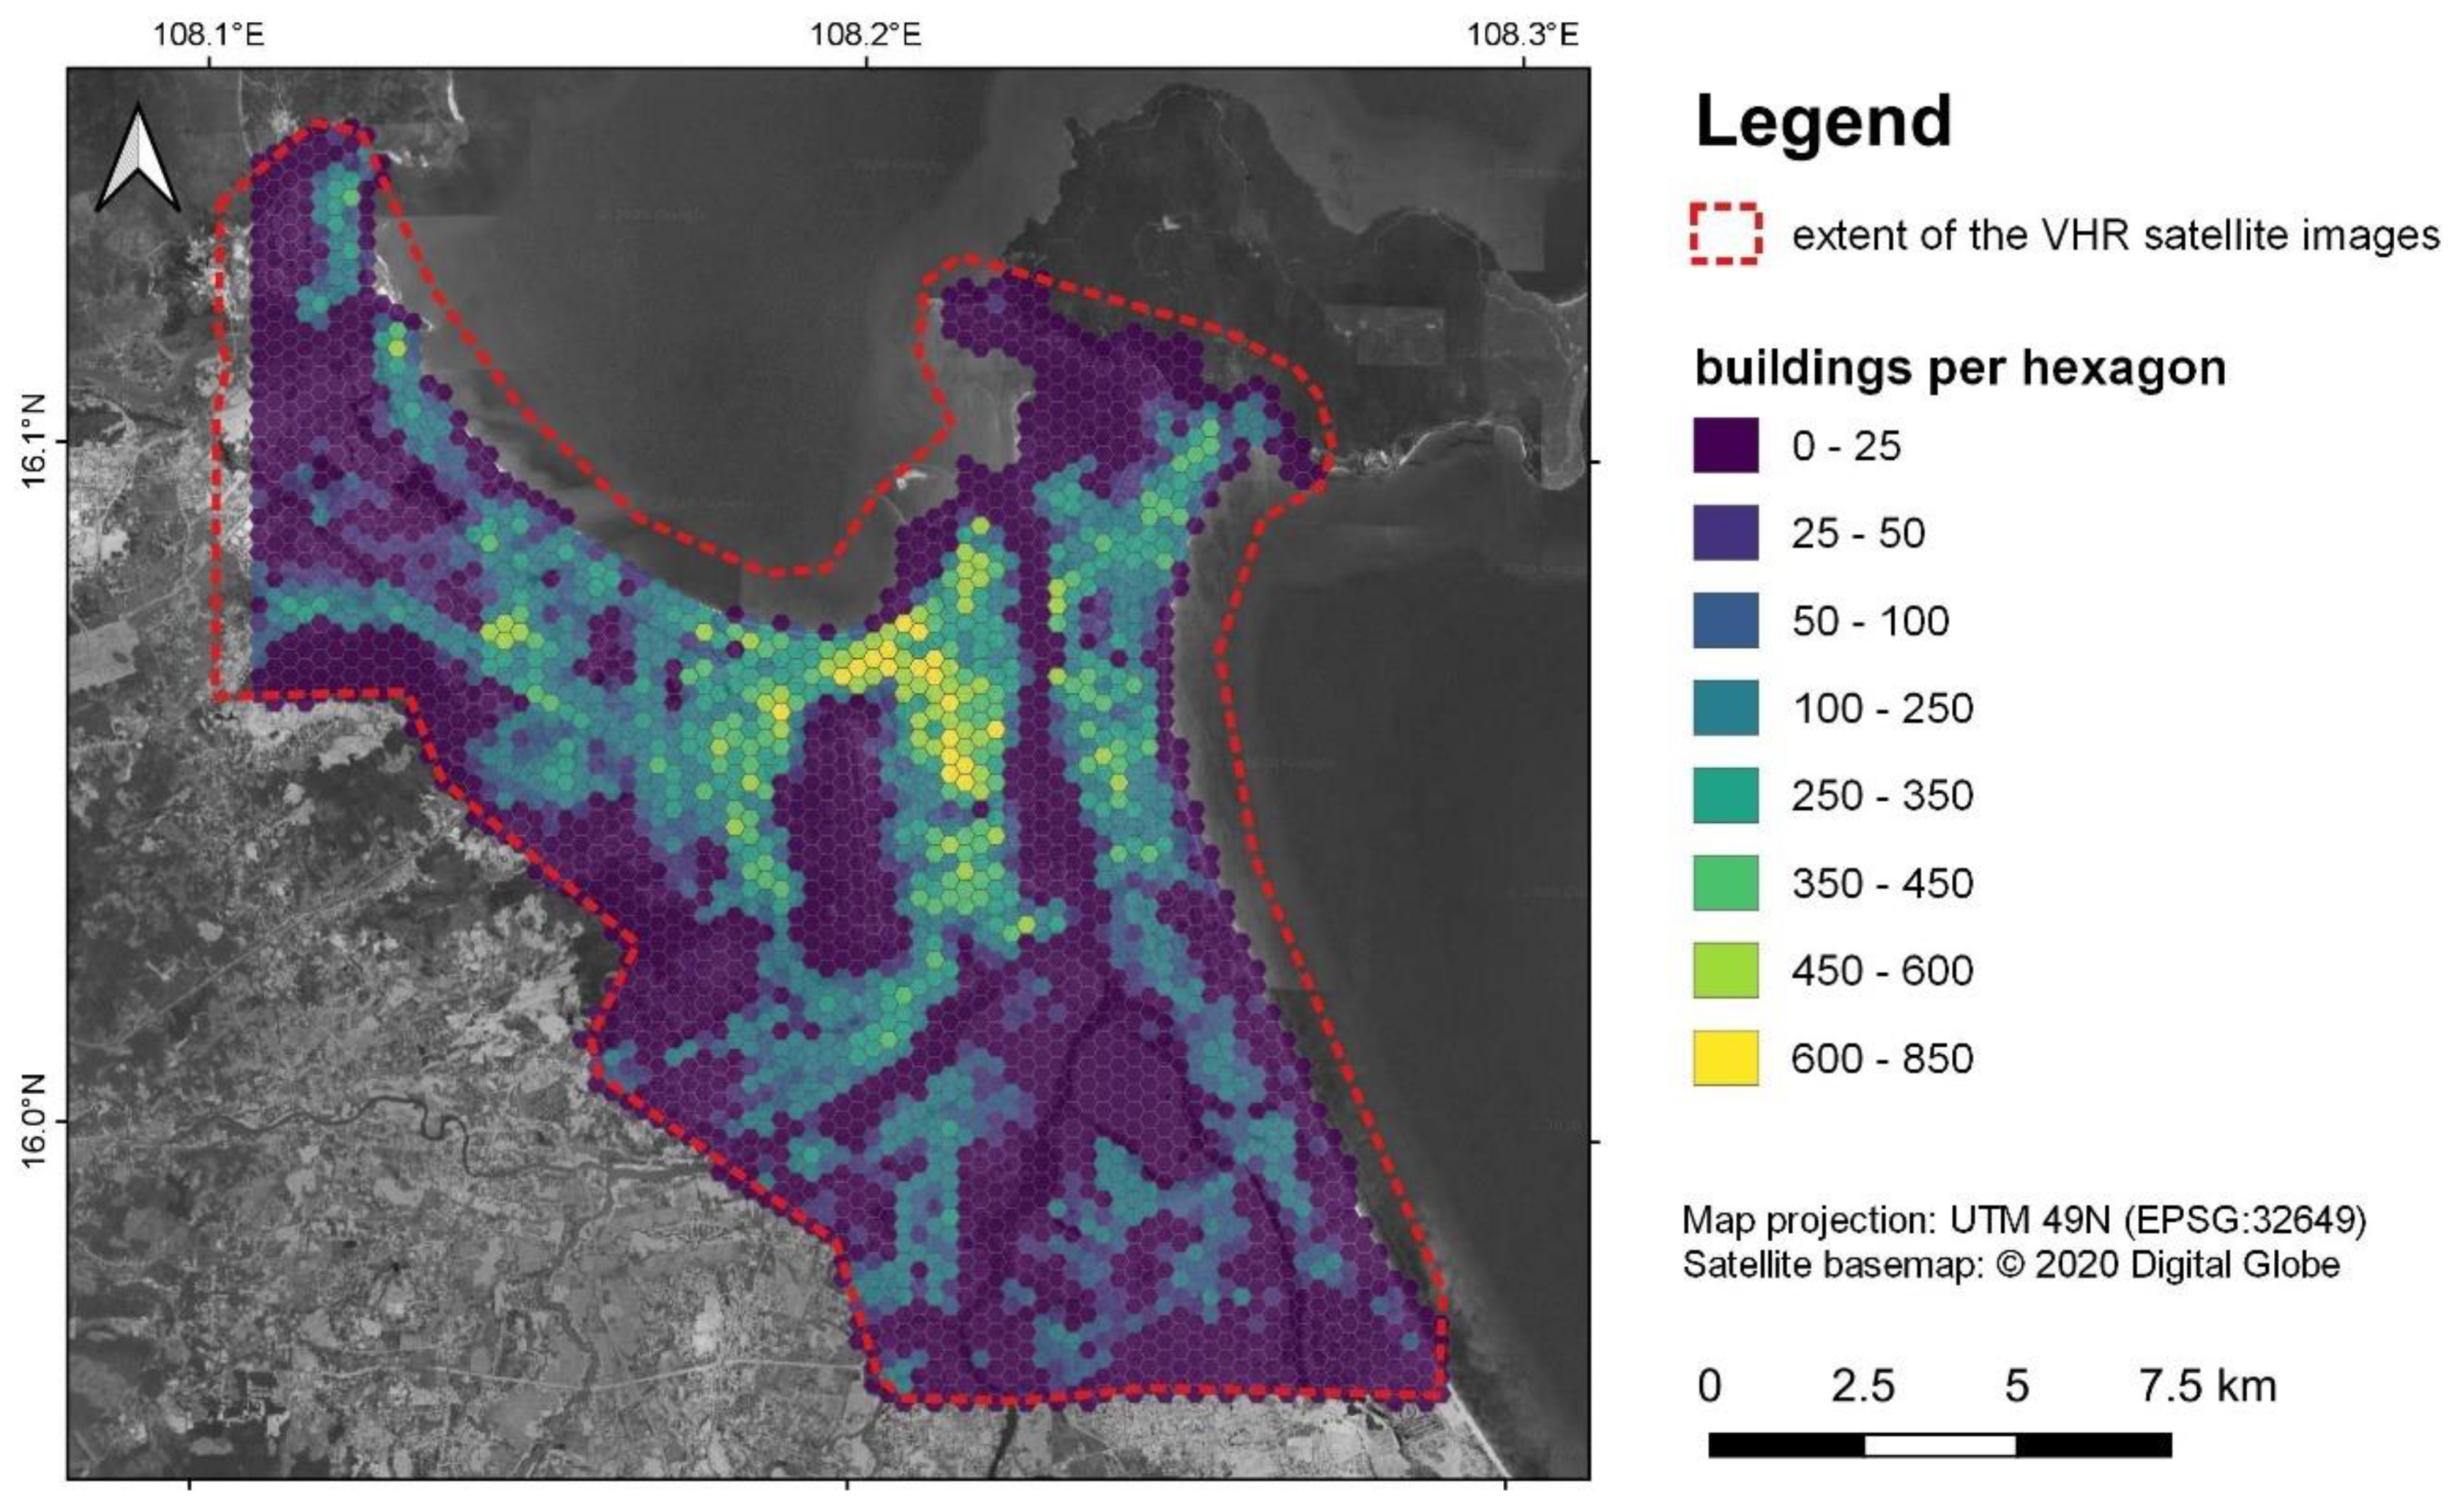
| hex_ID | id of the hexagon | x | GIS analysis | |
| dist_mean | mean distance from the historic city center | x | GIS analysis | |
| c1 | no of buildings with no-change | x | x | Satellite image |
| c2 | no. of new buildings | x | x | Satellite image |
| c3 | no. of changed buildings (same type) | x | x | Satellite image |
| c4 | no. of upgraded buildings (other type) | x | x | Satellite image |
| c5 | no. of demolished buildings | x | x | Satellite image |
| c_sum | no. of all changed buildings | x | x | c2 + c3 + c4 + c5 |
| t2015_1 | no. of “basic” buildings in 2015 | x | x | Satellite image |
| t2015_2 | no. of “local-type shophouse” buildings in 2015 | x | x | Satellite image |
| t2015_3 | no. of “bungalow” buildings in 2015 | x | x | Satellite image |
| t2015_4 | no. of “villa-type” buildings in 2015 | x | x | Satellite image |
| t2015_5 | no. of “apartment, local” buildings in 2015 | x | x | Satellite image |
| t2015_6 | no. of “apartment, modern” buildings in 2015 | x | x | Satellite image |
| t2015_7 | no. of “hall” buildings in 2015 | x | x | Satellite image |
| t2015_8 | no. of “outbuilding” buildings in 2015 | x | x | Satellite image |
| t2015_9 | no. of “special” buildings in 2015 | x | x | Satellite image |
| t2015_sum | no. of all buildings in 2015 | x | x | sum(t2015) |
| t2017_1 | no. of “basic” buildings in 2017 | x | x | Satellite image |
| t2017_2 | no. of “local-type shophouse” buildings in 2017 | x | x | Satellite image |
| t2017_3 | no. of “bungalow” buildings in 2017 | x | x | Satellite image |
| t2017_4 | no. of “villa-type” buildings in 2017 | x | x | Satellite image |
| t2017_5 | no. of “apartment, local” buildings in 2017 | x | x | Satellite image |
| t2017_6 | no. of “apartment, modern” buildings in 2017 | x | x | Satellite image |
| t2017_7 | no. of “hall” buildings in 2017 | x | x | Satellite image |
| t2017_8 | no. of “outbuilding” buildings in 2017 | x | x | Satellite image |
| t2017_9 | no. of “special” buildings in 2017 | x | x | Satellite image |
| t2017_sum | no. of all buildings in 2017 | x | x | sum(t2017) |
| nc_t1 | net change in “basic” buildings | x | x | t2017_1-t2015_1 |
| nc_t2 | net change in “local-type shophouse” buildings | x | x | t2017_2-t2015_2 |
| nc_t3 | net change in “bungalow” buildings | x | x | t2017_3-t2015_3 |
| nc_t4 | net change in “villa-type” buildings | x | x | t2017_4-t2015_4 |
| nc_t5 | net change in “apartment, local” buildings | x | x | t2017_5-t2015_5 |
| nc_t6 | net change in “apartment, modern” buildings | x | x | t2017_6-t2015_6 |
| nc_t7 | net change in “hall” buildings | x | x | t2017_7-t2015_7 |
| nc_t8 | net change in “outbuilding” buildings | x | x | t2017_8-t2015_8 |
| nc_t9 | net change in “special” buildings | x | x | t2017_9-t2015_9 |
| nc_all | net change in all buildings | x | x | t2017_sum-t2015_sum |
| pc_t1 | % of change in “basic” buildings | x | x | nc_t1/t2015_1 |
| pc_t2 | % of change in “local-type shophouse” buildings | x | x | nc_t2/t2015_2 |
| pc_t3 | % of change in “bungalow” buildings | x | x | nc_t3/t2015_3 |
| pc_t4 | % of change in “villa-type” buildings | x | x | nc_t4/t2015_4 |
| pc_t5 | % of change in “apartment, local” buildings | x | x | nc_t5/t2015_5 |
| pc_t6 | % of change in “apartment, modern” buildings | x | x | nc_t6/t2015_6 |
| pc_t7 | % of change in “hall” buildings | x | x | nc_t7/t2015_7 |
| pc_t8 | % of change in “outbuilding” buildings | x | x | nc_t8/t2015_8 |
| pc_t9 | % of change in “special” buildings | x | x | nc_t9/t2015_9 |
| pc_all | % of changed buildings based on all buildings in 2015 | x | x | c_sum/t2015_sum |
© 2020 by the authors. Licensee MDPI, Basel, Switzerland. This article is an open access article distributed under the terms and conditions of the Creative Commons Attribution (CC BY) license (http://creativecommons.org/licenses/by/4.0/).
Share and Cite
Braun, A.; Warth, G.; Bachofer, F.; Quynh Bui, T.T.; Tran, H.; Hochschild, V. Changes in the Building Stock of Da Nang between 2015 and 2017. Data 2020, 5, 42. https://doi.org/10.3390/data5020042
Braun A, Warth G, Bachofer F, Quynh Bui TT, Tran H, Hochschild V. Changes in the Building Stock of Da Nang between 2015 and 2017. Data. 2020; 5(2):42. https://doi.org/10.3390/data5020042
Chicago/Turabian StyleBraun, Andreas, Gebhard Warth, Felix Bachofer, Tram Thi Quynh Bui, Hao Tran, and Volker Hochschild. 2020. "Changes in the Building Stock of Da Nang between 2015 and 2017" Data 5, no. 2: 42. https://doi.org/10.3390/data5020042
APA StyleBraun, A., Warth, G., Bachofer, F., Quynh Bui, T. T., Tran, H., & Hochschild, V. (2020). Changes in the Building Stock of Da Nang between 2015 and 2017. Data, 5(2), 42. https://doi.org/10.3390/data5020042