Data Descriptor

Introducing the Facility List Coder: A New Dataset/Method to Evaluate Community Food Environments

by
Ana María Arcila-Agudelo
1,
Juan Carlos Muñoz-Mora
2 and
Andreu Farran-Codina
1,*
1
Department of Nutrition, Food Science, and Gastronomy, XaRTA–INSA, Faculty of Pharmacy, University of Barcelona, Av. Prat de la Riba, Campus de l’Alimentació de Torribera, 171, Santa Coloma de Gramenet, E-08921 Barcelona, Spain
2
Department of Economics, Universidad EAFIT, Medellín 050022, Colombia
*
Author to whom correspondence should be addressed.
Submission received: 21 February 2020 / Revised: 6 March 2020 / Accepted: 6 March 2020 / Published: 10 March 2020

Abstract

:
Community food environments have been shown to be important determinants to explain dietary patterns. This data descriptor describes a typical dataset obtained after applying the Facility List Coder (FLC), a new tool to asses community food environments that was validated and presented. The FLC was developed in Python 3.7 combining GIS analysis with standard data techniques. It offers a low-cost, scalable, efficient, and user-friendly way to indirectly identify community nutritional environments in any context. The FLC uses the most open access information to identify the facilities (e.g., convenience food store, bar, bakery, etc.) present around a location of interest (e.g., school, hospital, or university). As a result, researchers will have a comprehensive list of facilities around any location of interest allowing the assessment of key research questions on the influence of the community food environment on different health outcomes (e.g., obesity, physical inactivity, or diet quality). The FLC can be used either as a main source of information or to complement traditional methods such as store census and official commercial lists, among others.
Dataset License: Attribution-Share Alike 4.0 International (CC BY-SA 4.0)

1. Summary

In spite of much qualitative evidence exhibiting the influence of community food environments on food behaviors and health outcomes such as obesity, many quantitative studies have found unexpected or inconsistent results that could indicate that the exposition to a specific food environment might exert influence on eating patterns [1,2,3,4]. Many scholars agree that one of the main explanations for the absence of compelling direct evidence is largely due to one factor: the insufficient validity and reliability of food environment measurements [5]. In fact, in a compilation of literature and a recent systematic review, McKinnon et al. [5] and Lytle et al. [6] showed that only 25% of those studies included in the analysis had any metric evidence that validated their quantitative approach for food environments. Therefore, their results were obtained from poor quality data sources leading to uncertainty, bias, and very low statistical power.
Among the different options to improve the quality and standardization of measuring food environments, the Geographical Information System (GIS) technologies-based solutions stand up. These procedures use the actual positions of the food facilities (i.e., stores, supermarkets, etc.) to calculate different parameters such as facility density or proximity to the nearest facility [7]. Based on these measures, researchers are able to estimate the level and intensity of exposure of a particular subject to a given food environment. Thereby, GIS-based alternatives solve the difficulties of traditional methods, allowing new and important opportunities to finally discern quantitatively the probable relationship between food environments and health outcomes [7].
This data descriptor presents a typical dataset obtained after applying the Facility List Coder (FLC), a tool that was validated and presented in a previous paper [8]. The FLC is an open source Python code that combines GIS analysis with standard data analysis techniques. The FLC extracts geographical information and facility characteristics from two GIS search engines available online: Google Maps and Open Street Maps. These datasets are built using the concept of nodes (or places), which include any geographical objects, such as stores, restaurants, parks, gyms, bridges, and streetlights, among others. Besides the geographical location, each place provides additional information like their description, offers, and characteristics, among others.

2. Data Description

We present a typical dataset obtained after applying the FLC in a given geographical location. In particular, we provided information from Mataró (Spain), a city located near Barcelona (25 km) in Catalonia, Spain, which was used by Arcila et al. [8] as the case study to validate the FLC. Besides other GIS-based solutions [7,9], the FLC collects geographical information and facility characteristics from two main GIS search engines that are available online (Google Maps and Open Street Maps) conducting a spatial query around a predefined zone around a centroid (e.g., schools or homes), then information is classified into four international standardized categories [10]: (i) fast-food restaurants, (ii) bars/restaurants/bakery, (iii) supermarkets, and (iv) specialty stores and others (this dataset is available in the supplementary material). Thus, the final dataset will provide a full description of the food environment around the geographical region of analysis.

2.1. Format

As the main output, the FLC yields a comma-separated file (.csv).

2.2. Data Structure

Table 1 describes the structure of the output, where each row (unit of analysis) is at a facility located at the predefined buffer zone.

3. Methods

The FLC was developed in Python 3.7 combining GIS analysis with standard data techniques. Besides other GIS-based solutions [7,9], the FLC collects geographical information and facility characteristics from two main GIS search engines that are available online (Google Maps and Open Street Maps) performing a spatial query around a predefined zone around a centroid (e.g., school, hospital, or university), then information is classified based on the metadata available for each location based on a comprehensive, multilanguage list of key words that allows for the categorization of each facility. These datasets are built utilizing the concept of nodes (or places), which include any geographical objects, such as bridges, streetlights, stores, schools, and parks, among others.
The FLC performs a spatial query, retrieving all types of facilities present in a predefined zone (e.g., Euclidean buffer around an interest point or any customizable geographic polygons like street segments). In the case of Google Maps, we used the API that offers a low-cost and efficient spatial query. For Open Street Maps (OSM), we implemented a spatial query taking all nodes that could be classified as facilities. In order to avoid duplicates, the FLC performed different techniques based on location as well as all available metadata.
Once the complete list of facilities was obtained, each facility (e.g., bar, supermarket, convenience food store, bakery, etc.) was automatically filtered and classified using the metadata available in each dataset according to a predefined multilingual (Catalan, Spanish, and English) keyword set. This keyword set was first established using a comprehensive list of types of outlets developed by the Government of Catalonia (Spain) as the reference document [11]. Founded on international classification and specific European outlets, this document provides a classification of 10 different outlet types easily generalizable for any European context [10]. Based on these initial disaggregated subcategories, we built a more aggregated and internationally accepted classification [10], which classifies each facility into four types: (i) fast-food restaurants, (ii) bars/restaurants, (iii) supermarkets, and (iv) convenience stores and others. Table 2 presents the categories structure applied in the FLC. The four standardized categories provide an accurate classification of facilities in any context compared with the audited data [8]. In contrast, as the automatic classification for subcategories needs more information from each facility, its accuracy might vary among different contexts [8]. Currently, we are working in a new version of the FLC using matching learning techniques to increase the accuracy of the classification for subcategory level in any context.
Buffer-related parameters and facility categories can be modified to satisfy the specific needs of researchers related to geographical location, multilingual search options, or research questions. Even though other researchers have used similar categories [10], the use of our predefined multilingual key word list offers a contribution for researching community food environments outside the US context, as it allows standardizing the local food traditions into an international classification. For instance, in the European context, a specialized nuts store would not have had any classification following the US standards, yet the FLC offers the possibility to adapt these particularities into a traditional classification. That is, the key word list is easily modified and new terms incorporated or deleted depending on the needs of the researchers or the context. Finally, taking advantage of the different measures available for GIS, the FLC provides: (i) the geographical distance taking into account the road network and traffic based on Google API, in kilometers, (ii) the average time of the walking distance, in minutes, and (iii) the average time of the cycling distance taking into account traffic, in minutes. As its main output, the FLC offers a detailed dataset for all the classified facilities located around each point of interest.

Instructions to Use the FLC in Any Specific Context

The main use of the FLC is the evaluation of the community food environment around a specific interest point (e.g., school or university, among others). Thus, users must provide the geo-location of the point or location of interest (LI), and the size of the zone or buffer around the LI in which the food environment will be evaluated. In the literature, the threshold is often defined as around 1 to 1.6 km [12]. For instance, in a performed study of schooling food environment made by the authors (not published), the FLC listed the facilities present around 1 km from each school. Based on this information, the FLC retrieves the full list of facilities located within the defined zone around the LI. Using the predefined key words list, the FLC will generate a dataset where facilities are classified into four types: (i) fast-food restaurants, (ii) bars/restaurants, (iii) supermarkets, and (iv) convenience stores and others. Despite these predefined keywords meant to be as comprehensive as possible within the European context, these categories could be modified in order to fulfill specific needs of researchers related to geographical location, languages, or research questions.
Once a specific place is identified within a keyword for a pre-established category, the FLC estimates different indicators of relative distance to the LI. In particular, the FLC provides information on: (i) geographic distance (in kilometers) considering the road network using both Google API and OSM; (ii) the average time walking distance (in minutes), taking into account traffic density using Google API; and (iii) the average time cycling distance (in minutes), based on the traffic as well as road structure. As a main output, the FLC offers a detailed dataset for all the classified facilities located around each interest point. Figure 1 illustrates the process.

4. Final Remarks

The FLC can be used either as a main source of information or to complement traditional methods such as store census and official commercial lists, among others. It uses the most popular GIS search engines to assess the food environment, so this can be a source of potential errors because information could be either centrally generated by search engines or self-reported by facility owners/representatives. Despite the fact that all information is verified and standardized by the search engines, having self-reported information might lead to the following caveats: (i) the FLC will underestimate the food environment in places with low GIS information; (ii) the FLC will misallocate facilities in locations where no further information about the places is available. It is a very unlikely scenario as both sources of information have a very standardized method to collect this information.

Supplementary Materials

The original codes, keywords of datasets, and the FLC for Mataró are available at https://github.com/jcmunozmora/facilitylistcoder.git.

Author Contributions

A.M.A.-A, A.F.-C., and J.C.M.-M. performed the statistical analysis and elaborated the syntaxes. A.M.A.-A. and A.F.-C. performed the interpretation of results and wrote the first draft. All authors have read and agreed to the published version of the manuscript.

Funding

This research received no external funding. A.M.A.A. has received a grant from the Colombian Government (COLCIENCIAS) to study her PhD in Food and Nutrition at the Universitat de Barcelona (Spain).

Conflicts of Interest

The authors declare no conflict of interest.

References

  1. Glanz, K.; Sallis, J.F.; Saelens, B.E.; Frank, L.D. Healthy Nutrition Environments: Concepts and Measures. Am. J. Health Promot. 2005, 19, 330–333. [Google Scholar] [CrossRef] [PubMed]
  2. Williams, J.; Scarborough, P.; Matthews, A.; Cowburn, G.; Foster, C.; Roberts, N.; Rayner, M. A systematic review of the influence of the retail food environment around schools on obesity-related outcomes. Obes. Rev. 2014, 15, 359–374. [Google Scholar] [CrossRef] [PubMed]
  3. Pitt, E.; Gallegos, D.; Comans, T.; Cameron, C.; Thornton, L. Exploring the influence of local food environments on food behaviours: A systematic review of qualitative literature. Public Health Nutr. 2017, 20, 2393–2405. [Google Scholar] [CrossRef] [PubMed] [Green Version]
  4. Cobb, L.K.; Appel, L.J.; Franco, M.; Jones-Smith, J.C.; Nur, A.; Anderson, C.A.M. The relationship of the local food environment with obesity: A systematic review of methods, study quality, and results. Obesity 2015, 23, 1331–1344. [Google Scholar] [CrossRef] [PubMed] [Green Version]
  5. McKinnon, R.A.; Reedy, J.; Morrissette, M.A.; Lytle, L.A.; Yaroch, A.L. Measures of the Food Environment. A Compilation of the Literature, 1990–2007. Am. J. Prev. Med. 2009, 36, S124–S133. [Google Scholar] [CrossRef] [PubMed]
  6. Lytle, L.A.; Sokol, R.L. Measures of the food environment: A systematic review of the field, 2007–2015. Health Place 2017, 44, 18–34. [Google Scholar] [CrossRef] [PubMed]
  7. Caspi, C.E.; Sorensen, G.; Subramanian, S.V.; Kawachi, I. The local food environment and diet: A systematic review. Health Place 2012, 18, 1172–1187. [Google Scholar] [CrossRef] [PubMed] [Green Version]
  8. Arcila-Agudelo, A.M.; Muñoz-Mora, J.C.; Farran-Codina, A. Validity and Reliability of the Facility List Coder, a New Tool to Evaluate Community Food Environments. Int. J. Environ. Res. Public Health 2019, 16, 3578. [Google Scholar] [CrossRef] [PubMed] [Green Version]
  9. Wilkins, E.L.; Morris, M.A.; Radley, D.; Griffiths, C. Using Geographic Information Systems to measure retail food environments: Discussion of methodological considerations and a proposed reporting checklist (Geo-FERN). Health Place 2017, 44, 110–117. [Google Scholar] [CrossRef] [PubMed]
  10. Lake, A.A.; Burgoine, T.; Greenhalgh, F.; Stamp, E.; Tyrrell, R. The foodscape: Classification and field validation of secondary data sources. Health Place 2010, 16, 666–673. [Google Scholar] [CrossRef] [PubMed] [Green Version]
  11. Consell d’Administració de l’Agència de Salut Pública de Catalunya. Criteris Registrals per a establiments Minoristes D’alimentació de Catalunya [Registration Criteria for Food Retail Establishments in Catalonia] v.2. 2012. Available online: https://www.diba.cat/c/document_library/get_file?uuid=2b7c167f-cf4b-452d-a8a4-acb2f8d90b17&groupId=713456 (accessed on 10 March 2020).
  12. Wilkins, E.L.; Radley, D.; Morris, M.A.; Griffiths, C. Examining the validity and utility of two secondary sources of food environment data against street audits in England. Nutr. J. 2017, 16, 82. [Google Scholar] [CrossRef] [PubMed] [Green Version]
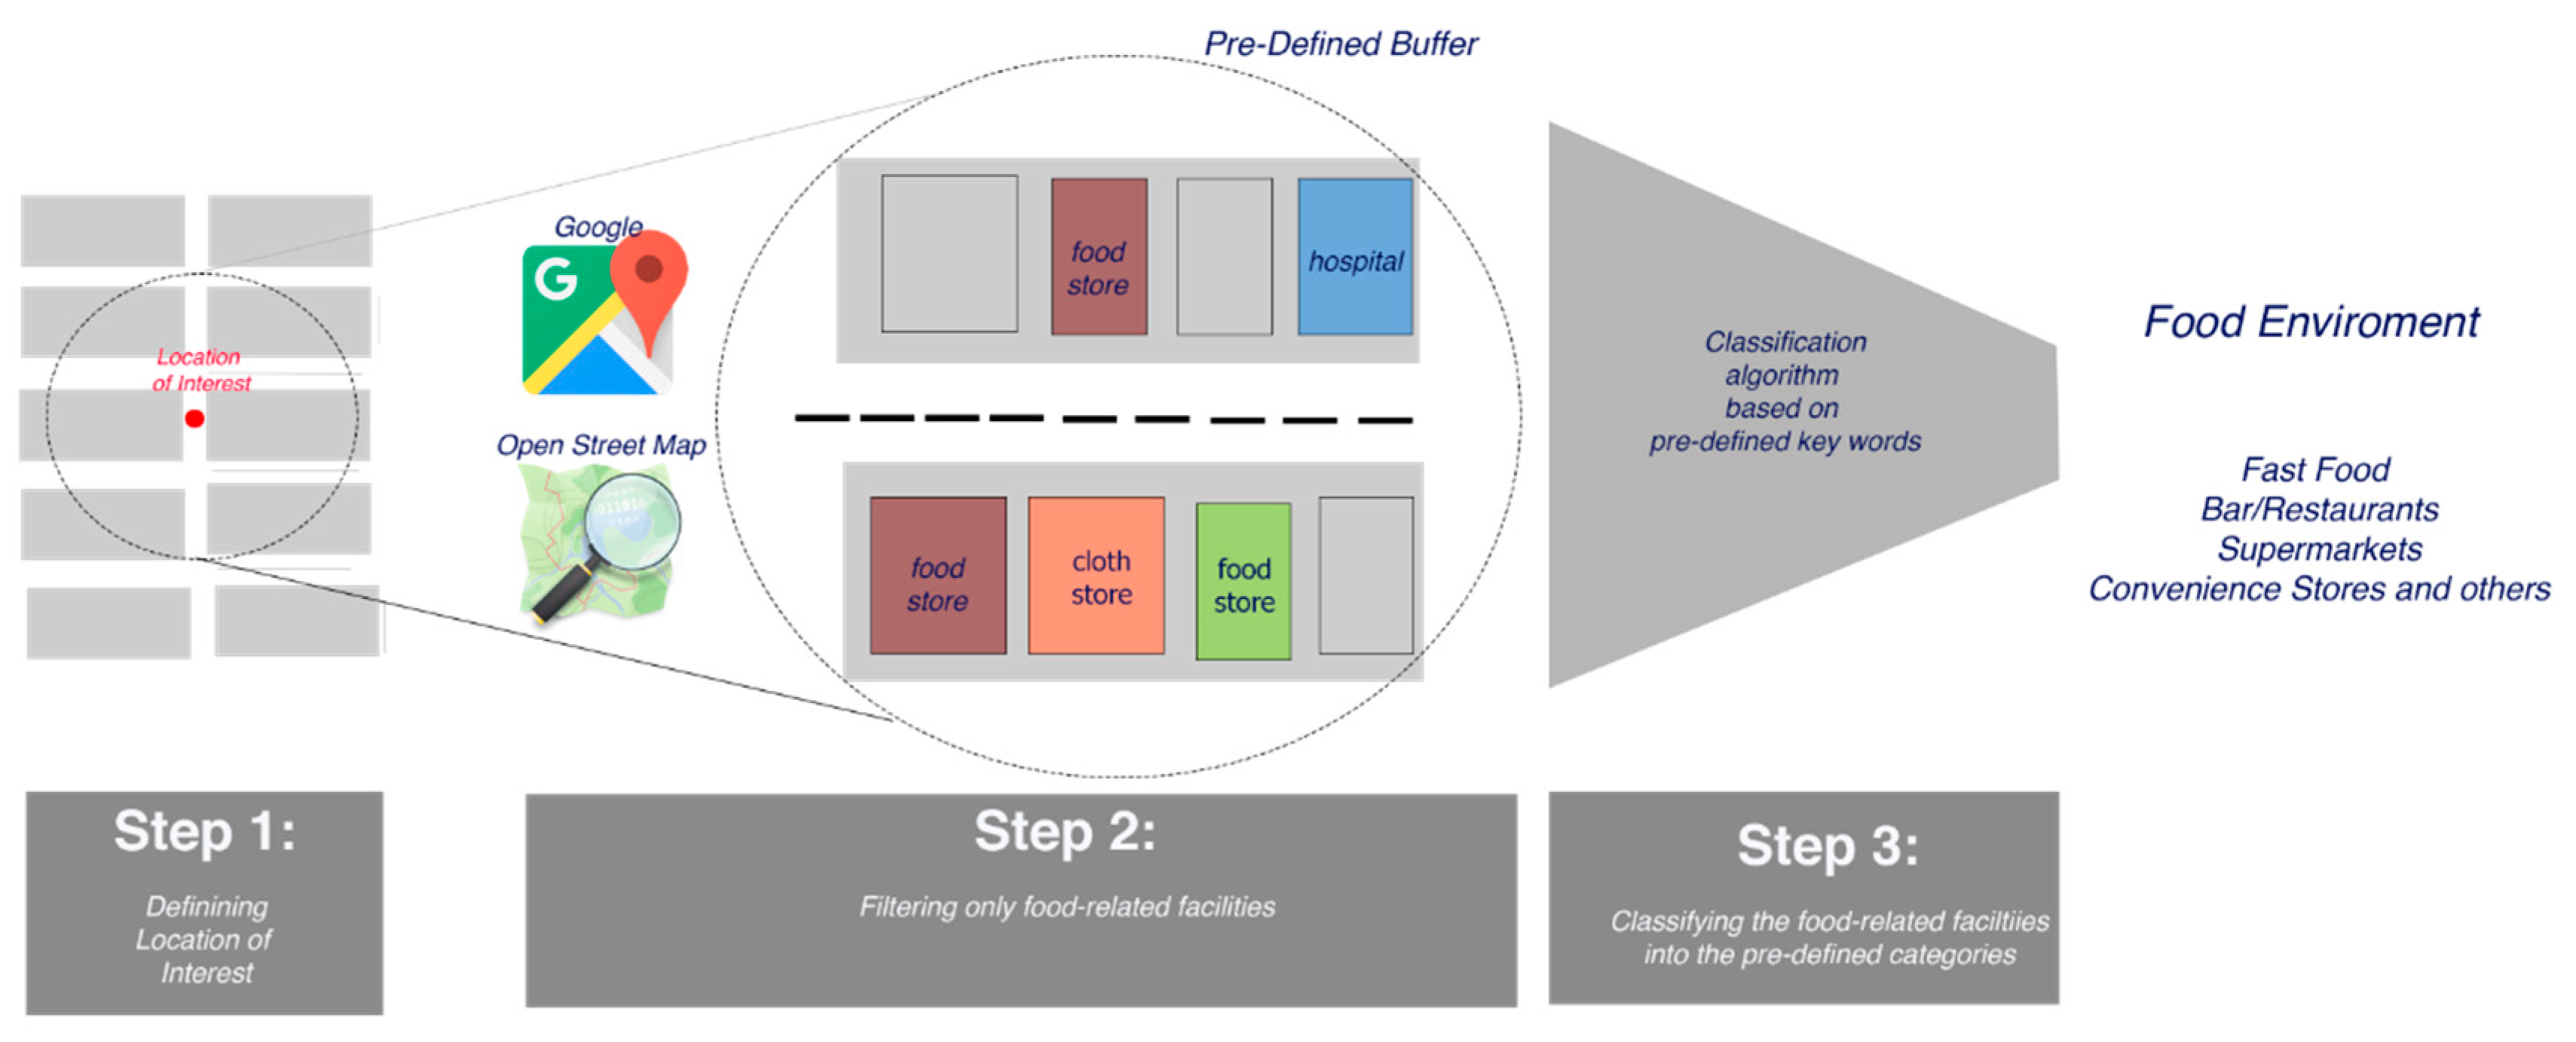
Figure 1. Facility List Coder workflow. The diagram shows the three-step process for the FLC to assess the food environment around a location of interest. For a selected zone in the city map, a spatial query is performed using Google Maps and Open Street Maps, and data on different facilities located in the zone (e.g., food stores) are filtered and classified according to predefined key words, so facilities can be classified into major categories to study the food environment.
Data 05 00023 g001
Table 1. Typical data structure from Facility List Coder output
Variable NameTypeDescription
categoryFactorFacility classification using the predefined classification
dist_cyclingNumeric/FloatCycling distance from the facility to the interest point
dist_kmNumeric/FloatRoad distance from the facility to the interest point
dist_walkingNumeric/FloatWalking time from the facility to the point
geo_idStringID from the spatial search engine (google/osm)
geo_webStringWebpage available from the geo-engine
place_addressStringFacility address
place_latNumeric/FloatFacility location—latitude
place_lngNumeric/FloatFacility location—longitude
place_nameStringFacility name
place_phone_numberStringFacility phone number
place_webStringFacility webpage (if available)
li_idNumeric/FloatLocation of interest—ID
li_latNumeric/FloatLocation of interest—latitude
li_lngNumeric/FloatLocation of interest—longitude
li_nameStringLocation of interest—name
Table 2. Classification categories and subcategories.
International CategorySubcategoryOther Information
Bars/Restaurants/BakeryBakeryPastry shop
Bar, RestaurantKiosk
Fast-Food RestaurantsFast-Food RestaurantChurreria, frankfurt
Ice Cream StoreOrcheteria
SupermarketsSupermarketLocal market, grocery store, frozen store, mini markets
Specialty Stores and OthersFish Shop
Fruit, Vegetable Store
Eggs Store
Dairy Products Cheese shop
Oil Shop
ButcheryButcher shop