1. Introduction
Social media platforms allow their users to simultaneously be active consumers (readers) as well as producers (authors or editors) of data. Individuals, businesses, news agencies, academics, and governments (i.e., tweeters) use social media platforms to express their viewpoints on different topics. Microblogging, provided by a variety of such platforms (e.g., Facebook, GNU social, Micro.blog, Tumblr, and Twitter), refers to the activity in which tweeters broadcast brief updates about various on-going events, discussions, and topics [
1]. Microblogging platforms are being used for a wide range of social purposes, e.g., education, product/service review, typical communications, and news broadcasting [
2,
3]. Pendry et al. [
4] argue that social platforms have benefits at both individual and societal levels, and that due to the richness of their content, they are of greater applied importance than has been realized. Depending on their features, user-produced content on microblogging platforms may include various combinations of data types (e.g., text, videos, images, and hyperlinks). As a new mode of communication, microblogging has shown unprecedented levels of uptake and growth and has quickly gained widespread popularity [
5].
In recent years, proliferation of smartphones has further pushed people to use mobile applications and, hence, social media platforms. However, it seems that due to manifold types of platform hosts, overlaps in the discussed topics, numerous varieties of rules and regulations, and multiplicity in forms and data structures of the content, in order to analyze, understand, gain insight into, and make sense of the online discussions in forums, one has to traverse through heterogeneous webs of platforms and online discussions [
6]. Meanwhile, comments may quickly become outdated or unrelated as well as suffer from source credibility. As a result, having a comprehensive understanding of the overarching picture of discussions and identifying the main players in discussions can be a very challenging and time-consuming task.
Launched in 2006, Twitter is a microblogging website which enables users to post messages (named “tweets”) of up to 280 characters in length [
5]. In the first quarter of 2018, the number of monthly active worldwide users on Twitter broke the 330 million threshold, and the number of tweets published per day reached 500 million [
7,
8]. These characteristics turn Twitter into an important microblogging platform that provides instant access to public opinions on almost any topic of interest on a global scale. Twitter is an open platform; therefore, by default, tweets are public and can be discovered through searching. In a recent research article, Tolmie et al. [
9] indicate that, although there are some similarities between discussions on Twitter and those on existing traditional online forums, discussions on Twitter are “a wholly distinct social phenomenon requiring an independent analysis that treats them as unique phenomena in their own right, rather than as another species of conversation that can be handled within the framework of existing conversation analysis.” Given the differences between Twitter and other social media platforms, it seems that for a valid analysis of the content shared on Twitter, both the big volume of data originating from the Twitter API (i.e., application programming interface), as well as the ever-changing and summarized aspects of its content must be considered.
Being a publicly accessible microblogging platform, people can use Twitter for various ends. Accordingly, the vast space of Twitter data, which is being updated by many tweeters (i.e., users, authors, or contributors to Twitter) at an unprecedented scale, if analyzed properly, can help with gaining insights into “what is happening in the world” [
7]. Research has shown that Twitter is a reliable source for tracking public opinion about various topics, ranging from political issues and journalism [
10,
11,
12,
13,
14] to crises and emergencies [
15], and from public and personal health issues [
16,
17] to brand sentiments [
3,
18]. Social scientists, for example, can observe discussions on a given issue and construct a lens through which they can better understand the public’s perception of the issue. Brands and businesses can measure their customers’ satisfaction based on the on-going discussions. Politicians can observe urgent needs of the people they represent and use this insight in their policy-making processes. It should be noted that the sheer number of tweets, the vague line between formal and informal discussions, and distortions in meaning and misunderstandings due to the brevity of tweets present challenges for the analysts as they seek to use Twitter to construct and update their mental models of various discussions.
Thus, the publicly available Twitter data is an invaluable resource for mining interesting and actionable insights. Computational tools, such as machine learning (ML) techniques and algorithms, can be used to help users (i.e., either those who analyze Twitter data to make sense of it or users of VARTTA—Visual Analytics for Real-Time Twitter datA) analyze and interpret Twitter data, not only with seeing an overview of the data in its aggregate form, but also with formation of high-level mental models of its underlying communications [
19]. However, for Twitter data not to lose its viability and suitability when analyzing real-time situations, it cannot be stored and then processed as batched datasets. It must be processed in real-time. The existing Twitter analysis tools mostly focus on particular analytical questions; there seems to be a need for a tool which provides analytical capabilities in both aggregate and particular forms. To monitor and analyze Twitter data, therefore, it is important to keep a number of issues in mind.
The quality of Twitter data can have various effects on results of any analysis. Throughout the literature, noise has been regarded as a negative contributor to data quality: spam, unrelated, and/or meaningless tweets. Moreover, the dynamic nature of Twitter discussions provides a particular challenge with regards to accuracy, consistency, and reproducibility [
20]. Most of free APIs, including that of Twitter, do not provide noiseless or quasi-high-quality data. Twitter streaming API delivers a non-representative sample of tweets [
21]. The consequences of this skewed sample for research on the uses of Twitter in different discussions have not yet been examined thoroughly [
15]. Nevertheless, although it is possible to obtain high-quality data by purchasing from commercial data vendors, the use of freely available Twitter API seems more suitable for research purposes [
22]. In addition to data quality challenges, using different ML algorithms and techniques to analyze tweets in bulk results in various degrees of accuracy [
23].
Bifet and Frank [
24] suggest that Twitter data can be best modeled as a data stream. In this stream form, tweets arrive at high speeds and in large volumes. Data processing approaches must be able to process, predict, and/or analyze incoming tweets in a real-time manner and under strict constraints of computational resources. They suggest that processed properly, these streams, both at micro and macro levels, can provide great benefits. In a stream processing application, due to the ever-changing characteristics of data, variations in the distributions of the data are inevitable [
25]. Therefore, dataset shift poses a problem when analyzing such streams. In a machine learning configuration, dataset shift occurs when the testing data (unseen) experience a phenomenon that leads to a change in the distribution of a single feature, a combination of features, or the class boundaries (i.e., the distribution of output labels). In summary, the common assumption that training and testing data follow the same distributions is often violated in real-world applications and scenarios. When applied to real-time data streams, due to changes in the distribution of the incoming data, some ML models may predict totally obsolete results after some time [
26,
27]. This makes it even harder for real-time analytics. The following section provides the research questions that this paper aims to address.
Research Questions
Visual analytics systems (VASes) are computational tools that combine ML techniques, data visualizations, and human-data interaction [
28,
29,
30,
31]. VASes can be used to help with the interpretation and analysis of complex data, such as Twitter data. They allow their users to interactively control ML techniques and data visualizations to change how data is analyzed and presented to them. This paper examines the design of a VAS, VARTTA, intended to support making sense of real-time Twitter data. The research questions that this paper examines are as follows:
Is it feasible to develop a VAS that supports making sense of Twitter data by integrating machine learning (ML) and natural language processing (NLP) techniques, stream processing approaches, data visualizations, and human-data interactions, all in real-time?
Can such a VAS be flexible and scalable—that is, allow the plugging in of different ML and computational techniques?
Can such a VAS help with surveillance and sense-making of online Twitter discussions without confining them to pre-defined static topics?
What are some of the issues that need to be taken into consideration when designing and developing such a VAS?
The rest of this paper is organized as follows.
Section 2 provides the conceptual background for our research.
Section 3 describes the design and development of VARTTA intended to address the research questions above.
Section 4 presents an in-depth case-study of VARTTA. Finally,
Section 5 summarizes this paper and provides some conclusions.
2. Background
In Twitter analysis, both, quantitative (e.g., influence ratio of a tweeter) as well as qualitative (e.g., positivity or negativity of the expressed sentiments) approaches to modeling are important [
32]. Assessing validity of arguments, discerning most and least significant contributors, understanding sequence and network of communications, identifying themes and intentions of tweets, and reviewing identities and backgrounds of contributors are examples where one or both of these approaches can be used to enhance the outcome. The outcome of these approaches can also be regarded as input for further advanced analyses [
33,
34,
35].
Reviewing literature [
11,
12,
15,
16,
33,
35] and abstracting existing approaches for Twitter analysis suggest that an analyst is ultimately trying to address the following questions:
“Who” is discussing a topic?
“What” is being discussed?
“How” does a comment get expressed?
“Why” does a comment get expressed?
First, affiliation with an organization, social class, community, or generally a group can determine the credibility of expressions in each discussion. Also, the background of tweeters in terms of previous tweets can be used as an indication of their significance. Moreover, the role of tweeters in any given group can further expose hidden aspects of expressions made by them which directly relates to “why” a comment has been expressed.
Second, as a sample breakdown, topics can consist of subtopics, each of which can include threads of arguments. Initial filtering can be performed on incoming tweets to discern and identify their underlying topics. This helps the analyst to differentiate the topics and distinguish tweets and active tweeters under each topic while keeping in mind the general, more abstract theme of the overarching discussion. These topics and subtopics can be extracted or derived by (1) using keywords, hashtags, and search terms, easily available in a tweet’s textual content, or (2) using computational techniques (e.g., ML and NLP) to analyze a tweet’s textual and multimedia content.
Third, tweeters can express a comment in response to another (i.e., a retweet with a quote or a reply) or they can open up the floor for a new idea (i.e., a new tweet). Tweets can include references to other tweeters (mentions or replies) to invite them to participate or to be considered (e.g., as an answer to a previous tweet). Emoticons, images, videos, and hyperlinks can be used in conjunction to express connotations (emotions, metadata, etc.). Tweets, retweets, and replies can be expressed with large or tiny time gaps, highlighting the popularity of their topic.
Fourth, Twitter allows tweeters to participate in any discussion at a global level. On such a scale, different backgrounds of participants will result in diverse viewpoints and, therefore, different interpretations. A tweet posted by a news agency can be interpreted as educational content meant to increase awareness, or, oppositely, as biased information meant to mislead.
To come to a conclusion regarding each of the above questions, different strategies can result in various scenarios. Systematic reviews of the existing Twitter analysis studies [
12,
15,
16,
17] show that existing approaches are mostly focused on only particular aspects of one of the questions of who, what, how, and why. Although these questions are seemingly different, answering and designing strategies to assess each can result in overlapping scenarios. Also, one can use immediate data available in the tweet and/or use derived information obtained from various data processing or ML techniques to assess these questions. The rest of this section provides a conceptual background required for efficient assessment of the questions.
2.1. Stream Processing
In computer science literature, stream processing is generically used to refer to the study of approaches for processing data flows [
36]. Viewed from a systems perspective, stream processing can be regarded as the study of subsystems and their interconnections for processing data flows (i.e., data streams). Each subsystem is designed to communicate and work in parallel with other parts. Stream-processing systems are often visualized as directed graphs.
As a guideline for real-time stream-processing systems, Stonebraker et al. [
37] suggest eight characteristics “that a system must exhibit to excel at a variety of real-time stream processing applications”. These characteristics can be regarded as general requirements or rules-of-thumb for designing real-time stream-processing systems. They are summarized in the following rules: (1) keep the data moving, (2) query using SQL on streams, (3) handle stream imperfections, (4) generate predictable outcomes, (5) integrate stored and streaming data, (6) guarantee data safety and availability, (7) partition and scale applications automatically, and (8) process and respond instantaneously. Depending on characteristics of an input stream, various stream-processing systems have been developed, each focusing on a subset of the aforementioned rules (e.g., Apache Spark [
38], Apama [
39], and Google Dataflow [
40]).
We use the term ‘stream processing’ here in a general sense to avoid specificity of computational techniques and to provide an abstract view of these tools. Nevertheless, given the current state of technology, the use of ML techniques, specifically supervised learning techniques, and particularly classification, seems to be inevitable in Twitter analysis. Twitter streaming API [
21] requires developers to establish and keep open an uninterrupted HTTP connection to access the most recent tweets. Tweets must be obtained by filtering. Keywords can be used as search criteria to filter tweets. Free accounts are supported to filter by up to 400 keywords on one connection; adjusting keywords requires the client program to restart and re-establish its connection to Twitter. The online, ever-changing characteristics of Twitter data streams, therefore, impose limitations with regards to using such computational tools. Dataset shift is an apparent challenge in stream processing, causing invalid results in a deployed classifier. The following section briefly discusses this phenomenon.
Covariate Shift
Moreno-Torres et al. [
26] define the dataset shift problem as cases in which the joint distributions of input features (covariates) and label class in test data are different from those in training data. In such cases, the accuracy of the trained model fluctuates. Different cases of this problem can occur, details of which are beyond the scope of this paper. However, in a Twitter streaming setup, one special case of the dataset shift problem is the following: the distribution and the variety of input tweets with regards to their content, authors, and topics are unknown and can change anytime. These arbitrary and unpredictable changes in the distribution of input data signify a particular type of the dataset shift problem for Twitter streams: Covariate Shift. This shift invalidates the output of classifiers and, consequently, poses challenges with regards to output of analytical models.
In order to make sense of “who” is discussing “what”, and “how” or “why” they are discussing an issue, these streams must be processed (i.e., verified, normalized, categorized, summarized, and expressed) in real-time. Identifying such stages and decomposing them to more concrete tasks (e.g., using a support vector machine as a classifier) is necessary when designing subsystems of a stream-processing system. Alongside these subsystems, interactive visualizations can be used to further enrich the analytical capabilities of the system. Having all such capabilities under one umbrella is a characteristic of visual analytics systems.
2.2. Visual Analytics
Visual analytics (VA) has been defined as “the science of analytical reasoning facilitated by interactive visual interfaces” [
41]. VA helps analysts obtain insights from complex data via a seamless integration of computational tools with human expertise. Visual analytics systems (VASes) can support, scaffold, and mitigate execution and performance of complex cognitive activities, such as interpretation and analysis, decision-making, sense-making, and knowledge discovery, all involving large, heterogeneous datasets [
42,
43]. A complex cognitive activity is usually open-ended, ill-defined, non-linear, and data-driven; it comprises a network of interdependent visual, interactive, and analytic tasks; it is evidence-based and domain-knowledge intensive [
44,
45].
In the context of visual analytics for social media, Wu et al. [
46] have conducted a survey that focuses solely on multimedia analysis techniques. They have classified state-of-the-art visual analytics studies and systems into (1) retrieving and triaging information and (2) understanding user behaviors. Chen et al. [
47] suggest a wider taxonomy that not only includes multimedia analysis but also takes into account visual analytics approaches. In this taxonomy:
Goals of the visual analytics studies and systems are: (1) visual monitoring, (2) features extraction, (3) event detection, (4) anomaly detection, (5) predictive analysis, and (6) situation awareness.
Social media entities for which data visualizations were developed are: (1) networks, (2) geo-spatial information, and (3) content.
Application domains and disciplines on which these systems shed light are: (1) social sciences, (2) journalism, (3) disaster management, (4) crisis and emergency management, (5) politics, (6) finance, (7) sports and entertainment, (8) tourism and urban planning.
Combination of these goals with entities in different application domains can bring about interesting scenarios for analyzing social media. Depending on the requirements of each scenario, various approaches for processing each social media entity can be taken into account.
By combining visualizations, interaction mechanisms, ML techniques, and analytical models, VASes are capable of providing both computational and cognitive possibilities [
6,
48,
49]. Not only through these possibilities is the analyst equipped with more robust analytical tools, but also a cognitive coupling of the system and the human analyst is created [
28,
29,
30,
42,
45]. In the context of a distributed cognitive system, through possibilities afforded by interaction, human cognitive abilities are leveraged, and the performance of complex cognitive activities is supported. In summary, a VAS can be said to incorporate the following components: ML techniques, data visualizations, and human-data interaction mechanisms. Building a VAS requires detailed descriptions for each of these components.
Since ML techniques help in mitigating and reducing the cognitive load of analysts’ data-intensive tasks, their use in VASes is strongly advocated [
30,
48,
50,
51,
52]. Theoretically, in a VAS, the combination of these techniques with data processing techniques, as a whole, can be regarded as the analytics engine. This component is technology-independent and can include the use of simple or complex algorithms, external APIs, and/or any processing technique that fits best the needs of an application domain. As mentioned previously, classification and sentiment analysis techniques are the two types required for a thorough analysis of Twitter discussions and must be incorporated in such a VAS.
Data visualizations in a VAS are visual representations of the data as well as the processed and derived data from the analytics engine. These visualizations further leverage the capabilities of individuals to complete tasks by allowing them to analyze information in ways that would be difficult or impossible to do otherwise [
31,
50,
53].
When it comes to conducting complex analytical tasks, static and non-interactive visual representations are of little value. As mentioned, visualizations and interaction mechanisms can be combined in a VAS. This combination can enable analysts with new analytical possibilities. In a VAS, these possibilities can be utilized in an iterative manner. One can regard these iterations as discourses (i.e., back-and-forth communication processes between the analyst and the VAS). As a result, the human analyst and the system form a joint cognitive system. Thus, the cognitive activity emerges as a result and from this human-data interaction process [
28,
29,
30,
31]. Accordingly, the quality of interaction mechanisms is critical in determining the quality of the cognitive coupling and the VAS itself [
31,
53]. Given these issues, technical decisions are critical in determining the overall quality of VASes. The next section discusses technical issues and existing approaches for such requirements.
2.3. Progressive Web Applications
Handling data streams requires a given system to react to the incoming data in a short time period. Traditional tools are designed for static datasets, where change either happens off-line (i.e., in the absence of a user and/or by swapping datasets) or is not an option. On the contrary, the proliferation of mobile devices and the need to instantly consume data streams have led to the introduction of Progressive Web Apps (PWAs). PWAs promise to combine web technologies’ ease of development with the adaptability of native applications [
54,
55]. These applications can incorporate WebSockets to offer seamless interface updates [
56]. This results in a decrease in application size and source code volume and, at the same time, an increase in performance efficiency and reactivity [
57]. PWAs can be regarded as unifying technologies for cross-platform application development and approaches that overcome the idiosyncrasies of such developments [
54].
Vue.js [
58,
59] is a programming framework developed in JavaScript that helps to build more approachable, versatile, performant, maintainable, and testable web applications. Socket.io [
60] is a JavaScript library that offers connectivity through WebSockets in an application. Using these libraries and frameworks PWAs can be implemented more easily and most of the challenges related to real-time data handling on interfaces could be addressed.
A meta-framework is a framework that “has a highly extensible backbone for integrating components and services” [
61]. Nuxt.js [
62] is a meta-framework built on top of Vue.js. This meta-framework adds a great deal to modularity of the source code. As an application advances and grows in size, by providing an efficient package structure, Nuxt.js makes it possible to easily manage the application’s code. Conditional component rendering, data watchers, detailed input device events, data bindings, universal state management, reusable components, and custom routers are features that can elevate the capabilities of interfaces. The aforementioned frameworks make it easier to build these features into VASes.
3. Design of VARTTA
VARTTA is intended to enable users to perform the following, all in real-time: (1) analyze and view tweet topics, tweeter groups, and content themes in aggregate form, (2) employ various ML algorithms to analyze incoming streams of tweets, (3) compare results of different ML algorithms, and (4) suggest customized corrections to fix errors (due to biases and covariate shifts in ML models). These characteristics of VARTTA are intended to empower analysts to have instant access to actionable insights.
Translating Twitter data into actionable insights requires big data analytics. As such, tweets as well as their metadata (i.e., data that describes a tweet’s content and author), can be used for aggregations and categorizations. Such categorizations can be described by processing two specific Twitter entities: tweeters and content. Identifying the most and least influential tweeters relates to the follower/followee network and the expressed sentiments, as was discussed in the Background section. Also, intentions and themes of a tweet must be taken into account. Terms, keywords, and extracted topics can be used by NLP methods for advanced analyses of textual content, again as was discussed before [
47,
63,
64]. Sentiments can be determined through a tweet’s metadata directly or analytically. The latter sometimes requires mixing metadata with additional data derived from sources other than the tweet itself (e.g., knowing a tweeter’s organizational affiliation may require analyzing the list of tweeters whom the author follows). Although this may result in more detailed analyses, it can increase computational costs. Based on the aggregation methods used to summarize the above features, it is feasible to build different analytical approaches.
In designing VARTTA our goal is not to concentrate on any specific ML models; rather, our objective is to offer a generic stream-processing system that incorporates different ML models and computational mechanisms for comprehensive analyses of tweets.
In
Section 3.1., we describe VARTTA’s pipeline architecture for processing data streams from Twitter. In
Section 3.2., we present VARTTA’s functionalities. Finally, we demonstrate VARTTA’s efficacy in dealing with real-time Twitter data using a case study.
3.1. Data Flow Design: Pipeline Architecture
As discussed in the Background section, stream-processing systems are often described and understood as graph-like structures where components are concatenated, each with responsibility for a specific task. Similar to other stream-processing systems, VARTTA breaks down computational tasks, concatenates processing stages, and publishes the output as a data stream. Consequently, VARTTA’s user interface, being subscribed to this stream, receives processed data in real-time.
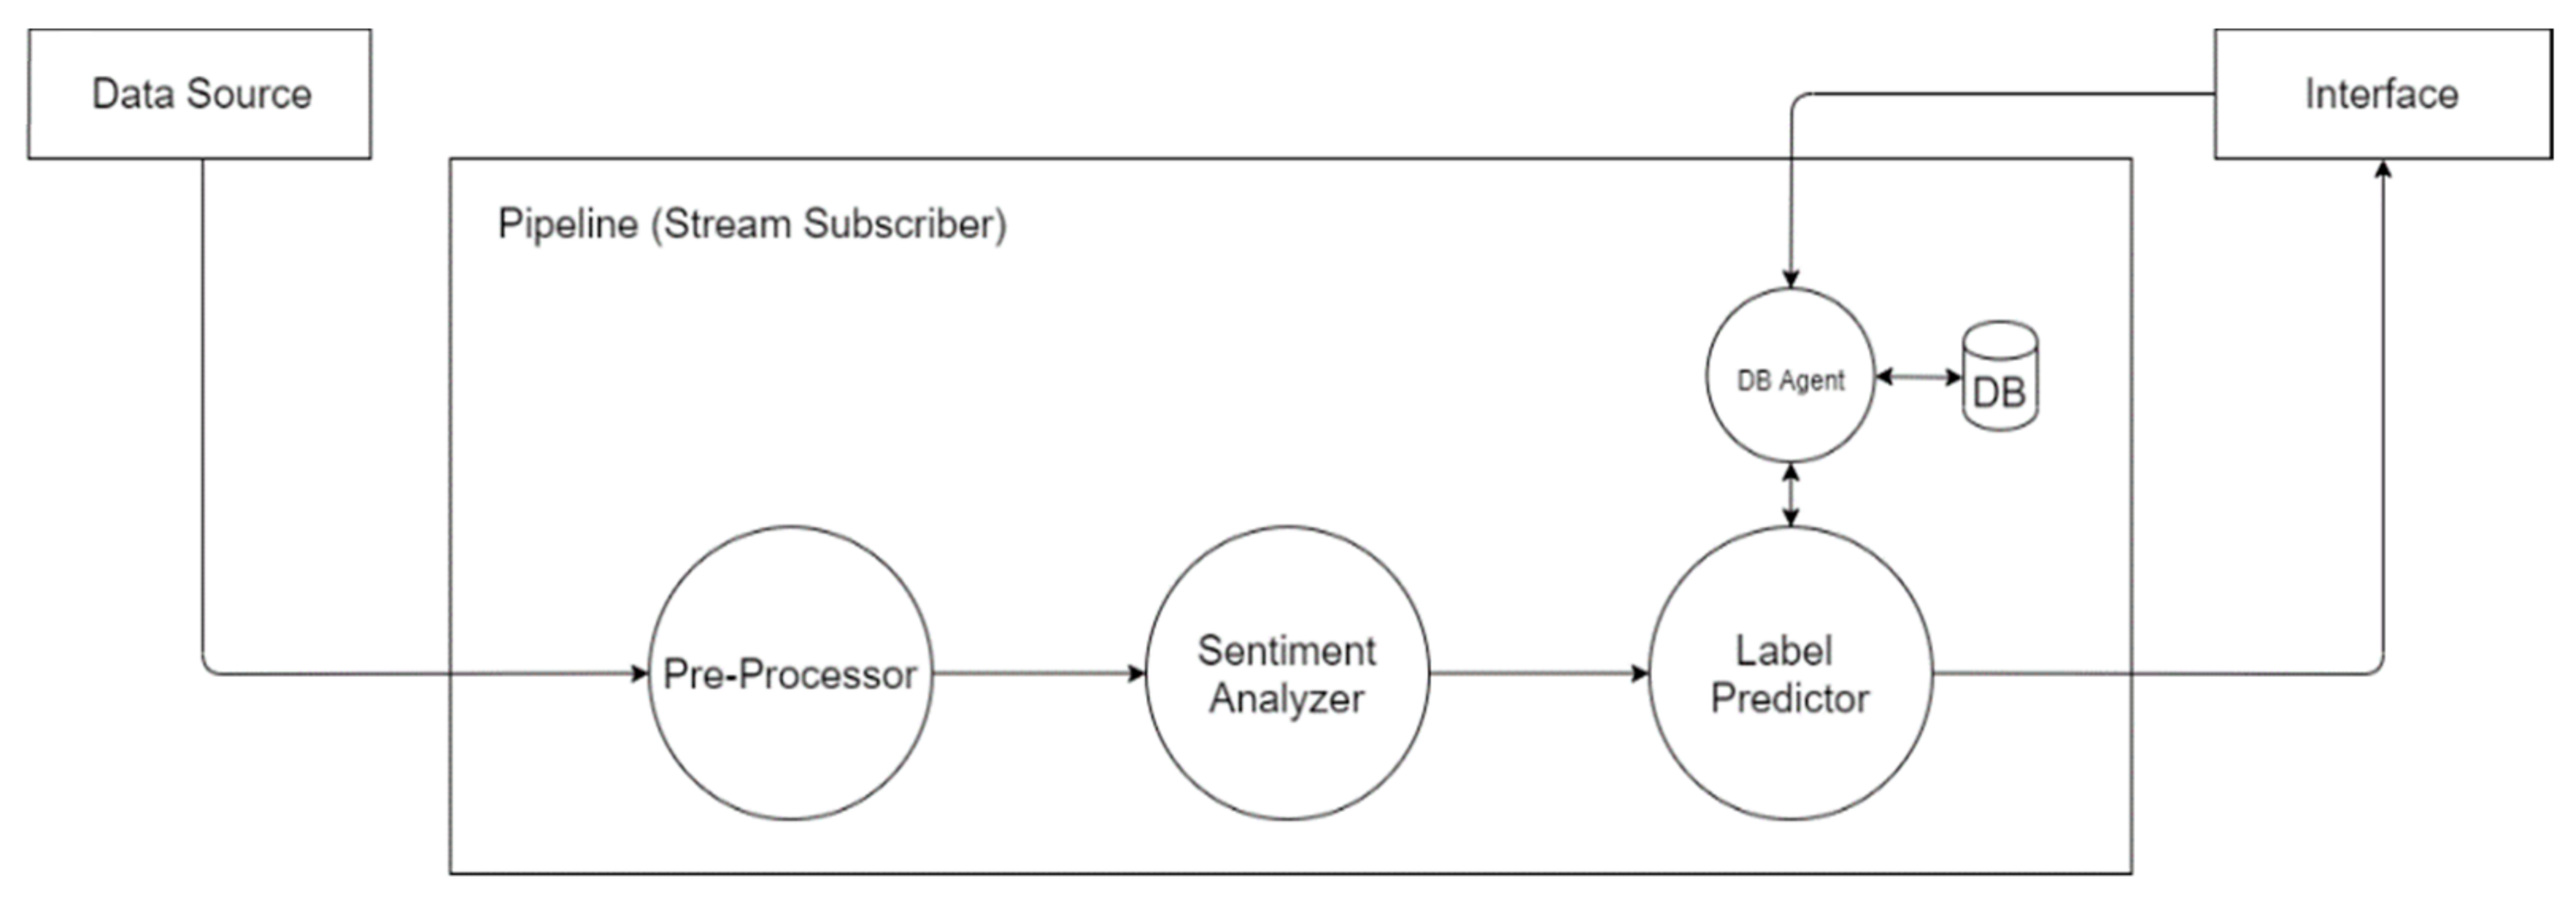
Design-wise we want each processing component (i.e., stage) in VARTTA’s pipeline to provide a variety of processing methods. Meanwhile, in order to maintain functionality and prevent overflows, each component must process its input within a time constraint. Therefore, each component must consist of subcomponents responsible for processing methods. For achieving non-blocking functionality, these subcomponents must act in parallel and be usable in a plug-and-play manner. Having such an architecture makes it easier to incorporate multiple data processing methods independently and without violating time constraints. Accordingly, a diagram of VARTTA’s abstract pipeline architecture is depicted in
Figure 1. This pipeline satisfies the aforementioned requirements by concatenating components as processing stages. Also, it enables real-time user interactions with ML methods and data processing components.
3.1.1. Pre-Processor
Tweet analysis methods may require different types of pre-processing and different preliminary filters to be performed on their input. Depending on the pre-requisites of inputs of proceeding components, the Pre-Processor component of VARTTA can edit and shape the content of tweets in various forms. For instance, some sentiment analysis methods can analyze a tweet’s image. In that case, a subcomponent in Pre-Processor must be implemented to check that the corresponding field for image in a tweet’s data is present and is not null. For the sake of simplicity, we only focus on textual analysis of tweets in VARTTA. Textual content often includes undesirable words (e.g., stop words) that are repeated frequently and are not necessarily useful in processing. Examples of such words are “the”, “and”, and “of”. Other types of undesirable words (e.g., dates or numbers) can be identified, removed, or edited depending on the domain of interest. The incoming tweet stream is already filtered by keywords. Therefore, only the non-uniform textual content must be handled prior to processing. For this aim, requirements of NLP methods that are used in the proceeding components of VARTTA’s pipeline must be considered. Some of these methods handle stop words internally while some require the input text to be free of such words. Considering these requirements, only one subcomponent is sufficient in Pre-Processor and the rules for it to remove stop words are described in
Table 1.
3.1.2. Sentiment Analyzer
Various state-of-the-art sentiment analysis methods exist in the literature; depending on need, different methods can be used. Since one of the research questions of this paper is to examine how flexible and scalable it is to make use of various ML techniques and methods, we implemented five sentiment analysis methods as subcomponents in VARTTA’s pipeline. The list and description of each method can be seen in
Table 2. Each subcomponent processes the data independently, and access type, accuracy, and analytical approach for each of these methods are different. Some of these methods have their own advanced pre-processing mechanisms. The pre-processed text resulting from the Pre-Processor component is the input to all subcomponents of the Sentiment Analyzer component (i.e., the sentiment analysis methods).
3.1.3. Label Predictor (Classifier)
As discussed in the Background section, a comprehensive analysis should consider three features of a tweet: (a) the topic of the discussion, (b) the group to which author of the tweet belongs, and (c) the theme of the tweet (i.e., summarized intentions). The topic of discussion can be determined by the search keyword(s) that acquired a tweet. It can also be determined by using more advanced NLP techniques to derive granular topics from textual content. For the sake of simplicity, we consider search keywords as topics. Group and theme are label classes that classifiers can predict for tweets based on their content. Depending on the context, ‘tweeter group’ can take on values such as media, general public, and governmental agencies. Likewise, ‘content theme’ can be educational, personal, and unrelated, among others.
Similar to previous components, the Label Predictor component of VARTTA also supports a plug-and-play mechanism by implementing different analytical methods as its subcomponents. Accordingly, six popular classifying methods in the ML literature are implemented as subcomponents of the Label Predictor component:
Long Short-Term Memory Model (LSTM)
Convolutional Neural Network (CNN)
Support Vector Machine (SVM)
K-Nearest Neighbors (KNN)
Random Forests (RF)
Multilayer Perceptron (MLP)
A list of the features used to train these models can be found in
Appendix B. Another classifying method, named ‘customized’, is also implemented to attach labels to tweets (content themes) and their authors (tweeter groups) based on their similarity to previous suggestions made by analysts using VARTTA. These suggestions get stored in an internal database with a database manager (agent) as depicted in
Figure 1. Using this classifying method, heuristic suggestions provided by analysts will be taken into account.
The aforementioned methods are implemented using Scikit-learn [
71] and Tensorflow [
72] libraries in Python. Technically, they are implemented as external APIs and are not part of VARTTA’s server. However, communication with these subcomponents is made through HTTP endpoints; hence, conceptually, it seems as if they are running as VARTTA’s subcomponents. Each subcomponent listens on a specific endpoint and, by emitting the tweet to that endpoint, predicts and returns the class labels. This allows developers to offload computational requirements to and make use of a more powerful server and a distributed architecture.
3.2. Interface Design
Using the proposed pipeline, VARTTA’s interface component is always connected to the processed data stream and, therefore, is always being updated. Accordingly, the interface’s elements (e.g., data visualizations) must be reactive to incoming data and get updated dynamically. Visual monitoring, anomaly detection, and predictive analyses are the main analytics goals of VARTTA. Accordingly, interactions with visual elements must take into account the ability to communicate with the stream publisher (i.e., the server). VARTTA’s interface is comprised of three main screens (i.e., subcomponents): Analytics, Compare, and Shuffler. Analysts can go back and forth between these screens. In order to increase quality of the interactions, VARTTA must preserve the current state of each screen. This is intended to reduce the cognitive load resulting from visual discontinuity of the back-and-forth movement between screens. Details of VARTTA’s interface, a Progressive Web App, implemented using Vue.js and Nuxt.js libraries, are discussed in the following sections.
3.2.1. Analytics Screen
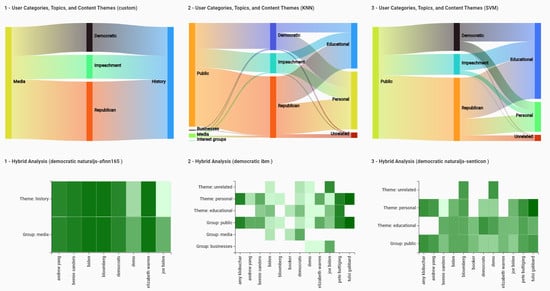
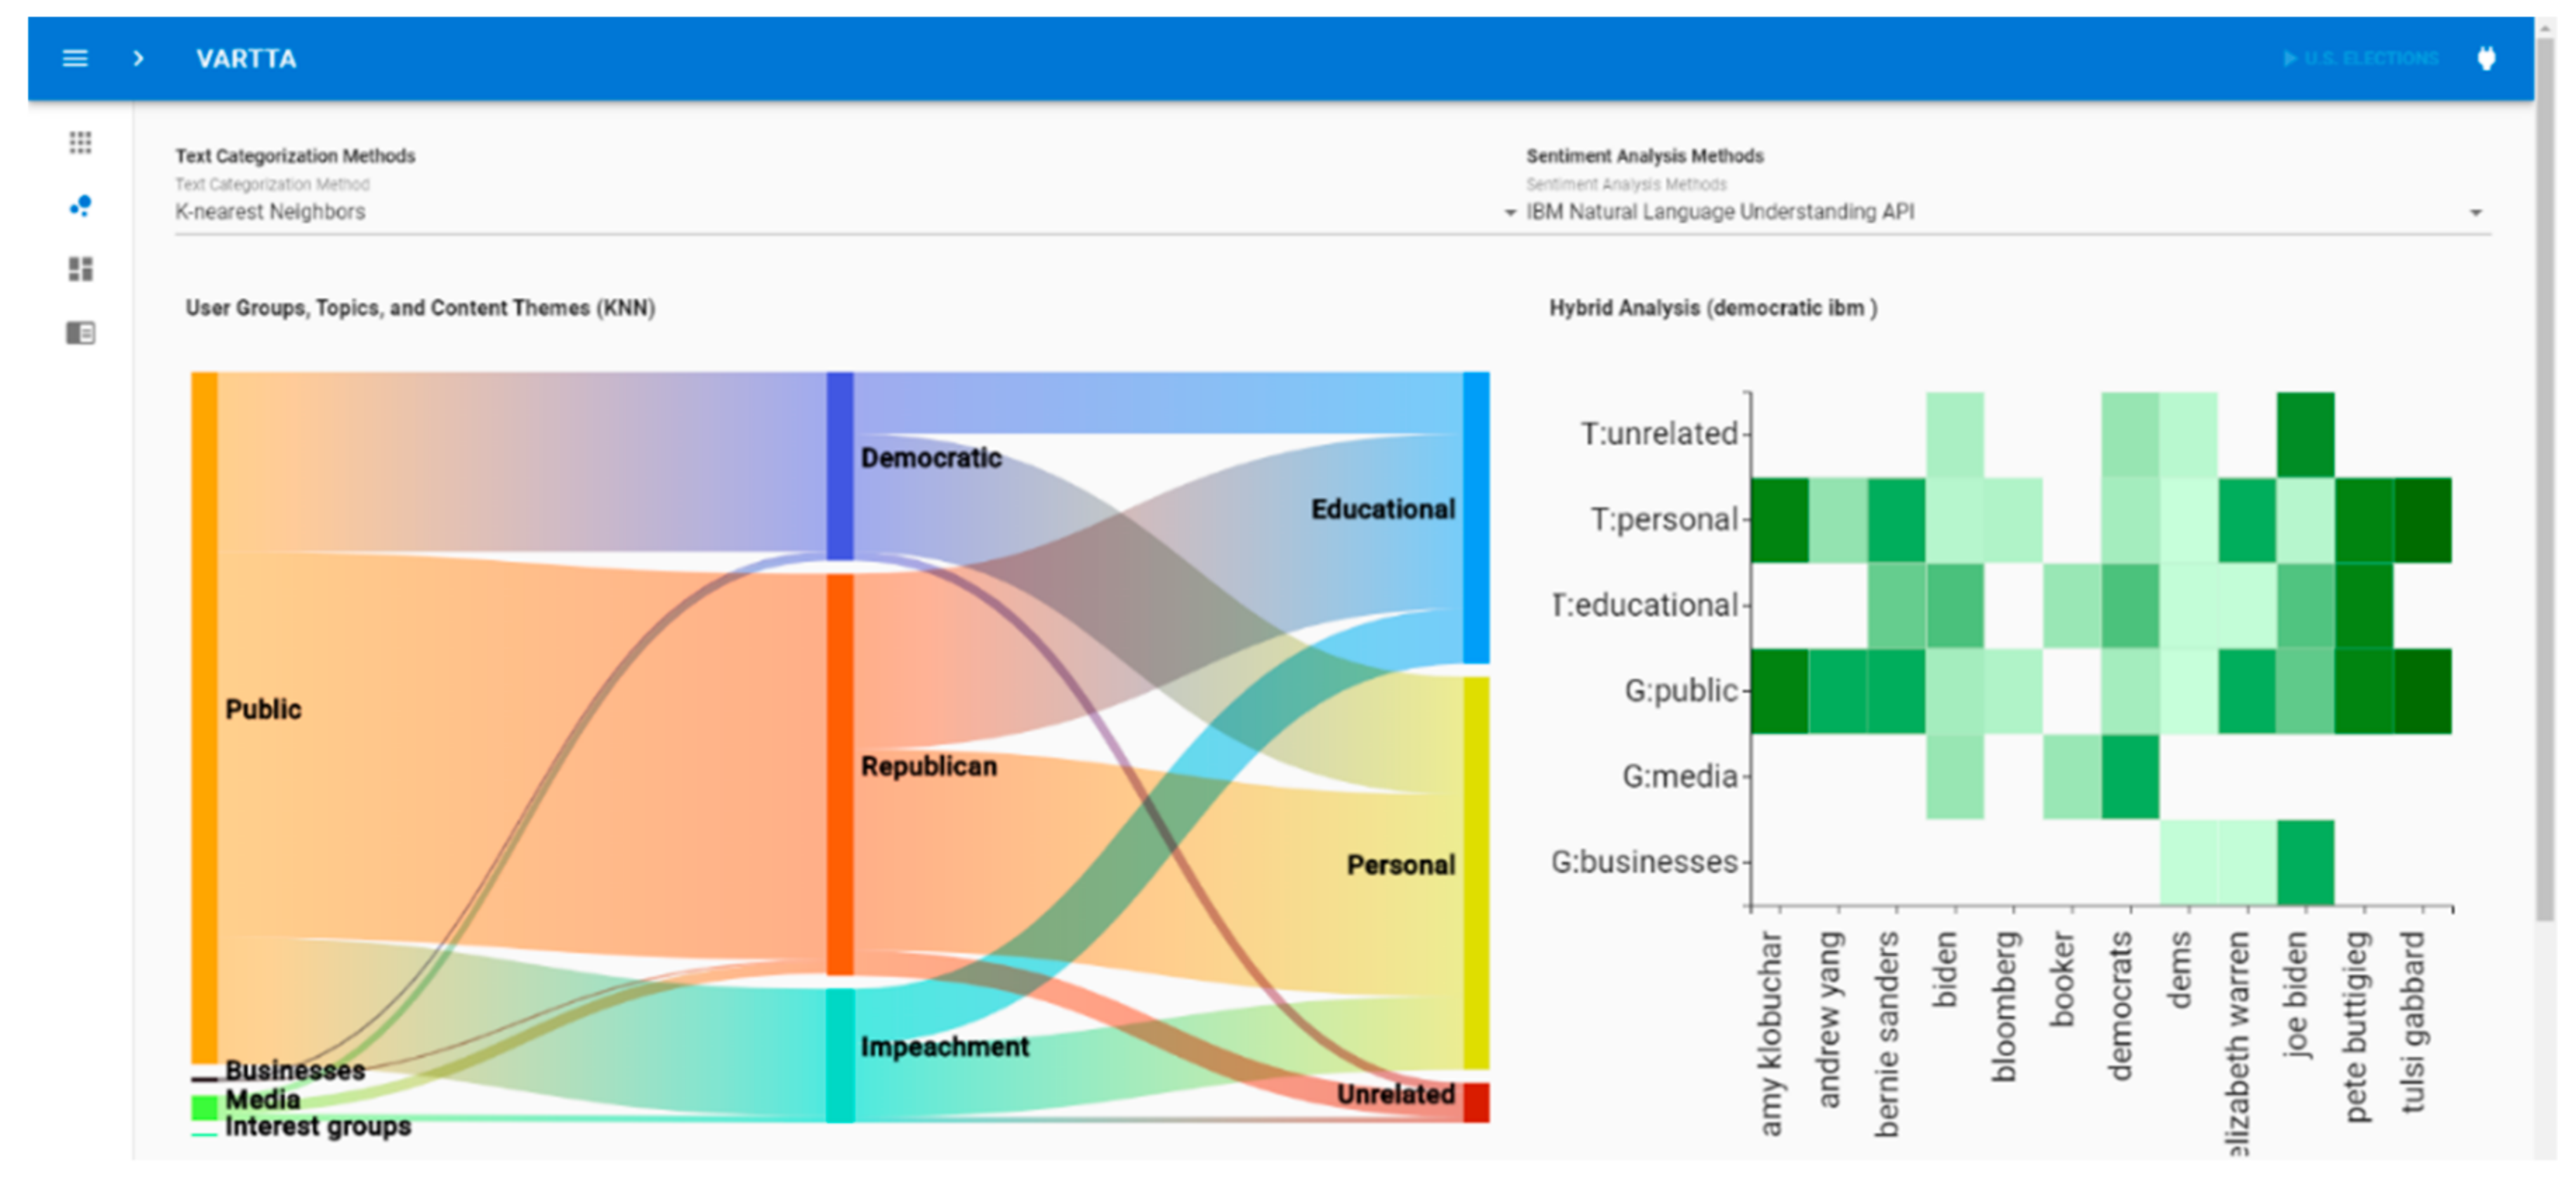
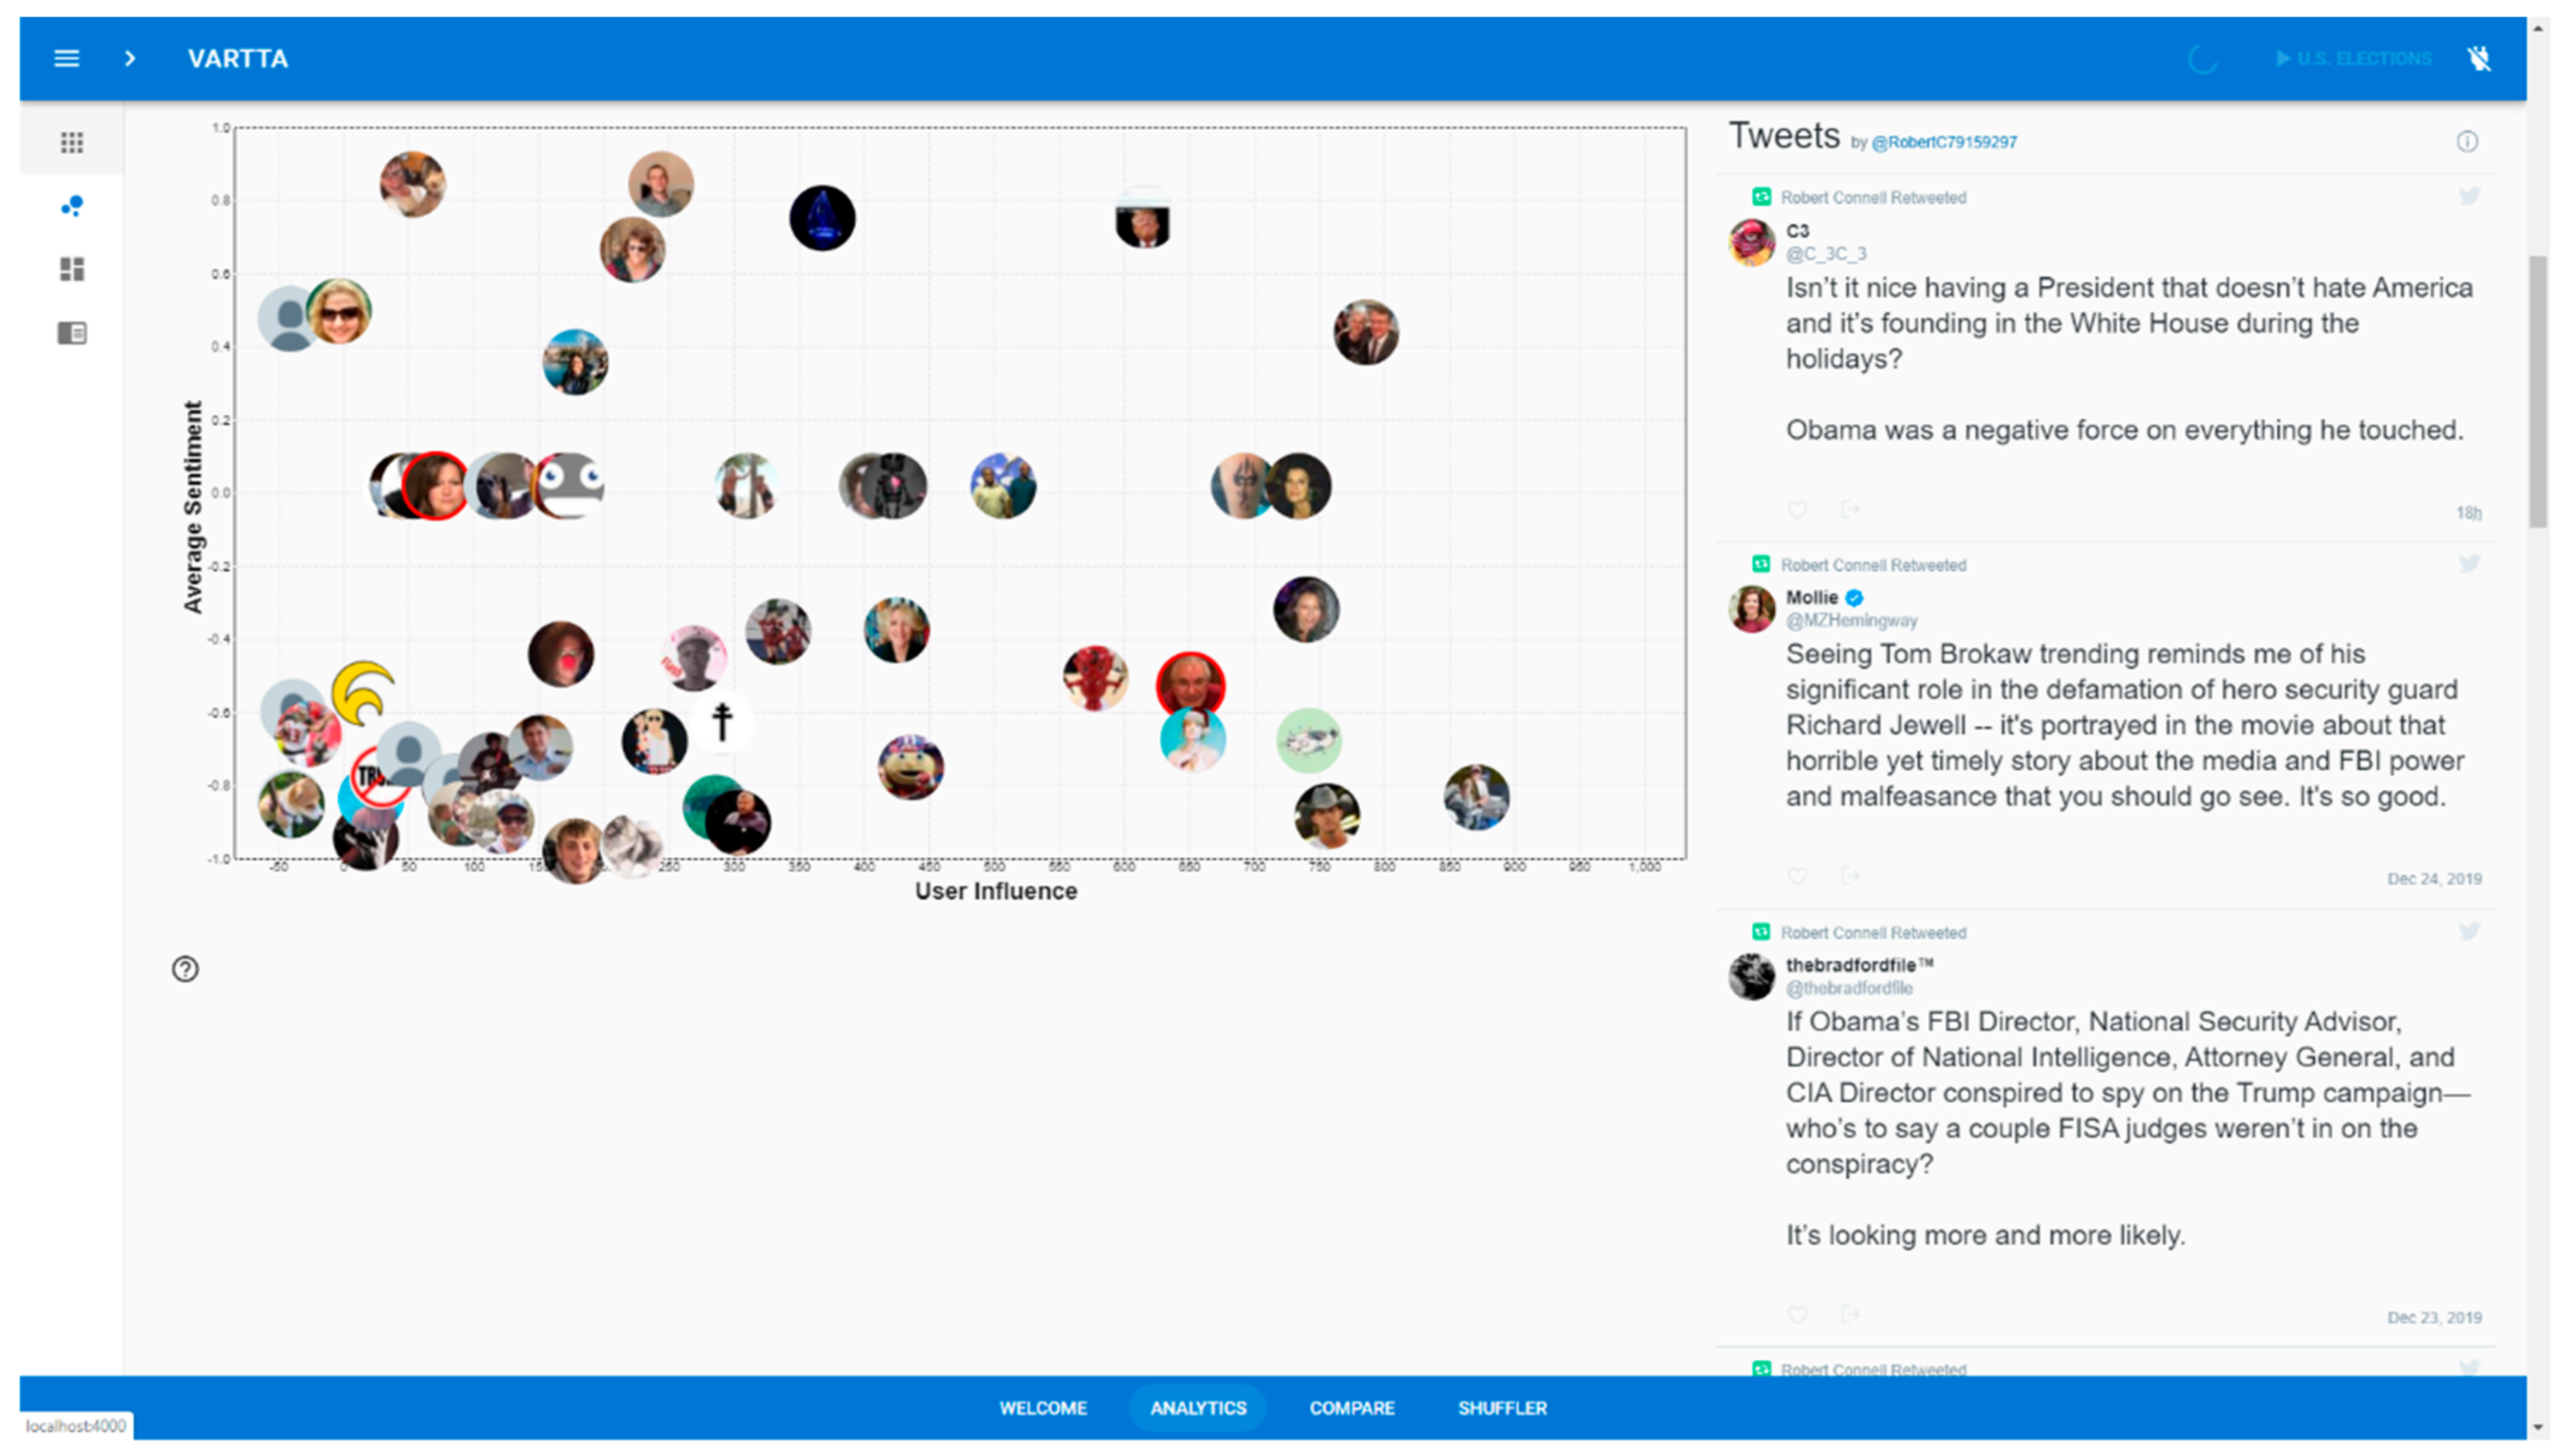
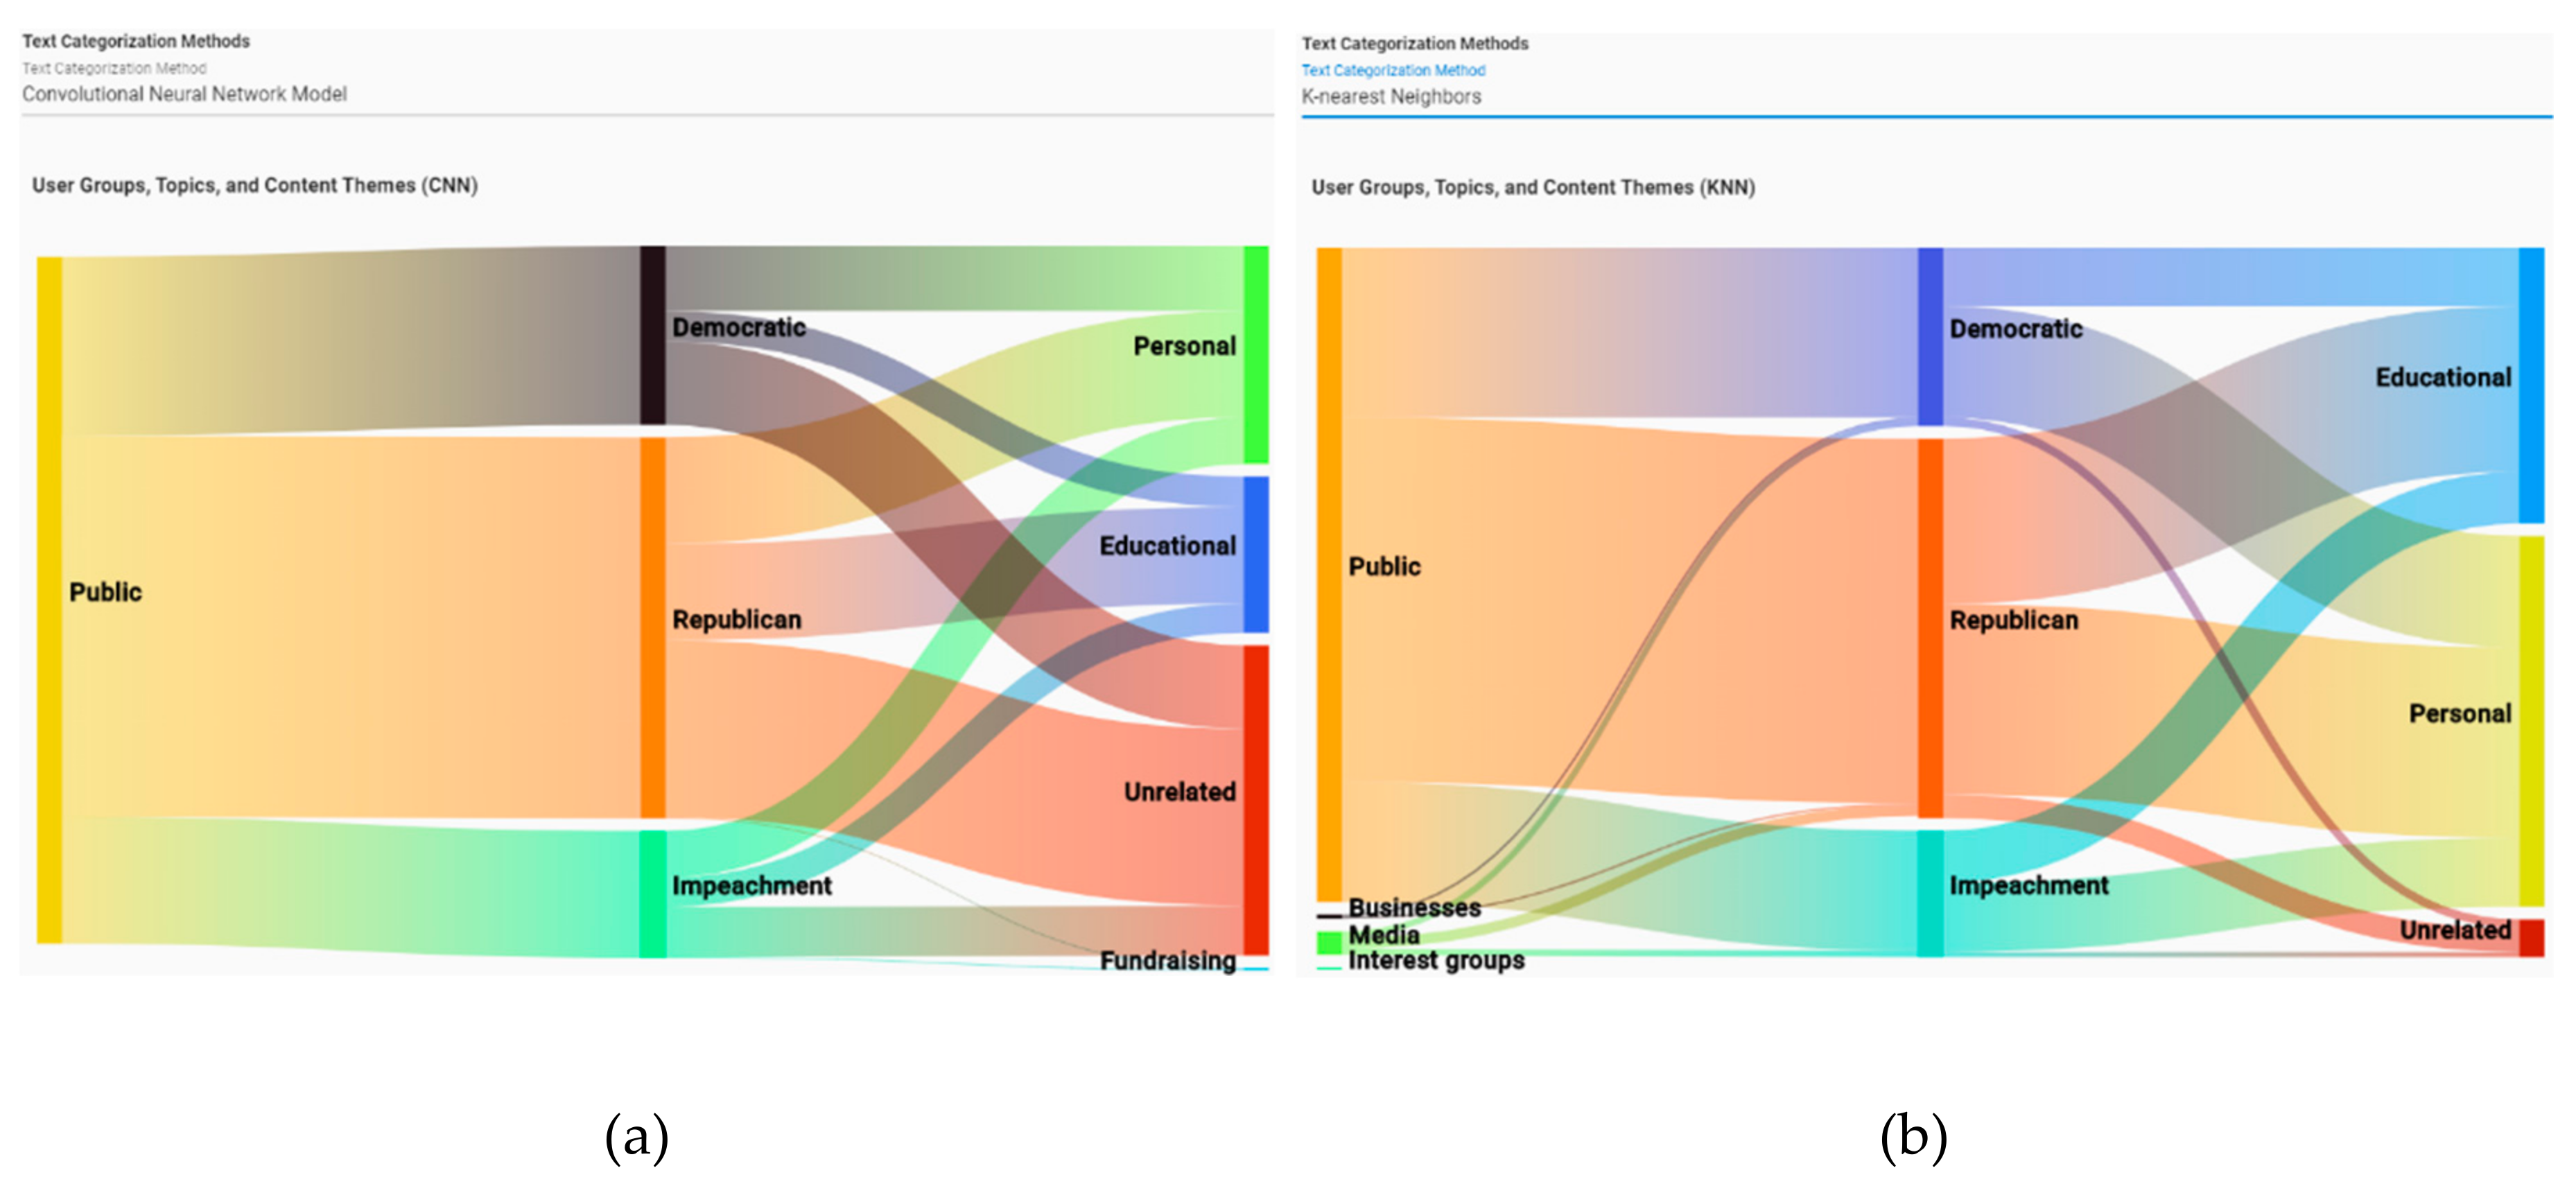
Figure 2 and
Figure 3 show the Analytics screen of VARTTA. This screen includes two menus and four visual components. Using dropdown menus, users can select from among the provided analytics methods. This selection affects the visual representations of this screen (i.e., Sankey Diagram, Heat Map, Scatter Plot, and Tweet Collection). Sankey Diagram represents the proportion of tweeter categories and content themes involved in each topic. It helps users to visually monitor Twitter’s information space and gain an understanding of the underlying volume of users and their intentions under each subtopic. This screen makes the performance of this task possible without forcing analysts to go through all of the tweets posted under each topic. To help with better identification, tweeter groups, topics, and content themes are color-coded.
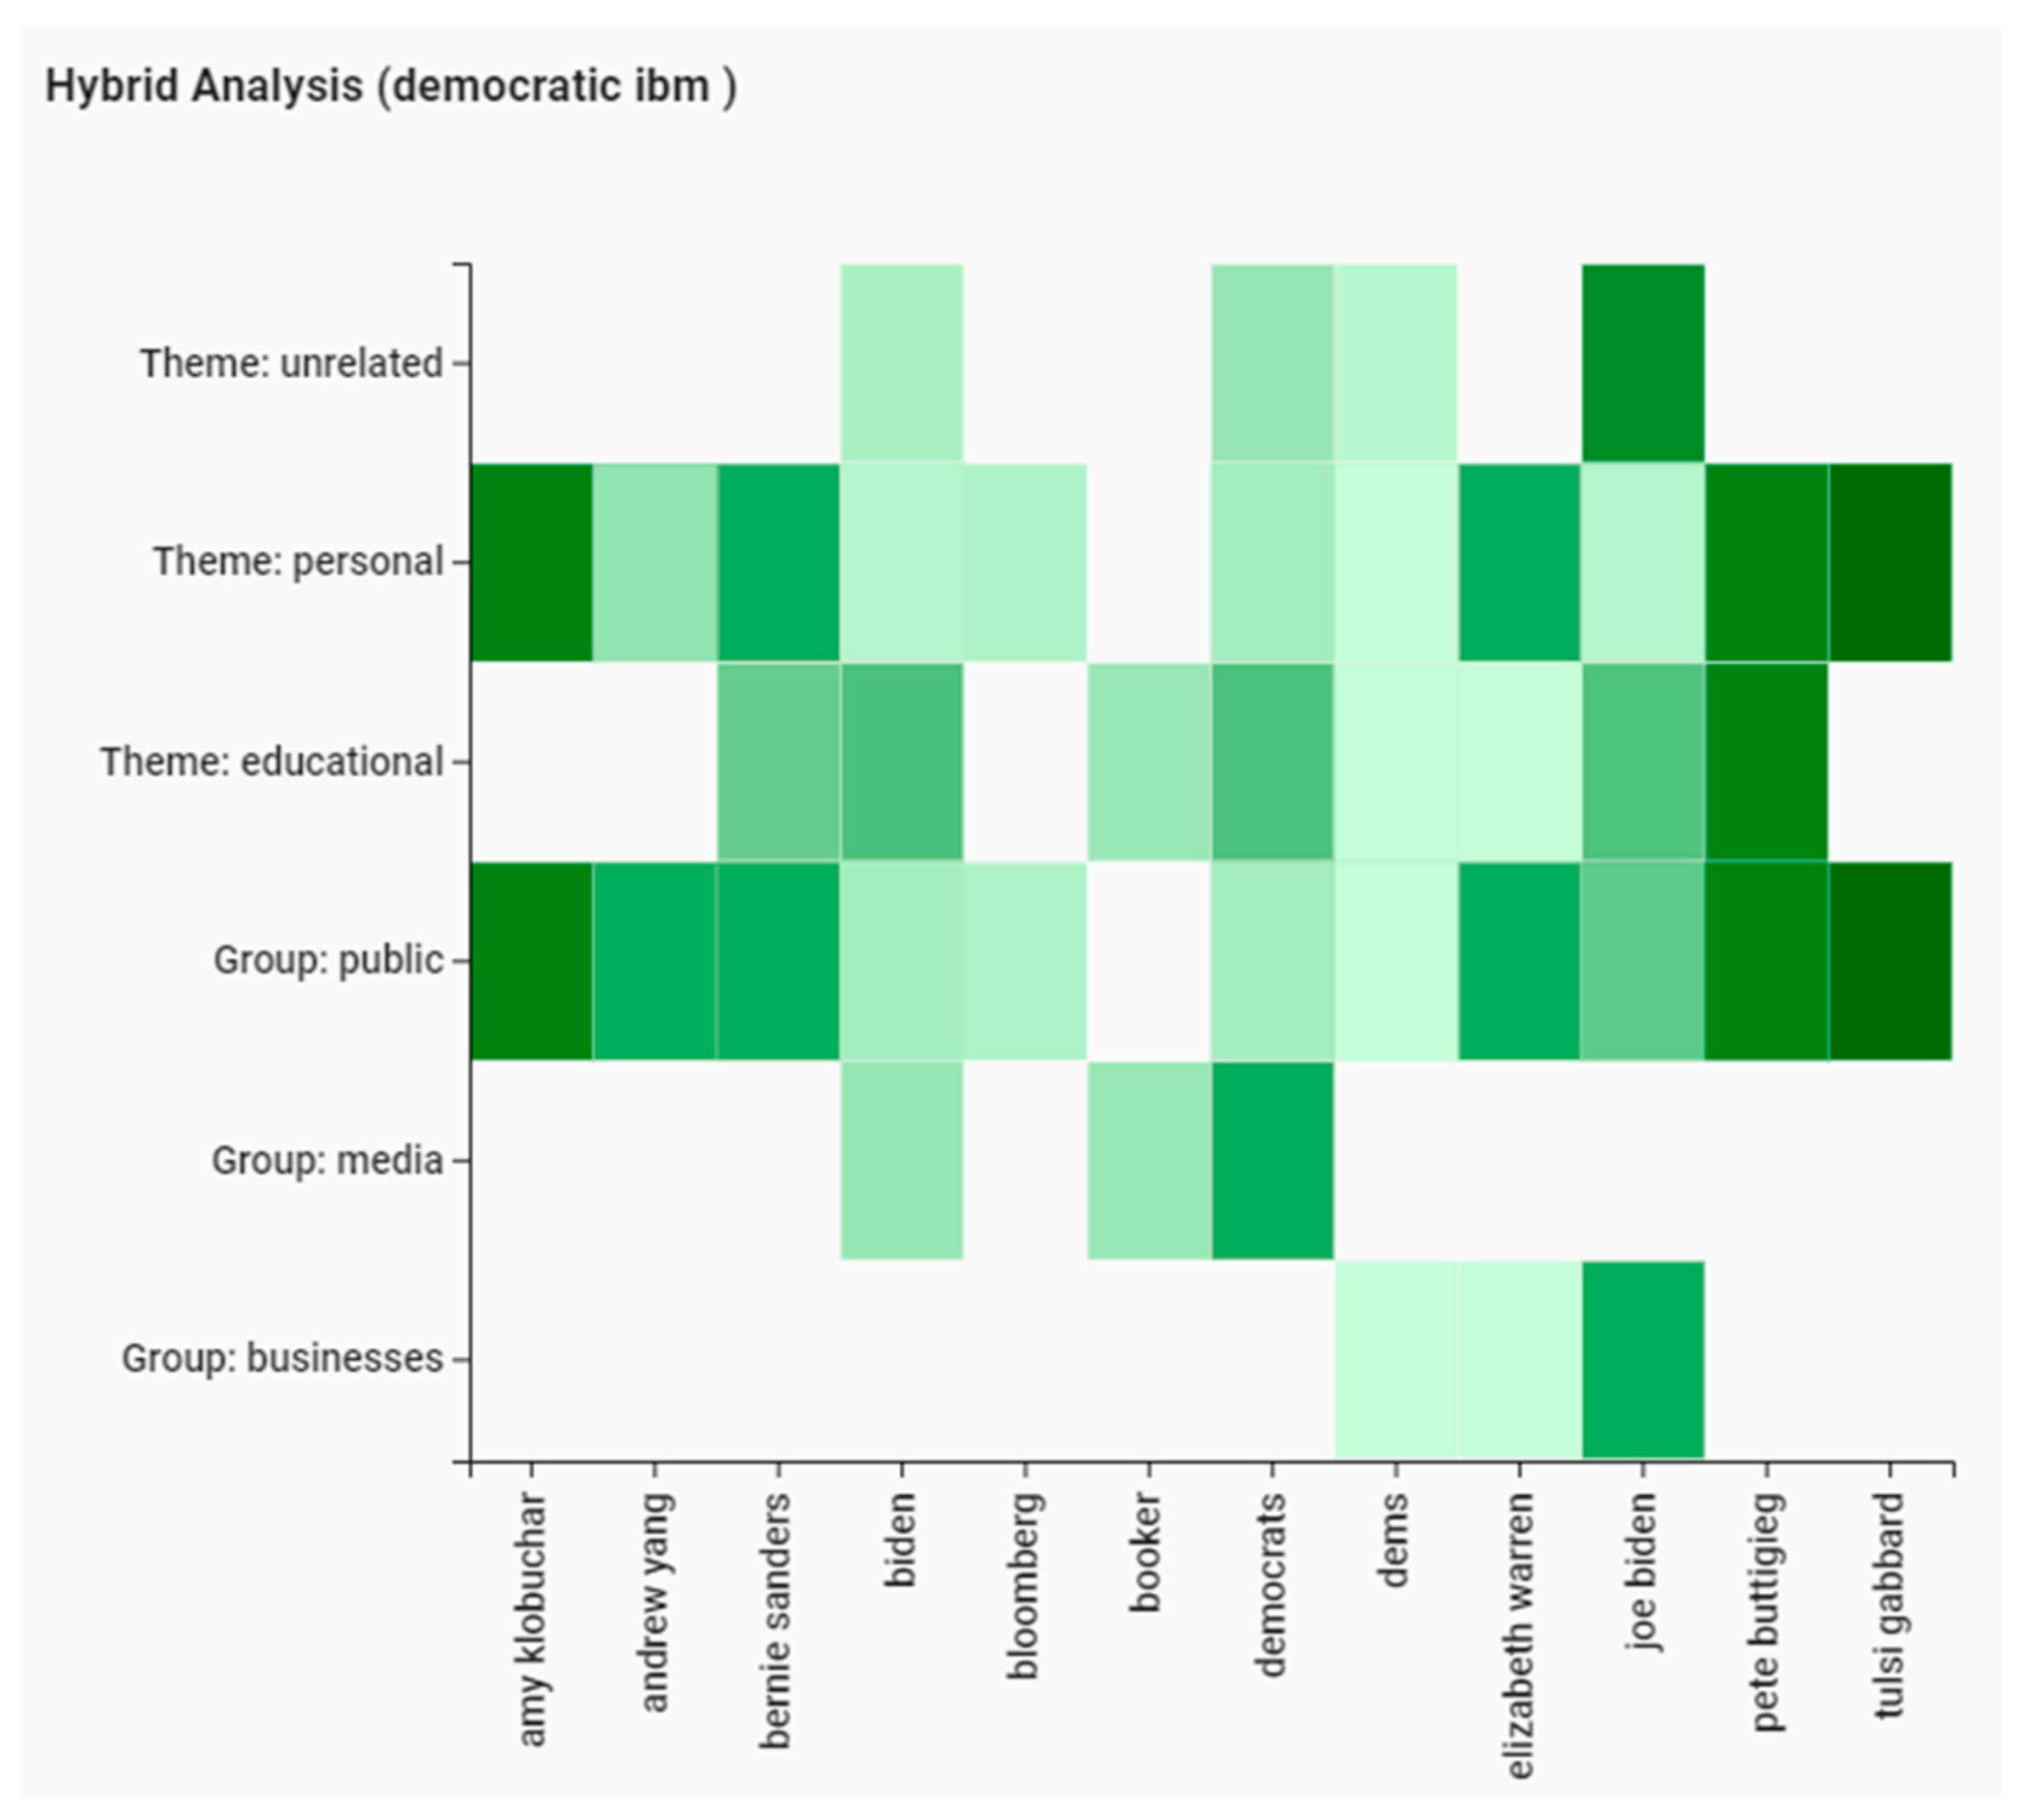
Selecting a text classification method along with a sentiment analysis method fills Heat Map, next to Sankey Diagram. Each cell in Heat Map encodes average sentiment of the tweets of a tweeter group or a content theme (listed along the vertical axis) against its related subtopic (listed along the horizontal axis). The goal of this visualization is to enable analysts to perform hybrid analyses (see
Figure 4).
It should be noted that, in some tweeter groups or content themes, there might be no tweets from a subtopic, resulting in a blank cell in the Heat Map.
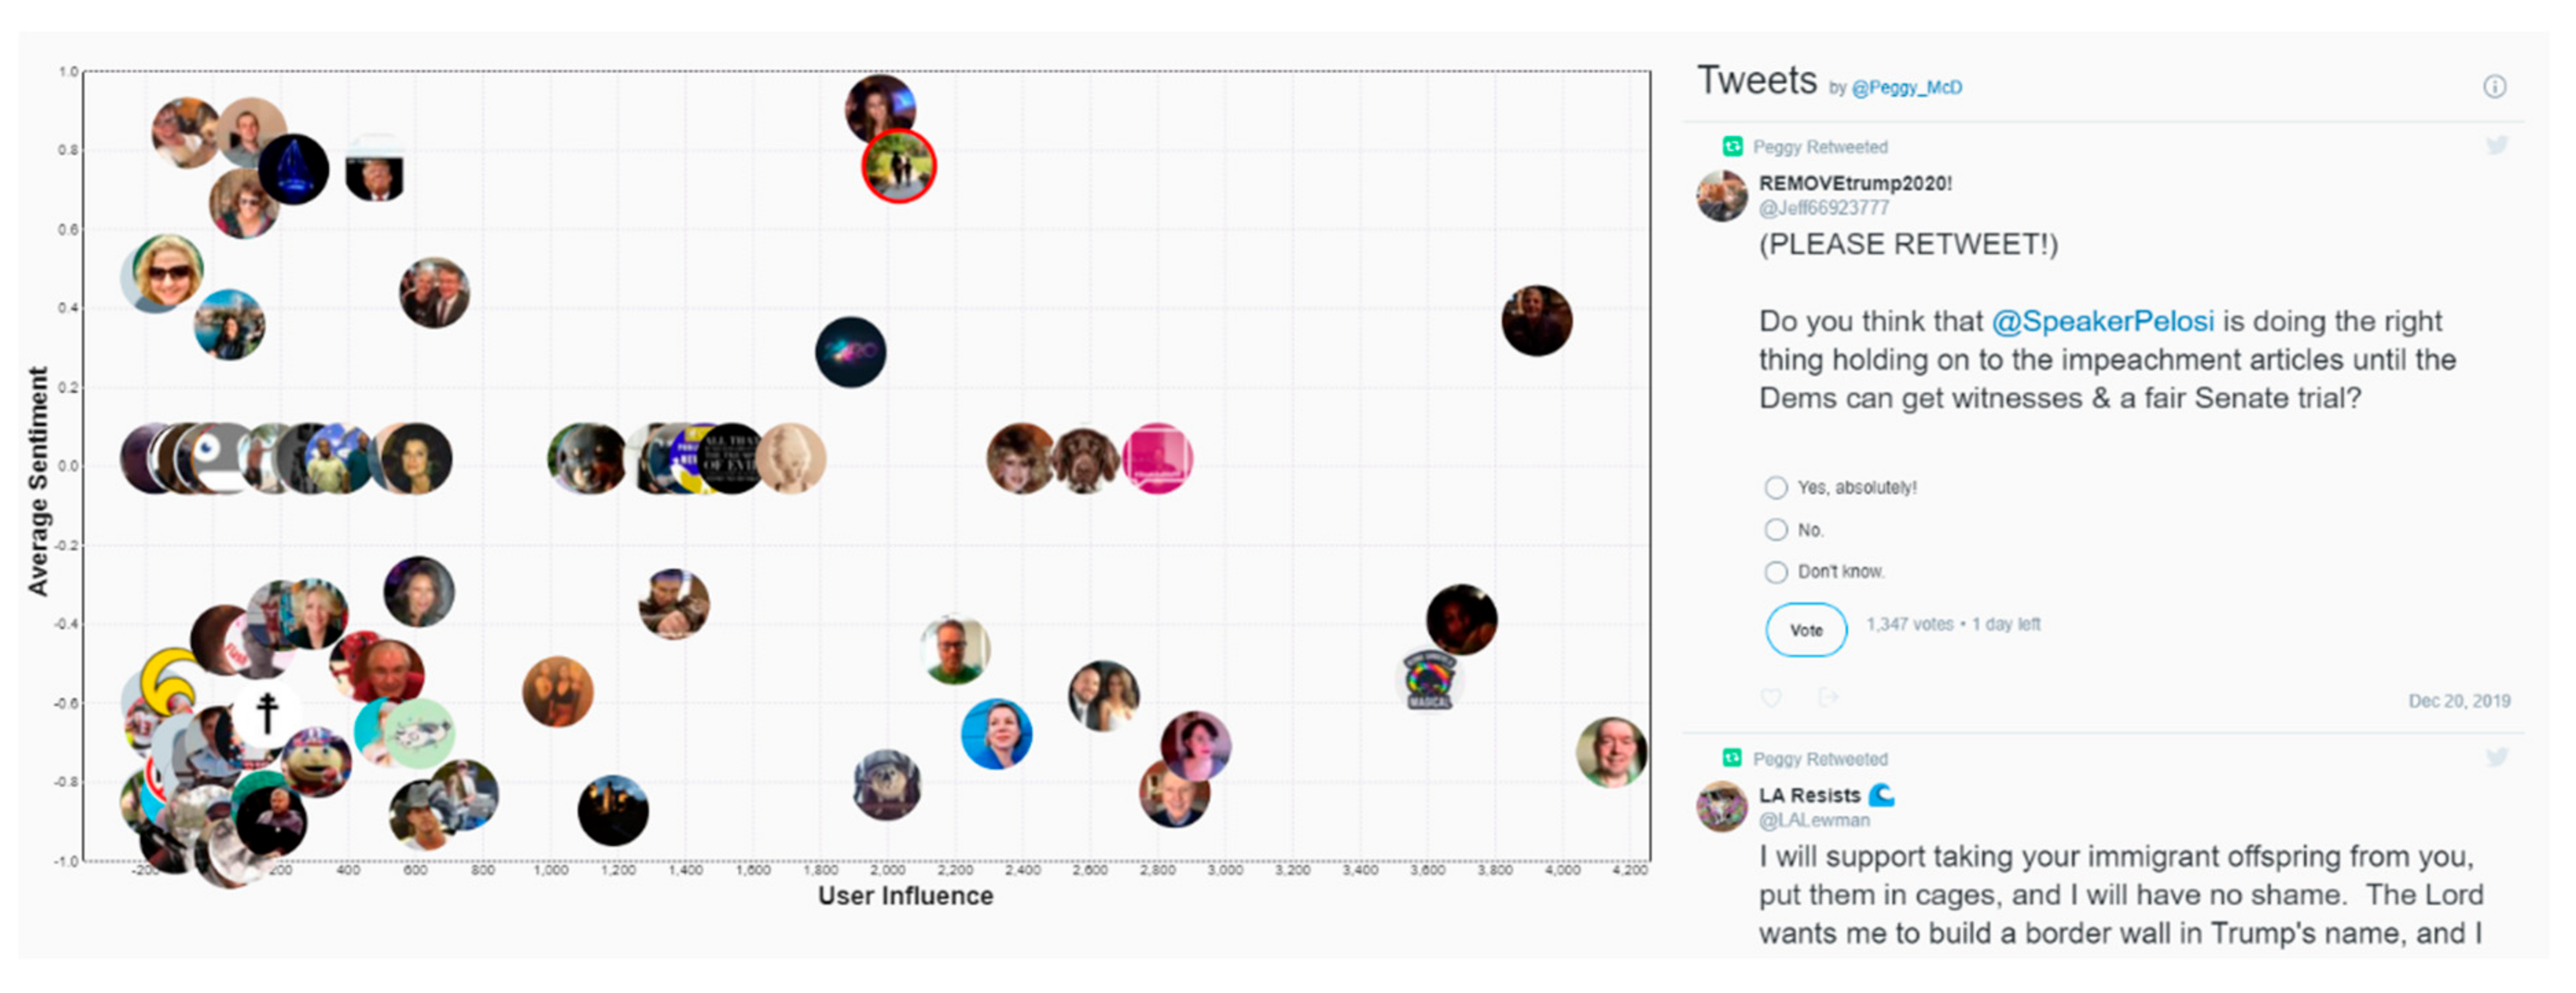
Selecting the sentiment analysis method results in changes in Scatter Plot. Each item on this plot represents a tweeter (i.e., a tweet author). The vertical and horizontal axes represent average sentiment and tweeter influence values, respectively. Tweeter influence,
, is determined using the following formula:
Selecting a tweeter icon displays a collection of the tweeters’ recent tweets (collections on the right-hand side of Scatter Plot). This way, VARTTA’s users can drill down on authors to acquire background knowledge about them and/or identify major influencers of discussions. This can familiarize VARTTA’s users with tweeters and help in a predictive analysis in conjunction with the Shuffler screen.
3.2.2. Compare Screen
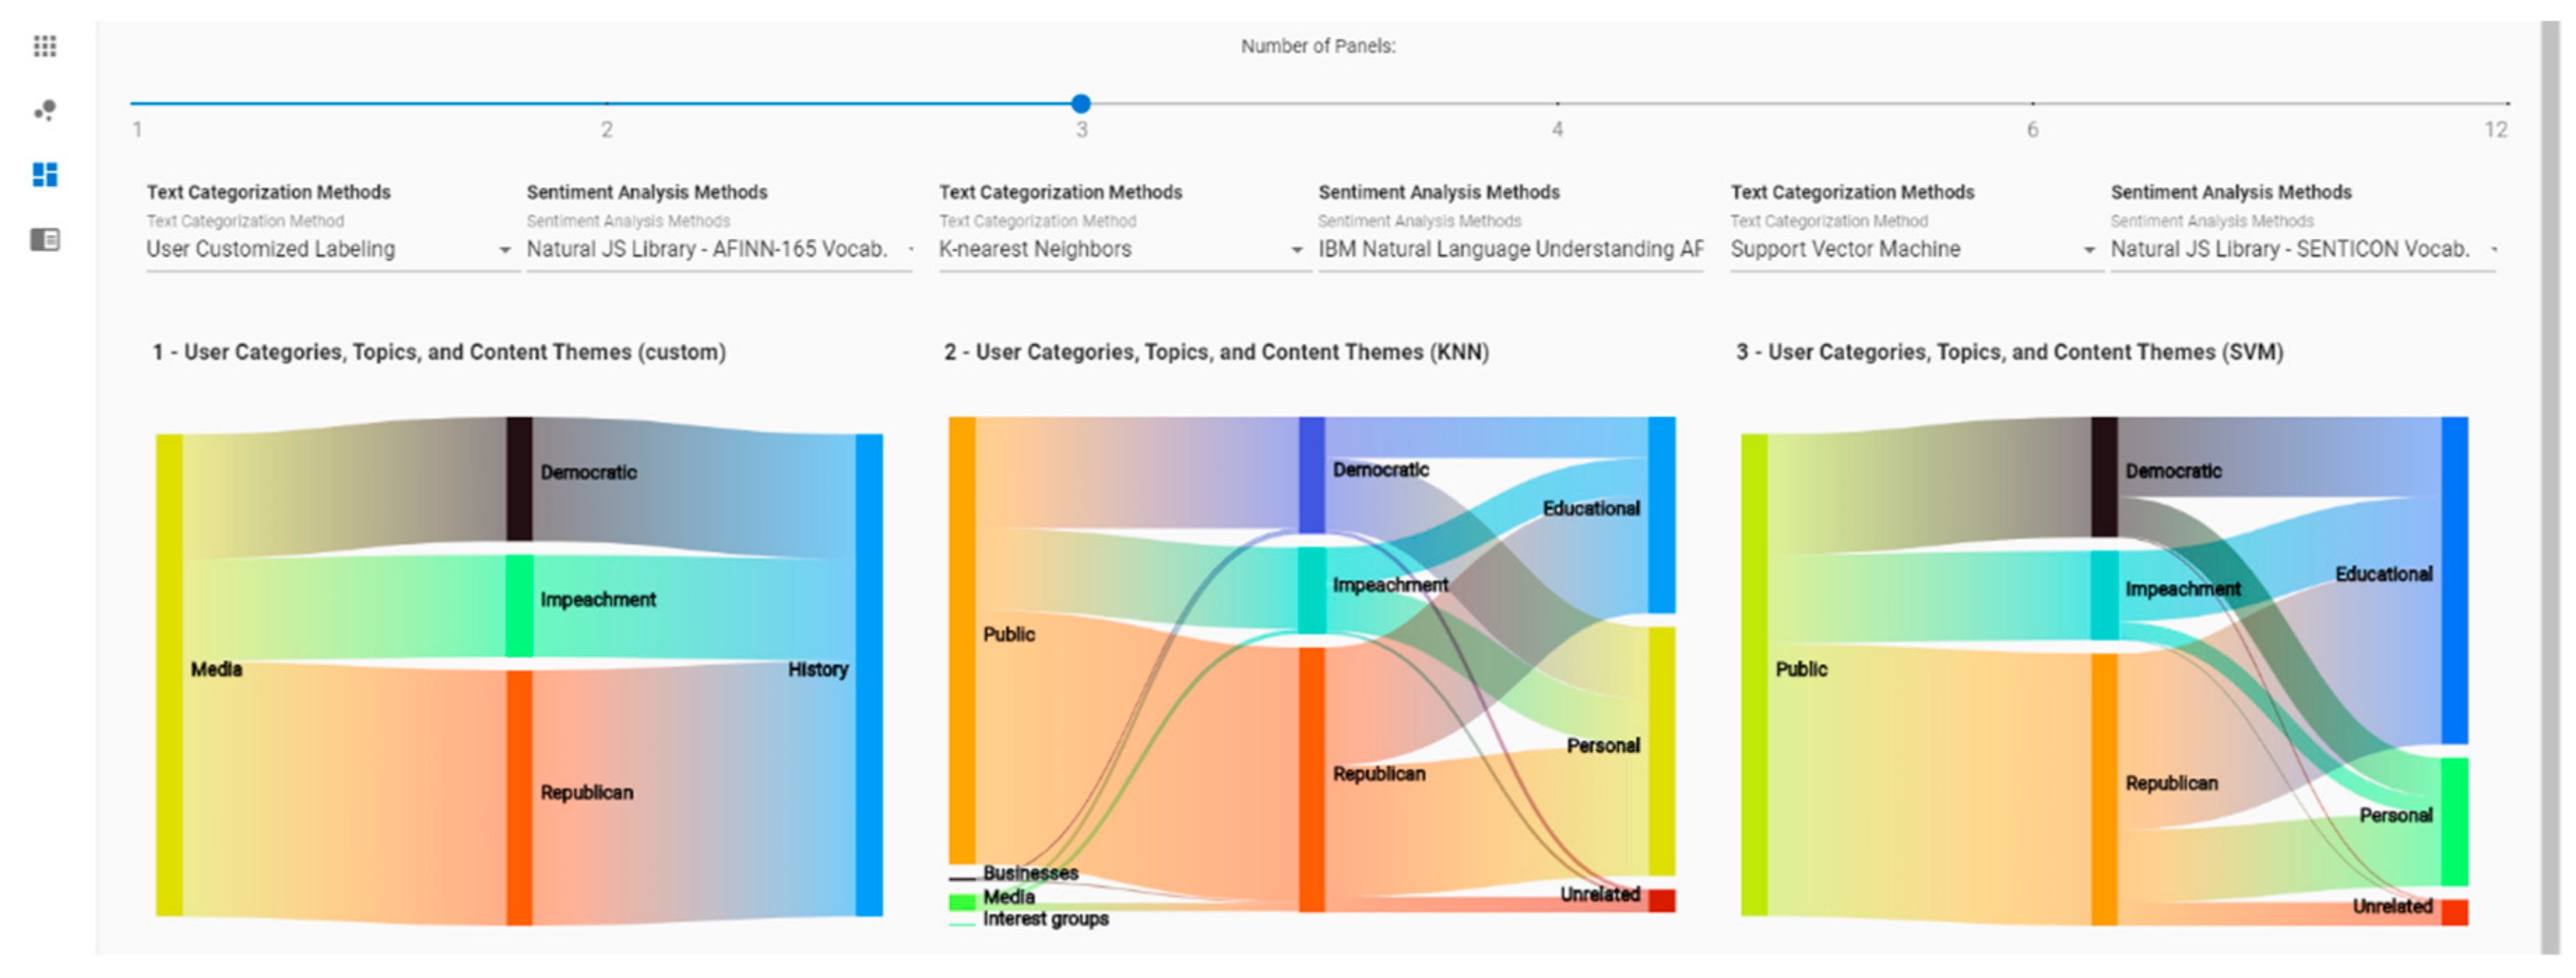
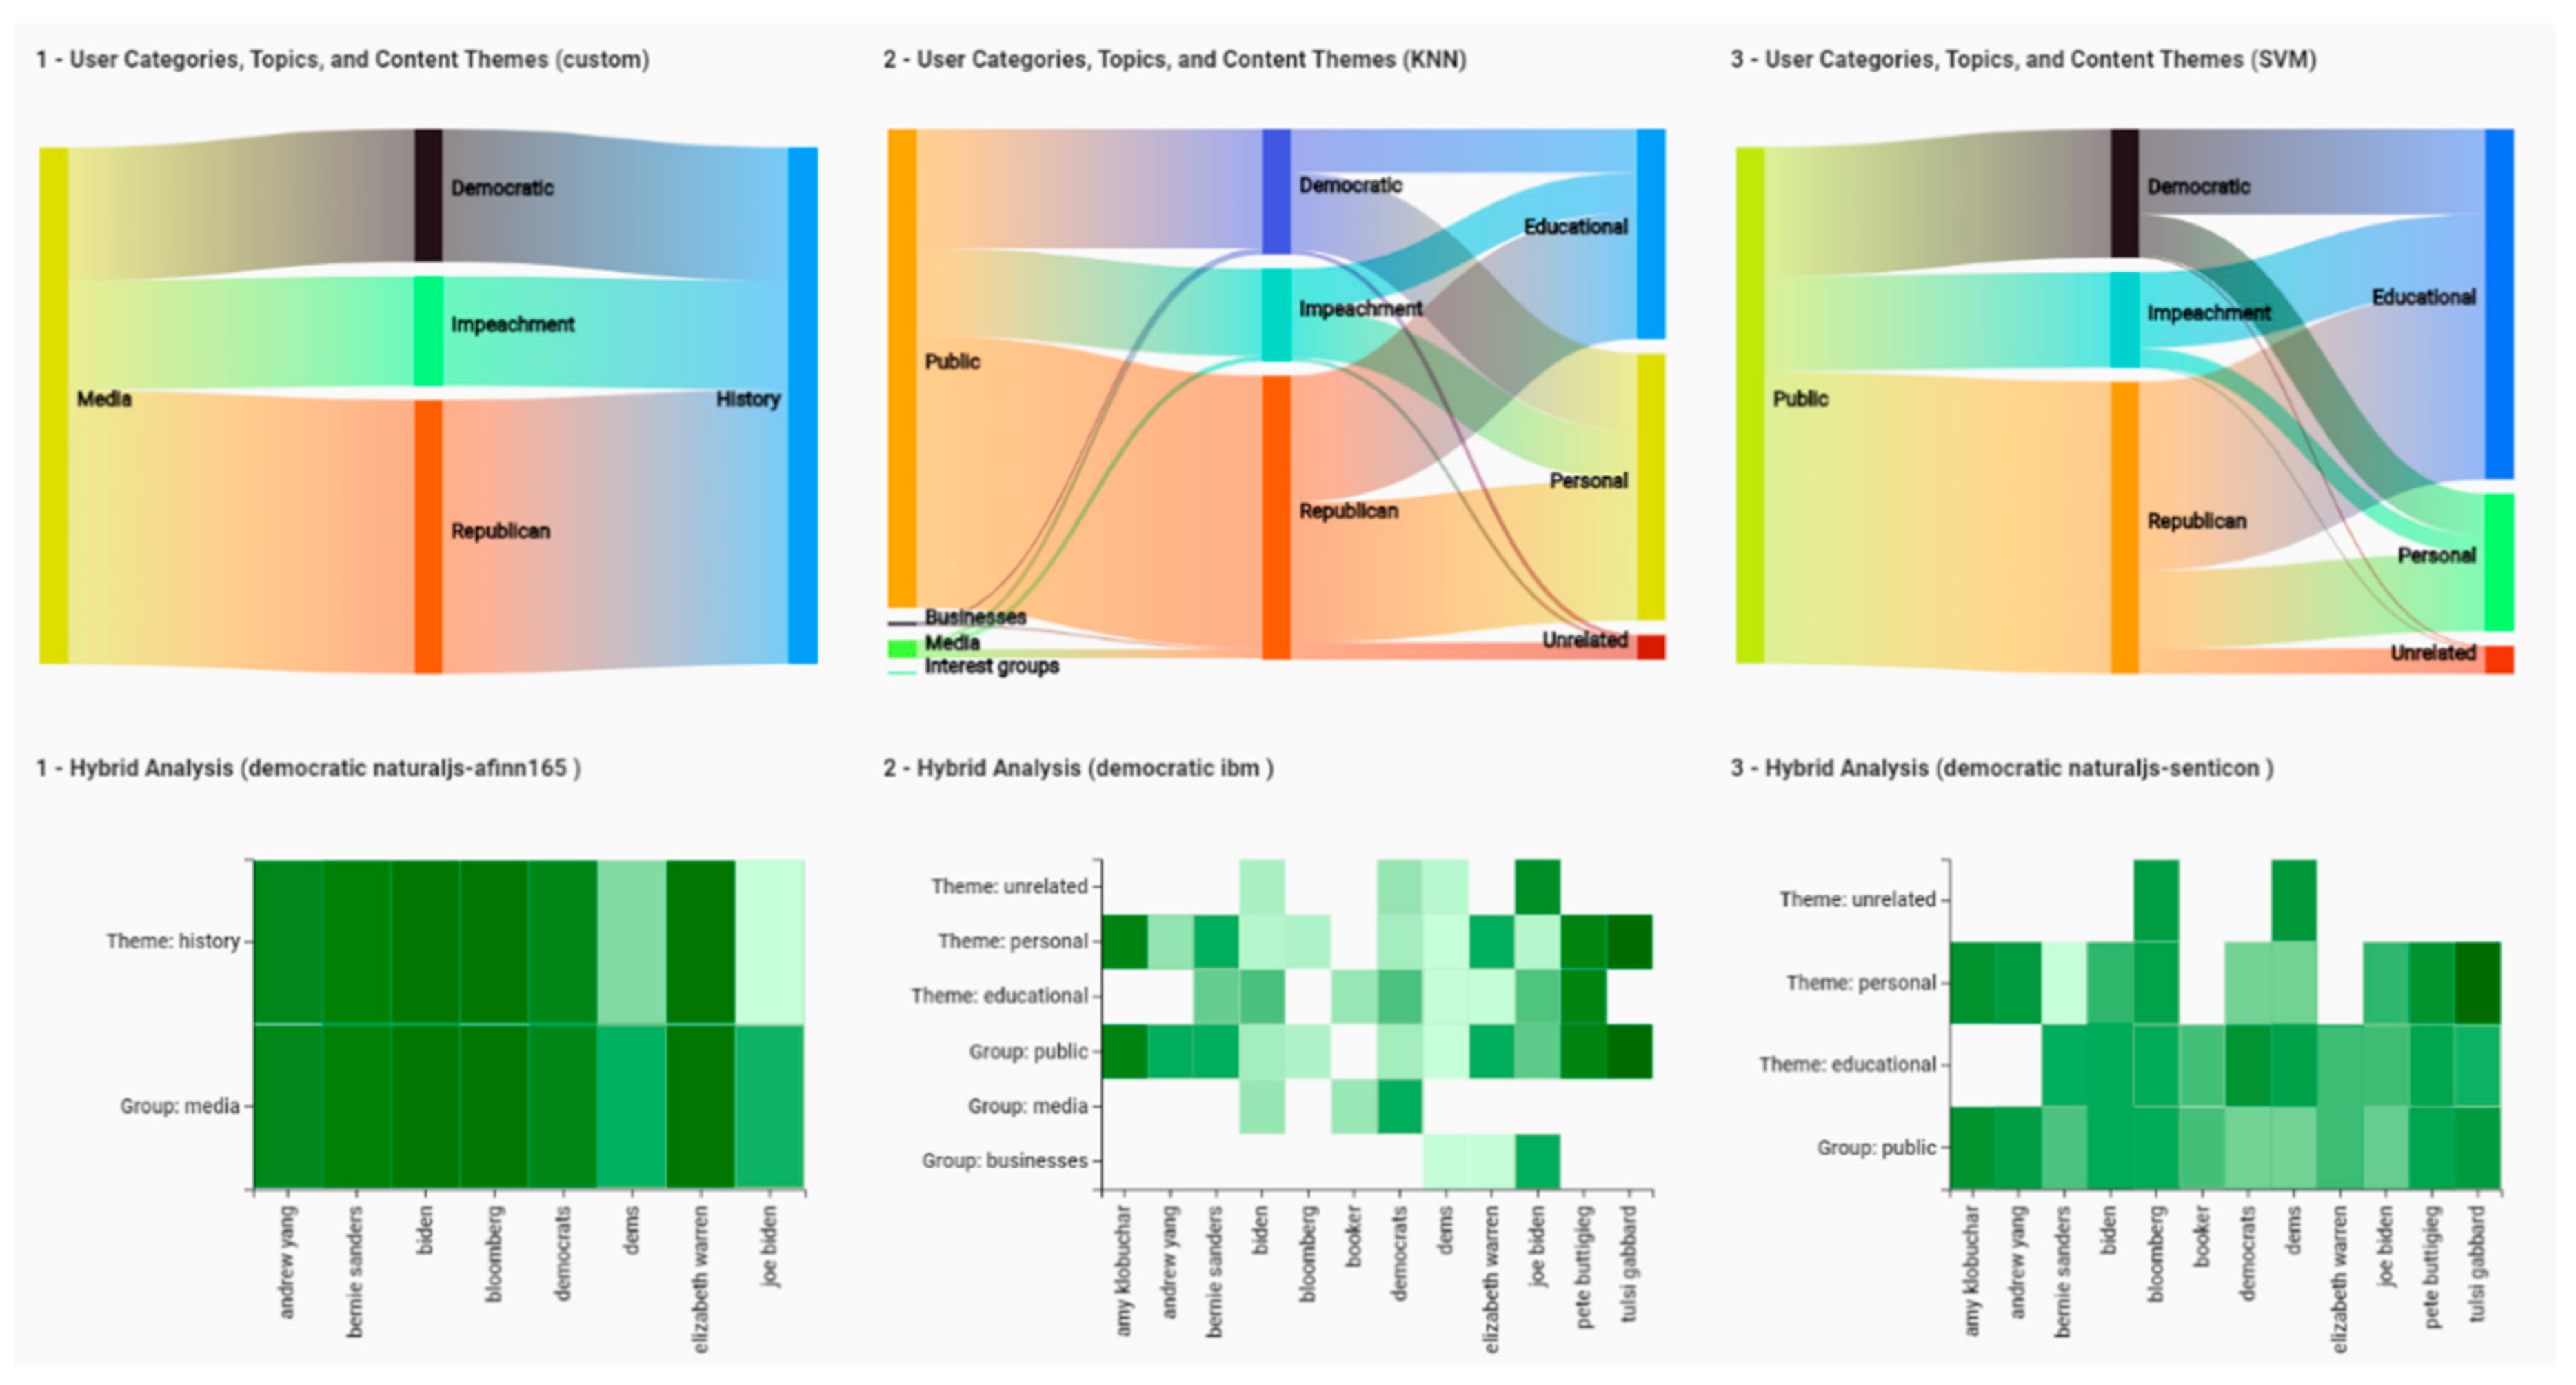
Figure 5 and
Figure 6 shows the Compare screen of VARTTA. This interface component enables analysts to compare and contrast results of different analytics methods. The number of methods to compare can be set using an adjustable control on top of the screen (see
Figure 5). Afterwards, the methods to compare can be selected. This results in the side-by-side display of instances of Sankey Diagram and Heat Map (see
Figure 6). The juxtaposition of results of different methods can provide analysts with a richer mental model of analytical methods. Furthermore, it can and help analysts in detecting anomalies and observing differences among various analytical methods. This screen can also help users in verifying analytical models resulting from these methods in real-time scenarios and in different contexts. As can be deduced, real-time updates of visualizations in this screen can facilitate more effective analysis by VARTTA’s users. This feature is one of the core contributions of this research.
3.2.3. Shuffler Screen
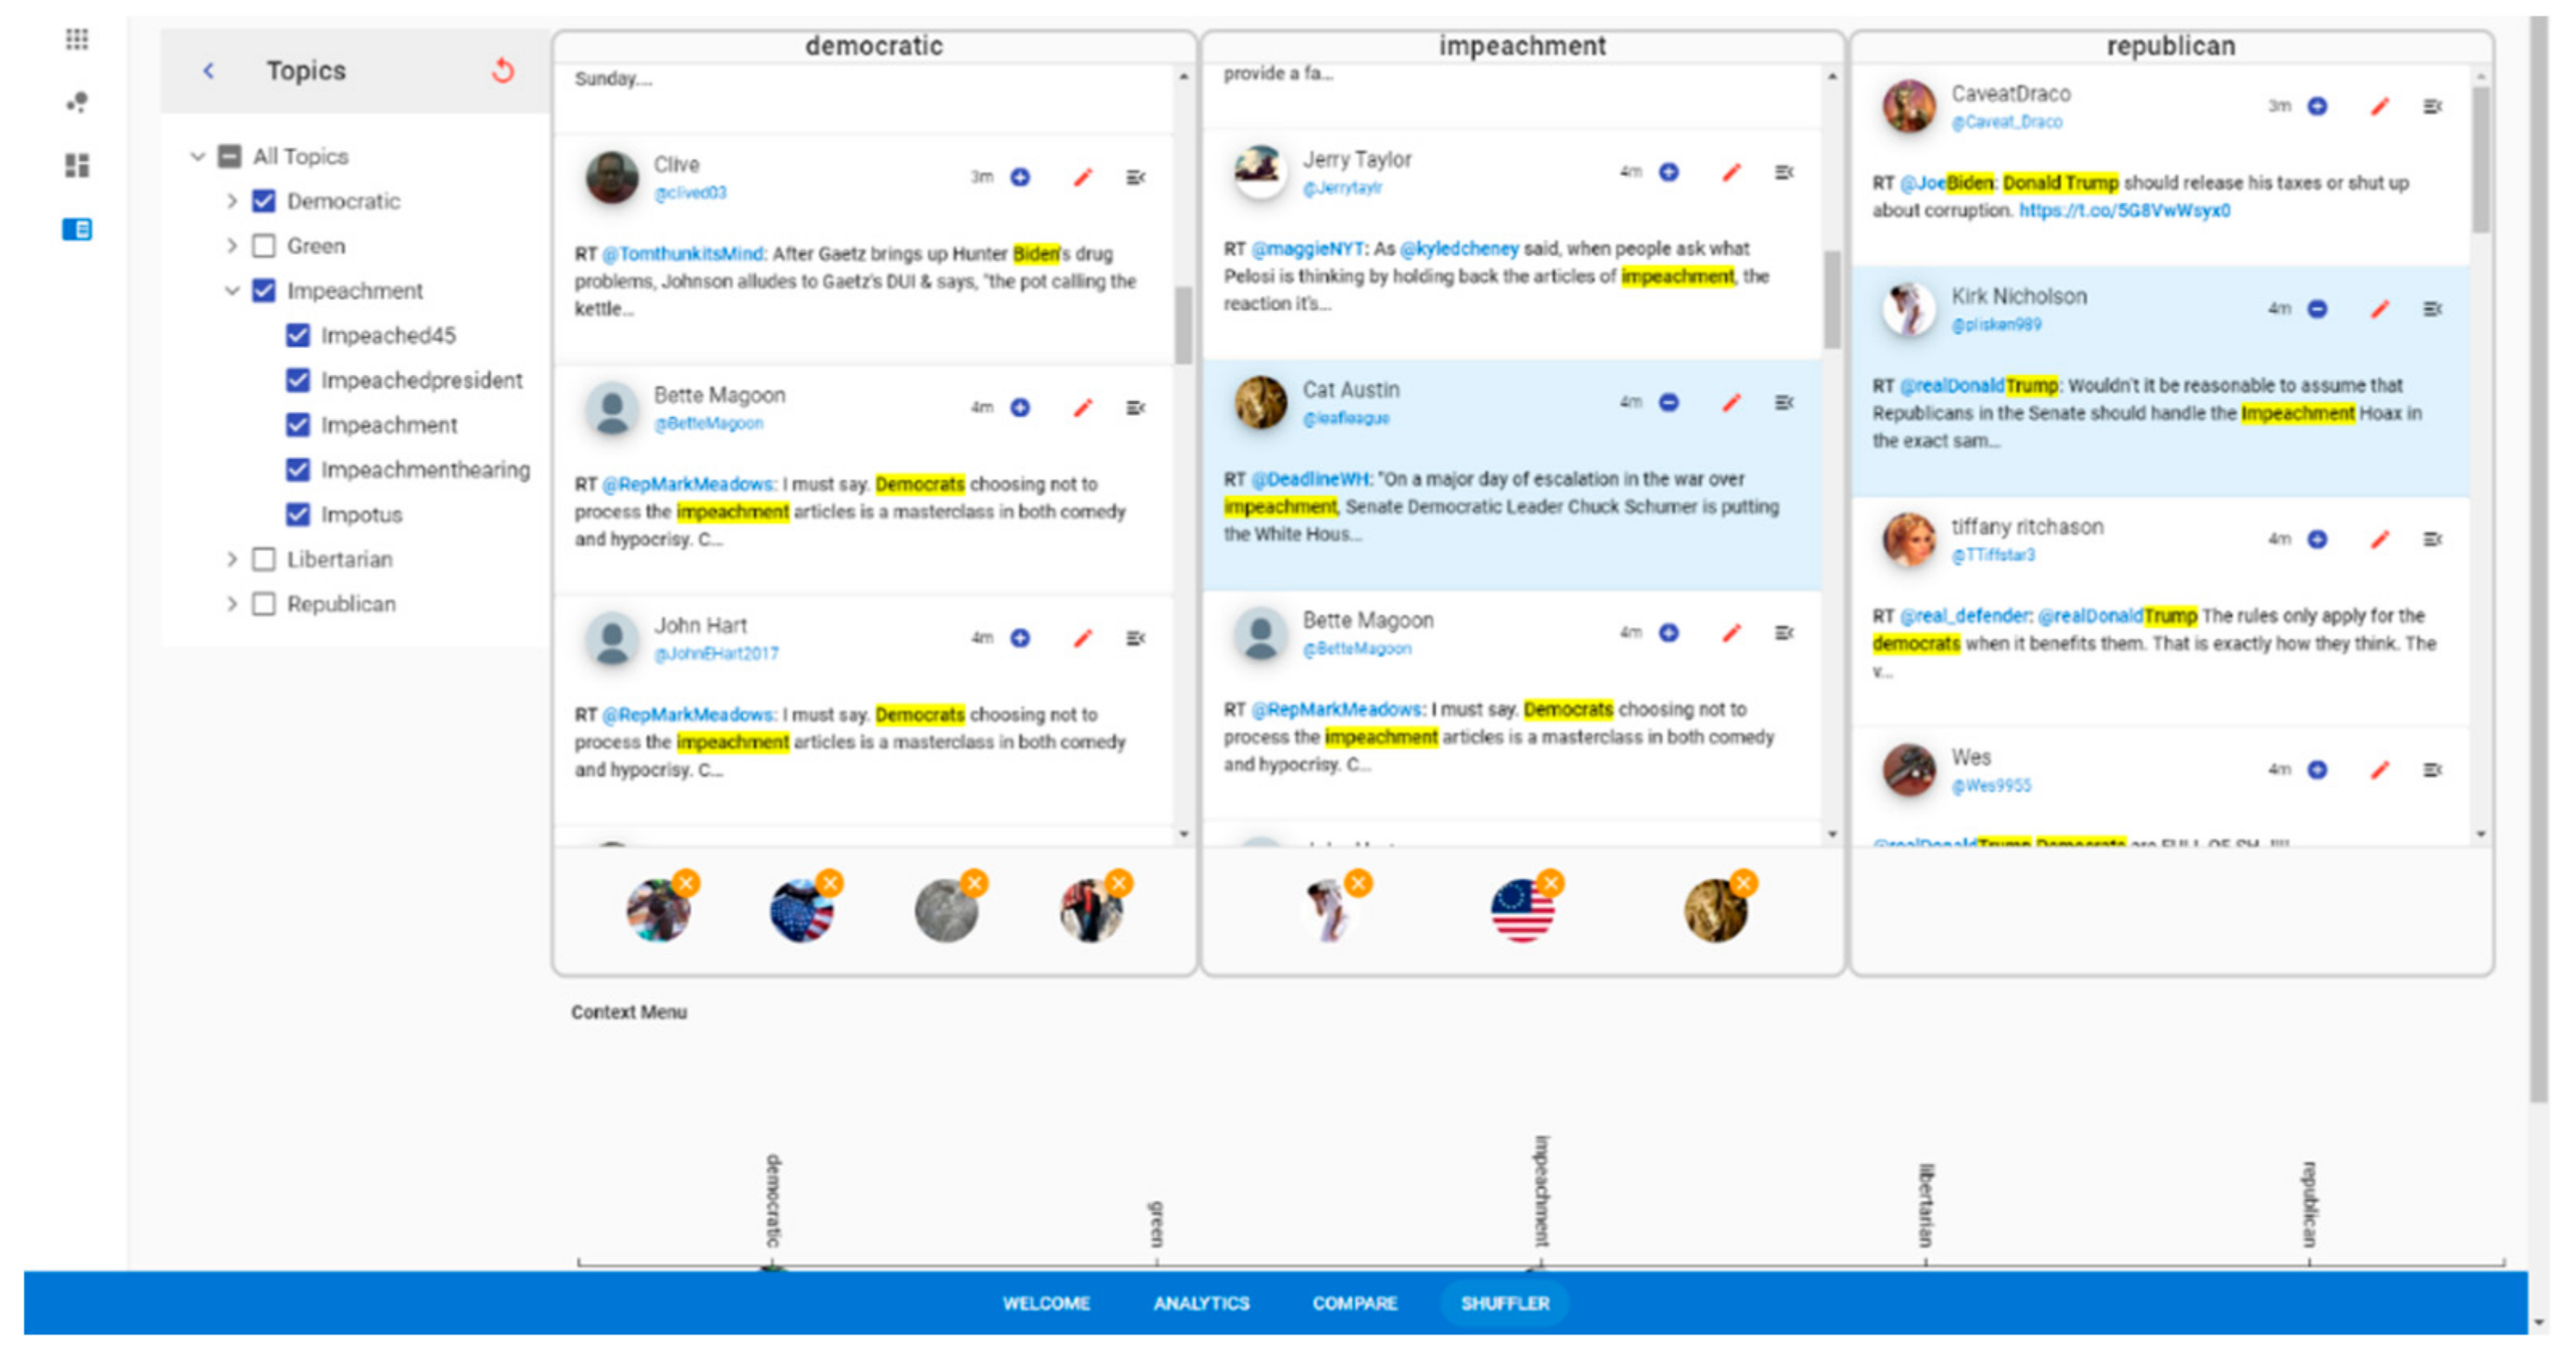
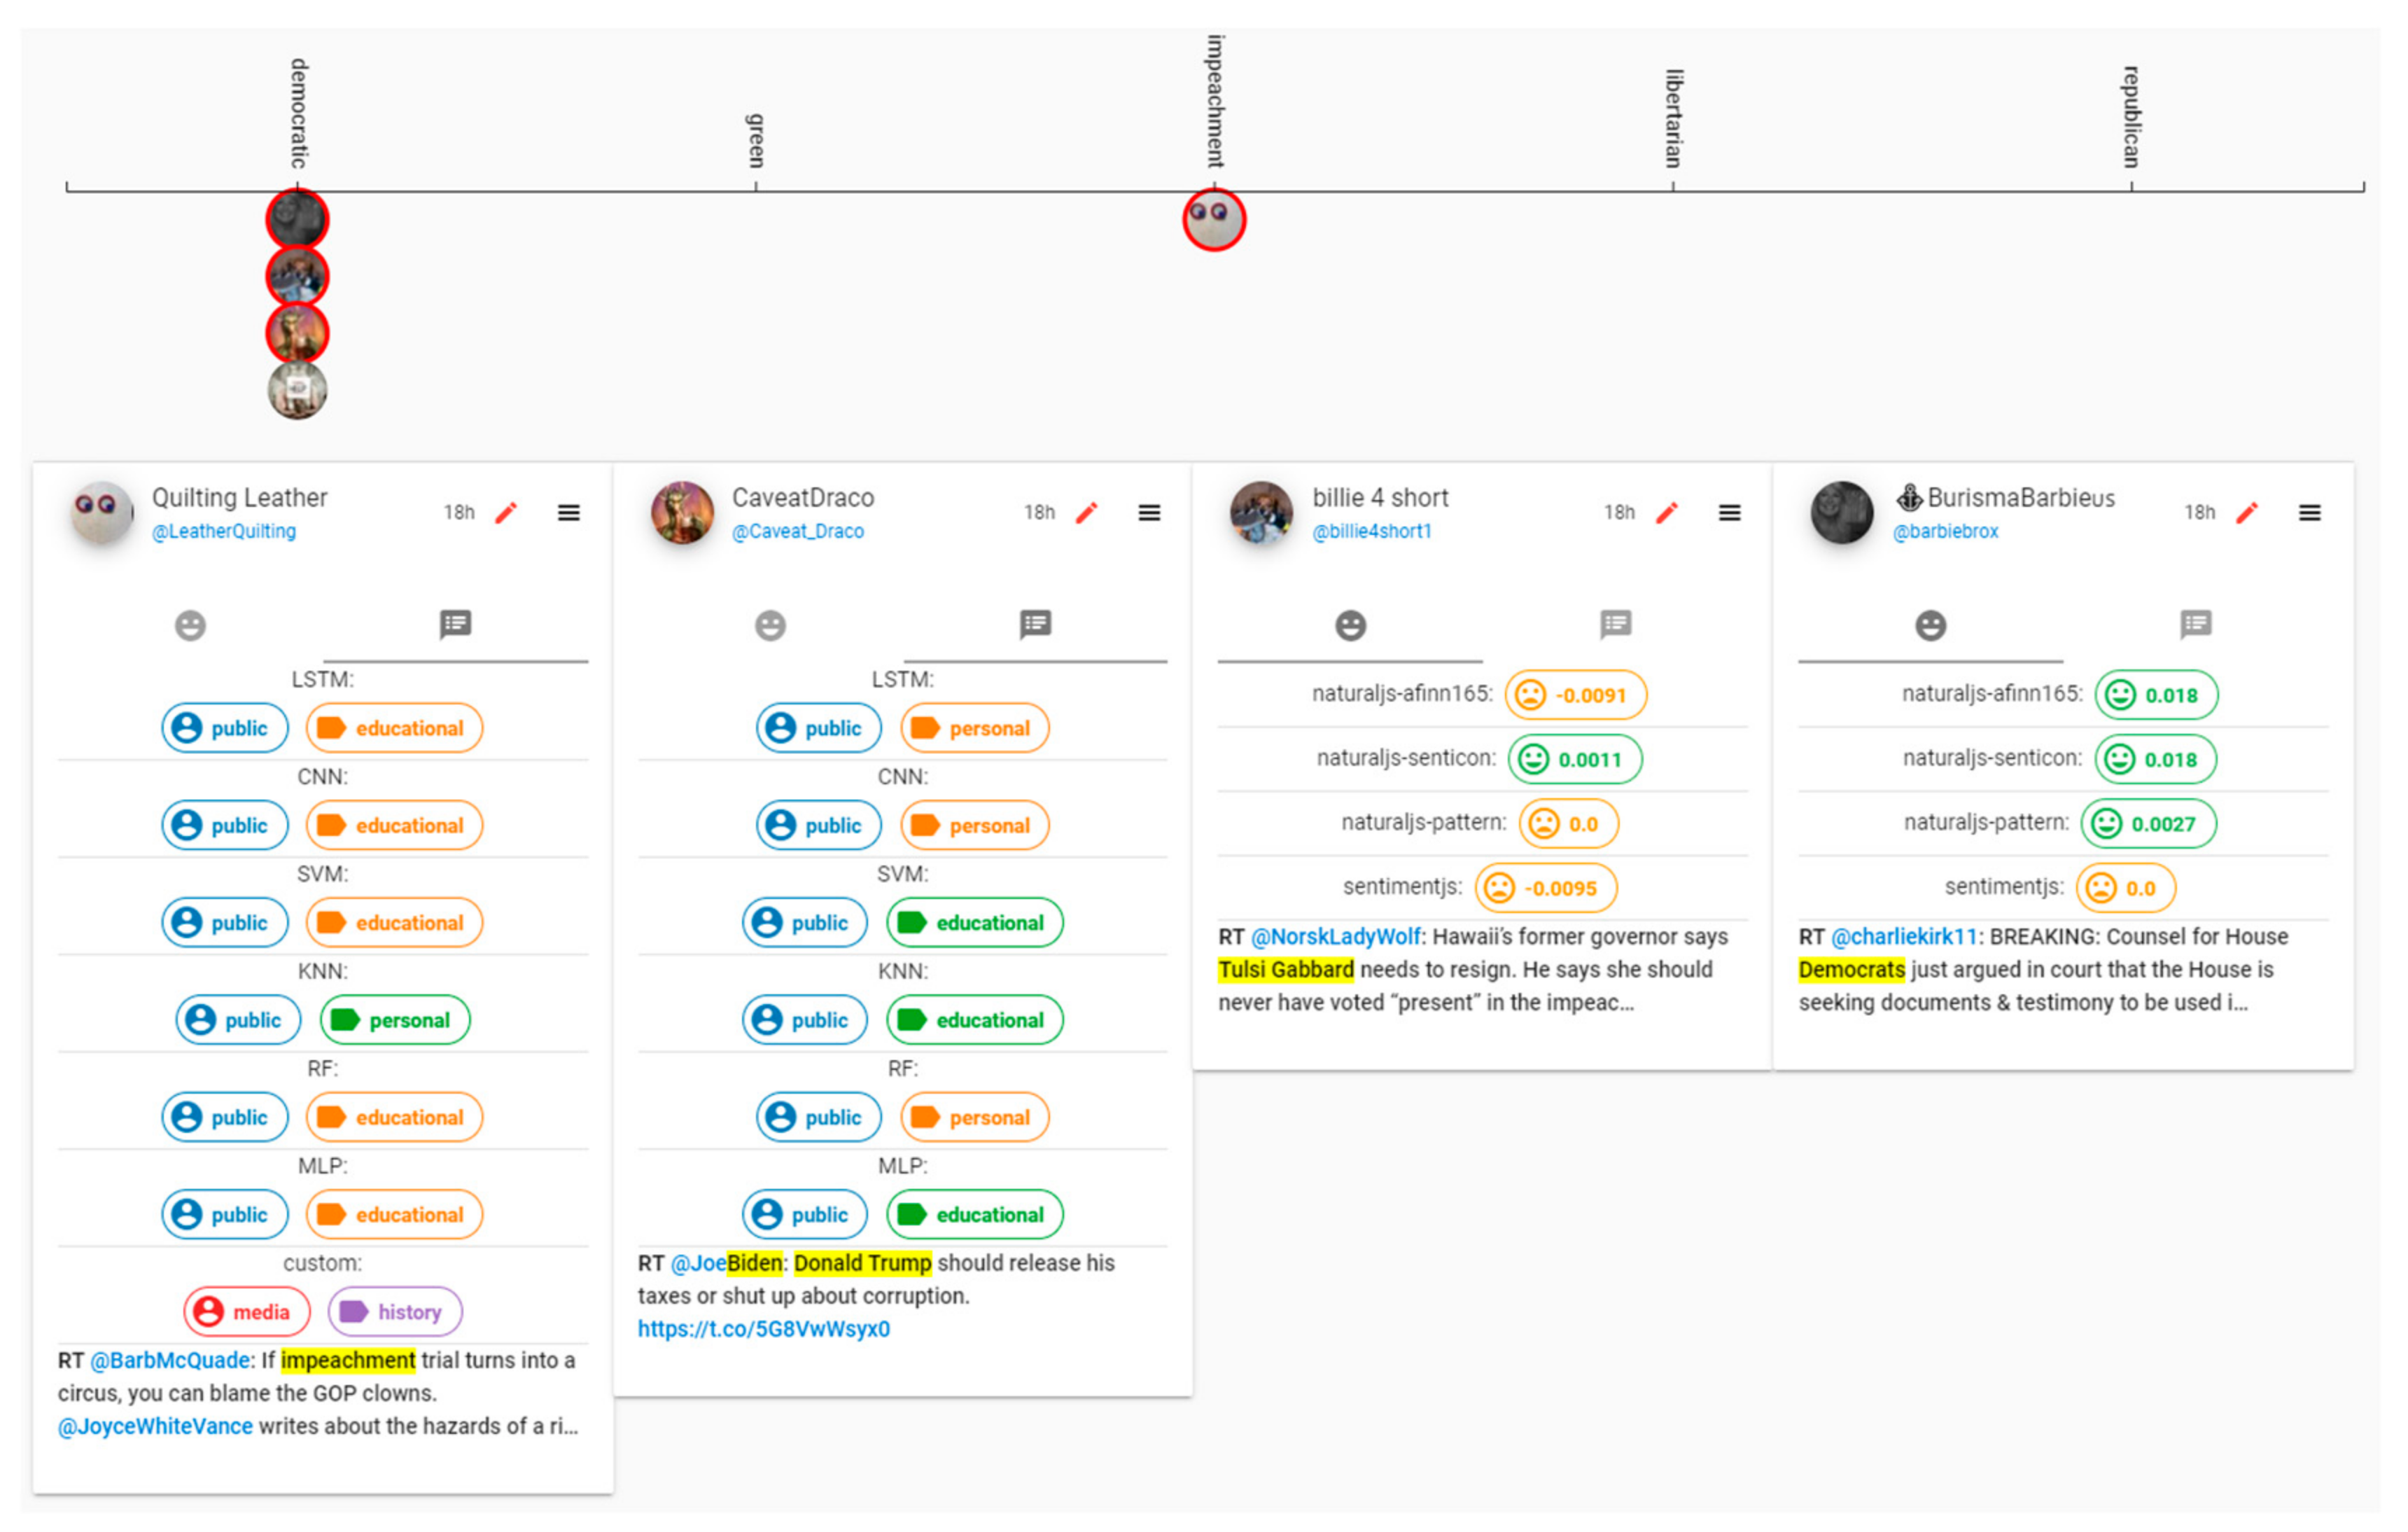
Figure 7 shows the Shuffler screen of VARTTA. This screen consists of two sections: a Topics menu and a tweet collections area. The Topics menu is represented using a hierarchical structure. Topics are made of subtopics which are actual search keywords used to acquire a tweet. When grouped together, multiple subtopics form a topic. This portion of the screen provides users with interaction mechanisms to filter tweets. Analysts can filter tweets by toggling topics/subtopics. On this screen, a tweet collection for each topic is represented and these collections are put side by side.
Figure 7 shows a sample configuration of this screen where some tweets share subtopics (i.e., keywords) across multiple topics. In this example, only ‘democratic’ and ‘impeachment’ are among the selected topics, and ‘republican’ is not selected. However, since there are tweets that have keywords related to ‘republican party’, a collection signifying ‘republican’ is also apparent on the screen, and the tweet is repeated under each related collection. This feature of VARTTA helps analysts appreciate the complexity of discussions and further facilitates the exploration of tweets.
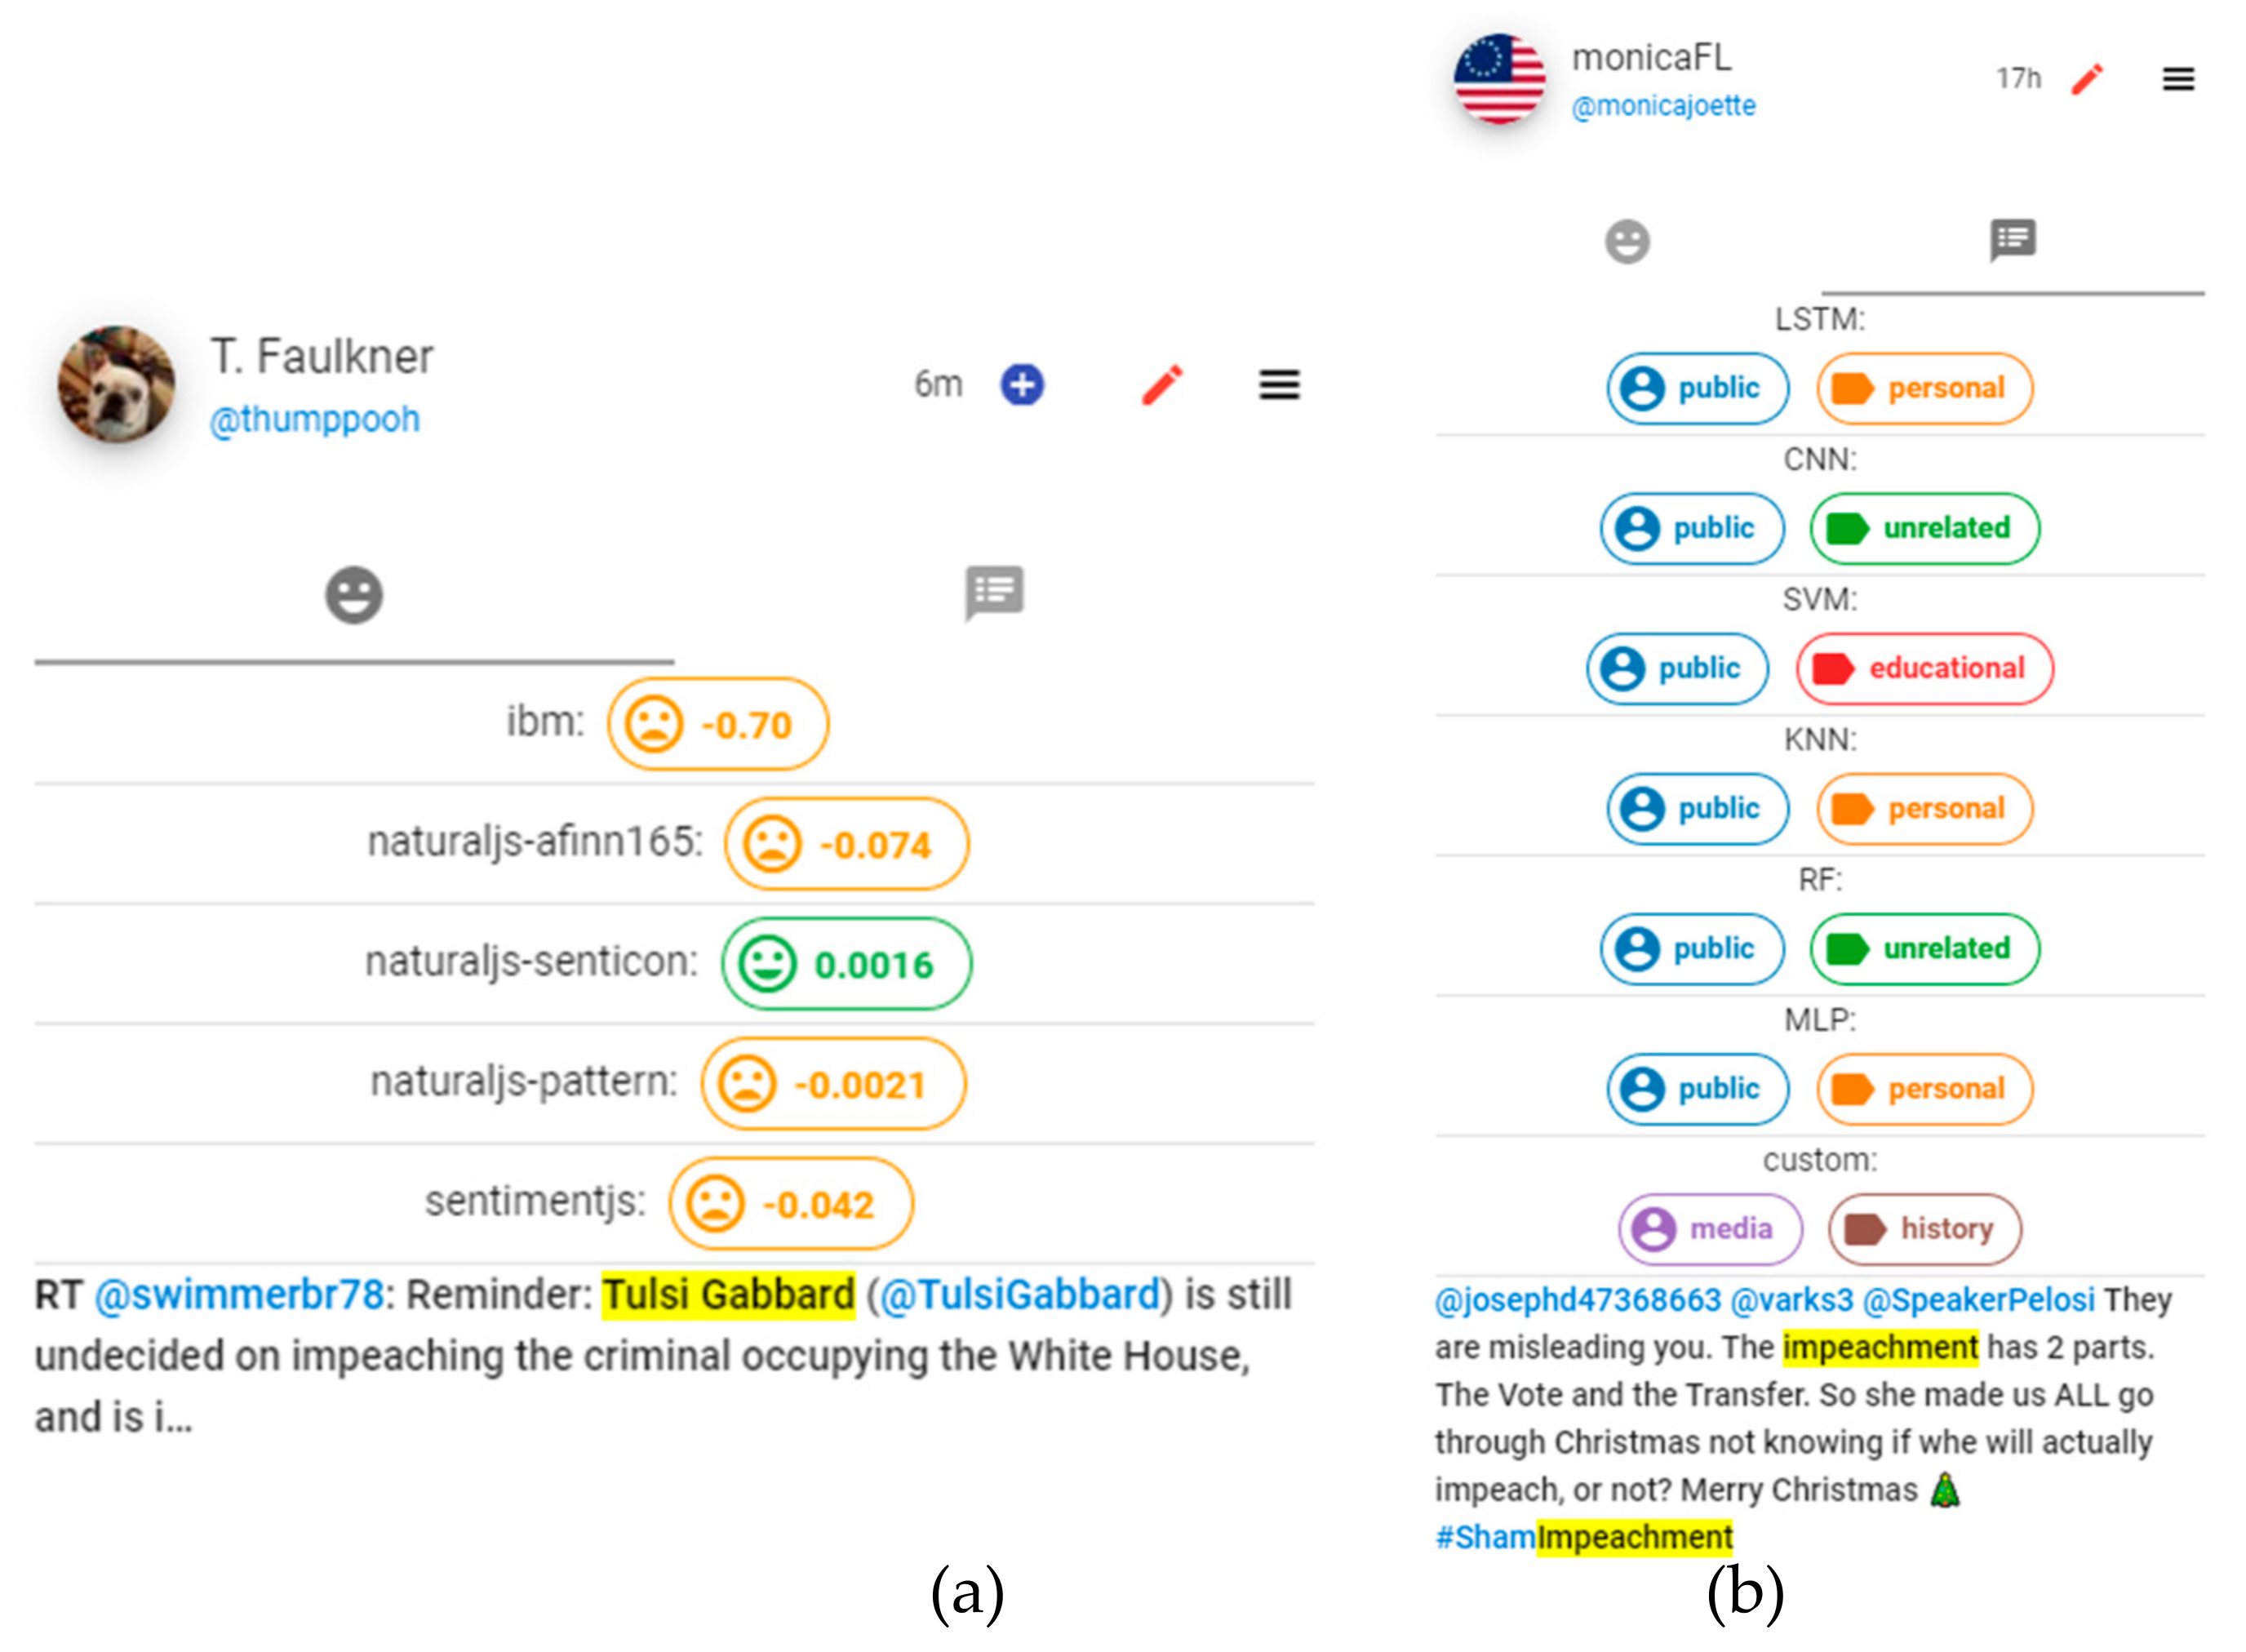
Drilling down on a tweet is possible by toggling the hamburger menu icon on the top-right-hand side of each tweet. As a result, labels given to the tweet by the Sentiment Analyzer and Label Predictor components would be visible to users (see
Figure 8).
Tweet collections are sorted alphabetically according to their topic. The visual discontinuity between these track-like structures makes it hard for analysts to compare and contrast the latent information for tweets from collections on each side of the screen. Also, due to scrolling, the visual discontinuity among tweets from one collection further blocks efficient tweet exploration.
In order to overcome these issues, another filtering mechanism is also implemented. By toggling the selection button on a tweet (i.e., the plus/minus button located next to the time label of each tweet), analysts can add tweets to or remove them from another list located at the bottom of the screen as shown in
Figure 7. If short-listed, an icon of the author’s profile picture along with a badge would be shown at the bottom of each collection, representing the selected tweet. The badge can be used to remove the tweet from this list. By selecting each of the tweet icons, the collection scrolls to the tweet, making it easier to access the actual tweet. This enables analysts to go back and forth between selections and enrich their mental models of the information space.
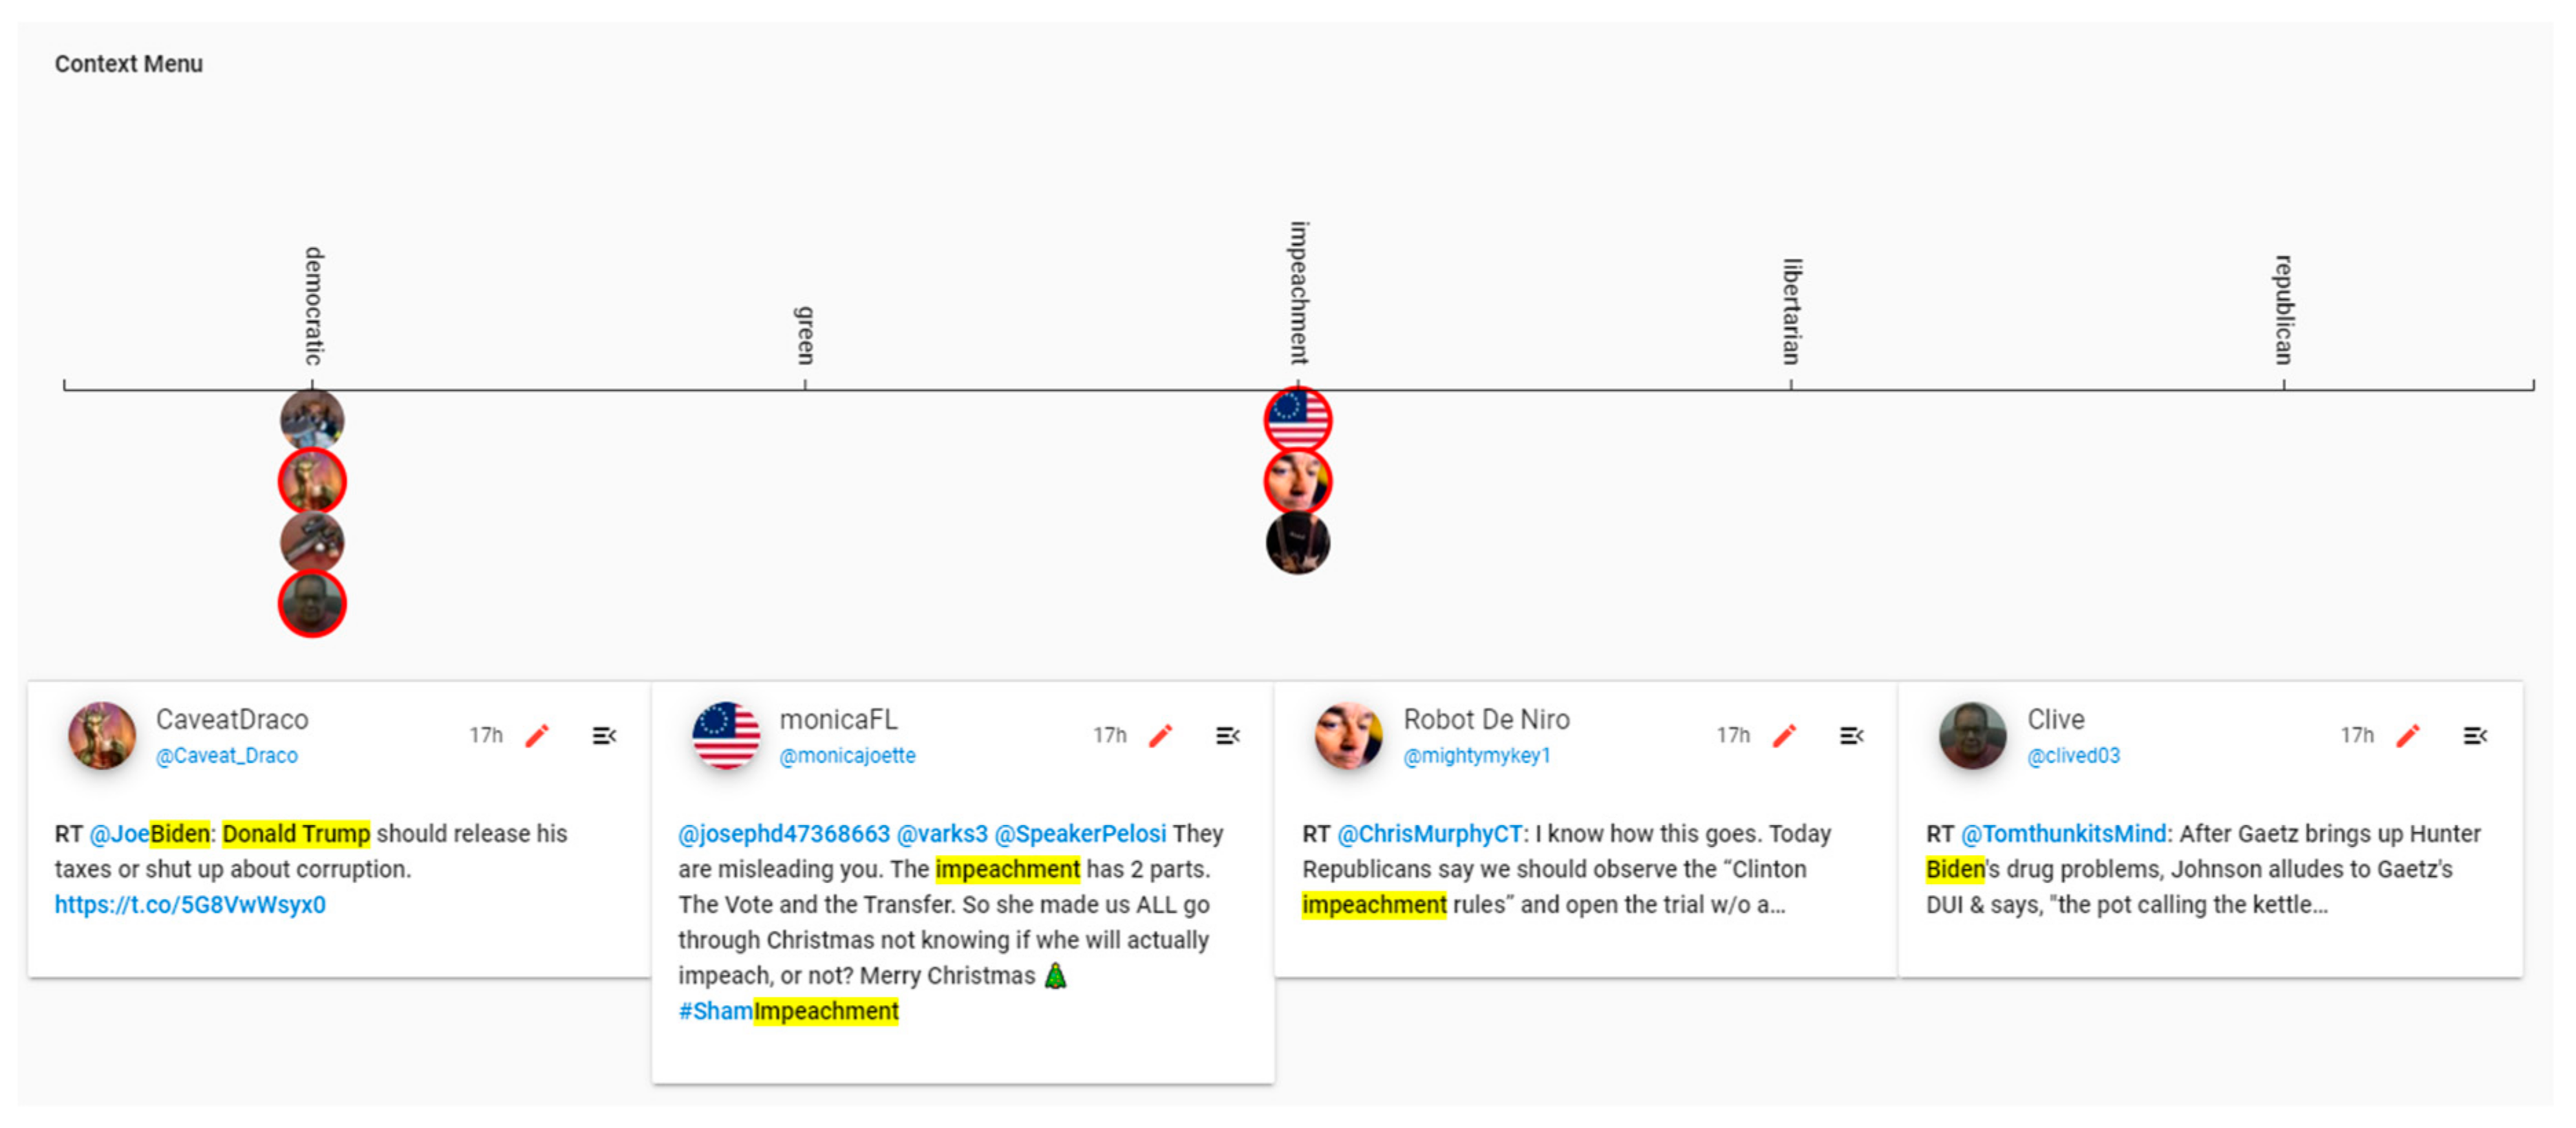
Short-listing the tweets helps analysts to pick and choose the tweets that seem to require a more detailed exploration. Furthermore, this mechanism puts users in control of the amount of content they explore. Accordingly, each short-listed tweet is added as an icon to a context map, shown at the bottom of the Shuffler screen. Regardless of topic selections, this map lists all of the topics in the same order that they are presented in the Topics menu and enables users to overcome the visual discontinuities faced in collections. As such, analysts can maintain an overview picture of the information space while having a focused view on a subset of tweets. By selecting each icon shown on this map, analysts add/remove the respective tweet to the bottom section of the screen. This enables them to compare and contrast tweets in a focused manner. In order to prevent distractions, the maximum number of tweets that are allowed to be added to this section is strictly limited to four. Accordingly, selected tweets have red borders around their icons to represent their selection status. This mechanism is shown in
Figure 9.
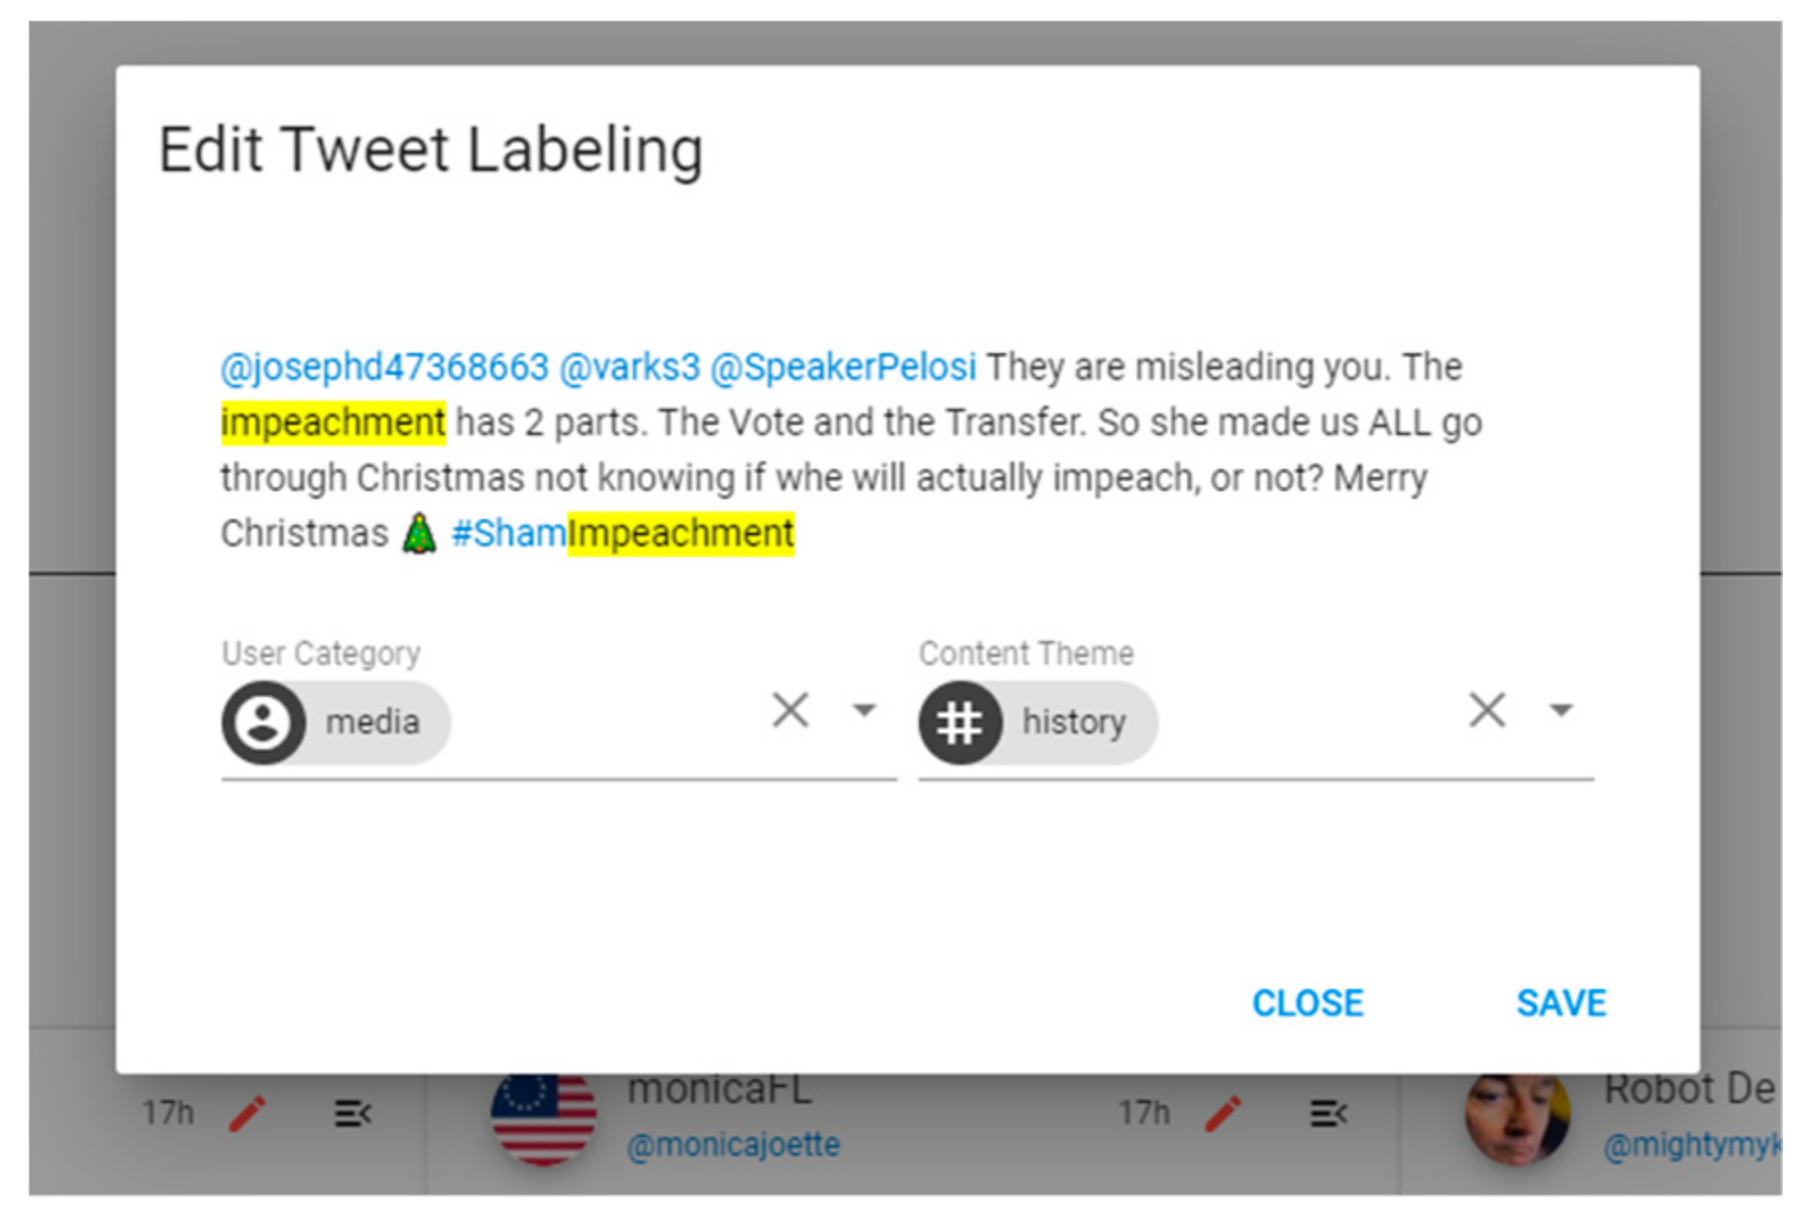
This detailed exploration can help analysts identify mislabeled tweets. In fluctuating contexts, mislabeling and lack of accuracy is common in ML techniques. Consequently, users may want to suggest a new category for ‘tweeter group’ or ‘content theme’ feature of a tweet. By choosing the edit button on the top section of each tweet, represented as a red pen icon, analysts are provided with a form to enter two values as custom labels. Selecting the save button on this form submits the form and sends the inputted data to VARTTA’s server (see
Figure 10). The server then saves the suggestion in its internal database. In parallel, the server queries the database to find similar tweets and assigns the suggested labels to them. Also, hereafter, the server tries to assign ‘custom’ labels to similar incoming tweets—a function performed by a subcomponent of the Label Predictor component in VARTTA’s pipeline.
This subcomponent acts as yet another classifier assigning ‘custom’ labels to similar tweets, according to previous user suggestions. To define similarity, labels given to tweets by other classifiers are summarized and tagged with each method’s name. Likewise, previous suggestions of users are also summarized in the same way. Then the difference of the two summaries is calculated for each tweet. Finally, a threshold is used to decide on the similarity value. VARTTA uses eight as its similarity threshold; given that the incoming tweet has at least eight labels in common with one of the previous suggestions, it should be given the same label as the suggestion found in the database. This heuristic is intended to fix the errors of ML techniques. The threshold can be adjusted for addressing different needs. Also, by selecting the ‘user-customized labeling’ method in the Compare screen and Analytics screen, analysts are able to view the state of previous suggestions. As new data comes into the system, using reactive components and frameworks enables VARTTA to seamlessly and dynamically update its visualizations in real-time.
4. Case Study: Election Debates
To showcase the capabilities of VARTTA, we present a case study in the context of the U.S. 2020 presidential election debates. For this case study, we considered the following tasks:
search for a list of terms,
analyze results,
identify errors and suggest corrections, and
analyze the corrected results.
Combining some of the hot topics of the time with names of the candidates from each political party, 49 keywords were used as search terms (see
Appendix A). Next, we tried to answer the following questions:
- (Q1)
What are the identified tweeter groups and content themes?
- (Q2)
Which of the given topics get coverage by media and news agencies?
- (Q3)
Which topic contains most of the content posted for awareness and educational purposes?
- (Q4)
Which types of tweeters participate in ‘impeachment’ discussions? What is their intent?
- (Q5)
In general, how does the media react to minor parties? What is the general sentiment towards them?
- (Q6)
How are the tweets, intended as personal tweets, expressed? What is the general sentiment?
- (Q7)
Currently, which tweeter is the most influential? What is their average sentiment? What are their recent tweets?
- (Q8)
What difference does the usage of different classifiers (e.g., CNN with NaturalJS library, RF with IBM Natural Language Understanding API, and MLP and SentimentJS library) make in identifying tweeter groups? What about content themes? Are there any groups or themes that have not been identified using any of the above?
- (Q9)
Q1 to Q7 with regards to each of the analysis techniques mentioned above.
- (Q10)
How can we add more context to the analysis of individual tweets? How can we verify the content of a tweet and identify fake news?
- (Q11)
What is exactly the result of each analysis technique for a given tweet?
- (Q12)
How can one drill down into the analytics from different subtopics and compare and contrast them without having to memorize or write down the results?
- (Q13)
How can we fix a tweet if it is misclassified?
After feeding the keywords to VARTTA, the interface is provided with a data stream, and, through the control menus at the top of the Analytics screen, the result of analytical models can be filtered. The rest of this section is dedicated to answering the above questions.
(A1) By selecting one method (e.g., CNN, in Sankey Diagram), the different tweeter groups and content themes and their related topics appear. By changing the selected text classification method, (e.g., to KNN, see
Figure 11), we can see that two new tweeter groups are added which were not captured using CNN. Analysts can explore these groups by changing the classification method.
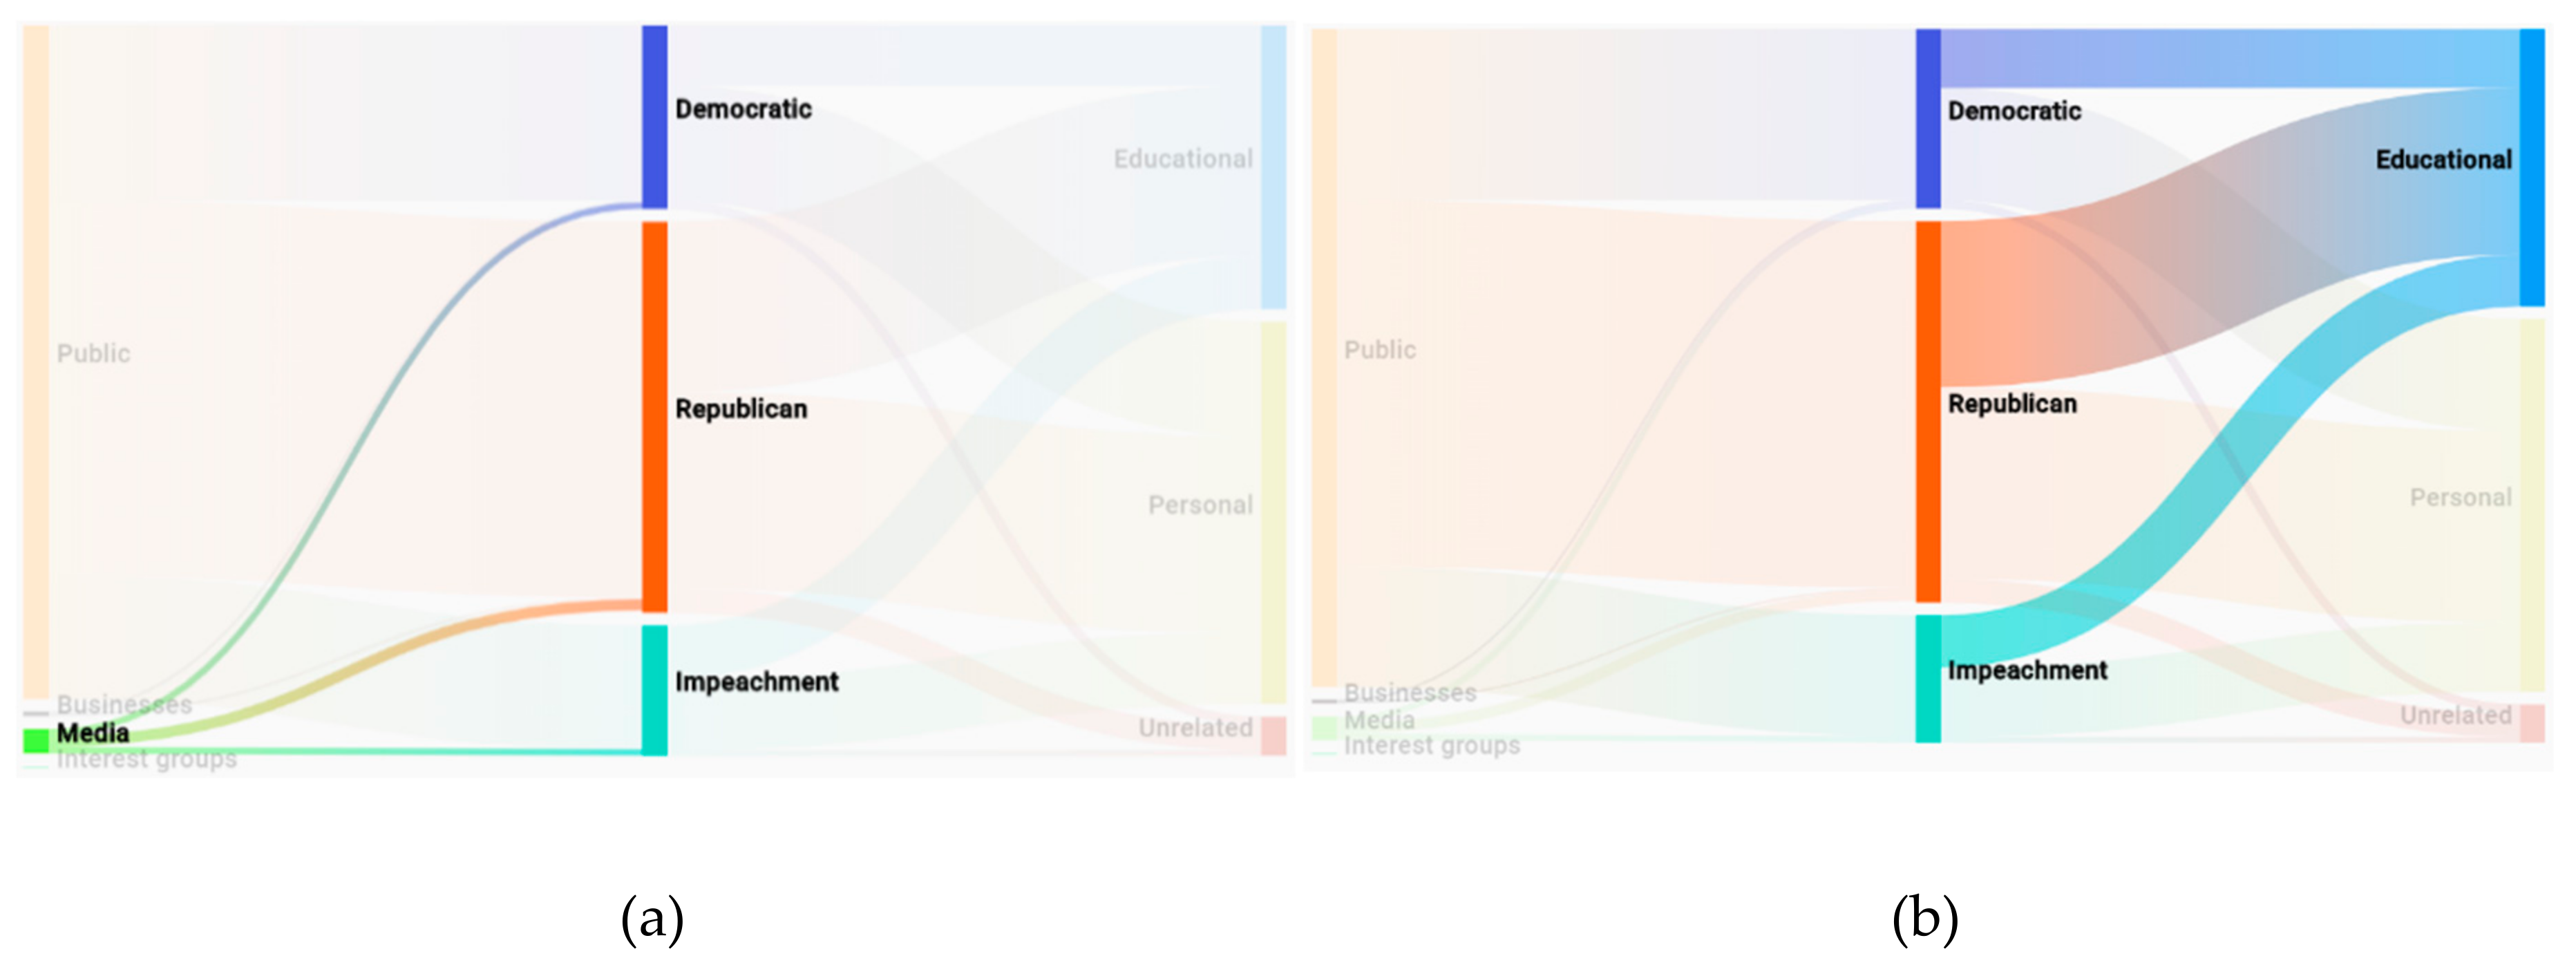
(A2) By hovering the mouse over ‘media’, we can highlight the related topics (see
Figure 12a).
(A3) Similarly, by hovering the mouse over ‘educational’ content theme, we can highlight the topics involved in that content theme (see
Figure 12b).
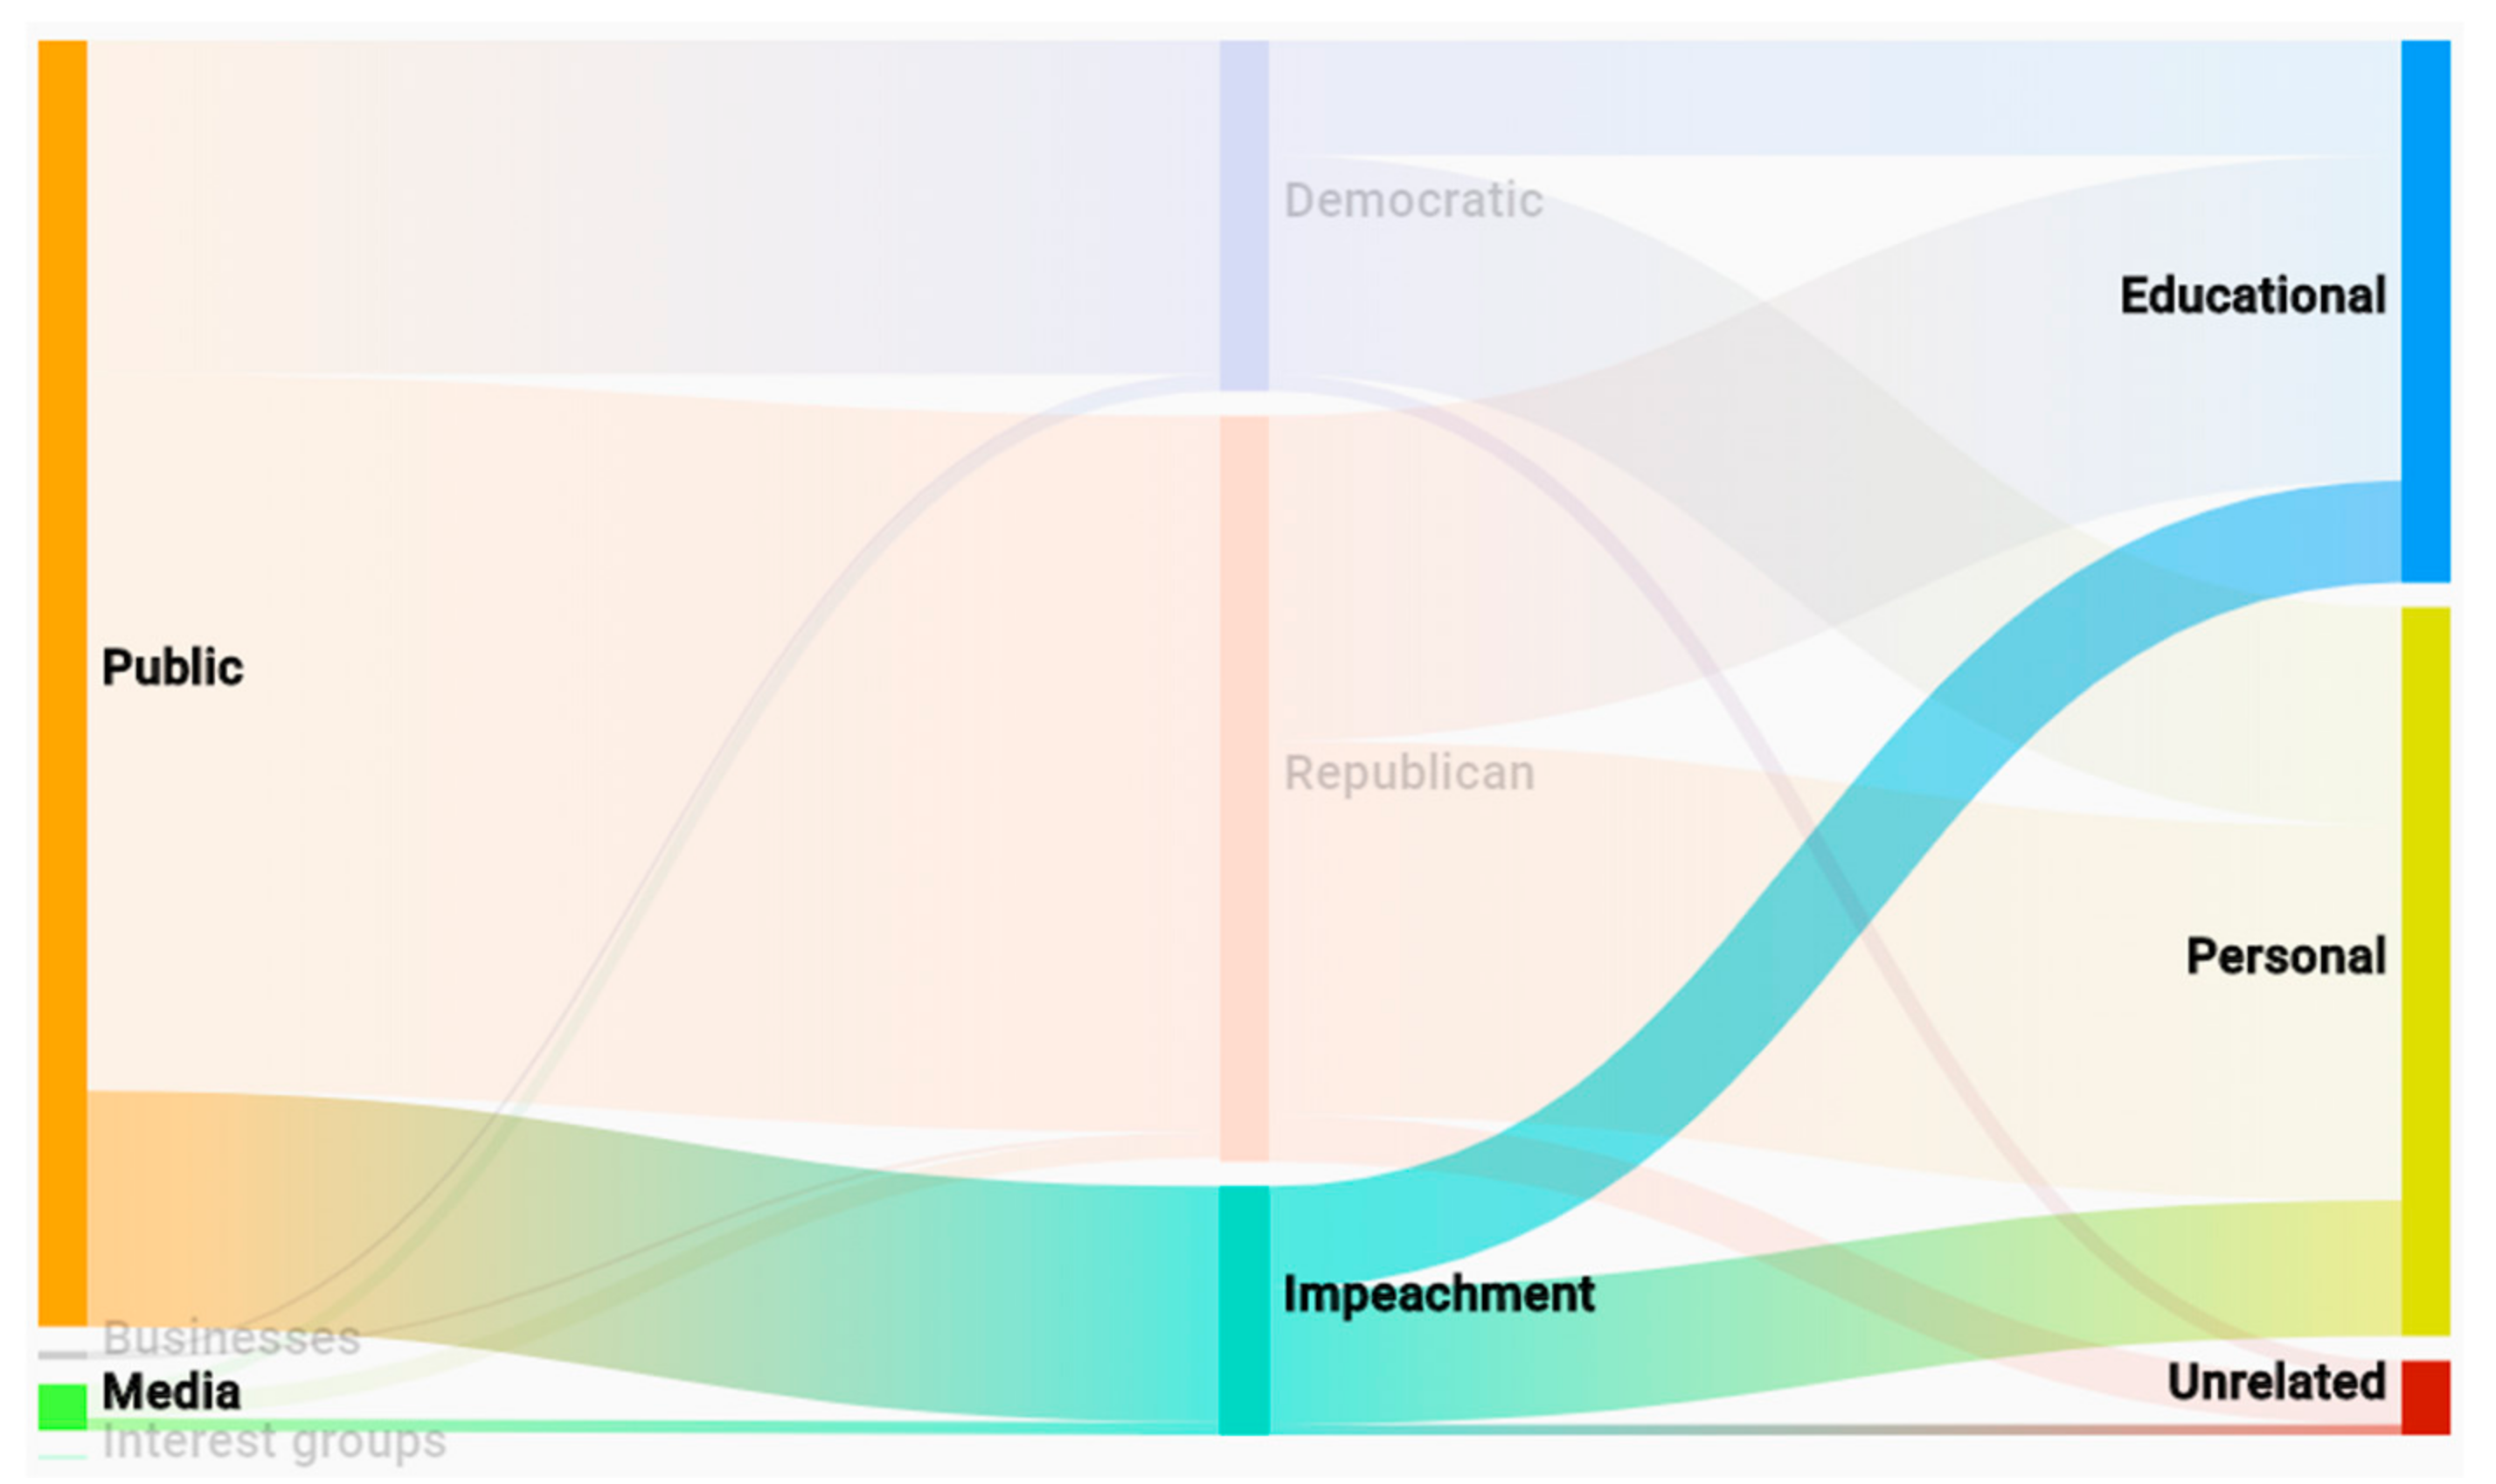
(A4) Accordingly, hovering the mouse over ‘impeachment’ topic highlights the related users and content themes and dims the rest (see
Figure 13).
(A5) and (A6) Having selected KNN as our classifier, ‘personal’ and ‘educational’ are among content themes, and ‘public’, ‘media’, and ‘interest groups’ are among the tweeter groups that are related to ‘green’ and ‘libertarian’ topics. By selecting a sentiment analysis technique (e.g., IBM NLU) and choosing ‘democratic’ from Sankey Diagram, Heat Map gets updated to represent the average sentiment for each tweeter group/content theme. As shown in
Figure 4, it can be noted that some themes/groups have no tweets under some of the subtopics. Similar to personal tweets, the hybrid analysis makes it possible to analyze each category in more depth.
(A7) By zooming in and out on Scatter Plot, we are able to find the farthest tweeter along the horizontal axis who represents an influential tweet author. Also, the location on vertical axis shows the average sentiment for that tweeter. This average value is calculated by only taking into account the tweets that are already in the system. Selecting a tweeter results in the appearance of a collection of that tweeter’s recent tweets (timeline) on the pane at the right-hand side, as demonstrated in
Figure 14.
(A8) and (A9) In the Compare screen, we can choose to have three panes for comparing. Since these components are similar to the ones on the Analytics screen, they also get updated in real-time, react to interaction mechanisms in the same way, and provide the same functionality. Therefore, as depicted in
Figure 6, this screen enables tweeters to juxtapose different analysis methods while allowing them to perform the previous analytical tasks.
(A10) VARTTA uses a track-like structure for each topic and puts topics side-by-side to reduce visual discontinuity and updates the topics simultaneously. As depicted in
Figure 7, this design helps users see ‘what’ events are happening in the discussions related to all of the listed parties. Verification and anomaly detection here become relatively easy tasks since one can follow the threads of tweets to better understand the underlying context of the discussions.
(A11) Using the hamburger button on the top-right corner of each tweet, we are able to drill down a tweet to see more details about it (see
Figure 8).
(A12) Using the context map at the bottom of the screen, we can short-list up to four tweets from each collection and view them in the context map. The purpose of using such a mechanism (see
Figure 15) is to further mitigate the problem of visual discontinuity of tweet collections or the vertical position of tweets inside a collection.
(A13) Using the edit icon at the top of each tweet, we are able to edit the labeling for each tweet and/or add our own custom labels. This way, by going back to the Analytics screen or Compare screen, we can see the effects of our custom labeling suggestion. This mechanism is demonstrated in
Figure 10 and the result of such suggestions is shown in
Figure 6.
5. Conclusions and Future Work
In this paper, we have discussed existing limitations in previous Twitter analysis approaches. To address some of these limitations, we proposed and described a visual analytics system (VAS), VARTTA. Using a case study, we showed that VARTTA can help users survey and make sense of Twitter discussions. We demonstrated that VARTTA is able to provide users/analysts with real-time analytics, along with the possibility of enabling them to offer custom-made, heuristic labeling or categorization suggestions for ML errors.
At a general level, the development of VARTTA demonstrates the feasibility of combining ML and NLP techniques, stream processing approaches, data visualizations, and human-data interaction mechanisms for providing users with real-time analytics capabilities, all in one integrated, coherent VAS. We showed that using design and system architectural abstractions as well as plug-and-play mechanisms, multiple data processing methods can be incorporated in a single VAS.
Finally, this research suggests that several issues need to be taken into consideration while designing a VAS like VARTTA:
Programming languages, frameworks, and technologies selected in making VASes are critical in determining the overall quality of the interactions. Advanced frameworks and tools that incorporate reactivity, allow cross-platform development, consider component reusability, and provide state preservation can provide many advantages. Also, depending on the characteristics of the input stream, other advanced stream processing engines (e.g., Apache Spark) can be harnessed for better integration with ML methods.
The architecture of the VAS must be abstract enough to allow for extensibility and applicability of various data processing techniques in a seamless, plug-and-play manner.
Online discussions, especially on Twitter, are in a constant state of flux. Consequently, errors resulting from dataset shifts (e.g., covariate shifts) are inevitable. Thus, the VAS must incorporate human-in-the-loop mechanisms that enable users to interactively provide suggestions to fix and relabel such errors, without changing the already-trained ML models.
The quality of component-to-component interactions within the VAS (e.g., architectural and technical implementations), as well as human-VAS interactions (e.g., human-ML and human-data interactions), are critical in determining the overall efficacy of the joint cognitive system for carrying out complex analytical tasks. The importance of such interactions is apparent in real-time analytics scenarios. Therefore, both types of interaction must be examined carefully.
Future Work
VARTTA’s development has two major limitations. The first limitation is the quality of the data stream. For free accounts, Twitter only provides a small portion of the actual tweets. In future work, streams with higher data qualities can be used and the resulting analytics can be compared. The second limitation is the use of multiple data domains. Supervised ML models only produce labels according to the data with which they are trained. As a result, it can be inefficient to use one model for multiple discussions. A possible fix for that is to provide users with the option of loading custom models.


