Modeling Regulatory Threshold Levels for Pesticides in Surface Waters from Effect Databases


Abstract
:1. Summary
2. Data Description
2.1. The Dataset
2.2. Data Quality
2.3. Case Study
3. Methods
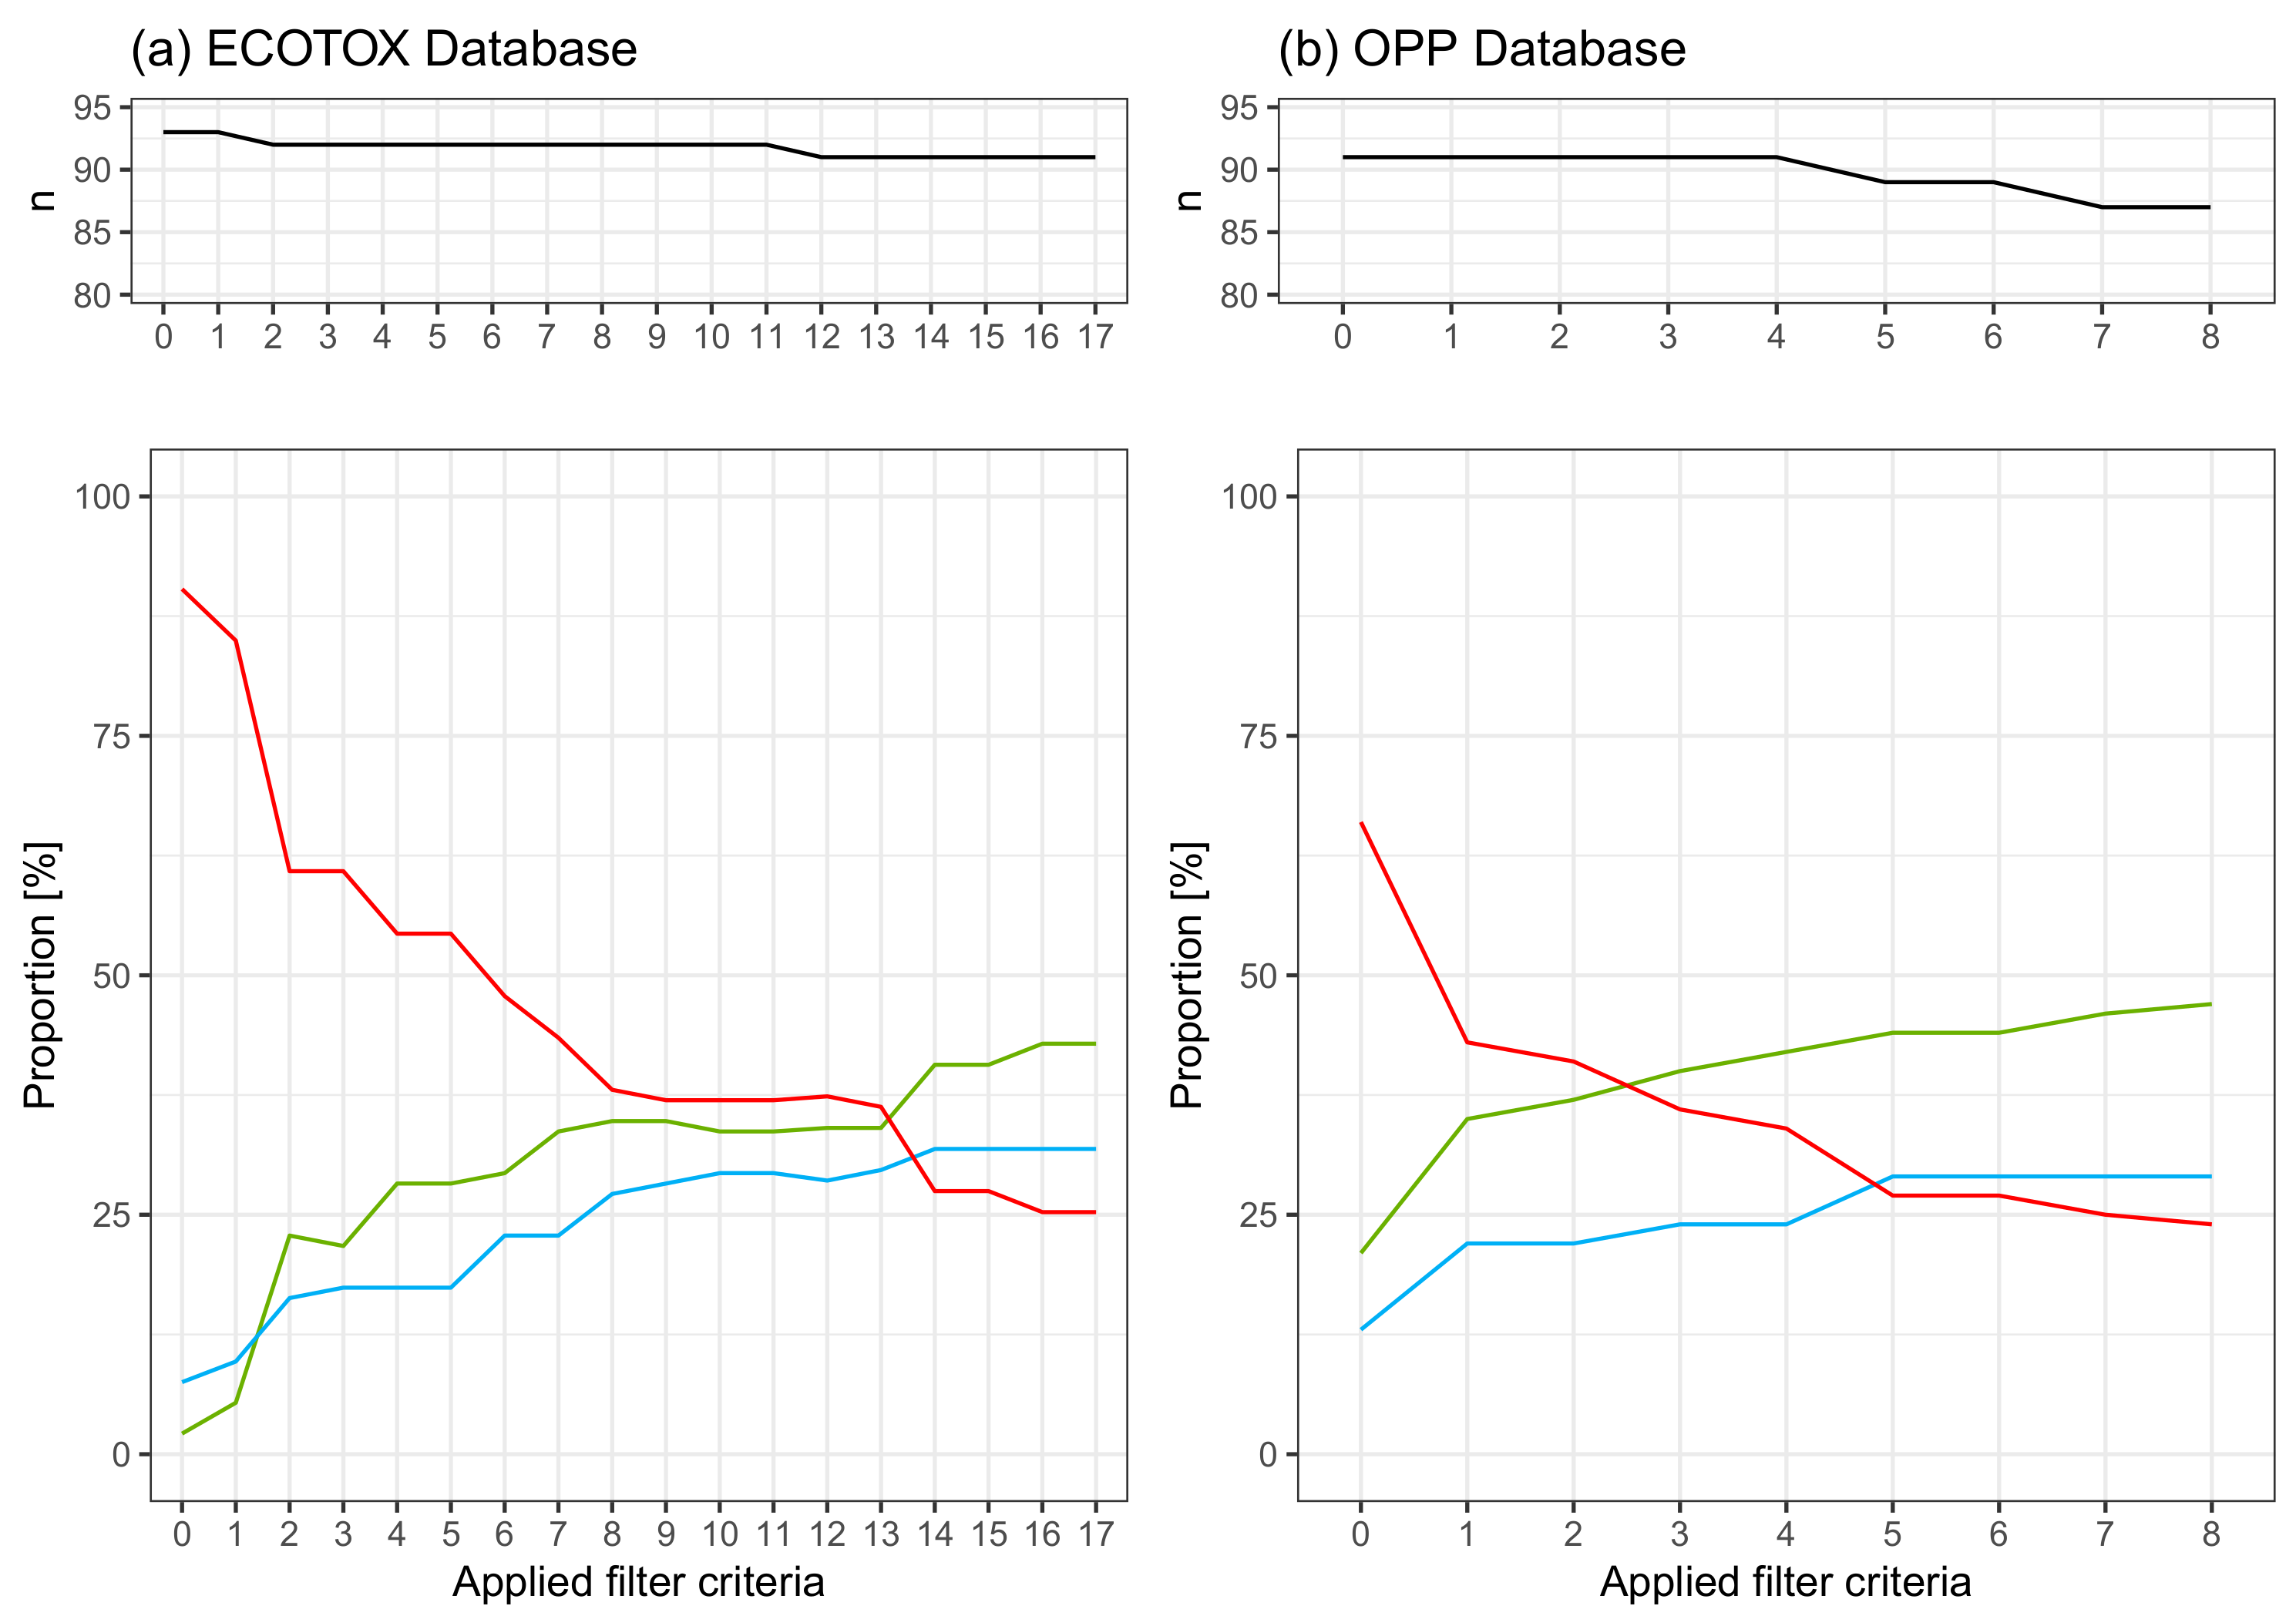
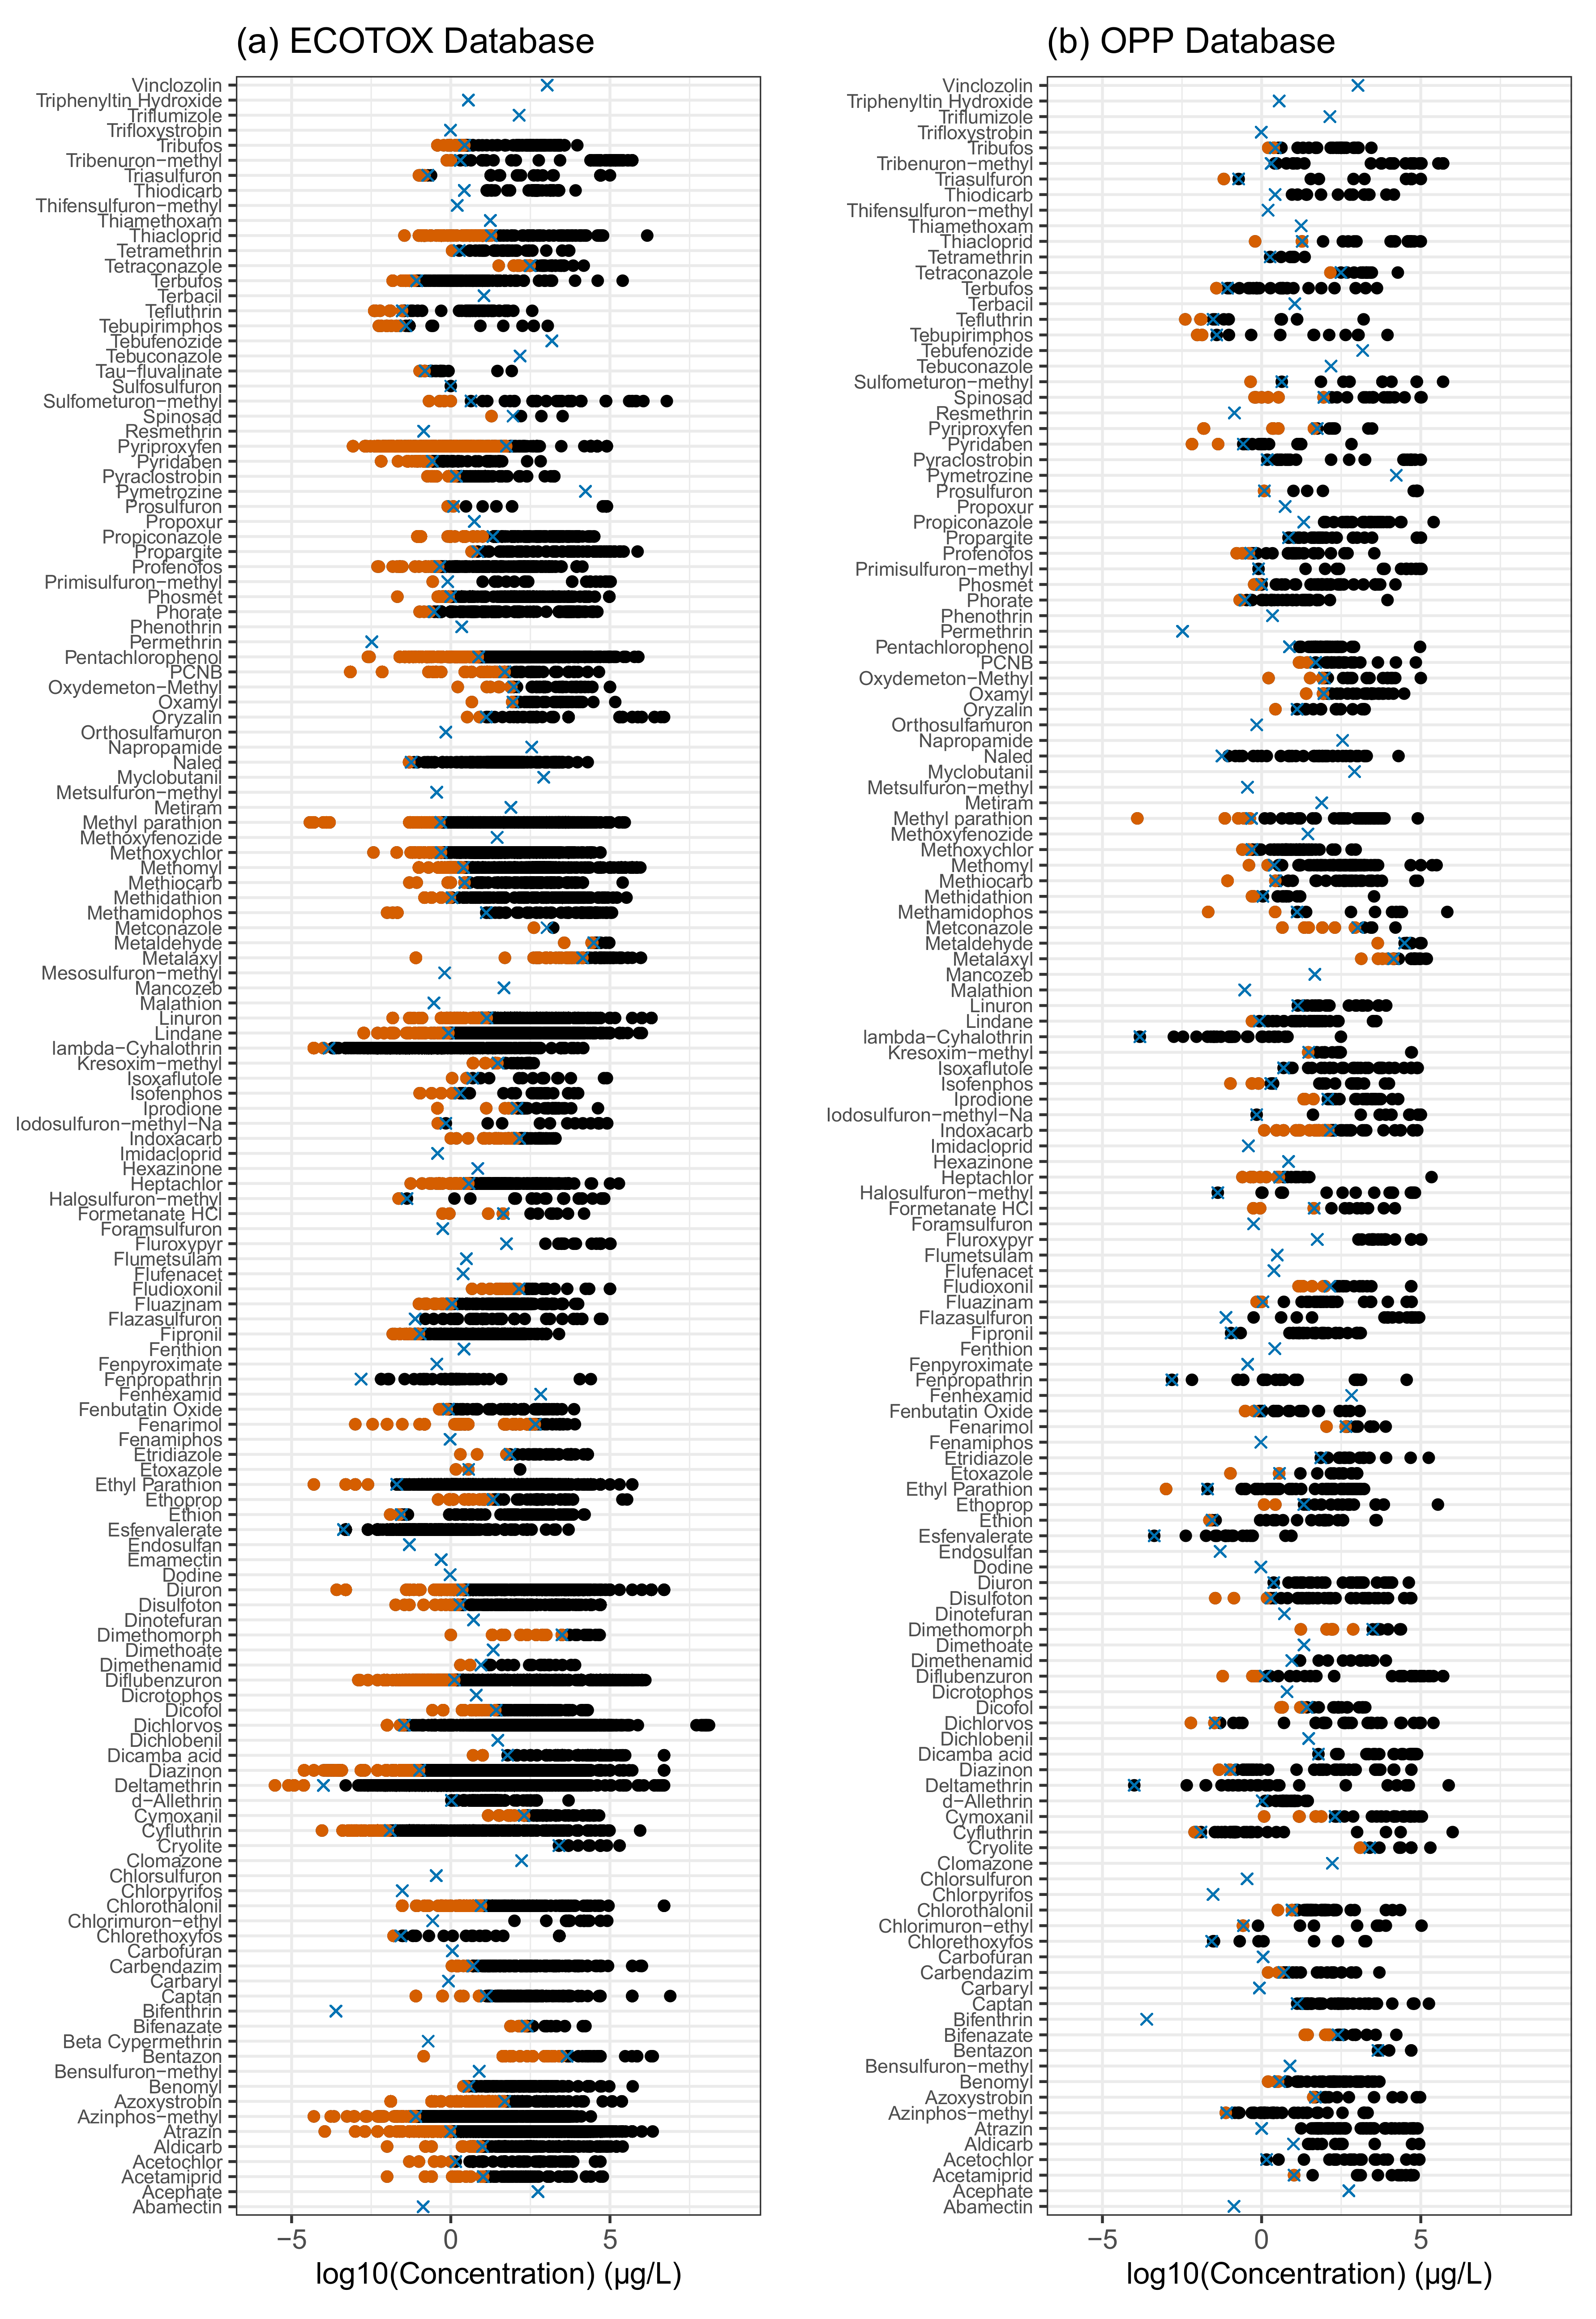
3.1. The Databases
3.2. Collection of RTL
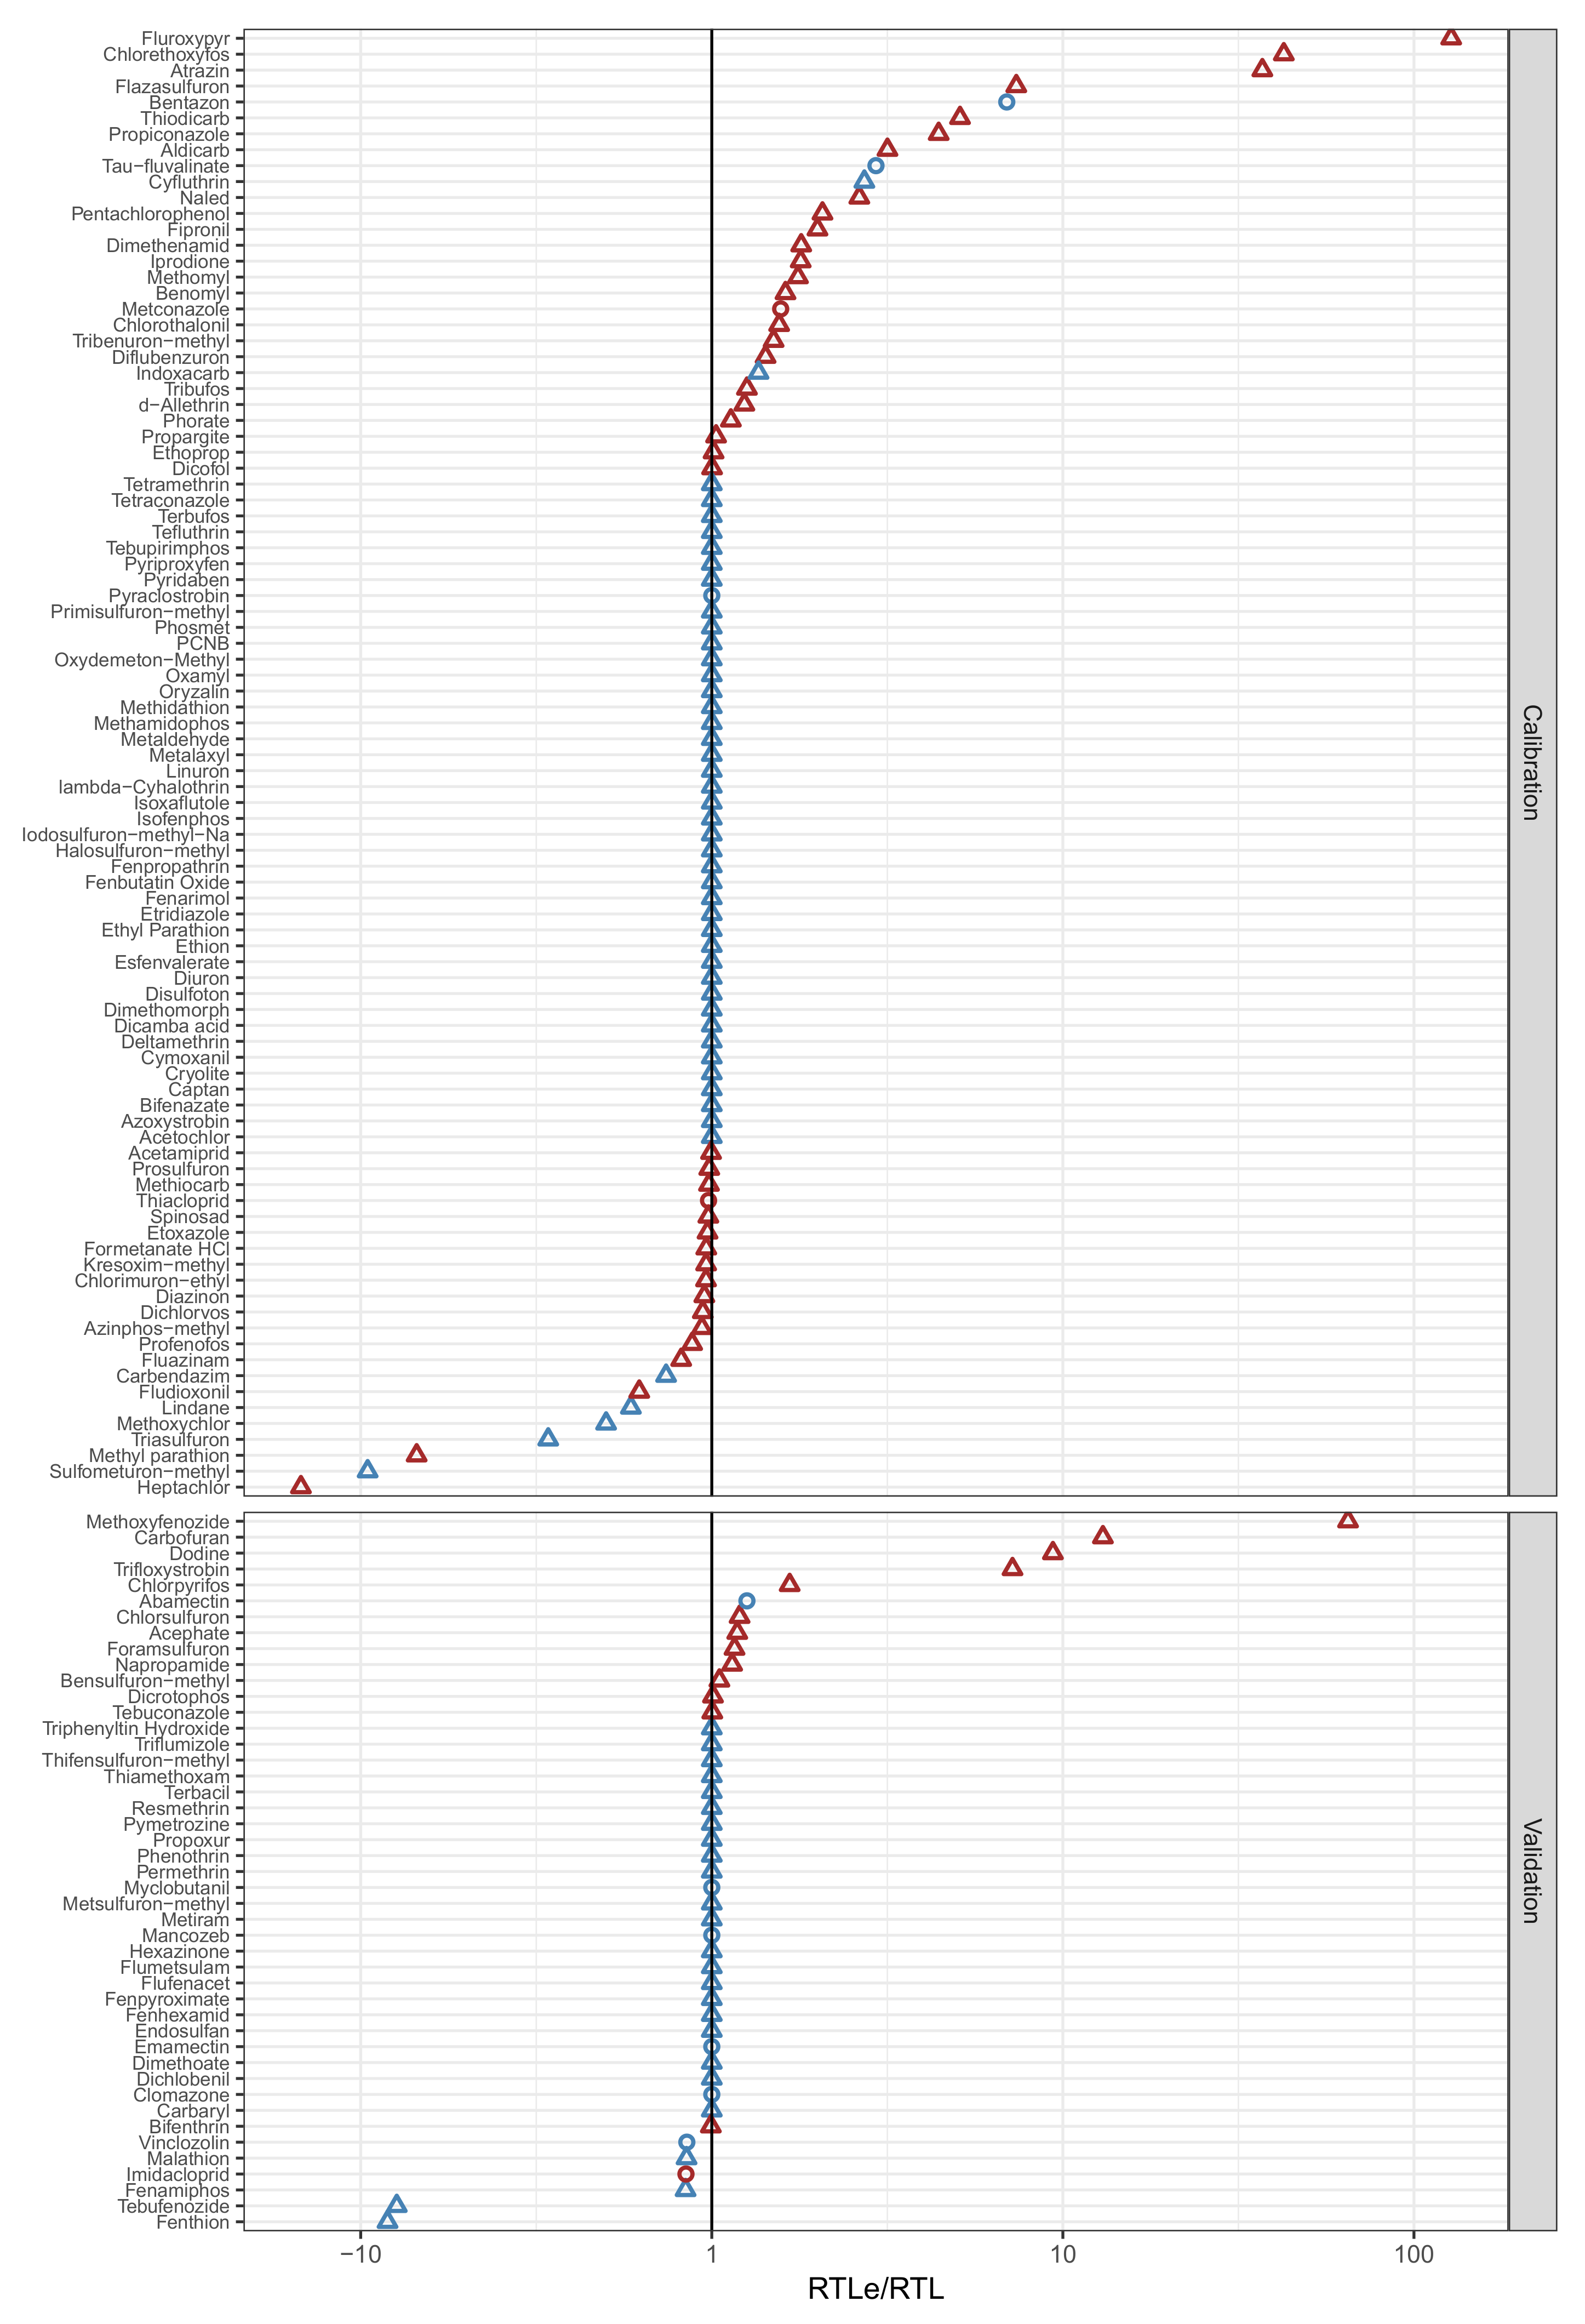
3.3. Model Building and Calibration
3.4. Model Validation and Join of ECOTOX and OPP Query Results
3.5. Bootstrapped Model Precision
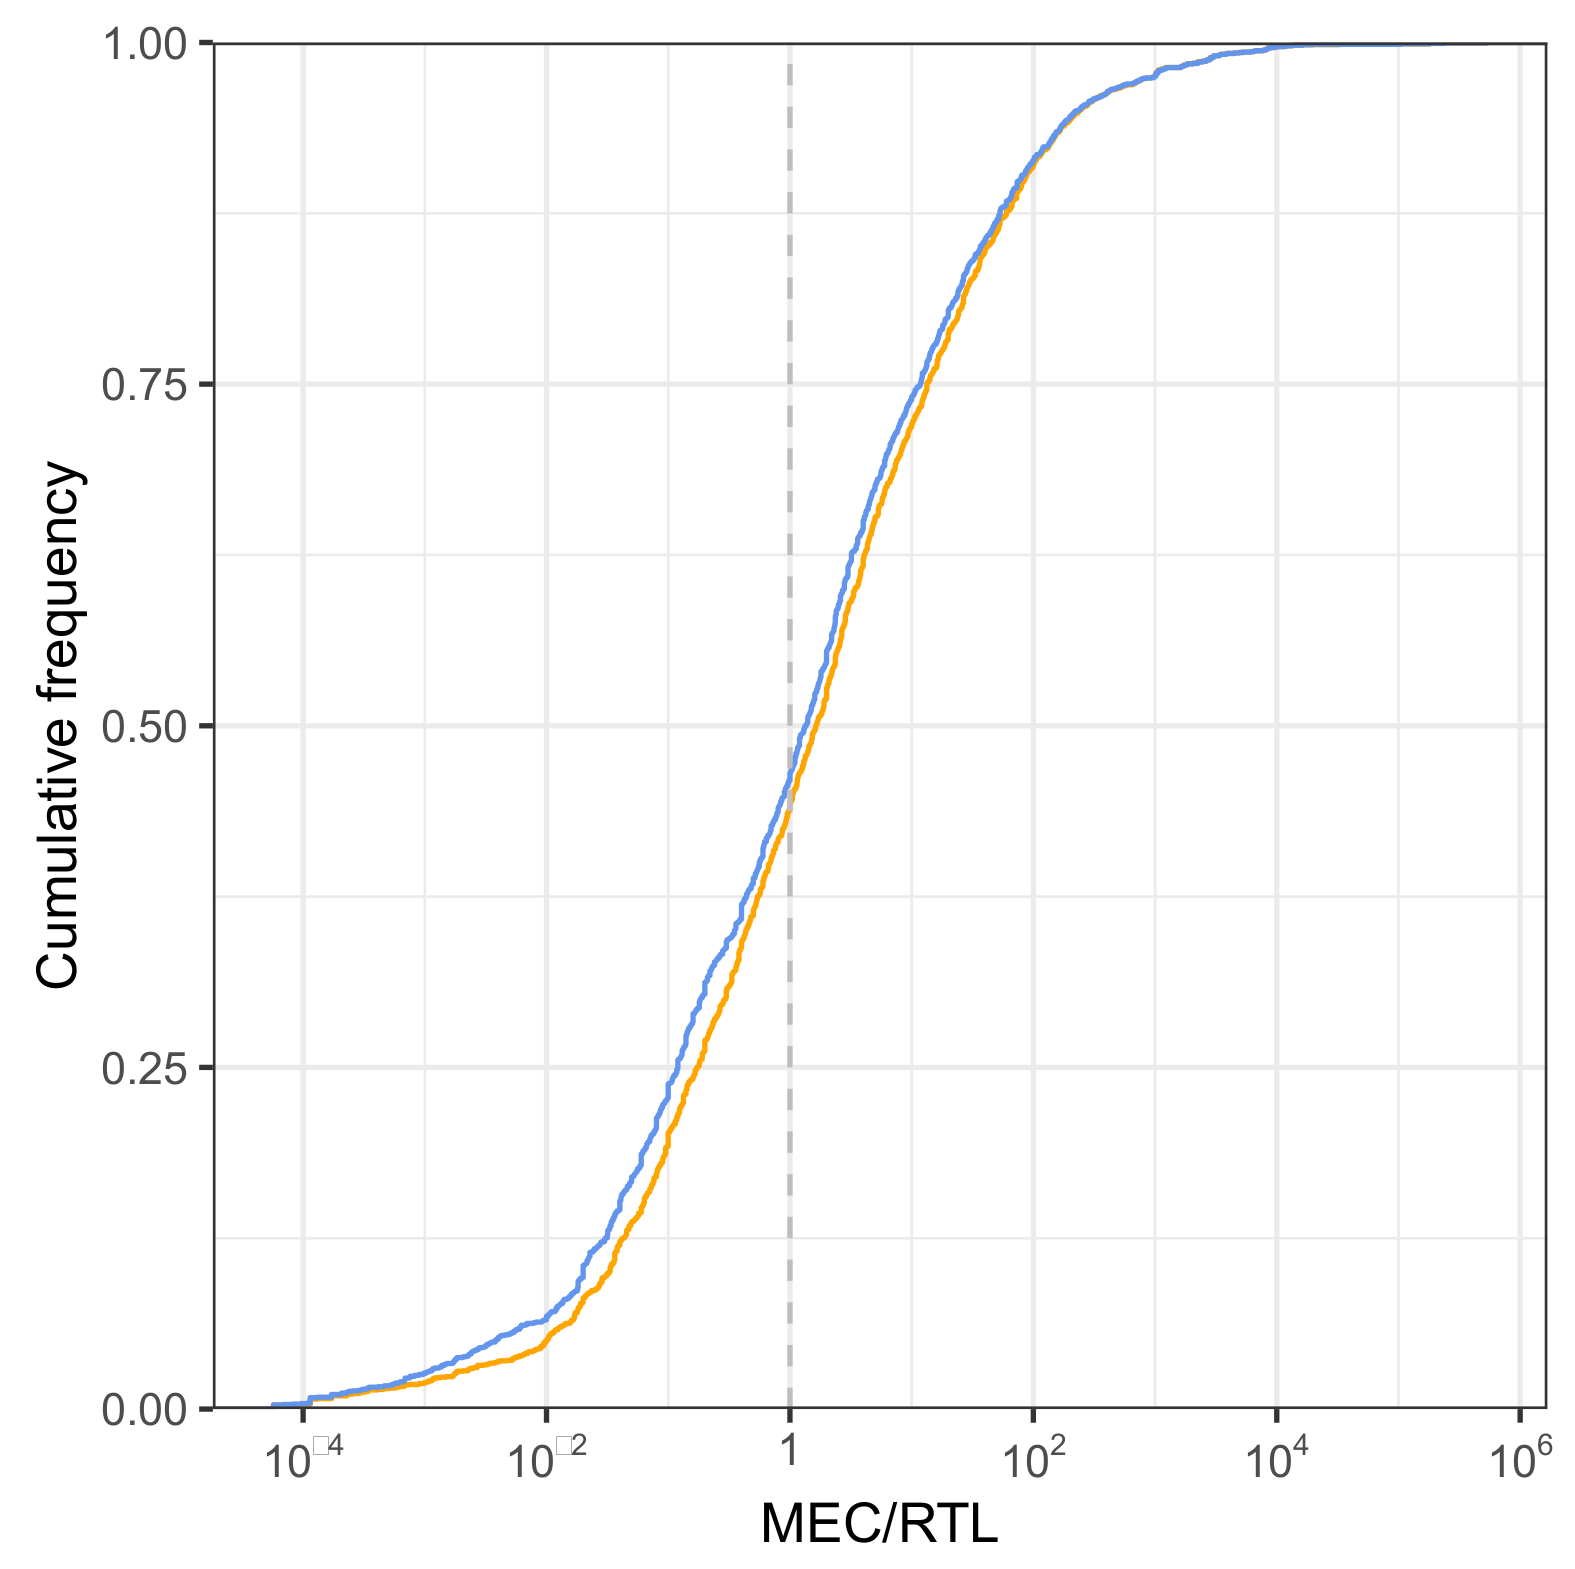
3.6. Model Application
3.7. Case Study
4. User Notes
Supplementary Materials
Author Contributions
Funding
Conflicts of Interest
Appendix A

| Filter Criteria | Description | Model |
|---|---|---|
| 0 | Basic filter criteria, that select studies with a concentration larger than 0, convertible to ug/L, and conducted with freshwater medium. Further, a concentration must be specified, and not include “NR”, “ca”, “>”, “~”, or “x”. | Basic |
| 1 | The test type needs to be specified as “acute” or “not coded”. | Mid |
| 2 | Only acute endpoint types are selected, that describe a concentration at which an effect occurs for 50% of the tested organisms (i.e., LC50, EC50, IC50) | Mid |
| 3 | For animals, mortality and intoxication are allowed as effects; for plants, growth, reproduction, and population effects are selected. | Mid |
| 4 | The exposure duration should be one of the following: For animals: 48, 72, 96 h, 2, 3, 4 d for plants: 120 h, 5, 7, 14 d | Mid |
| 5 | Exclude studies with multiple measurements. | Full |
| 6 | Exclude studies with effect comments. | Full |
| 7 | The test substance purity should have a minimum of 70% active ingredient or specified as not coded not reported. | Full |
| 8 | Tests should be conducted with active ingredients, such that the concentration type should be the active ingredient or specified as not coded or not reported. | Full |
| 9 | Only laboratory studies are considered relevant. | Full |
| 10 | Certain formulations are excluded by name (e.g., IN-MP819, INJT333, DPX-KN125, INU8E24, INUYG24) | Full |
| 11 | The organism’s source should not be specified as wild or multiple. | Full |
| 12 | Only definitive endpoints are considered relevant. | Full |
| 13 | The test method must be specified. | Full |
| 14 | A chemical analysis must be conducted. | Full |
| 15 | The test should have been conducted with a proper control. | Full |
| 16 | Test organisms characterized with ‘> 24 h’, ‘>24 h’, or ‘Fry’ and tests conducted with the larval life stage of Macrobrachium rosenbergii are excluded. | Full |
| 17 | The publication year of the regulatory document needs to be older or equal to the reference year for the respective study. 1 | Full |
| Filter Criteria | Description | Model |
|---|---|---|
| 0 | Basic filter criteria, that select studies with a concentration larger than 0, convertible to ug/L, and conducted with freshwater medium. Further, a concentration must be specified, and not include “NR”, “ca”, “>”, “~”, or “x”. | Basic |
| 1 | Only acute endpoint types are selected, that describe a concentration at which an effect occurs for 50% of the tested organisms (i.e., LC50, EC50, IC50) | Mid |
| 2 | The exposure duration should be one of the following: For animals: 48, 72, 96 h for plants: Lower or equal to 336 h | Mid |
| 3 | Studies should be rated as supplemental or core. | Mid |
| 4 | Only definitive endpoints are considered relevant. | Mid |
| 5 | Certain formulations, or metabolites are excluded by name (e.g., IN-MP819, INJT333, DPX-KN125, weed killer, product, formulation, metabolite) | Full |
| 6 | The guideline should not be specified as NG (no guideline) | Full |
| 7 | The test substance purity should have a minimum of 70% active ingredient. | Full |
| 8 | The publication year of the regulatory document needs to be older or equal to the reference year for the respective study. 1 | Full |


Appendix B. Evaluation of Aquatic Life Benchmarks (ALB)
References
- Oerke, E.C. Crop losses to pests. J. Agric. Sci. 2006, 144, 31–43. [Google Scholar] [CrossRef]
- Popp, J.; Pető, K.; Nagy, J. Pesticide productivity and food security. A review. Agron. Sustain. Dev. 2013, 33, 243–255. [Google Scholar] [CrossRef]
- Food and Agriculture Organization of the United Nations (FAO). FAO FAOSTAT Database. Available online: http://www.fao.org/faostat/en/\#data/EL. (accessed on 1 November 2019).
- Bereswill, R.; Streloke, M.; Schulz, R. Current-use pesticides in stream water and suspended particles following runoff: Exposure, effects, and mitigation requirements. Environ. Toxicol. Chem. 2013, 32, 1254–1263. [Google Scholar] [CrossRef] [PubMed]
- Stone, W.W.; Gilliom, R.J.; Ryberg, K.R. Pesticides in U.S. Streams and Rivers: Occurrence and trends during 1992–2011. Environ. Sci. Technol. 2014, 48, 11025–11030. [Google Scholar] [CrossRef] [PubMed]
- Van Metre, P.C.; Alvarez, D.A.; Mahler, B.J.; Nowell, L.; Sandstrom, M.; Moran, P. Complex mixtures of Pesticides in Midwest US streams indicated by POCIS time-integrating samplers. Environ. Pollut. 2017, 220, 431–440. [Google Scholar] [CrossRef] [PubMed] [Green Version]
- FIFRA. Federal Insecticide, Fungicide and Rodenticide act. U.S. Federal Law, Amended in 1972 and 1988; FIFRA: Washington, DC, USA, 1947. [Google Scholar]
- U.S. Environmental Protection Agency. Reregistration and Other Review Programs Predating Pesticide Registration Review. Available online: https://www.epa.gov/pesticide-reevaluation/reregistration-and-other-review-programs-predating-pesticide-registration (accessed on 30 October 2019).
- U.S. Environmental Protection Agency. Overview of the Ecological Risk Assessment Process in the Office of Pesticide Programs, US Environmental Protection Agency Endangered and Threatened Species Effects Determinations; DIANE Publishing: Collingdale, PA, USA, 2004.
- U.S. Environmental Protection Agency. Ecological Effects Test Guidelines OCSPP 850.1075: Freshwater and Saltwater Fish Acute Toxicity Test; U.S. Environmental Protection Agency: Washington, DC, USA, 2016; pp. 1–19.
- U.S. Environmental Protection Agency. Ecological Effects Test Guidelines OCSPP 850.1010: Aquatic Invertebrate Acute Toxicity Test, Freshwater Daphnids; U.S. Environmental Protection Agency: Washington DC, USA, 2016; pp. 1–17.
- U.S. Environmental Protection Agency. Ecological Effects Test Guidelines OCSPP 850.4400: Aquatic Plant Toxicity Test Using Lemna spp.; U.S. Environmental Protection Agency: Washington, DC, USA, 2012; pp. 1–24.
- U.S. Environmental Protection Agency. Ecological Effects Test Guidelines OCSPP 850.4500: Algal Toxicity; U.S. Environmental Protection Agency: Washington, DC, USA, 2012; pp. 1–28.
- US EPA Evaluation Guidelines for Ecological Toxicity Data in the Open Literature. Available online: https://www.epa.gov/pesticide-science-and-assessing-pesticide-risks/evaluation-guidelines-ecological-toxicity-data-open (accessed on 30 March 2018).
- Wolfram, J.; Stehle, S.; Bub, S.; Petschick, L.L.; Schulz, R. Meta-analysis of insecticides in United States surface waters: Status and future implications. Environ. Sci. Technol. 2018, 52, 14452–14460. [Google Scholar] [CrossRef]
- Stehle, S.; Schulz, R. Agricultural insecticides threaten surface waters at the global scale. Proc. Natl. Acad. Sci. USA 2015, 112, 5750–5755. [Google Scholar] [CrossRef] [PubMed] [Green Version]
- Schulz, R.; Liess, M. A field study of the effects of agriculturally derived insecticide input on stream macroinvertebrate dynamics. Aquat. Toxicol. 1999, 46, 155–176. [Google Scholar] [CrossRef]
- Schäfer, R.B.; Bundschuh, M.; Rouch, D.A.; Szöcs, E.; von der Ohe, P.C.; Pettigrove, V.; Schulz, R.; Nugegoda, D.; Kefford, B.J. Effects of pesticide toxicity, salinity and other environmental variables on selected ecosystem functions in streams and the relevance for ecosystem services. Sci. Total Environ. 2012, 415, 69–78. [Google Scholar] [CrossRef]
- Schäfer, R.B.; Caquet, T.; Siimes, K.; Mueller, R.; Lagadic, L.; Liess, M. Effects of pesticides on community structure and ecosystem functions in agricultural streams of three biogeographical regions in Europe. Sci. Total Environ. 2007, 382, 272–285. [Google Scholar] [CrossRef]
- Beketov, M.A.; Kefford, B.J.; Schäfer, R.B.; Liess, M. Pesticides reduce regional biodiversity of stream invertebrates. Proc. Natl. Acad. Sci. USA 2013, 110, 11039–11043. [Google Scholar] [CrossRef] [PubMed] [Green Version]
- Schäfer, R.B.; Pettigrove, V.; Rose, G.; Allinson, G.; Wightwick, A.; von der Ohe, P.C.; Shimeta, J.; Kühne, R.; Kefford, B.J. Effects of pesticides monitored with three sampling methods in 24 sites on macroinvertebrates and microorganisms. Environ. Sci. Technol. 2011, 45, 1665–1672. [Google Scholar] [CrossRef] [PubMed]
- Vijver, M.G.; Hunting, E.R.; Nederstigt, T.A.; Tamis, W.L.; van den Brink, P.J.; van Bodegom, P.M. Postregistration monitoring of pesticides is urgently required to protect ecosystems. Environ. Toxicol. Chem. 2017, 36, 860–865. [Google Scholar] [CrossRef] [PubMed] [Green Version]
- Malaj, E.; Peter, C.; Grote, M.; Kühne, R.; Mondy, C.P.; Usseglio-Polatera, P.; Brack, W.; Schäfer, R.B. Organic chemicals jeopardize the health of freshwater ecosystems on the continental scale. Proc. Natl. Acad. Sci. USA 2014, 111, 9549–9554. [Google Scholar] [CrossRef] [Green Version]
- Morrissey, C.A.; Mineau, P.; Devries, J.H.; Sanchez-Bayo, F.; Liess, M.; Cavallaro, M.C.; Liber, K. Neonicotinoid contamination of global surface waters and associated risk to aquatic invertebrates: A review. Environ. Int. 2015, 74, 291–303. [Google Scholar] [CrossRef]
- Cairns, J. The myth of the most sensitive species. BioScience 1986, 36, 670–672. [Google Scholar] [CrossRef]
- U.S. Environmental Protection Agency. Pesticides Chemical Search | Chemical Search | Pesticides | US EPA. Available online: https://iaspub.epa.gov/apex/pesticides/f?p=chemicalsearch:1 (accessed on 2 March 2018).
- U.S. Environmental Protection Agency. US EPA’s Web Archive: Pesticide Reregistration Status. Available online: https://archive.epa.gov/pesticides/reregistration/web/html/status.html (accessed on 2 March 2018).
- U.S. Environmental Protection Agency. Aquatic Life Benchmarks and Ecological Risk Assessments for Registered Pesticides. Available online: https://www.epa.gov/pesticide-science-and-assessing-pesticide-risks/aquatic-life-benchmarks-and-ecological-risk (accessed on 31 October 2019).
- U.S. Environmental Protection Agency. Special Docket for Pesticide Reregistration Risk Assessments-Risk Assessments and Related Documents (DVD Set); U.S. Environmental Protection Agency: Washington, DC, USA, 2007.
- U.S. Environmental Protection Agency. Registration Review Process. Available online: https://www.epa.gov/pesticide-reevaluation/registration-review-process (accessed on 23 October 2019).
- U.S. Environmental Protection Agency. (2019) ECOTOX User Guide: ECOTOXicology Knowledgebase System. Version 5.0. Available online: http:/www.epa.gov/ecotox/ 2019 (accessed on 1 November 2019).
- U.S. Environmental Protection Agency. (2019) USEPA Pesticide Ecotoxicity Database. Available online: https://ecotox.ipmcenters.org/index.cfm?menuid=7 (accessed on 1 November 2019).
- U.S. Environmental Protection Agency. Ecological Effects Test Guidelines OCSPP 850.1020: Gammarid Amphipod Acute Toxicity Test; U.S. Environmental Protection Agency: Washington, DC, USA, 2016; pp. 1–18.
- Beasley, A.; Belanger, S.E.; Otter, R.R. Stepwise Information-Filtering Tool (SIFT): A method for using risk assessment metadata in a nontraditional way: Stepwise Information-Filtering Tool (SIFT). Environ. Toxicol. Chem. 2015, 34, 1436–1442. [Google Scholar] [CrossRef]
- Connors, K.A.; Beasley, A.; Barron, M.G.; Belanger, S.E.; Bonnell, M.; Brill, J.L.; de Zwart, D.; Kienzler, A.; Krailler, J.; Otter, R.; et al. Creation of a curated aquatic toxicology database: EnviroTox. Environ. Toxicol. Chem. 2019, 38, 1062–1073. [Google Scholar] [CrossRef] [Green Version]
- Bub, S.; Wolfram, J.; Stehle, S.; Petschick, L.L.; Schulz, R. Graphing ecotoxicology: The MAGIC Graph for linking environmental data on chemicals. Data 2019, 4, 34. [Google Scholar] [CrossRef] [Green Version]
- U.S. Environmental Protection Agency. Environmental Fate and Ecological Risk Assessment Problem Formulation. In Support of Registration Review of Formetanate HCl; U.S. Environmental Protection Agency: Washington, DC, USA, 2010.
- R Core Team. A Language and Environment for Statistical Computing. Vienna, Austria: R Foundation for Statistical Computing; 2012; R Foundation for Statistical Computing: Vienna, Austria, 2019. [Google Scholar]
- Wickham, H. Ggplot2: Elegant Graphics for Data Analysis; Springer: New York, NY, USA, 2009; ISBN 978-0-387-98140-6. [Google Scholar]
- RPostgreSQL: R Interface to the ‘PostgreSQL’ Database System. Available online: https://cran.r-project.org/web/packages/RPostgreSQL/index.html (accessed on 1 November 2019).
- WoRMS. Editorial Board World Register of Marine Species; WoRMS: Ostend, Belgium, 2019. [Google Scholar]
- Stephen, C.E.; Mount, D.I.; Hansen, D.J.; Gentile, J.R.; Chapman, G.A.; Brungs, W.A. Guidelines for Deriving Numerical National Water Quality Criteria for the Protection of Aquatic Organisms and Their Uses; U.S. Environmental Protection Agency: Washington, DC, USA, 1985.
- Guiry, M.D.; Guiry, G.M. AlgaeBase. World-Wide Electronic Publication, National University of Ireland, Galway. Available online: https://www.algaebase.org (accessed on 10 August 2019).
- Pesticide Use in U.S. Crop Production: 2002. Available online: https://pdfs.semanticscholar.org/739e/6ad4b29880c43ab7e8509e0af53111c69735.pdf (accessed on 1 November 2019).
- Haukoos, J.S.; Lewis, R.J. Advanced statistics: Bootstrapping confidence intervals for statistics with “difficult” distributions. Acad. Emerg. Med. 2005, 12, 360–365. [Google Scholar] [CrossRef]
- Wood, M. Bootstrapped confidence intervals as an approach to statistical inference. Organ. Res. Methods 2005, 8, 454–470. [Google Scholar] [CrossRef]
- Cumming, G. Inference by eye: Reading the overlap of independent confidence intervals. Stat. Med. 2009, 28, 205–220. [Google Scholar] [CrossRef] [PubMed]


| Column | Explanation |
|---|---|
| CAS Number | Chemical abstract service identifier |
| RTLe | Estimated regulatory threshold level [ug/L] |
| Database | Source of the presented RTLe, i.e., ECOTOX database, OPP database |
| Classification | Fung = fungicides, Herb = herbicides, Ins = insecticides, Other = other category according to MAGIC graph [36] classification, Unclassified = no classification |
© 2019 by the authors. Licensee MDPI, Basel, Switzerland. This article is an open access article distributed under the terms and conditions of the Creative Commons Attribution (CC BY) license (http://creativecommons.org/licenses/by/4.0/).
Share and Cite
Petschick, L.L.; Bub, S.; Wolfram, J.; Stehle, S.; Schulz, R. Modeling Regulatory Threshold Levels for Pesticides in Surface Waters from Effect Databases. Data 2019, 4, 150. https://doi.org/10.3390/data4040150
Petschick LL, Bub S, Wolfram J, Stehle S, Schulz R. Modeling Regulatory Threshold Levels for Pesticides in Surface Waters from Effect Databases. Data. 2019; 4(4):150. https://doi.org/10.3390/data4040150
Chicago/Turabian StylePetschick, Lara L., Sascha Bub, Jakob Wolfram, Sebastian Stehle, and Ralf Schulz. 2019. "Modeling Regulatory Threshold Levels for Pesticides in Surface Waters from Effect Databases" Data 4, no. 4: 150. https://doi.org/10.3390/data4040150
APA StylePetschick, L. L., Bub, S., Wolfram, J., Stehle, S., & Schulz, R. (2019). Modeling Regulatory Threshold Levels for Pesticides in Surface Waters from Effect Databases. Data, 4(4), 150. https://doi.org/10.3390/data4040150