1. Introduction
Pulmonary tuberculosis (TB) has a long history as a major disease in humans and animals. In 2017, 1.7 million people died from the disease mostly in developing countries [
1]. A causative agent of TB—
Mycobacterium tuberculosis (MTB)—causes severe implications for a patient usually associated with lung tissue destruction. By now, there is a large group of patients with extensive drug-resistant (XDR) and multi-drug resistant (MDR) tuberculosis requiring not only a long-term treatment using the newest drugs, but also surgical intervention. Therefore, unravelling mechanisms of lung tissue destruction and the quest for possibilities of early diagnosis and new approaches to the treatment of this pathology remain on the top of the agenda for recent research [
2,
3,
4]. One of the promising diagnostic directions is a discovery of specific predictors or biomarkers allowing for assessing the necessity of surgical intervention or therapy prolongation. The "quest for biomarkers" is an established approach in biomedicine especially for cancer and neurodegenerative diseases [
5,
6]. It is aimed at finding specific molecules whose concentration or activity can either define the pathological process localization or predict not only the therapy success, but also the pathology evolution. At the same time, such approach to tuberculosis is in its first stages in spite of a recent high demand [
7,
8,
9].
A promising candidate for possible biomarkers is a group of special enzymes—matrix metalloproteinases (MMP), involved in the destruction of the lung tissue. Under normal conditions, most of the MMPs are not expressed; however, their overexpression is observed during inflammation. The intensity of MMP-expression is regulated by anti-inflammatory cytokines and bacterial lipopolysaccharides [
10,
11,
12,
13]. MMP-enzymes are synthesized as pro-enzymes, activated at the post-translational level with participation of proteases and regulated by specific tissue inhibitors (TIMPs,
-macroglobulin).
The role of MMPs in the destruction of the connective tissue of the lungs mostly consisting of collagen—the main structural protein of the lung—caused by
Mycobacterium tuberculosis (MBT) has not yet been fully investigated [
14,
15]. However, several types of metalloproteinases (MMP-1,3,8, 9) were identified, varying their concentration levels with the development of the pulmonary tuberculosis [
16]. The main role in the initiation of the destruction process of type I collagen is attributed to MMP-1 [
17]. MMP-8 is a component of neutrophilic fractions modulating the activity of chemokines. Its increase in pulmonary tuberculosis together with MMP-9 reflects the severity of the destructive process [
15,
18,
19,
20]. During effective treatment, MMP concentrations reduce [
21,
22].
Most studies of MMPs in tuberculous inflammation have been carried out either in vitro [
23] or in animal models [
24]; clinical studies are rare, and therefore their value is especially high. Recent research [
21,
25] has shown that the observed imbalance in the MMP system/inhibitors does not depend on the treatment outcome (initial therapy phase), but an increase in the enzymatic level is accompanied by TIMP-1 and
-macroglobulin maintaining their concentration within the reference range. During the intensive phase of therapy (the first three months) of patients with the infiltrative form of tuberculosis, there is a significant decrease, but not normalization of the initially elevated level of MMP-9. This, in combination with the increased level of the neutrophilic collagenases (MMP-8), reduces the probability of the cavity closing. However, the combination of increased concentrations of MMP-1 and MMP-9 accompanies the cavity closing. Thus, as the previous study [
21] implies, MMPs could serve as markers of severity and activity of the process: changes in MMP-1 concentration can be related to the presence of lesions and the type of anti-TB drugs sensitivity of
MTB isolates. An increase in MMP-9 and MMP-8 concentrations characterizes the destruction volume and the activity of the process, respectively. Results of these studies [
21,
25] agree with earlier investigations [
18,
19,
26]: MMP-8 concentration in the sputum of patients with lung tissue destruction exceeded five times the concentration in patients without cavities. In addition, a correlation between sputum concentrations of both MMP-8 and MMP-9, and clinical markers of disease severity, was higher than for MMP-9 alone.
It should be noted that the changes in the levels of MMP concentration in pulmonary tuberculosis are also associated with clinical factors such as bacteriological secretions and biological properties of MTB. In particular, the drug resistance (MDR or XDR) of M. tuberculosis strains can also contribute to the drastic development of the tissue destruction and high levels of all biochemical markers (cytokines, enzymes and metabolites of the inflammation process).
In this contribution, we present biochemical and bacteriological data obtained from patients examined in the Saint Petersburg State Research Institute of Phthisiopulmonology before a full course of treatment was performed. Data processing introduced allows for determining which metalloproteinases could serve as markers for the severity of the inflammatory process in pulmonary tuberculosis.
2. Data Description
The data were obtained from 234 patients with pulmonary tuberculosis (TB) treated at the State Research Institute of Phtisiopulmonology (SRIP) in the time period of 2009–2017. The average age of the patients was 35.6 ± 0.8 years. There were 145 men and 88 women. All eligible patients gave their consent to participate. There are some missing values in the dataset due to the lack of clinical data saved as handwritten records in the Institute’s hospital. The healthy group (20 persons) was chosen among scientists and clinicians of SRIP in such a way that the averaged age was consistent with the patient cohort. However, for the control group, only data on clinical markers (TIMP-1, MMP-1, MMP-8, MMP-9) were available. For further analysis, TIMP-1 will be referenced as TIMP. There were two groups of patients with diagnosed (by computed tomography, CT) forms of pulmonary tuberculosis: infiltrative TB (ITB) and fibro-cavernous TB (FCTB). The first group includes patients examined at the Institute for the first time and who were not treated yet. Patients with the FCTB form expected a surgical intervention and already took a course of the treatment to repress a bacteria excretion. The details of marker concentration measurements and CT procedures are given in the Methods section below.
The introduced dataset (
Table S1, Supplementary Materials) includes the information on the biomarkers’ concentration recorded and the characteristics of tuberculosis forms, such as a number of inflammation foci, the tissue destruction volume and the total lesion volume. Information about drug-resistance (multi-drug, extra-drug and sensitive ) of
M. tuberculosis strains was also provided. As an accessory material, some additional general characteristics of patients—gender, body mass index, etc.—are added when they were available in medical records. All explanations for the data in
Table S1 is given in
Table S2 (Supplementary Materials).
3. Data Processing and Analysis
The self-written Python and Matlab code was used for the general processing of the data collected during the clinical study. For statistical testing, the standard Matlab functions were used.
The reported data include many common clinical characteristics (diagnosis, age and gender, body mass index, etc.), which we share for further research. Here, we would like to focus on the problem stated above: if it is possible to use clinical measurements of enzymes/inhibitors concentrations in blood as indicators for drug-sensitivity of isolated strains and/or clinical forms of tuberculosis.
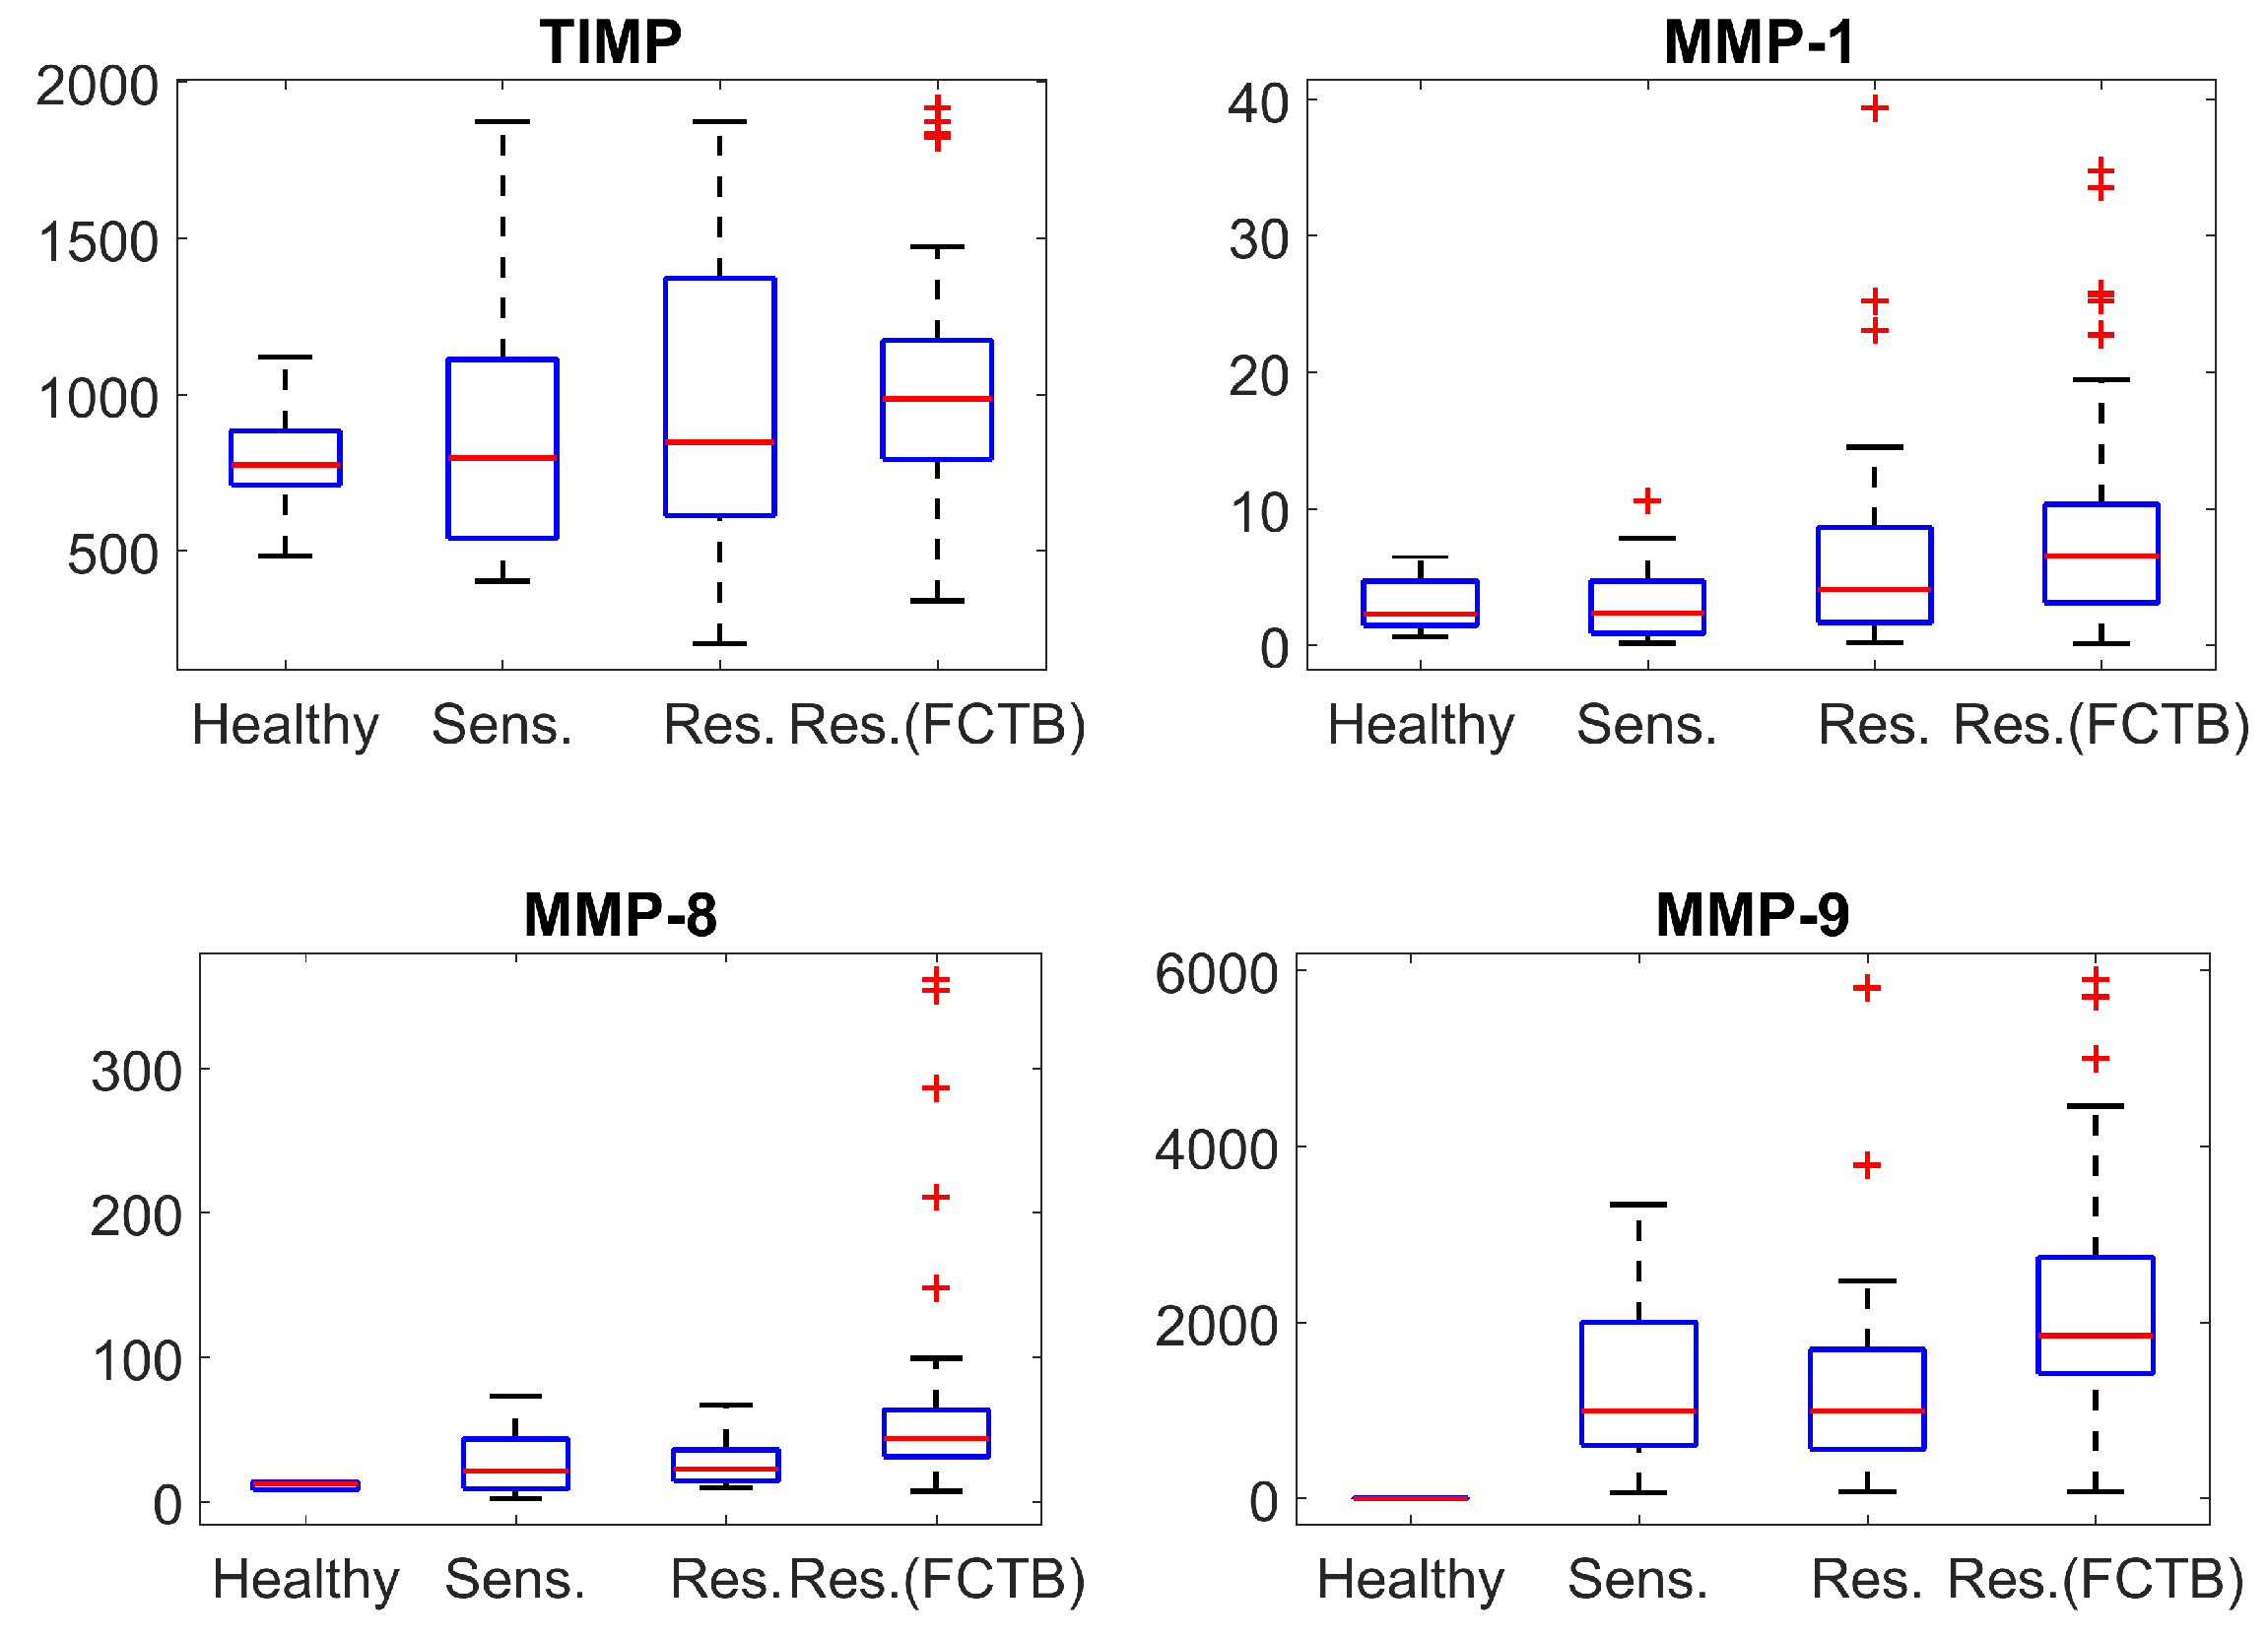
Due to a relatively small size of the available samples and the unknown type of the respective probability distributions, which is practically impossible to determine analytically with a proper accuracy, first we use the nonparametric Mann–Whitney U test (MW). It is a conventional approach to such kind of data (for a small sample size) and it assesses the statistical difference between medians of compared samples as well as the visual representation using 25th and 75th percentiles. In order to reduce the risk of the false positives rate, the significance level of 1% was chosen. As shown in
Figure 1 and in
Table 1, where ’true’ and ’false’ denote the presence or absence (null hypothesis) of the statistical difference between median values at this level of significance. At the same time,
Table 1 also reports the respective
p-values quantitatively that provide an additional information to discuss a difference/similarity between various responses.
Respectively, one can see that the concentration of TIMP (inhibitor of metalloproteinases) slightly changes for all forms of tuberculosis caused by drug-sensitive and drug-resistant strains in the case of the ITB. However, the changes in MMPs concentrations are more drastic and may be significant. The concentration of MMP-1 and MMP-8 slightly changes for the tuberculosis caused by sensitive strains (in the case of ITB), but, in the case of resistant strains (notwithstanding diagnosis), there are actually abnormal concentrations of MMP-8. The similarly high concentration is also observed for MMP-9; however, its level substantially increases for TB caused by sensitive strains as well.
Figure 1 shows that distributions of concentrations of MMPs and TIMP possess a large number of outliers. In particular, the number of outliers is larger for drug-resistant strains in comparison with the drug-sensitive strains. This suggests a question if the hypothesized difference between distributions can serve as a discriminant criterion even in the case of statistically coinciding medians (as shown by a Mann–Whitney U test)?
In order to check this assumption, we applied the two-sample Kolmogorov–Smirnov test (KS), which allows for concluding whether two data sets belong to the same continuous probability distribution or not. The results of this test, evaluated at the same significance level of 1% as in a MW-test, are shown in
Table 2, where the ’false’ means that two samples are from the same distribution, and the ’true’ that they are not (again, the qualitative conclusion corresponds to the denoted level of significance and quantitative
p-values are supplied for a more detailed discussion). One can see that the presence of mycobacteria in an organism already results in different distributions of the measured concentrations of metalloproteinase MMP-8 and MMP-9, although one can note a different relationship to the resistance status in the case of the former; this will be discussed below. However, such effect indicates the presence of the bacterial content only, and the change in the type of distribution induced by the latter does not depend on the drug sensitivity at the chosen significance level for ITB. The last statement also clarified the effect of drug resistance in the case of MMP-1 revealed by the MW-test as shown in
Table 1 and
Table 2: the distribution is the same for both drug sensitive and drug-resistant cases as shown by the
p-value of 0.19 that definitely does not reject the null hypothesis, but the latter case leads to the larger value of this distribution’s median reflected in the
p-value equal to 0.051, which is an order smaller and tends to border on a significant difference between medians at the standard level of 5%.
On the contrary, the characteristic features of bio-markers’ concentrations demonstrate substantially different behaviour for different types of tuberculosis (see
Figure 1). We have indicated the large number of outliers for MMP-8 level in fibro-cavernous TB as well as for MMP-1 concentration changes for both TB clinical forms—infiltrative TB (ITB) and fibro-cavernous TB (FCTB) among drug resistant strains. Although the difference does not reach a 1% significance level, the respective
p-values are below 0.05. There are no outliers for MMP-8 for “drug-resistant” ITB compared with the same type of resistance for FCTB. This is already confirmed by the drastic change of the distribution type revealed by the K–S test; see
Table 2. Such situation could be conditioned by various drug resistant strains—most of the FCTB cases are initiated by XDR strains and most of the resistant ITB cases by MDR strains. Another notable effect, which could be due to such a reason, is observed for the TIMP concentration. This supports the importance of studying distribution type in the biomarkers-related problems. Namely, the medians of TIMP concentrations does not differ statistically for “drug-resistant” ITB and FCTB types according to the MW-test, but the respective probability distributions are different for these two TB forms as follows from the K–S test.
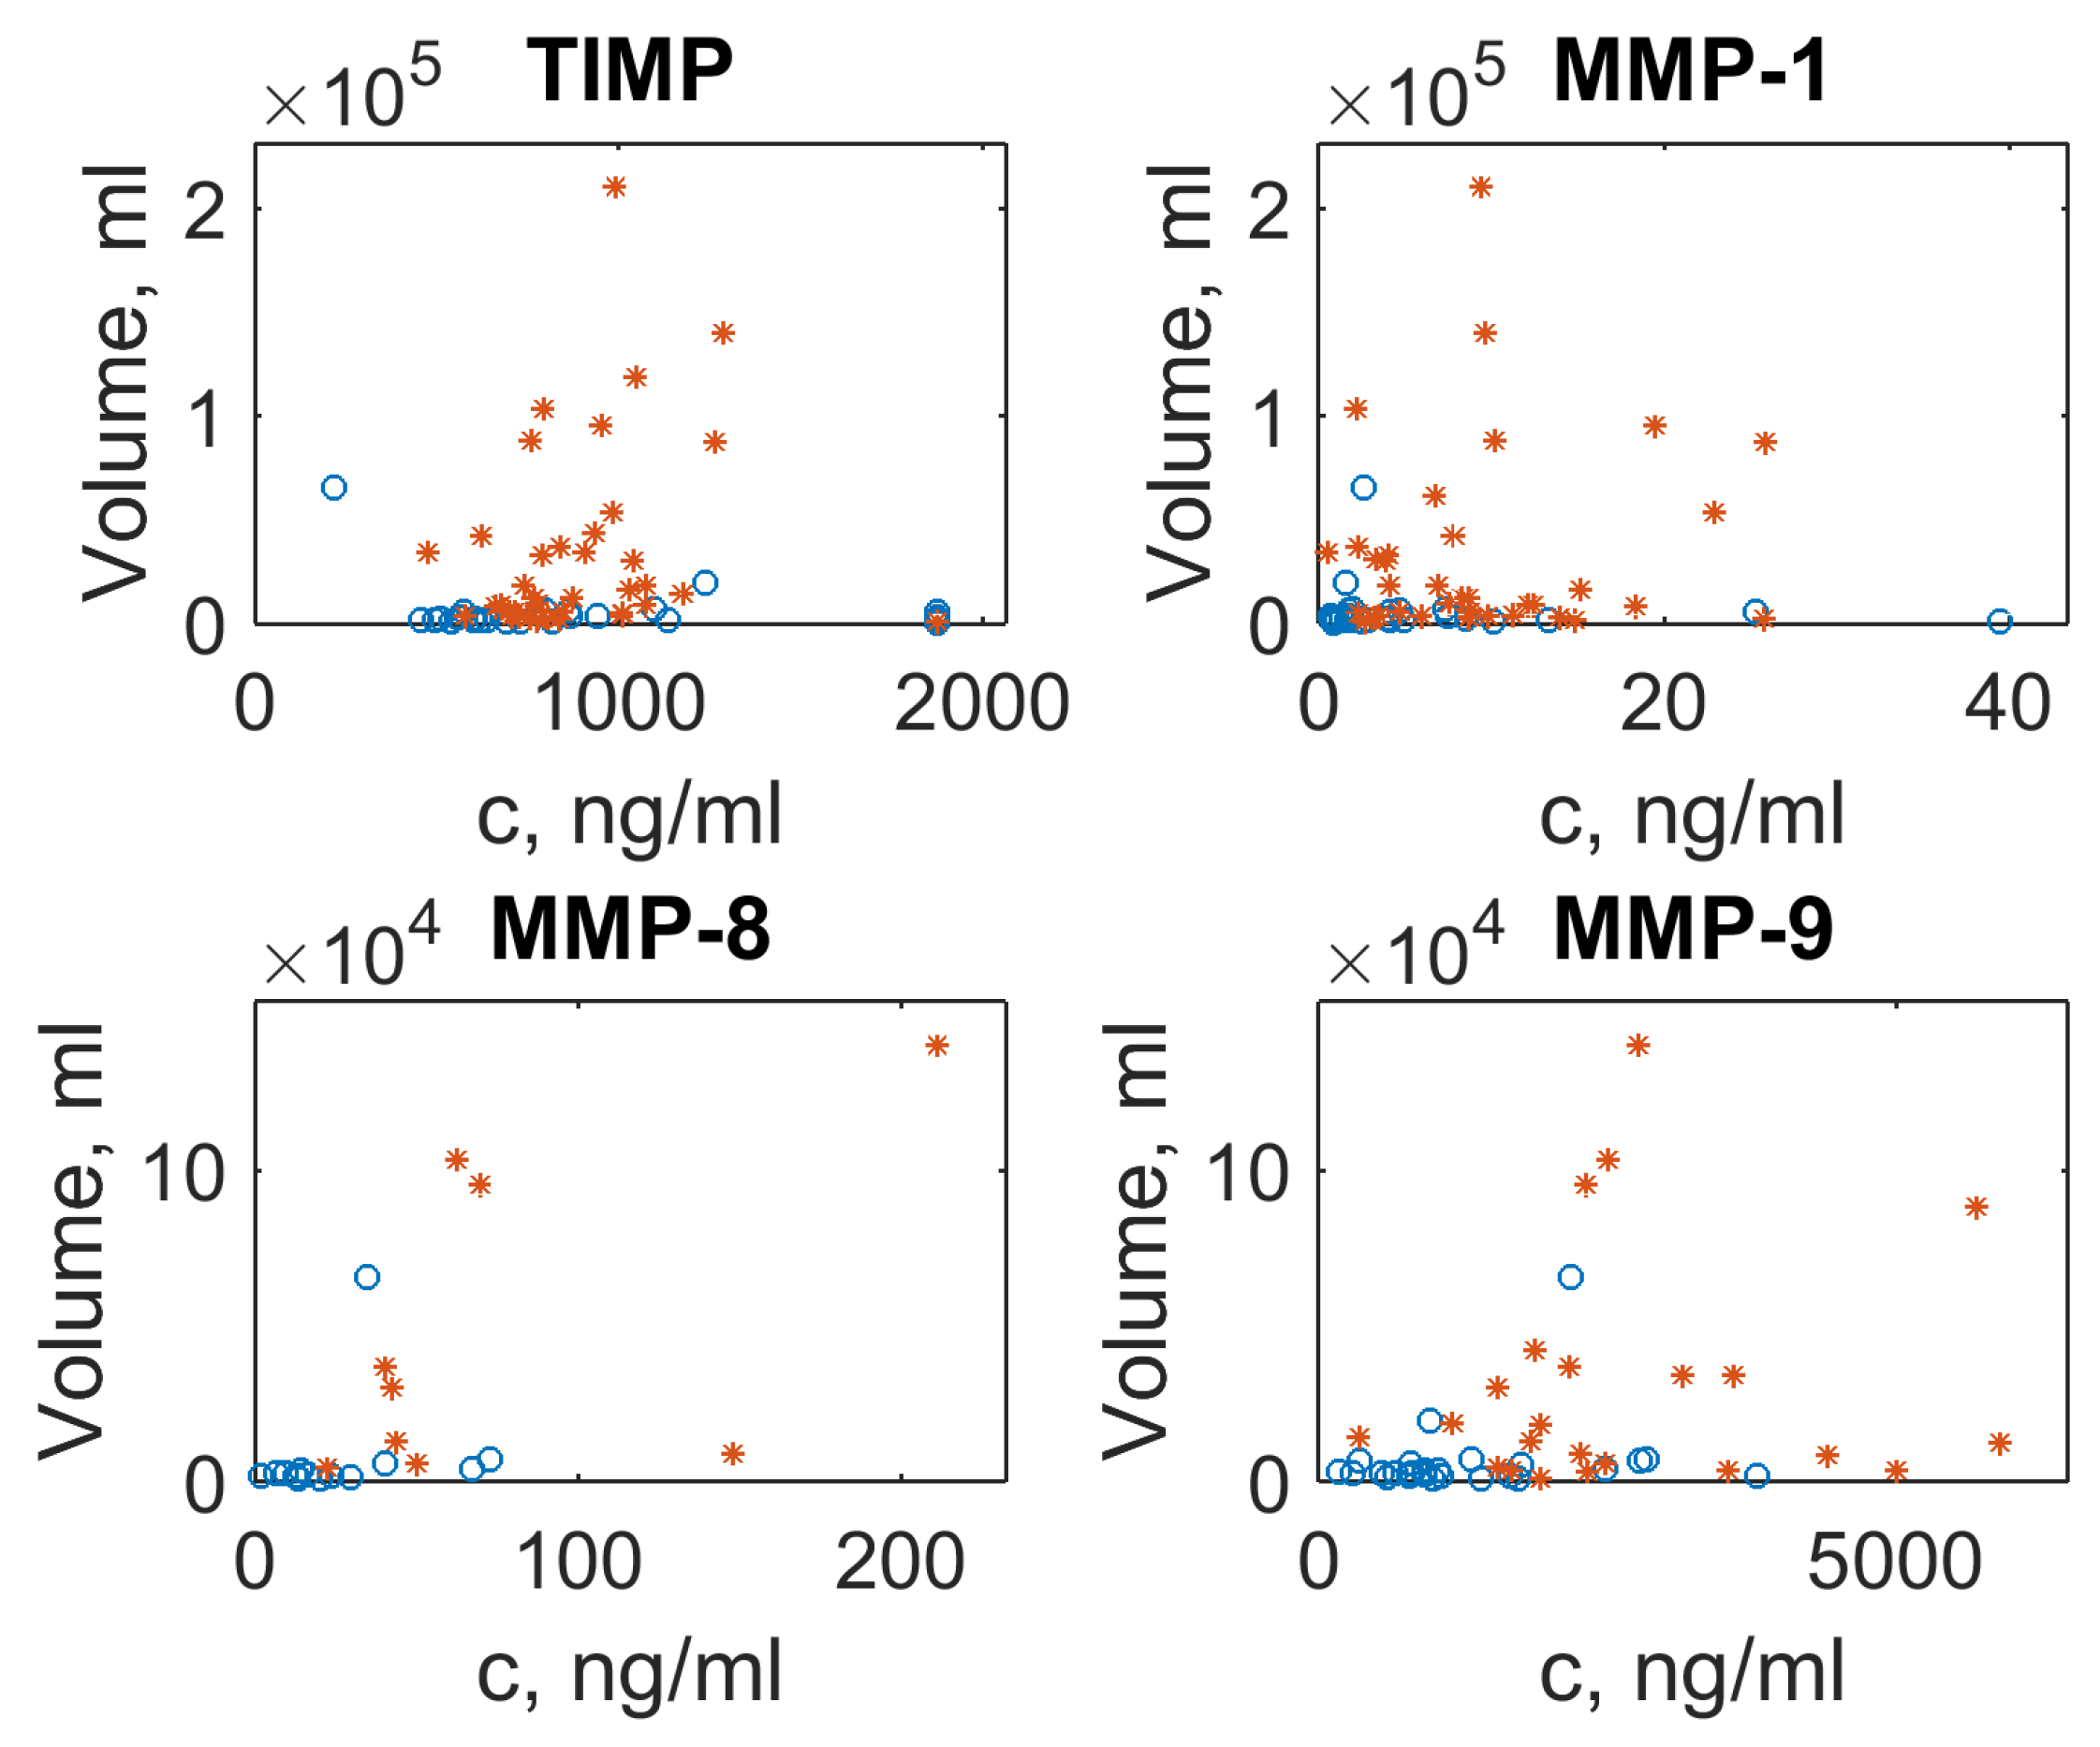
In order to illustrate the dependency of the MMP/TIMP level on the lesion volume in different forms of TB, we have plotted the lesion volume against MMP/TIMP concentrations as the scatter plots (see
Figure 2). In the case of multiple lesion foci (see
Supplementary Materials Table S1), the average focus size was used. There is no clear trend visible, but outliers with abnormal concentration for MMP-1, MMP-8 and MMP-9 correspond to extra-large lesion volumes typical for FCTB. The concentration of TIMP, however, changes only slightly: lesion volume values for two TB forms are clustered as a “small cloud” near an average concentration equal to 1000
g/mL.
4. Methods
The detection of mycobacteria from diagnostic material (sputum) was performed using the following methods: (1) fluorescent microscopy; (2) strains isolation by Lowenstein–Jensen or Middlebrook 7H9 (BACTEC MGIT 960 automated system) medium; and (3) real-time polymerase chain reaction (PCR-RV) (Sintol, Russia). To determine drug sensitivity, cultures have been harvested in the presence of anti-TB drugs.
Serum samples were collected for 3–4 months and stored at the temperature of C. Blood samples (15 mL) were allowed to clot for 30 minutes. Then, they were centrifuged for 10 minutes at 4000 g for 15 min. The concentrations of serum levels MMPs and TIMP-1 were measured using the ELISA technique. The procedures were performed according to the manufacturer’s protocols. The final results were recorded at 450 nm on an ELISA plate reader (Bio Rad Laboratories, Inc., Hercules, CA, USA).
Examination of the thoracic region was performed using multi-slice spiral computed tomography (CT) on Toshiba Aquilion 32 and Aquilion Prime tomographs (Toshiba, Minato, Japan) with a slice thickness of 1 mm. A patient’s position was lying with hands behind the head. A preliminary scanning zone was defined from the upper aperture of the chest to the costal-diaphragmatic sinuses. The study of pathological changes in the lungs was carried out in a standard “pulmonary window” (–1200/–600 HU). Additionally, lung changes were analyzed using the Nodule Analysis and Lung Volume Analysis packages. The following structural changes were determined: extension and distribution of a specific lesion, the total volume of foci (mm), and the total volume of tissue destruction (mm).
5. Conclusions and Outlooks
In this contribution, we present clinical data on concentrations of metalloproteinases and their inhibitor, which could be useful to reveal biomarkers for the severity of an inflammation process in the pulmonary tuberculosis. Due to the limited sample size, however, it is rather difficult to definitely assert which markers characterize the severity of the disease process. However, analyzing the data using two different tests (Mann–Whitney U and Kolmogorov–Smirnov) made it possible to identify some trends. The large number of outliers for resistant TB (see
Figure 1) might indicate the existence of a heavy-tailed distribution. It implies that extreme events of extra large MMPs concentrations might indicate a possible presence of the drug-resistant strain in a patient’s organism.
Moreover, our approach provides an additional insight related to the statistical analysis of such kind of clinical data. While the conventional approach in medical statistics usually operates with the Mann–Whitney test alone, i.e., with the comparison of medians of data samples, the difference between the probability distributions might contain important information as well. It may serve as a diagnostics criterion, which distinguishes between clinical cases even when the Mann–Whitney test demonstrates the coincidence of median values. The typical example of such situation is either presence or absence of extreme events in the data mentioned above. Thus, we highlight that an additional test for such kind of data are required, e.g., the Kolmogorov–Smirnov test, which compares the cumulative distribution of the two data sets and allows for distinguishing between them. These two tests, used together, can complement each other and get more relevant information from clinical data with multiple missing values.

 and
and 

