Article

Spatiotemporal Analysis of Urban Mobility Using Aggregate Mobile Phone Derived Presence and Demographic Data: A Case Study in the City of Rome, Italy

by
Claudio Gariazzo
1,*,
Armando Pelliccioni
1 and
Maria Paola Bogliolo
2
1
Department of Occupational & Environmental Medicine, INAIL, Via Fontana Candida 1, 00040 Monteporzio Catone (RM), Italy
2
Department of Technological Innovation, INAIL, Via R. Ferruzzi, 38/40, 00143 Rome, Italy
*
Author to whom correspondence should be addressed.
Submission received: 11 October 2018 / Revised: 18 December 2018 / Accepted: 29 December 2018 / Published: 8 January 2019

Abstract

:
Urban mobility is known to have a relevant impact on work related car accidents especially during commuting. It is characterized by highly dynamic spatial–temporal variability. There are open questions about the size of this phenomenon; its spatial, temporal, and demographic characteristics; and driving mechanisms. A case study is here presented for the city of Rome, Italy. High-resolution population presence and demographic data, derived from mobile phone traffic, were used. Hourly profiles of a defined mobility factor (NPM) were calculated for a gridded domain during working days and cluster analyzed to obtain mean diurnal NPM mobility patterns. Age distributions of the population were calculated from demographic data to get insight in the type of population involved in mobility, and spatially linked with the mobility patterns. Census data about production units and their employees were related with the classified NPM mobility patterns. Seven different NPM mobility patterns were identified and mapped over the study area. The mobility slightly deviates from the census-based demography (0.15 on average, in a range of 0 to 1). The number of employees per 100 inhabitants was found to be the main driving mechanism of mobility. Finally, contributions of people employed in different economic macrocategories were assigned to each mobility time-pattern. Results provide a deeper knowledge of urban dynamics and their driving mechanisms in Rome.

1. Introduction

Urban mobility is one of the challenges that cities have to face. Characterization of urban mobility is mandatory for structuring more effective urban policies, such as transport network. Conventional methods, such as census or surveys by questionnaires or interviews, are unable to describe the complexity of mobility of the population, since they capture an isolated picture of the phenomenon. Consequently, these methods are unable to detect the spatial–temporal dynamics of mobility occurring in large cities.
The large penetration of mobile phones, and the ability to locate users by analyzing telecommunication traffic, opens up the possibility of using this technology to study the population mobility at high spatial and temporal resolution. The potential of population data derived from mobile phone traffic, with respect to conventional data, opened up new implications for a better understanding of urban usages, in time and space [1].
Some studies [2,3] first introduced the use of mobile phone data for urban population analysis. A few investigations [4,5,6] presented comprehensive reviews on the different spatial studies using mobile phone data, presenting the progress that has been achieved and the potential of mobile phone data. Steenbruggen et al. [4] presented a comprehensive review and a typology of spatial studies on mobile phone data. Wang et al. [5] reviewed the existing travel behavior studies that have used mobile phone data, presenting the progress achieved and their potential in this field of research. Calabrese et al. [6] reviewed the use of mobile phone data for urban sensing, outlining the data that can be collected from telecommunication networks as well as their strengths and weaknesses.
Several authors [7,8,9,10,11,12,13,14,15,16,17,18,19,20,21,22,23,24,25,26,27,28,29,30] carried out studies on the mobility of urban populations by means of mobile phone data using different methods, which vary with data types and research purposes.
Many studies refer to the identification of either travel, activity or mobility patterns in different countries. Ahas et al. [7] developed a methodology for measuring time use patterns of urban life (or social time) finding differences in social time patterns across the cities of Harbin, Paris, and Tallinn. Sevtsuk and Ratti [8], by applying FFT and a multilevel regression model of Erlang data, were able to distinguish the hourly, daily, and weekly activity distribution patterns in the city of Rome. Secchi et al. [14] identified subregions of the metropolitan area of Milan sharing a similar pattern along time by means of a nonparametric method. Widhalm et al. [13] modeled the dependencies between activity type, trip scheduling, and land use types in the cities of Vienna and Boston, via a Relational Markov Network. The Far East areas were often studied for mobility patterns. Fang et al. [17] and Yang et al. [18,19] assessed the stability of human convergence and divergence patters in the city of Shenzhen, China, using a spatiotemporal model. Yuan et al. [20] found the Dynamic Time Warping algorithm effective in exploring the similarity/dissimilarity of urban mobility patterns in a masked city of China. Human mobility patterns in the city of Shenzhen, China were also studied by Sun et al. [22] and Xu et al. [23] by applying Principal Component Analysis on mobile phone data and a hierarchical clustering algorithm on aggregated human mobility patterns respectively. Lee et al. [24] analyzed and compared urban activity and mobility patterns from mobile phone records across 10 cities in Korea, presenting the internal and external mobility of phone users and calculating urban attractiveness. Jiang et al. [25] quantified spatial distributions of travel patterns by residents in different parts of the city of Singapore. Fan et al. [26] proposed an approach of human trajectory gridding reconstruction based on mobile phone location data to estimate the urban crowd flux in the city of Beijing, China.
Trips and ranges of travel of people were also studied by several authors [10,11,15,21]. Trasarti et al. [28] used mobile phone data to extract interconnections between different areas of the city of Paris from highly correlated temporal variations of local population densities. Understanding the city dynamics through GIS visualization or real-time urban monitoring system, both based on mobile phone data, was approached by Demissie et al. [9] and Calabrese et al. [27]. At a larger spatial scale, Deville et al. [16] demonstrated for Portugal and France, how spatial–temporal explicit estimations of population densities can be produced at national scales. Other studies [31,32] faced the problem of classifying or identifying land use or important living places by using mobile phone data, while Gabrielli et al. [33] classified mobile phone users into behavioral categories by means of their call habits. Mobile phone data were also used to track populations during big social and entertainment events. In particular, Traag et al. [34] and Furletti et al. [29] used such data to detect social events and to develop a framework for deciding who attended an event. Pucci et al. [1] analyzed mobile phone data to study important business and sport events occurring in the city of Milan, Italy.
Mobility of population affects different fields such as environment, economy and health. The latter is particular relevant in case of traveling because of road accidents. According to the Italian Statistic Institute, approximately 175,000 accidents occurred in Italy in 2017 causing 3378 victims and injuring approximately 246,000 persons. The National Institute for Insurance against Accidents at Work (INAIL) registered in the same year ~91,000 (14% of total accidents) work related accidents involving transportations, ~71,000 (11%) of which occurred during the commuting between home and work places. Most of these accidents occurred in metropolitan areas. Traveling time, home–workplace distance, type of transportation, and job type are examples of key parameters to assess the risk of these accidents. When vehicles are used for working, like parcels delivery jobs, the risk of accident increases with the exposure time. To mitigate the social and health impacts, it is important to get information on the driving mechanisms of these phenomena that depend on the urban structure, population mobility demand, location of job places with respect to residential areas, and availability of the transport system. The economic structure, with its availability of jobs and employees, plays a fundamental role in driving population mobility, which might depend on the type of activity and its location with respect to residential areas.
Based on the above motivations, it is important to carry out a study, which, starting from an urban mobility analysis, could link it with information about the type of population involved, location of workplaces, and types of economic activity. The metropolitan area of Rome, Italy, was chosen as study area as it is strongly affected by mobility of population driven by work related reasons. The city lacks of a detailed assessment of the mobility phenomena and its characteristics, which could be used to plan interventions aimed to reduce work related mobility of population and consequently the impact of road accidents. In particular, there are open questions about the size of this phenomenon; its spatial, temporal, and demographic characteristics; and its driving mechanisms with respect to the city’s economic structure.
This paper aims to provide answers about some of the above issues, through a mobility study, based on mobile phone traffic data. Results about the classification of Rome’s urban area in terms of mobility time-patterns, modifications of the background population demography induced by urban mobility, and connection with the local economic structure with its request of job positions, will be presented. With respect to the above literature, this paper can be positioned among a number of studies [1,2,3,7,8,14,16,24,27,30] which analyzed aggregated mobile phone data to get insights into the spatiotemporal distribution of urban population. Whenever possible in the paper, a comparison with results obtained in those studies is presented.

2. Data

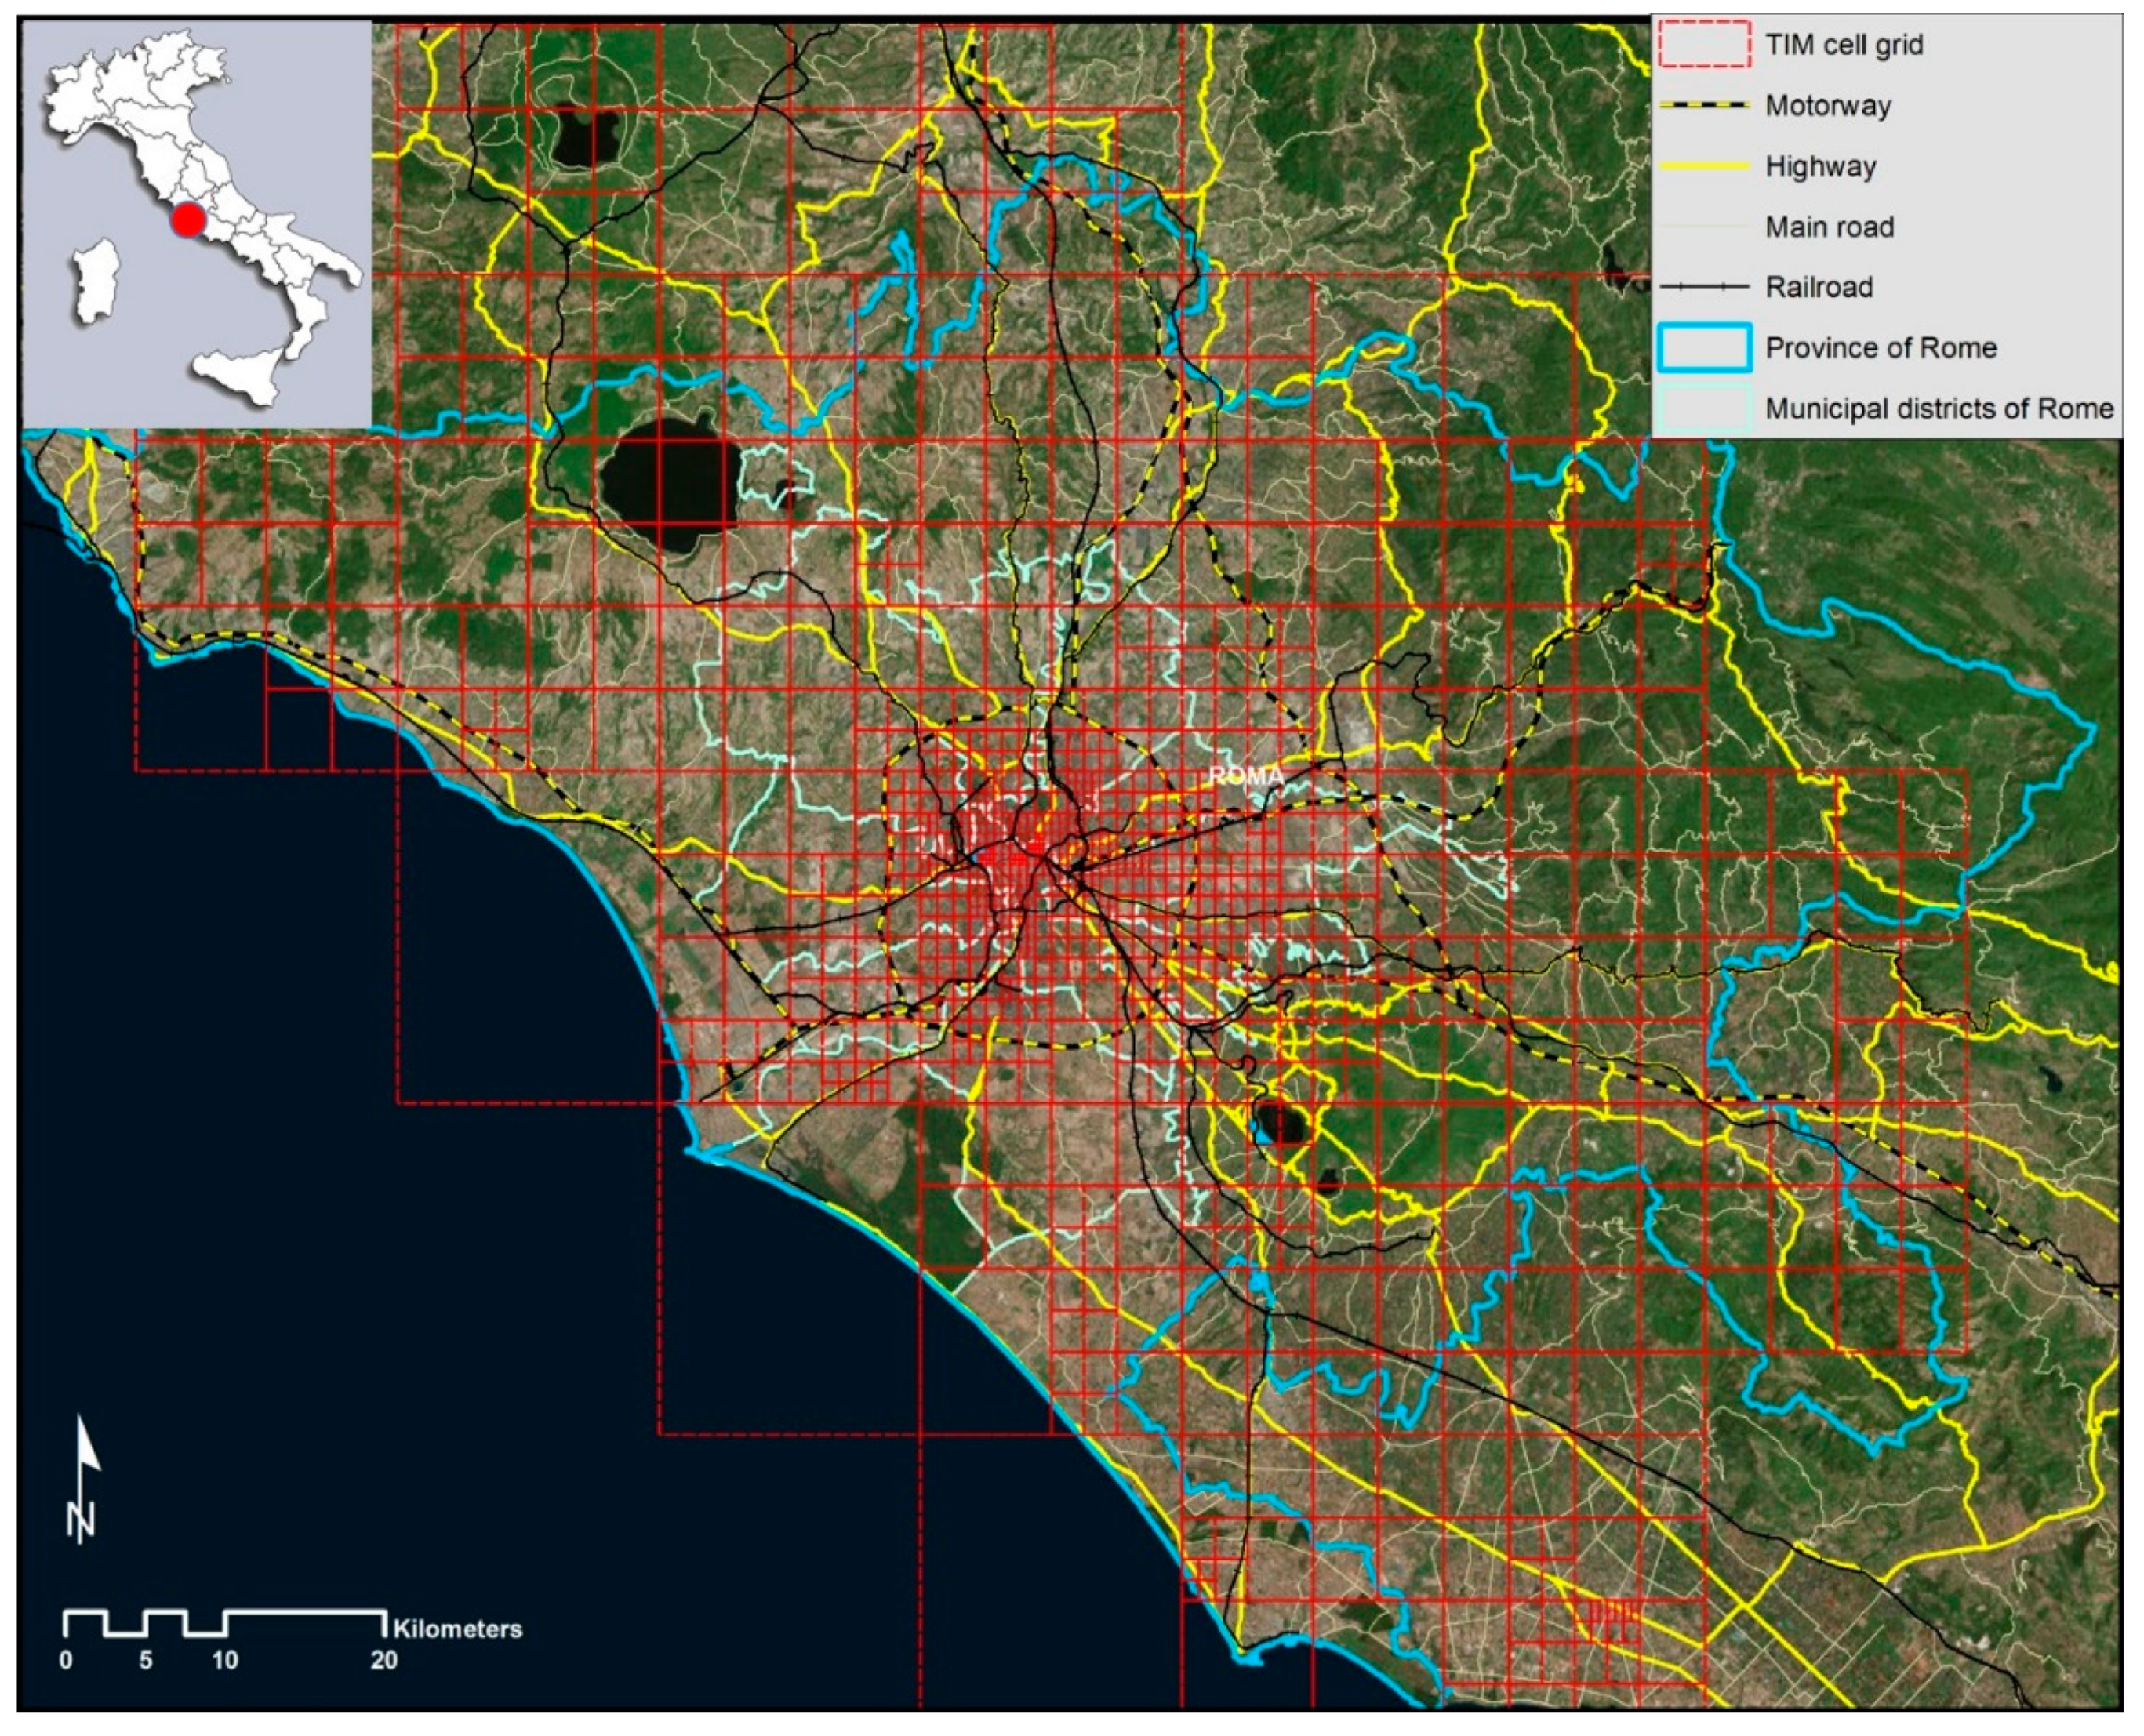
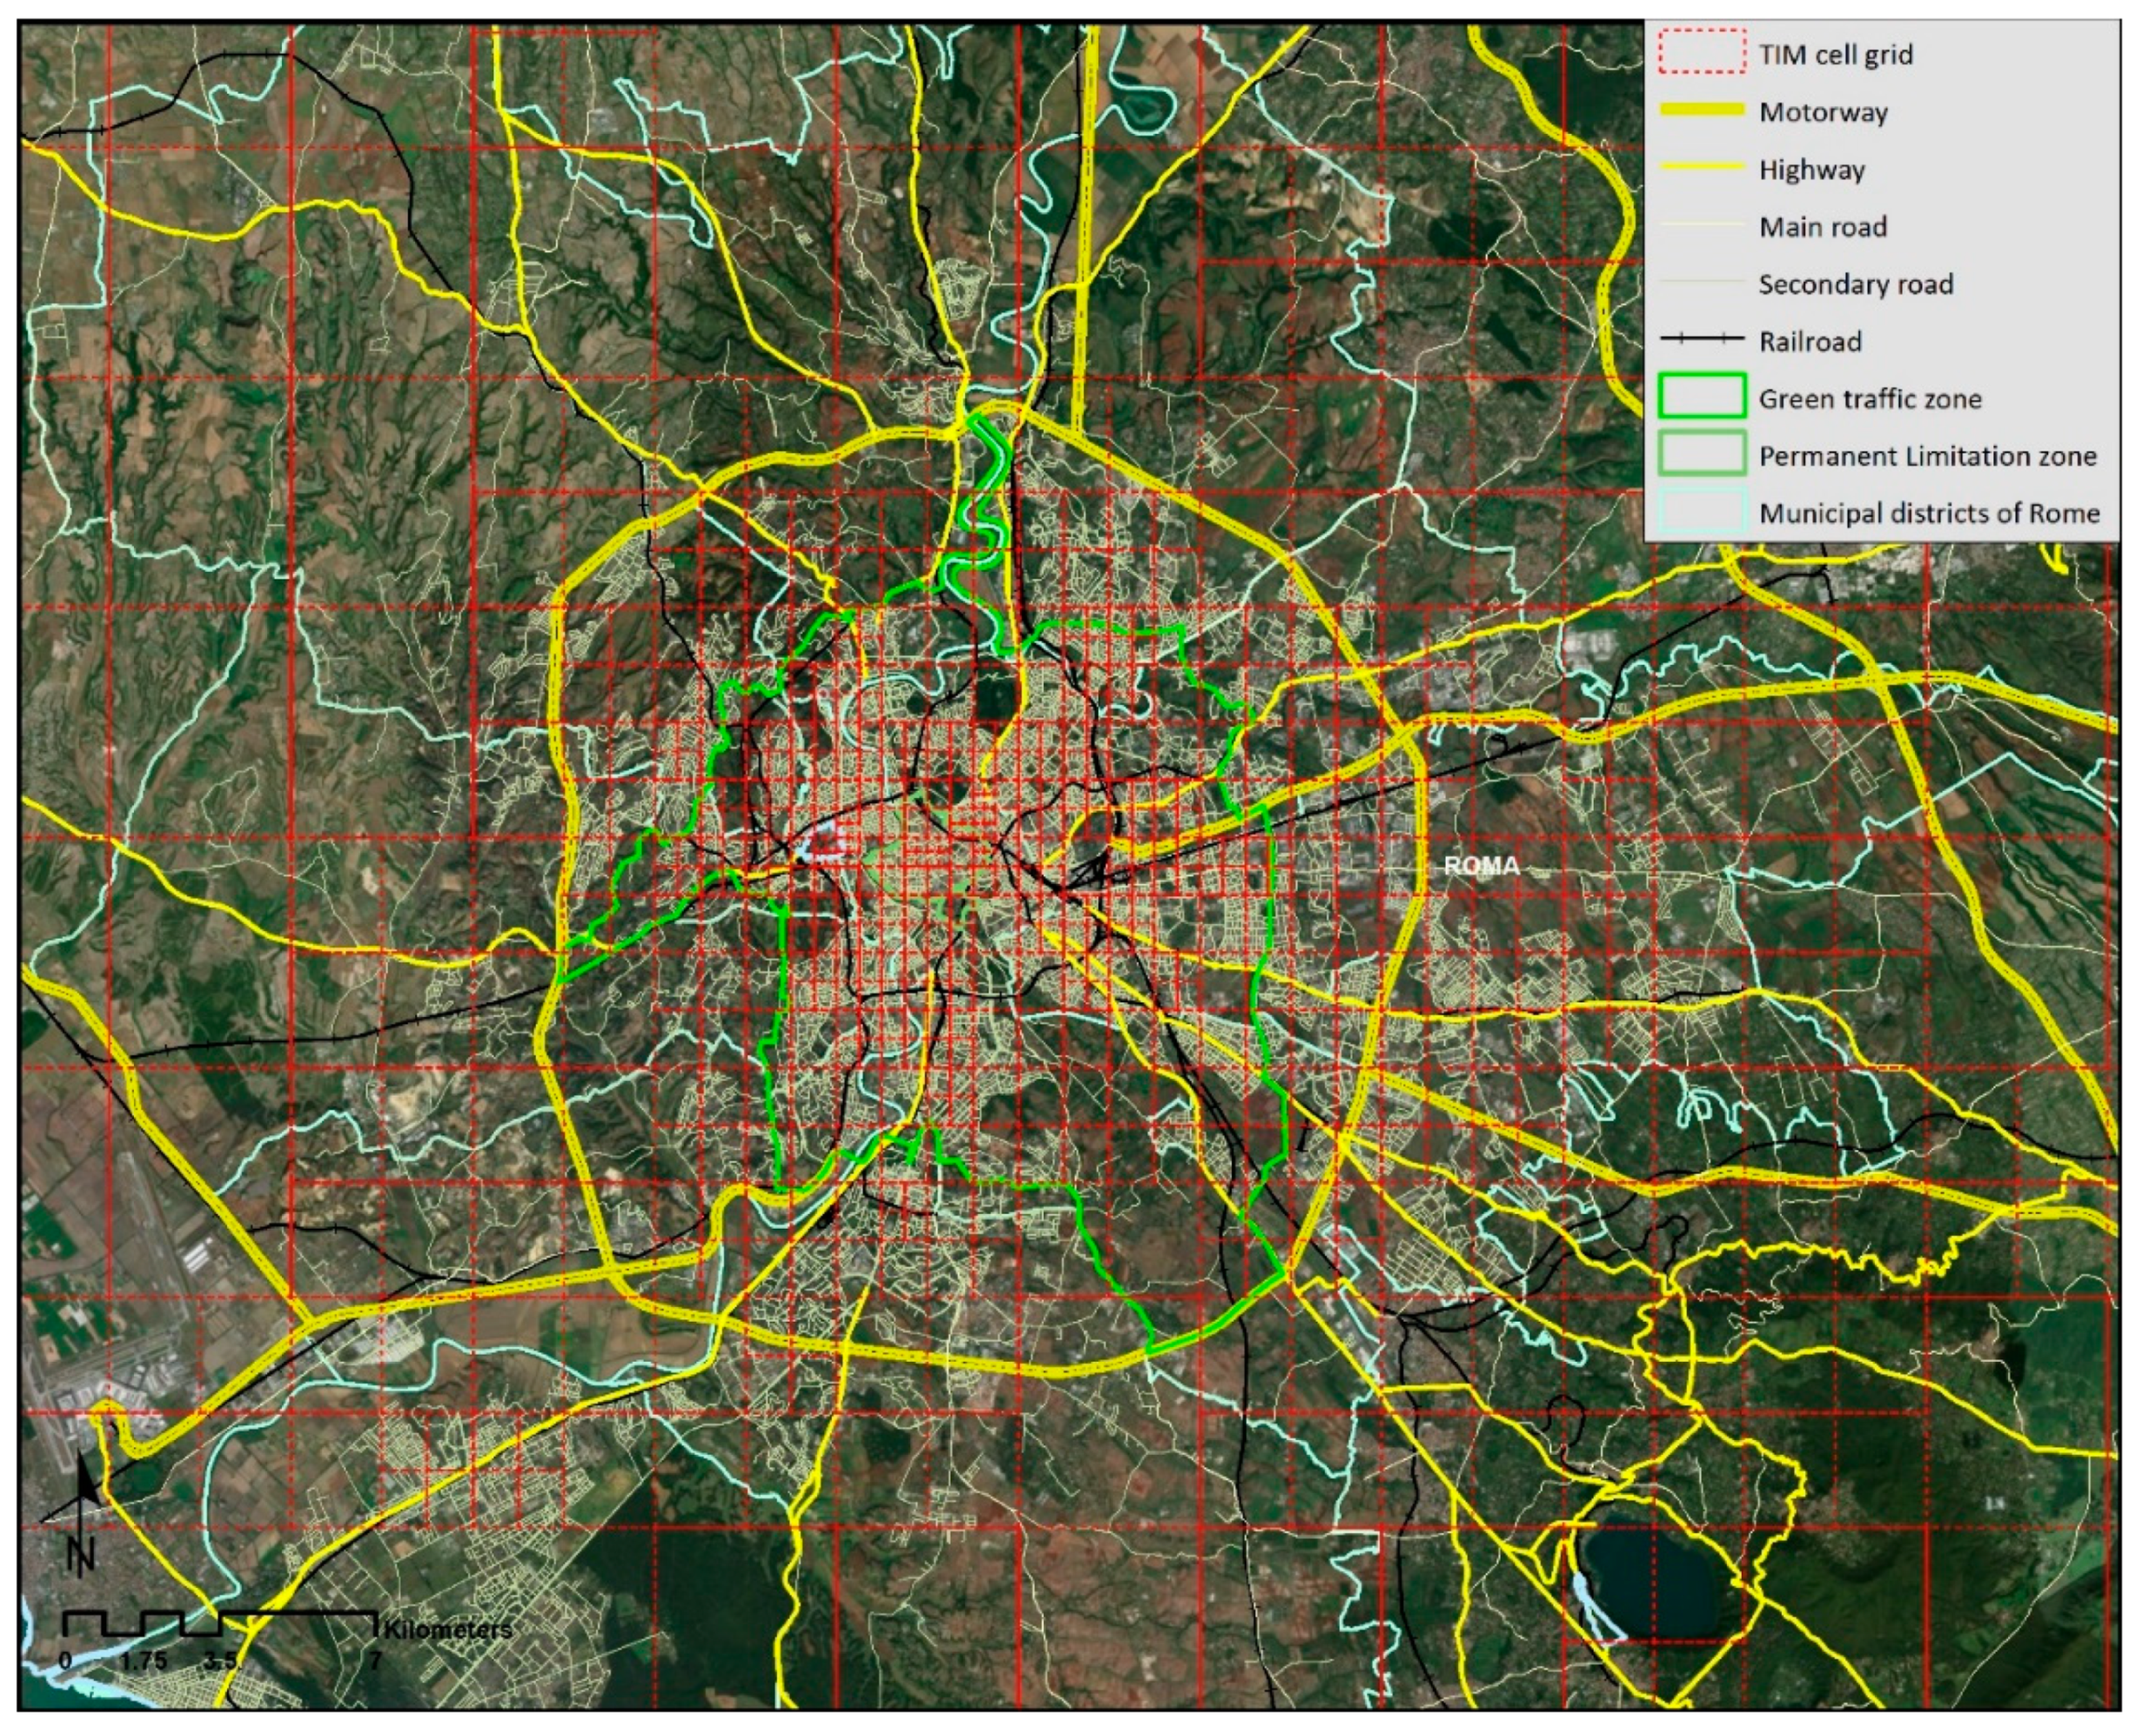
2.1. Description of Studied Area

The study is focused on the metropolitan area of Rome, Italy. Rome is the largest Italian city, with a population of ~2.5 million inhabitants in a 1290 km2 area as of the 2011 Italian Census, with the majority of the population living within the large urban area, but also including suburban communities. Due to working reasons, Rome attracts a large number of people living in its outskirts or in other provinces. The main direction of this commuting phenomenon is toward the city’s center, where business and services activities are located. Rome also attracts many tourists, which also contribute to the baseline mobility. In addition, the economic structure of Rome is rather complex, as it includes production units also in other semicentral areas, which also produce intra-urban mobility.

2.2. Population Data Derived by Mobile Phone Traffic

Population data were provided in the frame of the TIM BIGDATA Challenge 2015. Data are related to the TIM Italian mobile phone operator subscribers. Its market penetration is 32% at national level. As a consequence, it captures only a sample of the actual population. Two types of data were used in this study: the presence population and the demographic datasets. They were provided by the mobile company and used by the authors as it is. Consequently the latter did not participate to the processing of raw mobile traffic data to produce both the presence and demographic datasets.
The presence population dataset provides the amount of persons located in the studied area at aggregated level. It is based on full mobile phone type of communications (e.g., calls, TXT, and Internet). Privacy is guaranteed by design and tracking of individual was not possible with this dataset. The methodology used to derive presence of population data from mobile phone traffic is described elsewhere [35] and only summarized herein. Basically, for each serving Base Transceiver Station (BTS) belonging to the network, a coverage area is defined by taking into account its technical characteristics, orography, and characteristics of the host building. If a user performs a telecommunication action (e.g., phone call, text message, or internet connection) while connected to a BTS, his/her presence is distributed over the coverage area associated to such a BTS. The coverage area was gridded to obtain maps related to the spatial distribution of the population by summing the number of users estimated to be in each cell of the grid at a certain time. Users are associated with cells, depending on where they perform their last telecommunication action. Therefore, if the presence of a user is recorded in cell A at time t = t0, performs an action in cell B at t = t1, and finally, at time t = t2 performs an action in cell C, his/her presence will be recorded in cells A, B, and C sequentially. The above procedure maintains the position of an individual up to the next phone action, preventing the loss of individuals due to low mobile frequency use.
The demographic datasets provides the number of TIM users selected for age ranges, at aggregated level. The data were based on Call Detail Records (CDRs) generated by outgoing calls. This dataset provided the amount of persons belonging to a certain age range (<18; 18–30; 31–40; 41–50; 51–60; >60; unknown).
The two datasets have substantial differences in their ability to track population density. Conversely to presence dataset, the amount of detected persons in the demographic dataset is missing or very low during late night-time due to the lack of sufficient CDRs events. Furthermore, they cannot be considered either connected or related and have to be analyzed separately. To guarantee a sufficient amount of data, the analysis of Demographics dataset was restricted to daytime (8–21 local time). At the same time, the class of unknown age was not considered, as it could not be linked—to census data.
The presence and demographic datasets provided gridded aggregated data at high time and space resolution for the studied area. Figure 1 (top and bottom) show the grids where population data were provided for the whole area and for the main metropolitan area of Rome, respectively. The grid covers an area of 114 × 114 km2 with 927 grid cells of different size. A higher spatial resolution is used (from 0.26 × 0.34 up to 1.0 × 1.3 km2) within the urban area, while a coarser one is applied outside (from 4 × 5 up to 16 × 20 km2). The data at each cell are provided by the mobile phone company at a time resolution of 15 min during the period 1 March to 30 April, 2015. Data were first averaged on hourly bases overall the period, and then selected for weekdays for further analysis.

2.3. Census Statistical Data

Data from the last Italian census survey, carried out by the Italian National Statistical Institute in 2011, were also used in this study for validation of results and their connection with the local economic structure. It includes information about demography, number of residential and production, commercial and services buildings, and mobility of population. This latter is described by parameters such as exit time, travel distance, and duration [36]. In addition, data about the amount of population moving daily in and out from their residence are provided at census section level. A general census of industry and services was also carried out [37], which provided, at census section level, the number of production units and employees by economic activity class, according to the ATECO classification. This kind of census survey involves a sample of 260,000 big and small/medium enterprises, 470,000 nonprofit organizations and 13,000 public institutions. According to census data, the city of Rome largely contributes to the studied region (367,906 (90%) and 1,500,000 (66%) for production units and employees, respectively). Data were grouped in 19 economic macrocategories. Table S1 of the Supplementary Material summarizes the amount of units and employees by macrocategories for the Lazio region. Wholesale and retail commerce is the most frequent production unit (23%), followed by professional, scientific, and technical services (16%). However, in terms of number of employees, the former contributes for 13%, while the latter for ~7%. In general, service activities are largely the most frequent economical business in the studied area. In addition, the amount of buildings used for production, commercial and services were provided at census section level. The census data about the economic structure were used to relate urban mobility with jobs demand.
As for demography, data were provided at census section level in 15 age classes [38]. To match these data with the mobile phone derived one, they were reclassified at the closer mobile phone user’s age classes. In detail, the following census age classes were used, 15–19, 20–29, 30–39, 40–49, 50–59, and >60. The lowest age class was limited to 15, as subjects with lower ages were considered unlikely to own a mobile phone.
To support the mobility study, complementary data of socioeconomic position of resident population were used. The socioeconomic position index was developed by Cesaroni et al. [39] using census information that represented various dimensions of deprivation: education, occupation, housing tenure, family composition, and immigration. By using a factor analysis technique, they obtained a 5-level composite index (high, medium high, medium low, medium, low) which summarizes the socioeconomic status of population living in Rome.
For further analysis, the census information has been mapped onto the TIM grid using GIS techniques. Census numerical data have been first joined to section geometry obtaining a spatial layer having census data as attributes. Sections were first spatially intersected with the TIM grid, obtaining a new layer where sections are split along the TIM cell borders. When appropriate, the density per Km2 of each census parameter was used as the invariant value to be assigned, during processing, to all subsections belonging to the same section. Densities were transformed back using the area of the subsection, to obtain absolute values of each parameter that are proportional to the original one and weighted on the subsection size. Last, for each census parameter at each TIM cell, the sum of values at all subsections falling in a TIM cell was assigned to the TIM cell.

3. Data Analysis and Processing

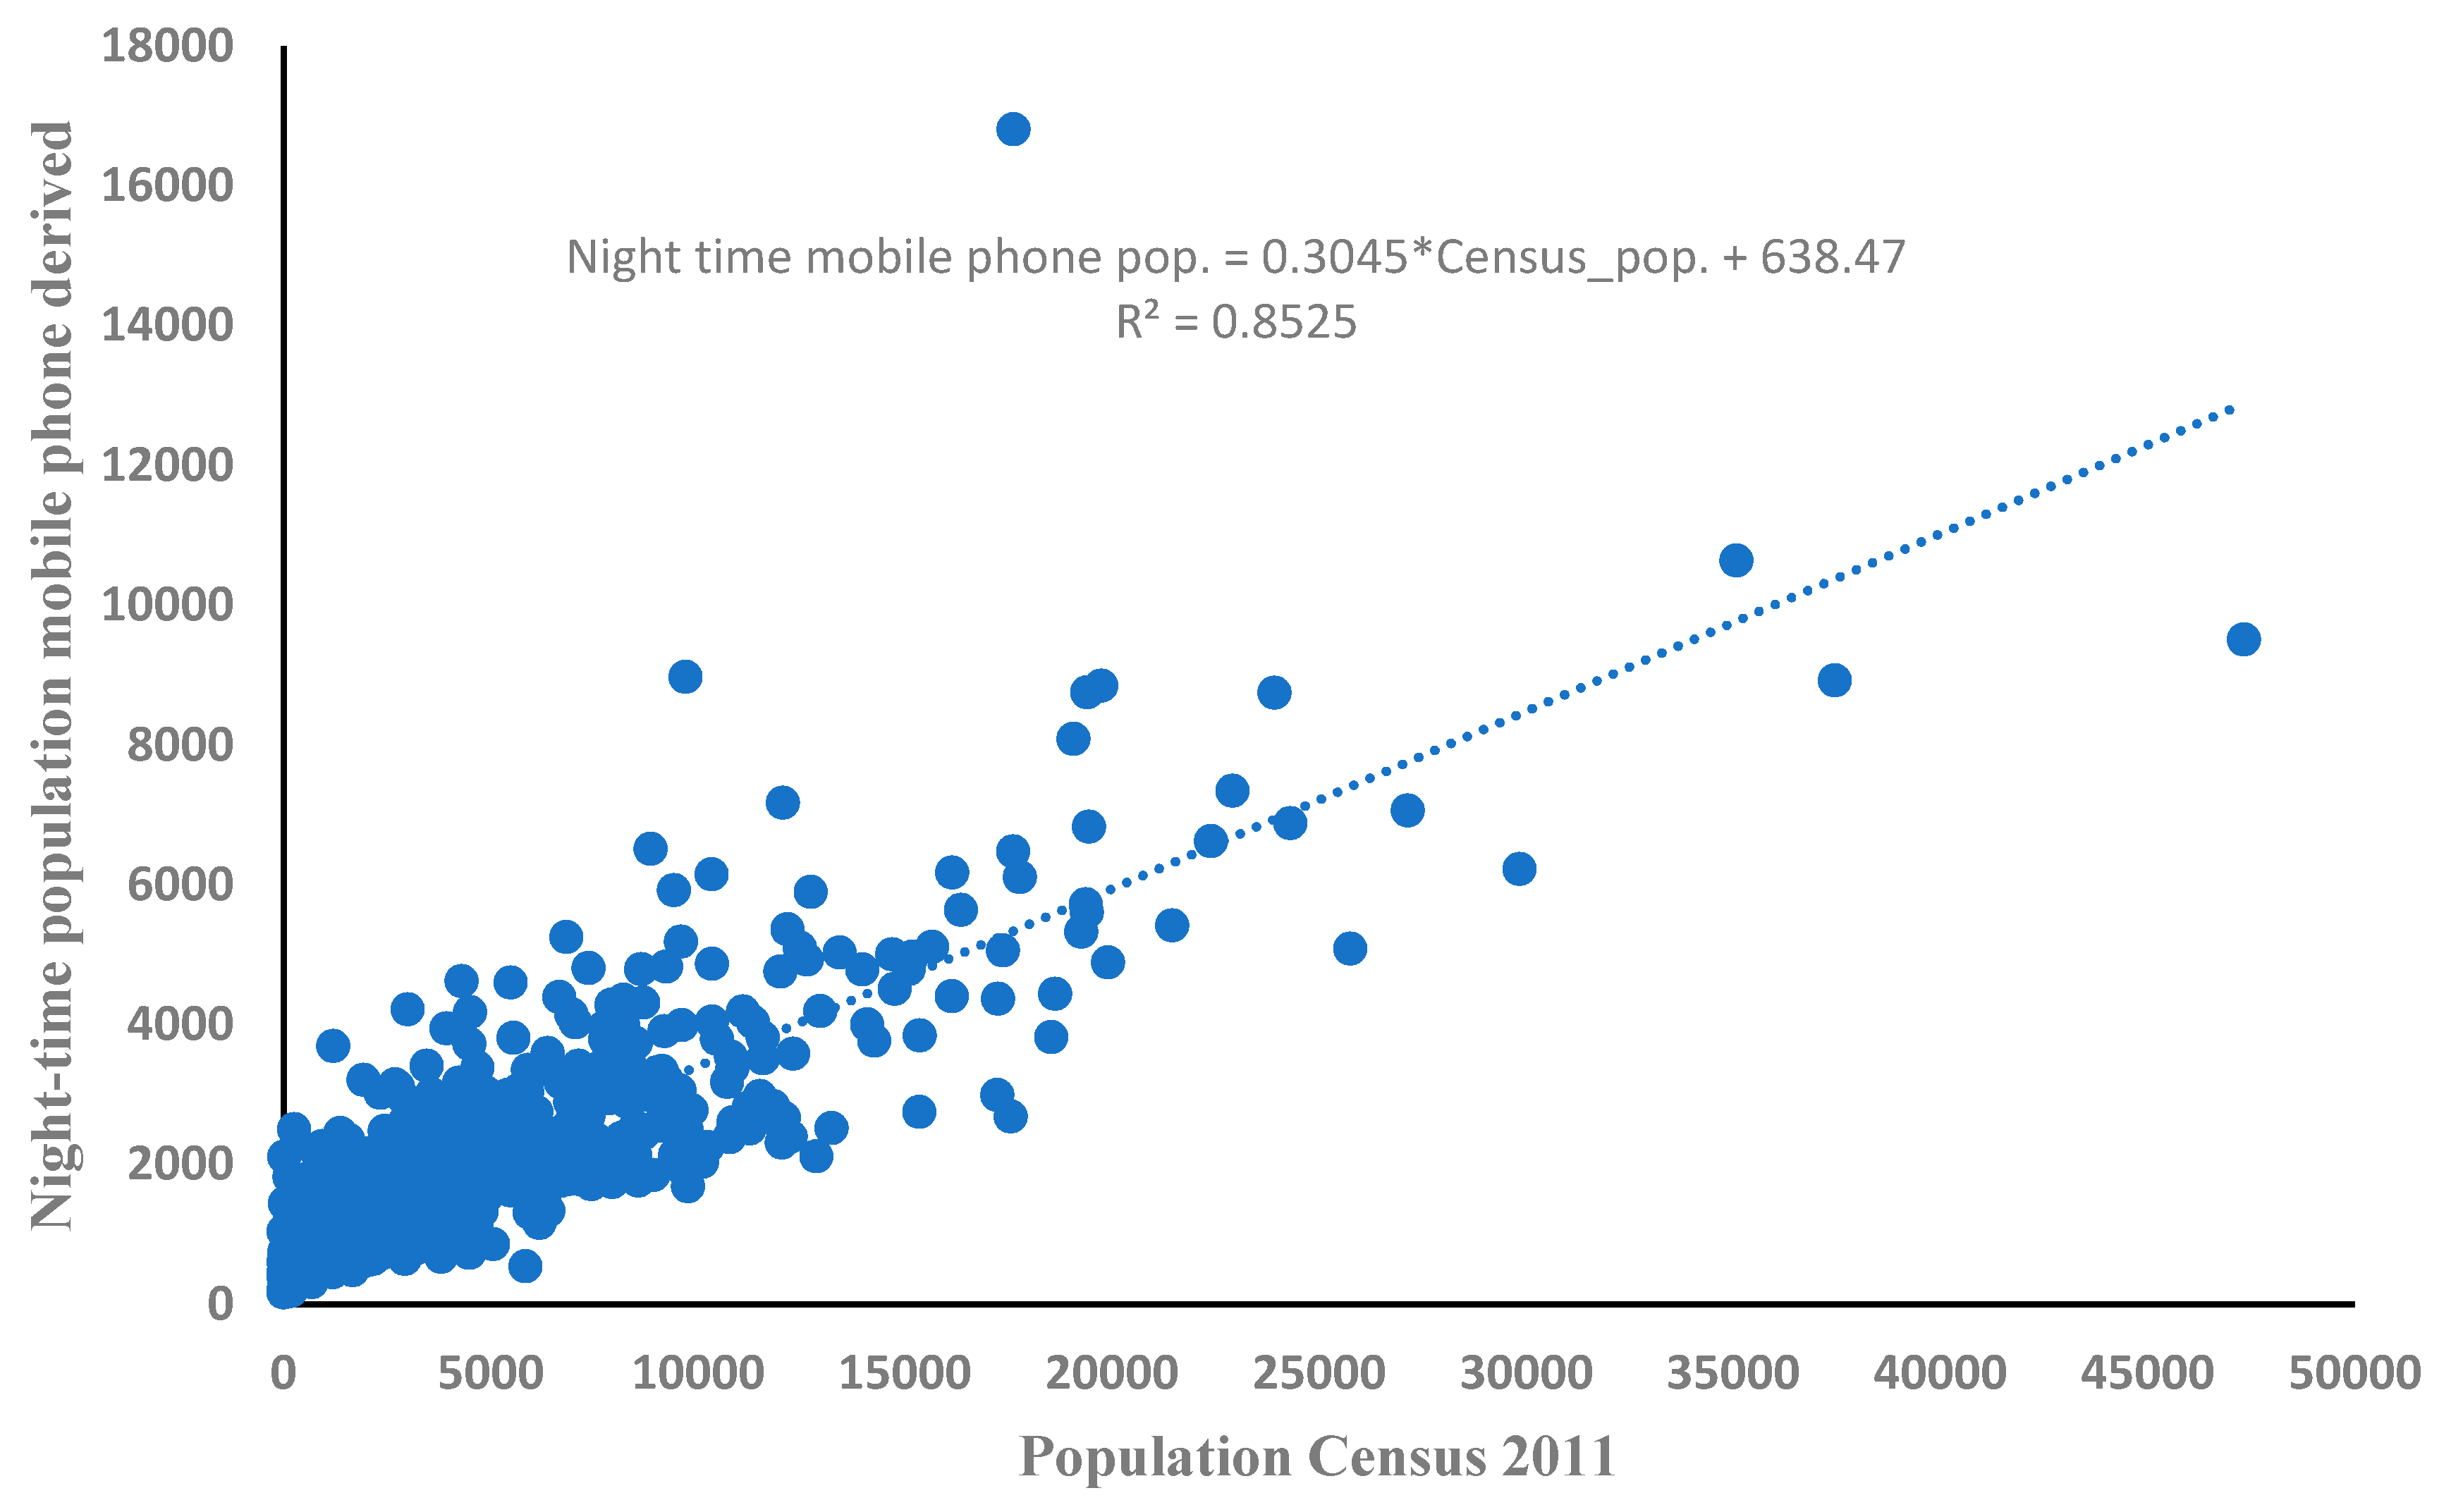
3.1. Time Series of Total Population and Comparison with Census Data

The time series of the total number of people (see Figure S1 in the Supplementary Material) shows a well-defined periodical trend, with a relative minimum at nighttime and daytime peak values. During weekends, a depletion of people is detected. The daily profile was found to have a high similarity with other results for the city of Rome [3], although these focused on Erlang phone data.
The derived total population was compared with data from the last National Census. The results are shown in Table 1. The mobile traffic based methodology is able to detect an amount of population consistent with market penetration (32%) of the mobile TIM Company, with a fraction of population involved of 39% with respect to the census data. Table 1 shows a comparison between census and mean mobile phone derived demographic data for the municipality of Rome. The age distribution of population obtained by mobile phone reproduces quite well the Census one, although overestimation of 51–60 and underestimation of >60 age classes are detected. Elderly people might be underrepresented in the demographic dataset, as their frequency of mobile phone usage could be lower than other age classes.
A comparison with Census data has been made also at cell level. Census data were mapped over the mobile phone grids and compared with night-time (3:00–5:00 a.m.) mobile phone derived population considered as a proxy of resident population. The results show a good linear correlation between the two variables. Figure 2 shows an example of results obtained for the Municipality of Rome. Consequently, as the mobile phone population data are able to describe the spatial characteristics of resident population, with a proper scaling ratio to reproduce the actual residents, they can also be used to track the daily population mobility.

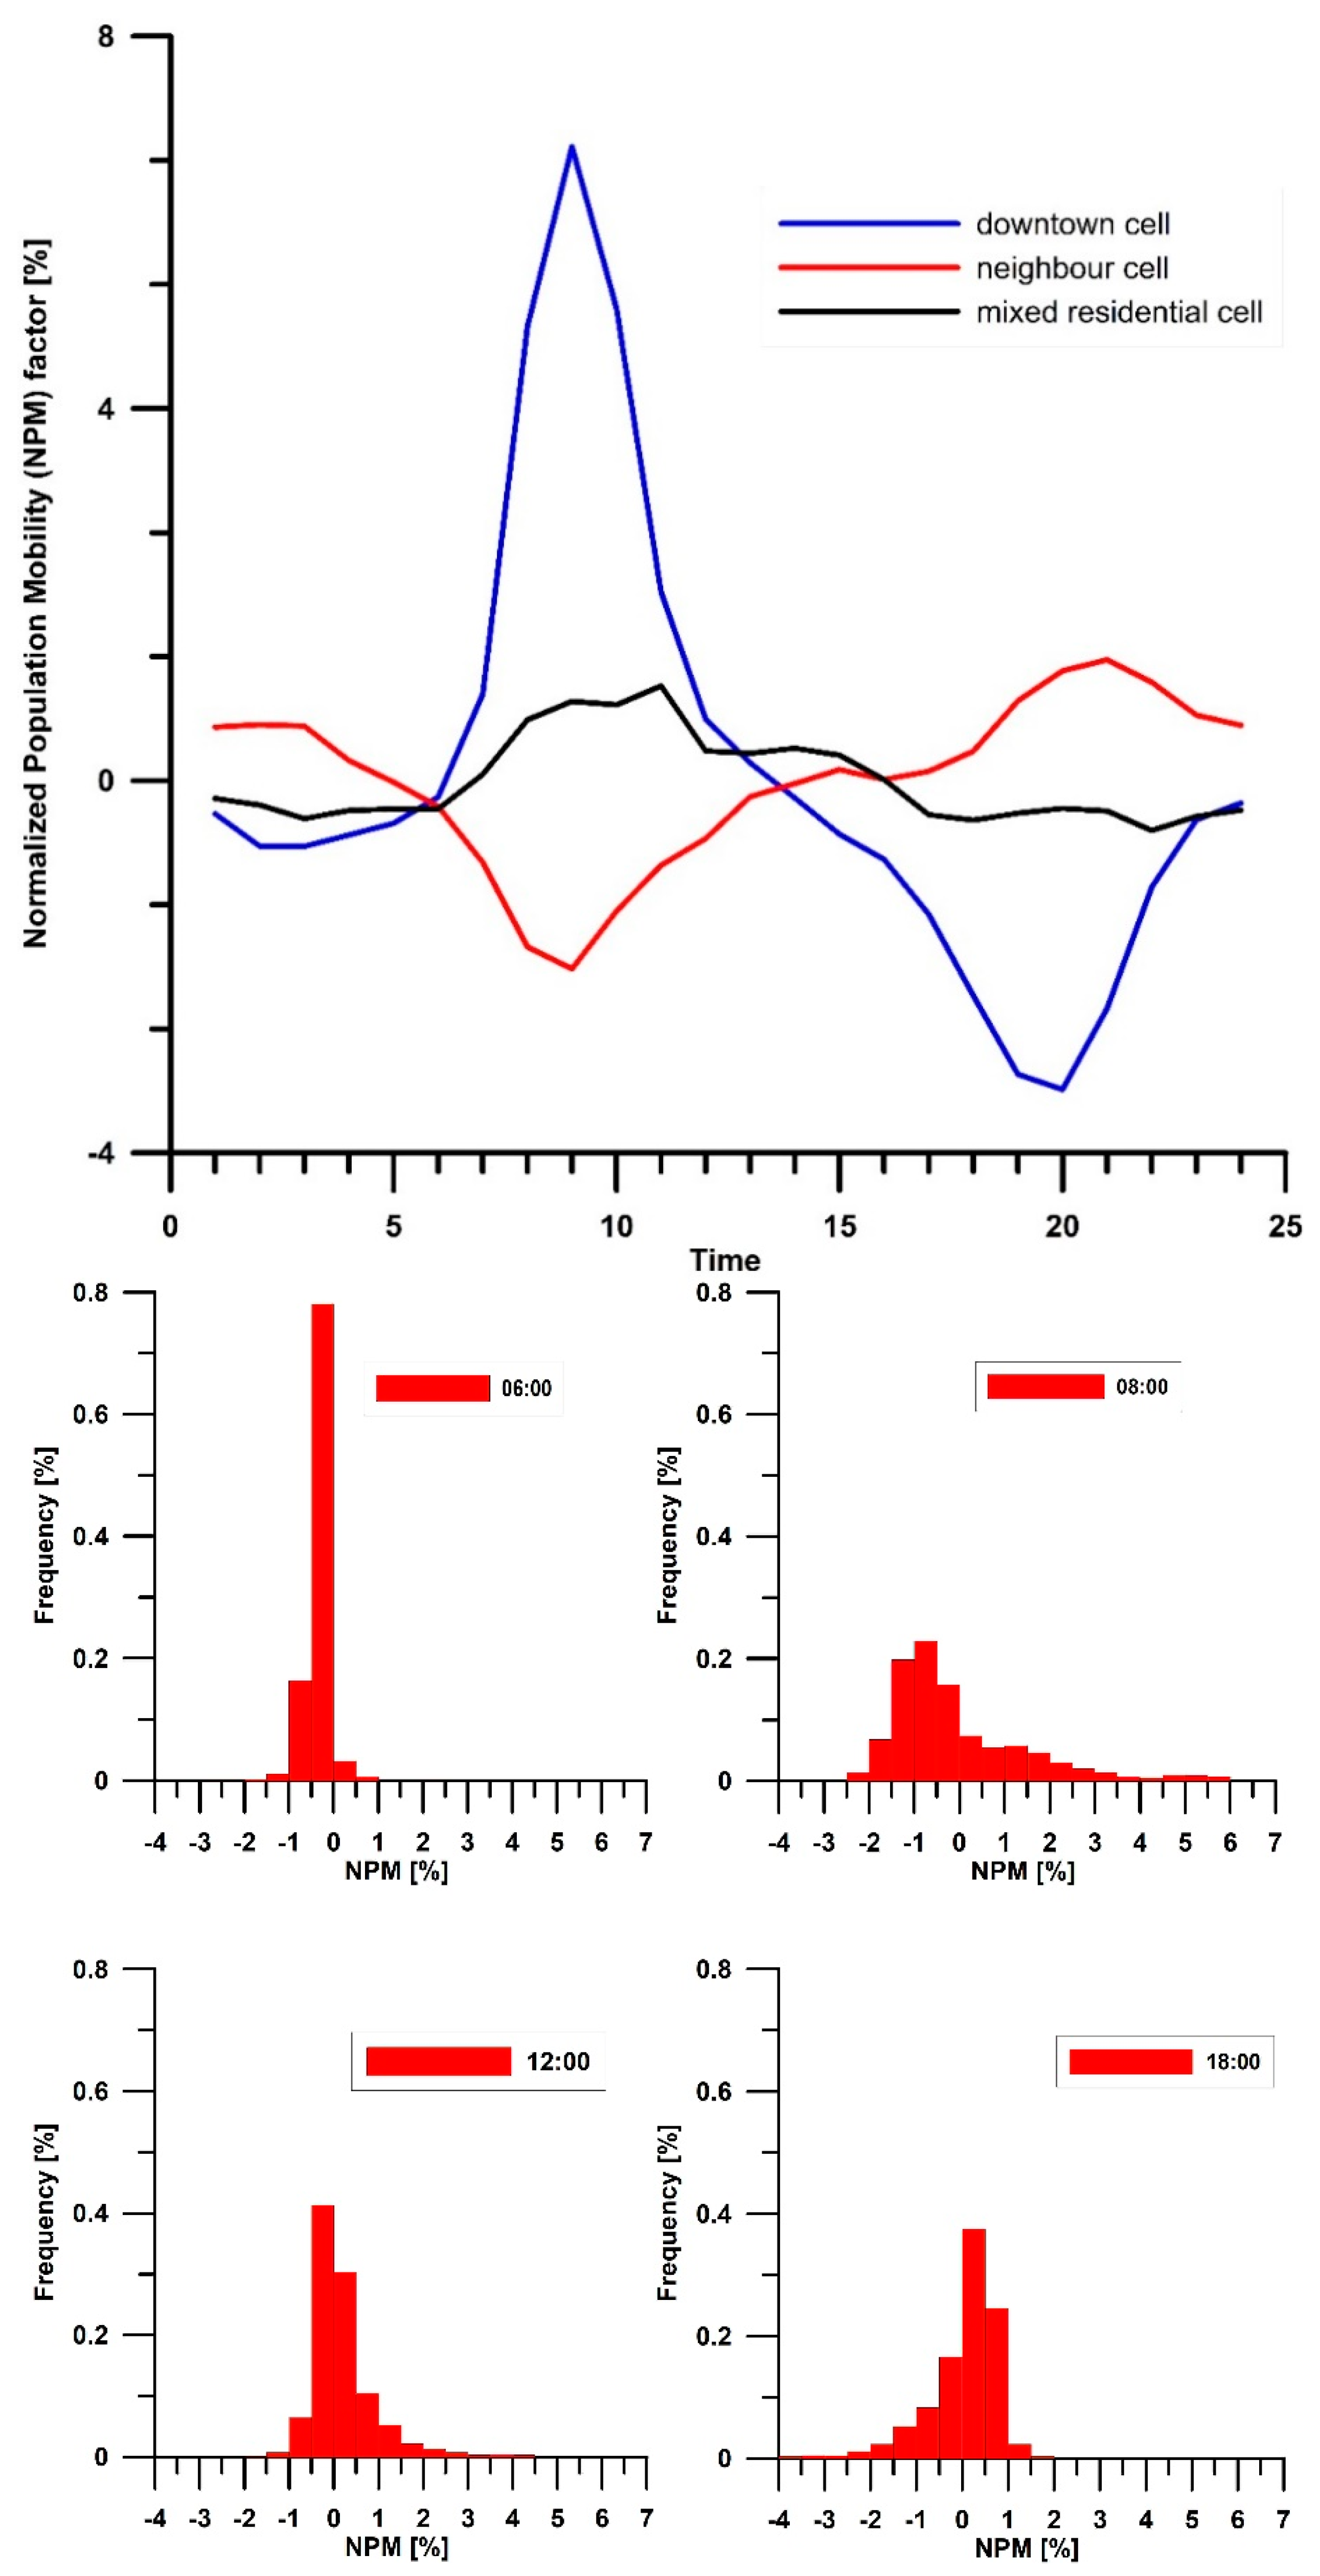
3.2. Definition of a Normalized Population Mobility Factor

In this study, we considered any variation of population (increment or decrement) as a marker of mobility. To characterize the population mobility phenomena, we introduced a Normalized Population Mobility (NPM) factor, which is defined by Equation (1):
NPM i ( t ) = Δ P i P i | t = 100 × P i ( t + 1 ) P i ( t ) P i ( t )
where t is the time from 1 March to 30 April 2015, at the provided time resolution (15 min) and Pi(t) is the number of persons in grid cell i at time t. The NPM factor provides the percentage of variation of population at each cell. It is able to track the amount of increments or decrements of population in each cell at each time step with respect to the previous time. These variations are considered as indicators of mobility. To better characterize the peculiarities of mobility, a temporal analysis was carried out by grouping NPM values for workdays, cells, and times. Hourly values of NPM were calculated to describe the typical daily profile at each cell of the studied domain. Figure 3 shows the typical daily profiles of the NPM mobility factor for three cells representative of the metropolitan area (downtown, neighbor, and mixed residential) during workdays. Distributions of NPM across the cells in the grid are also shown for selected time. The downtown cell is located in center area where commercial activities and small-medium size offices are located. The neighbor cell represents areas located out from the main central area where residential districts are located. Finally, the mixed residential cell is representative of areas immediately out of the main central area where both commercial activities and residential subareas are co-located.
At the downtown cell, the time pattern of the NPM mobility factor shows a maximum and a minimum negative value at approximately 9:00 a.m. and 7:00–8:00 p.m., respectively, corresponding to morning and evening commuting times. The former corresponds to a large and rapid increase of population coming to town for working reasons, while the latter to a large and wide decrease of population, likely due to the way back home. The neighbor cell exhibits an opposite behavior, with depletion of population in early morning hours and an increase during late evening. Commuting toward the city center can be considered the main driving factor of this pattern. The mixed residential cell shows a pattern similar to the downtown cell, but with a broader time profile and much lower intensity. The co-location of different activities (residential/commercial/business) in this cell could produce both depletion and filling of persons, generating, on average, an intra-cells mobility at short/medium-distance.
The distributions of NPM across the cells, shown in Figure 3, exhibit different shapes depending on time of the day. While the early morning distribution (06:00) indicates a peak of NPM values centered at −0.5% (light decrease of population), the commuting time one (08:00) has a wide skewed shape where cells with large increases of population (NPM values up to 6%) coexists with areas of depletion of population (NPM values up to −2%). This is mainly driven by commuting from home to workplaces. In the afternoon (18:00) the NPM distribution is skewed to the negative side of NPM values (from −4 to 1%) indicating mobility which reduces the amount of population during its way back home.
Such daily profiles were compared against information about mobility derived from the last available Census data 2011 [36]. Table 2 shows the amount of population involved in morning commuting to the city of Rome from its Province during workdays by exit time and trip duration in different intervals. The census data show that the morning commuting phenomena starts before 7:15 a.m. with a significant fraction of the population (30%) and it is still active at 9:15 a.m., with a peak in the time interval 7:15–8:15 a.m., which involves 44% of the population. The trip durations are relatively equally distributed among the different intervals (<15; 16–30; 30–60 min; Table 2). These data confirm those obtained in this study, which found a peak centered at approximately 9:00 a.m. and duration of about three hours.
The observed differences in the mobility time-patterns of areas having different land-use, opens the chance of classifying portions of the city in terms of common daily variation of population, linking it to the main involved social/economical phenomena. The effects of mobility on population age distribution will be also discussed.

3.3. Classification of Daily Mobility Patterns

The daily profiles of NPM mobility factor were classified by a cluster analysis technique to obtain common mobility behaviors among cells across the studied area. A two steps procedure was applied for cluster analysis. First, a hierarchical method was applied to establish the exact number of clusters, which was also verified by the Cophenetic correlation coefficient. As similarity distance, the Ward distance between clusters’ center of gravity was used. This optimization procedure guarantees a sufficient amount of members for each cluster and a sufficient distance in a 24-dimensional space among clusters. Then k-means approach was carried out to get the final clusters’ profiles using the Silhouette criterion and the Elbow method. Seven clusters of mobility patterns were obtained. A plot of the Sum Squared Error (SSE) vs. the number of clusters is shown in Figure S4 of the Supplementary Material. The choice about the number of clusters was driven by a mathematical criterion based on Elbow, Silhouette, and SSE methods, as well as by an analysis of meaningfulness of NPM cluster results obtained for any possible number of clusters. Due to some heterogeneity in the mobility patterns, the clusters are also a compromise between specific and a more general behavior of mobility. Based on this classification, each cell of the studied region was ascribed to a specific time mobility profile depending on its belonging to a specific population mobility cluster. Then a map of population mobility pattern was obtained. Results are presented in Section 4.

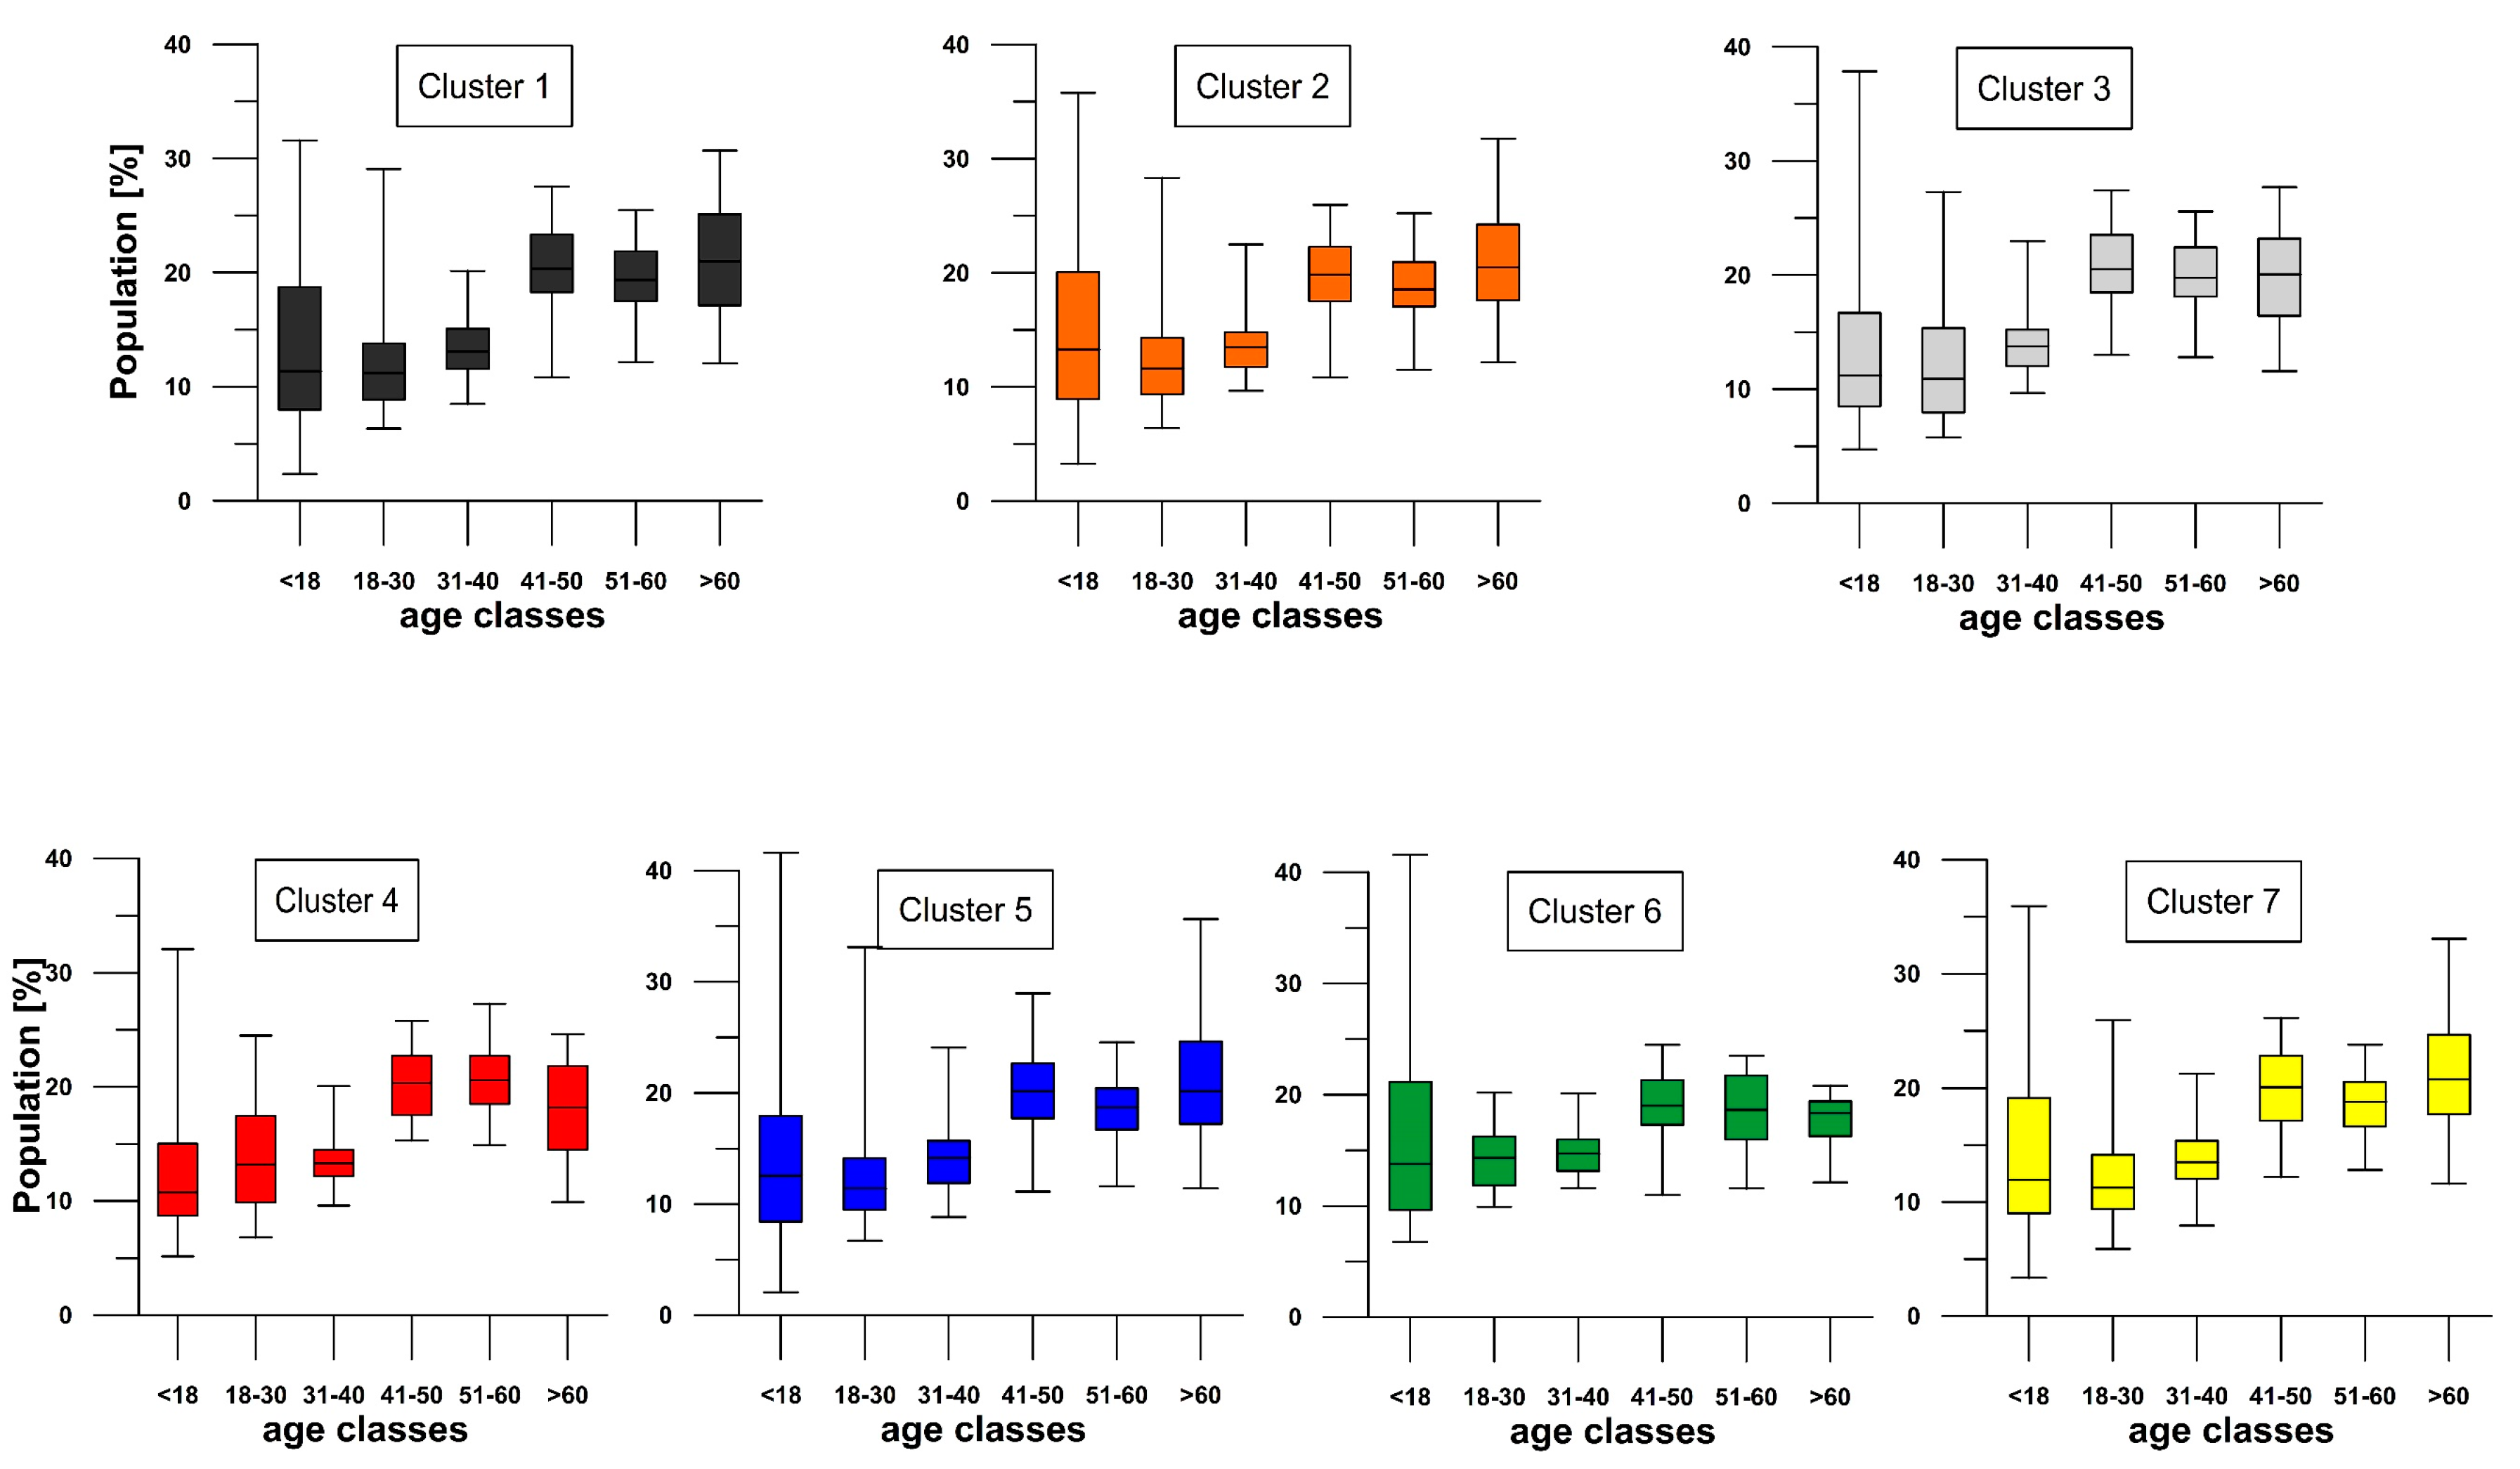
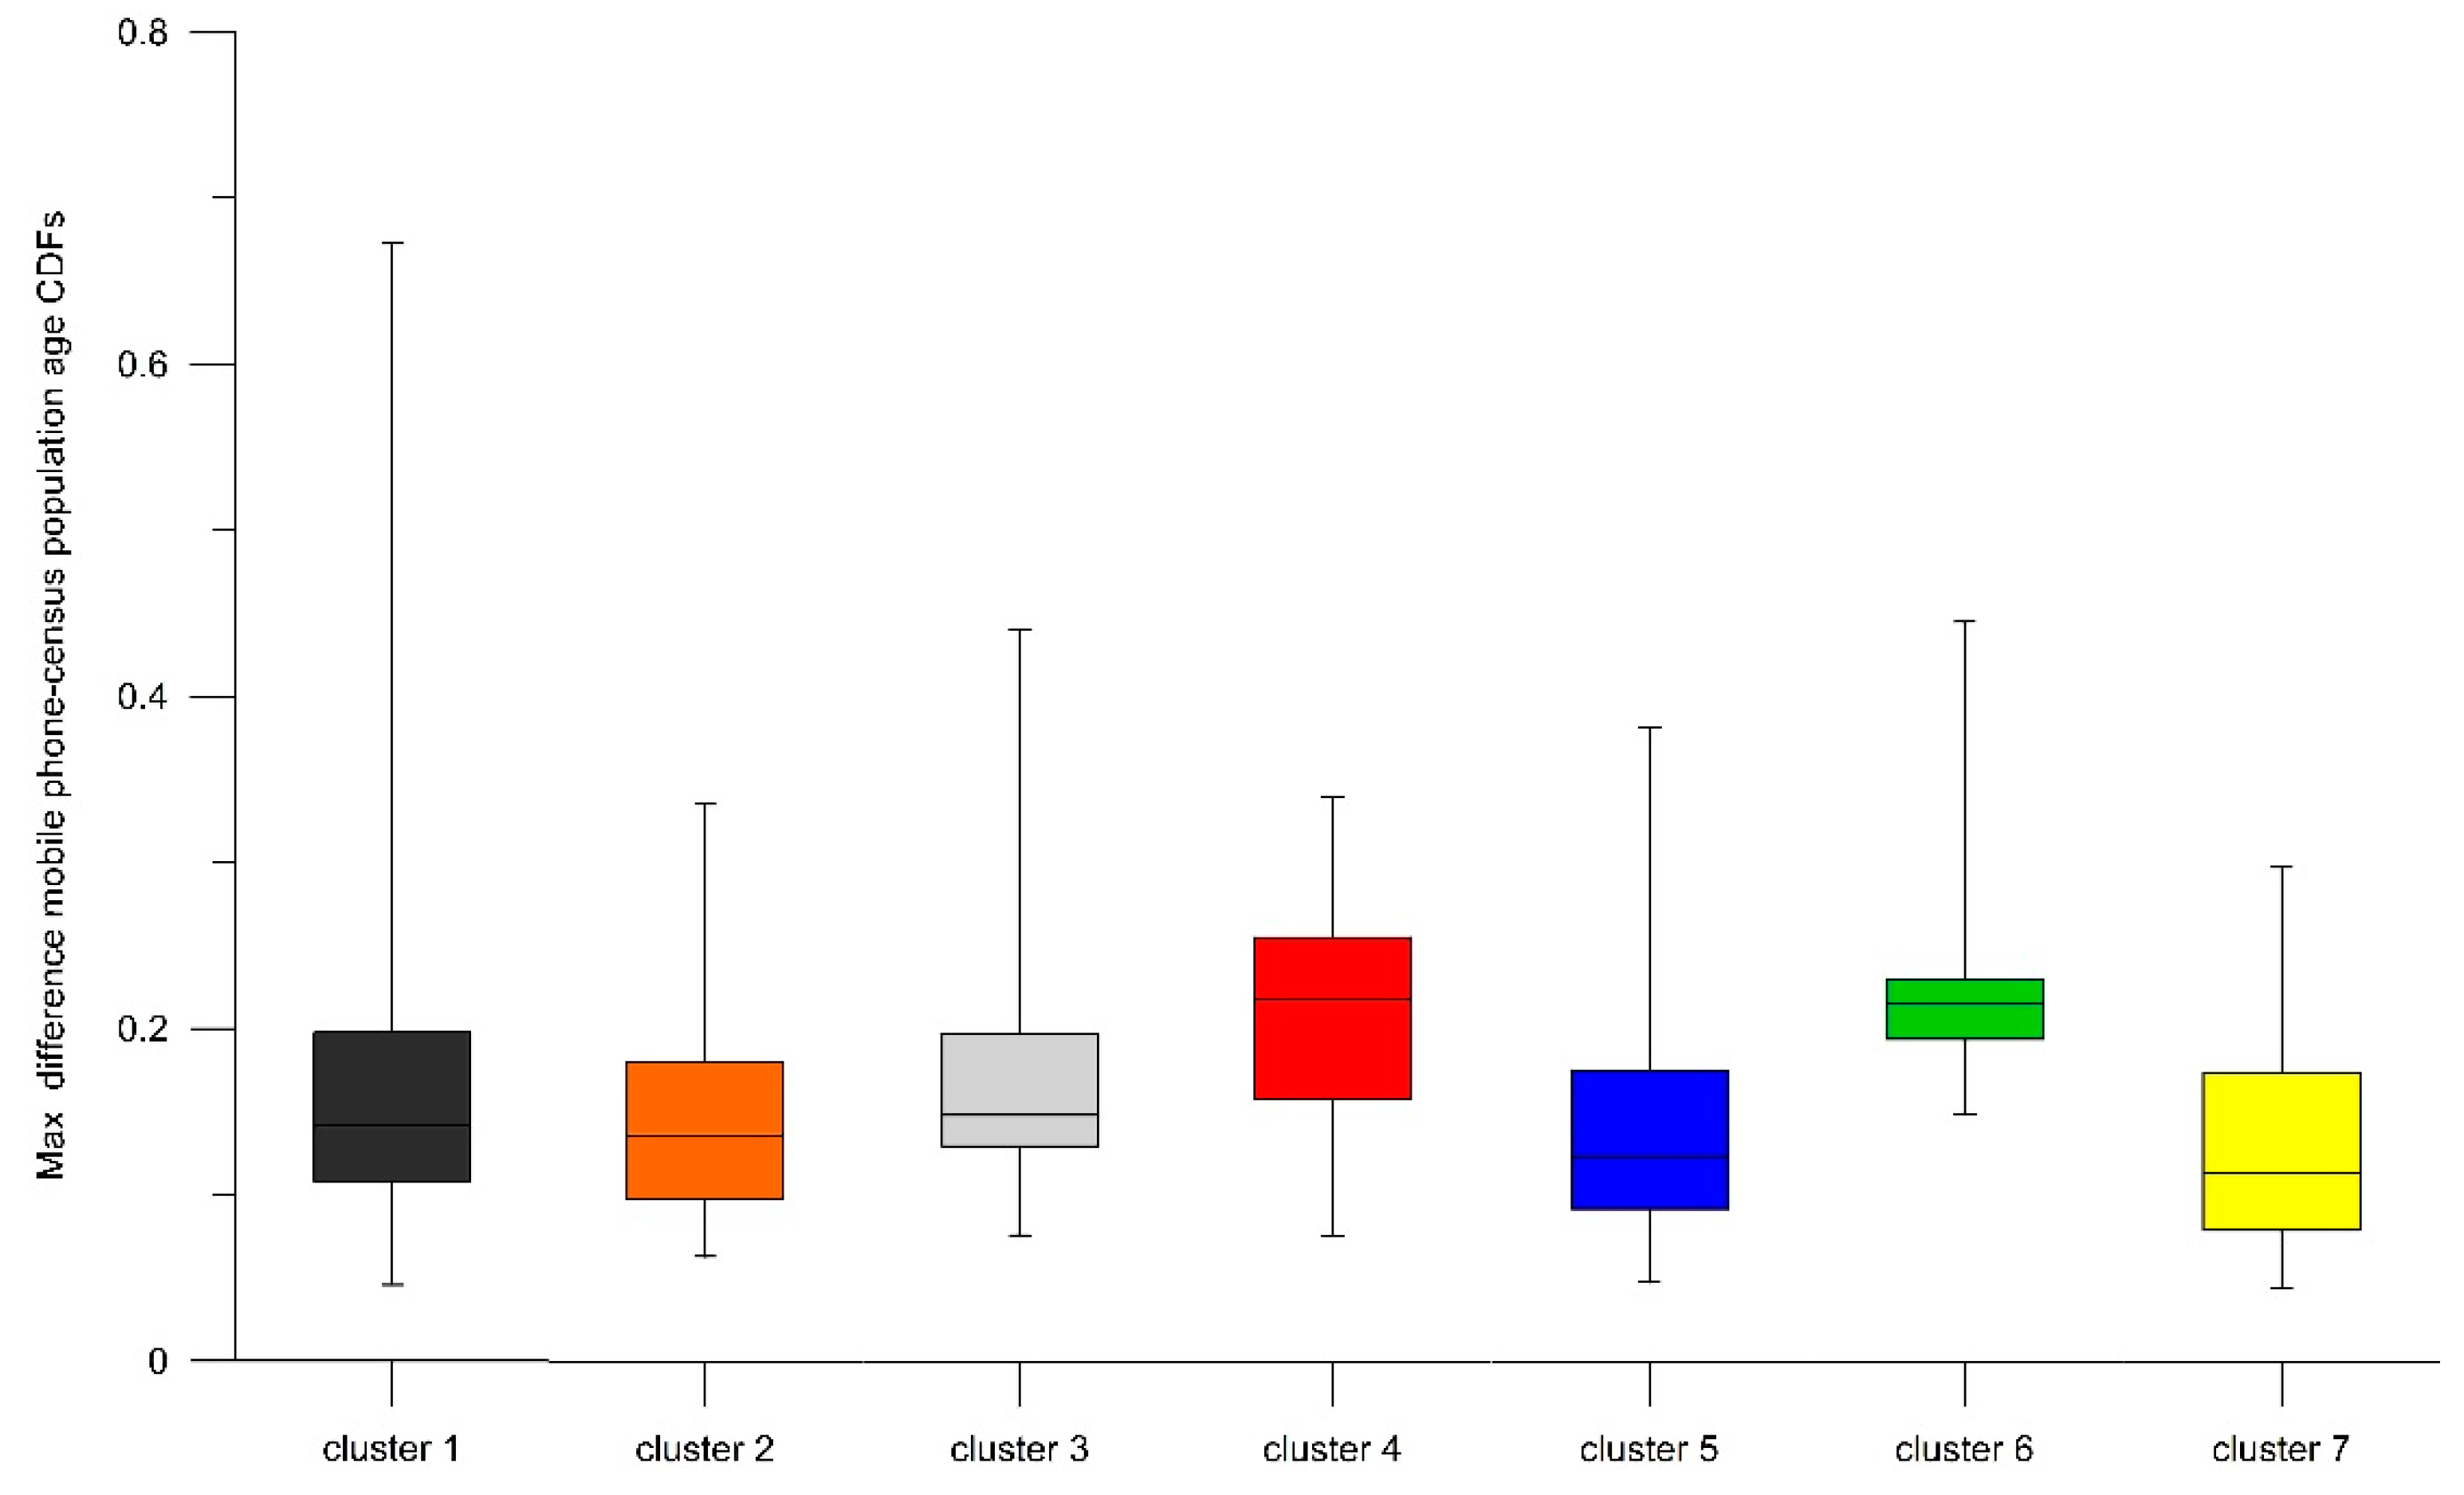
3.4. Processing of Demographic Data

The availability of the Demographic dataset allows determining at cell level, the dynamic composition of population in terms of age classes. Starting from the daytime (8:00–21:00) demographic data, hourly distributions of population ages were calculated in six classes (<18; 18–30; 31–40; 41–50; 51–60; and >60), and a mean daily demographic distribution was obtained for each cell. The latter were then compared at cell level with census population age distributions. The aim was to verify whether and in what extent, mobility of population affects the age population distribution which differs from that provided by census data. This study was limited to the municipality of Rome. The demographic population census data, provided at census section level, where mapped to the mobile phone dataset grid to allow spatial consistency. The mobile phone and the census age population distributions were then compared by means of a modified version of the Kolmogorov–Smirnov two-sample test procedure (usually applied to verify whether two samples come from the same distribution). In details, cumulative distribution functions (CDFs) were calculated from both the mean daily mobile phone derived and the census age population distributions. Then the maximum difference between the two CDFs was derived, which ranges between 0 and 1, where 0 is obtained when the two samples come from the same distribution, and 1 when the two distributions are dissimilar. To relate demographic information with mobility patterns, both the two age population distributions and their maximum difference of CDF were linked at cell level, with the correspondent cluster of population mobility identified above. Results are presented in Section 4.

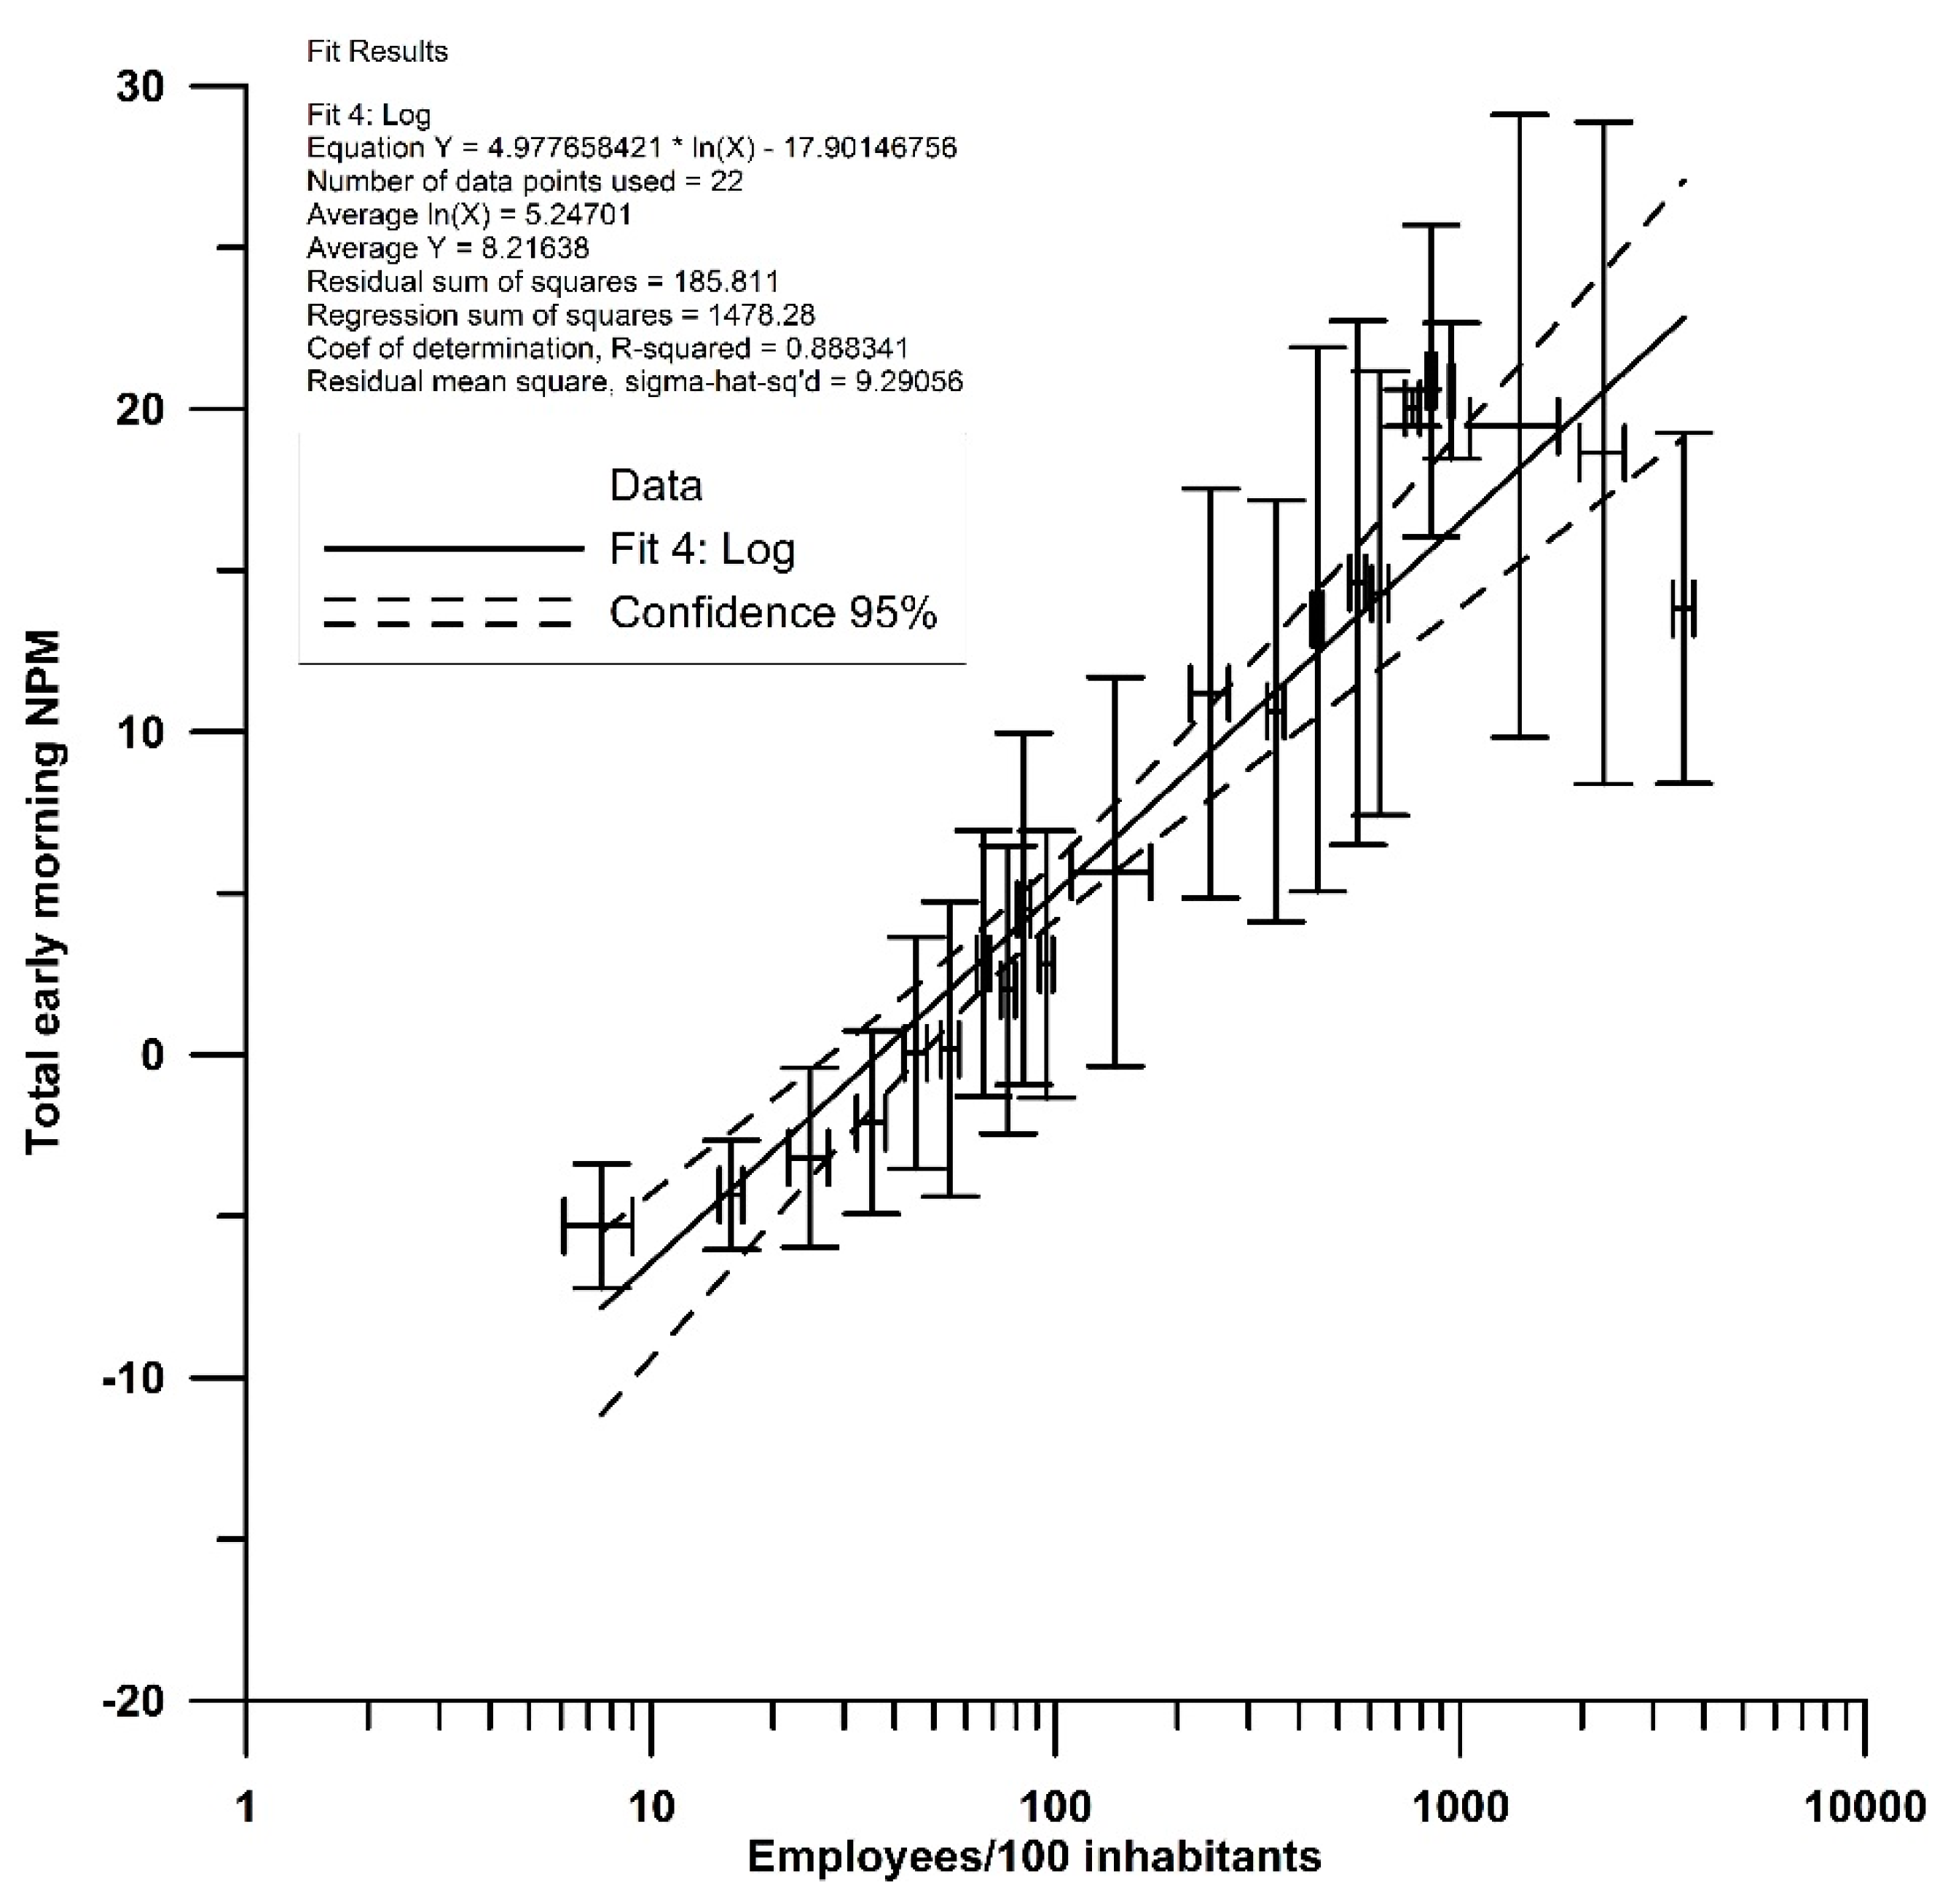
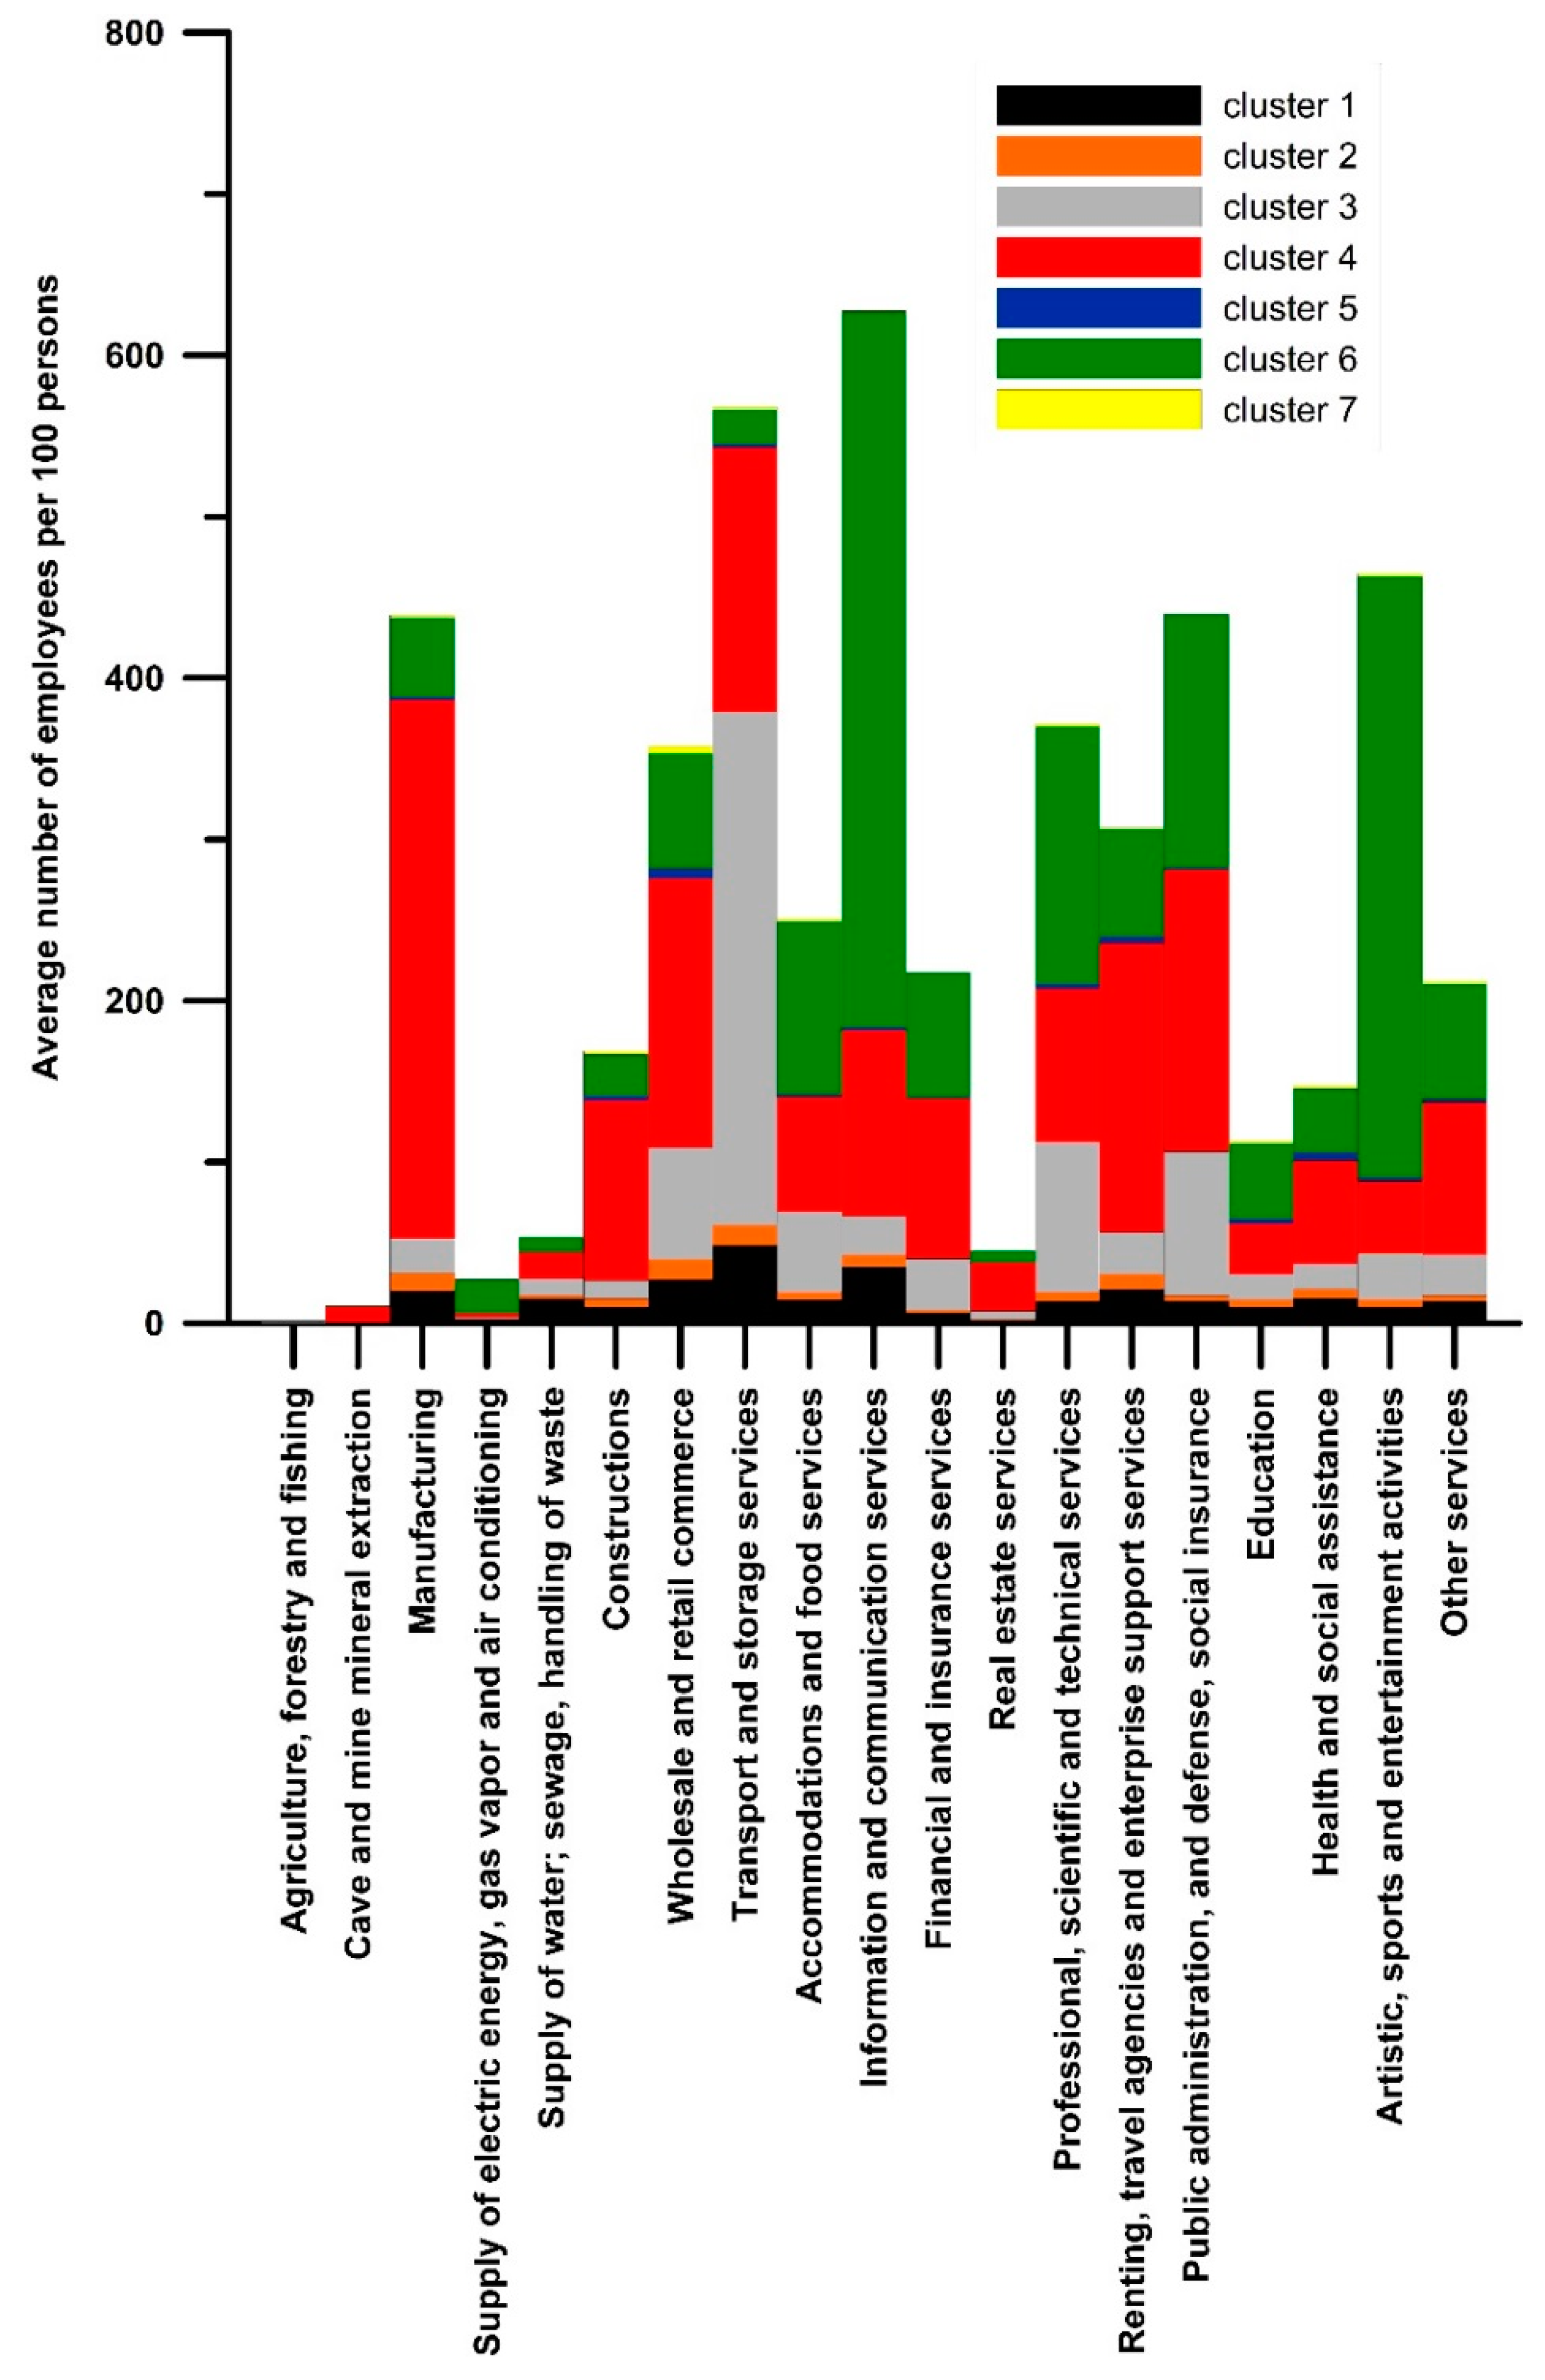
3.5. Processing of Economic Activities Census Data

We assumed that areas with high concentrations of economic activities and number of employees here working, should produce a mobility demand of population, increasing the amount of population located in these areas. In order to get information on the driving mechanism of the observed mobility time-patterns, the ratios of the number of production units and the number of employees to the resident population was calculated at the grid level using the 2011 Census data. We have assumed that cells with high value of this ratio should produce high demand of people moving to them, due to high density of production units with respect to the number of residents. Conversely, cells with low values of this ratio represent areas with low density of production units with respect to resident population, producing low demand of mobility towards them.
A quantitative assessment of the relationship between the number of employees per resident population and cell mobility was carried out. Starting from the daily profile of the NPM mobility factor at each cell, the total early morning NPM was calculated at cell level by summing NPM values from 06:00 to 11:00 am, considered as the commuting period. Its relationship with the local number of employees per 100 residents was then evaluated. Approximately 700 cells were used, corresponding to the urban area of Rome and its surroundings. For synthesis reasons, data were grouped in 19 classes by number of employees, and then by classes of increasing sizes.
The availability at cell level of the number of employees belonging to 19 economical macrocategories and of the mobility time-patterns provided by cluster analysis, allowed studying the contribution of each economic macrocategory to the mobility of city areas characterized by similar patterns (cluster). For all cells belonging to the same cluster of NPM mobility pattern, an average value of the number of employees per 100 inhabitants was calculated for each of the 19 economical macrocategories. This procedure was applied for each of the seven clusters. Results are presented in Section 4.

4. Results

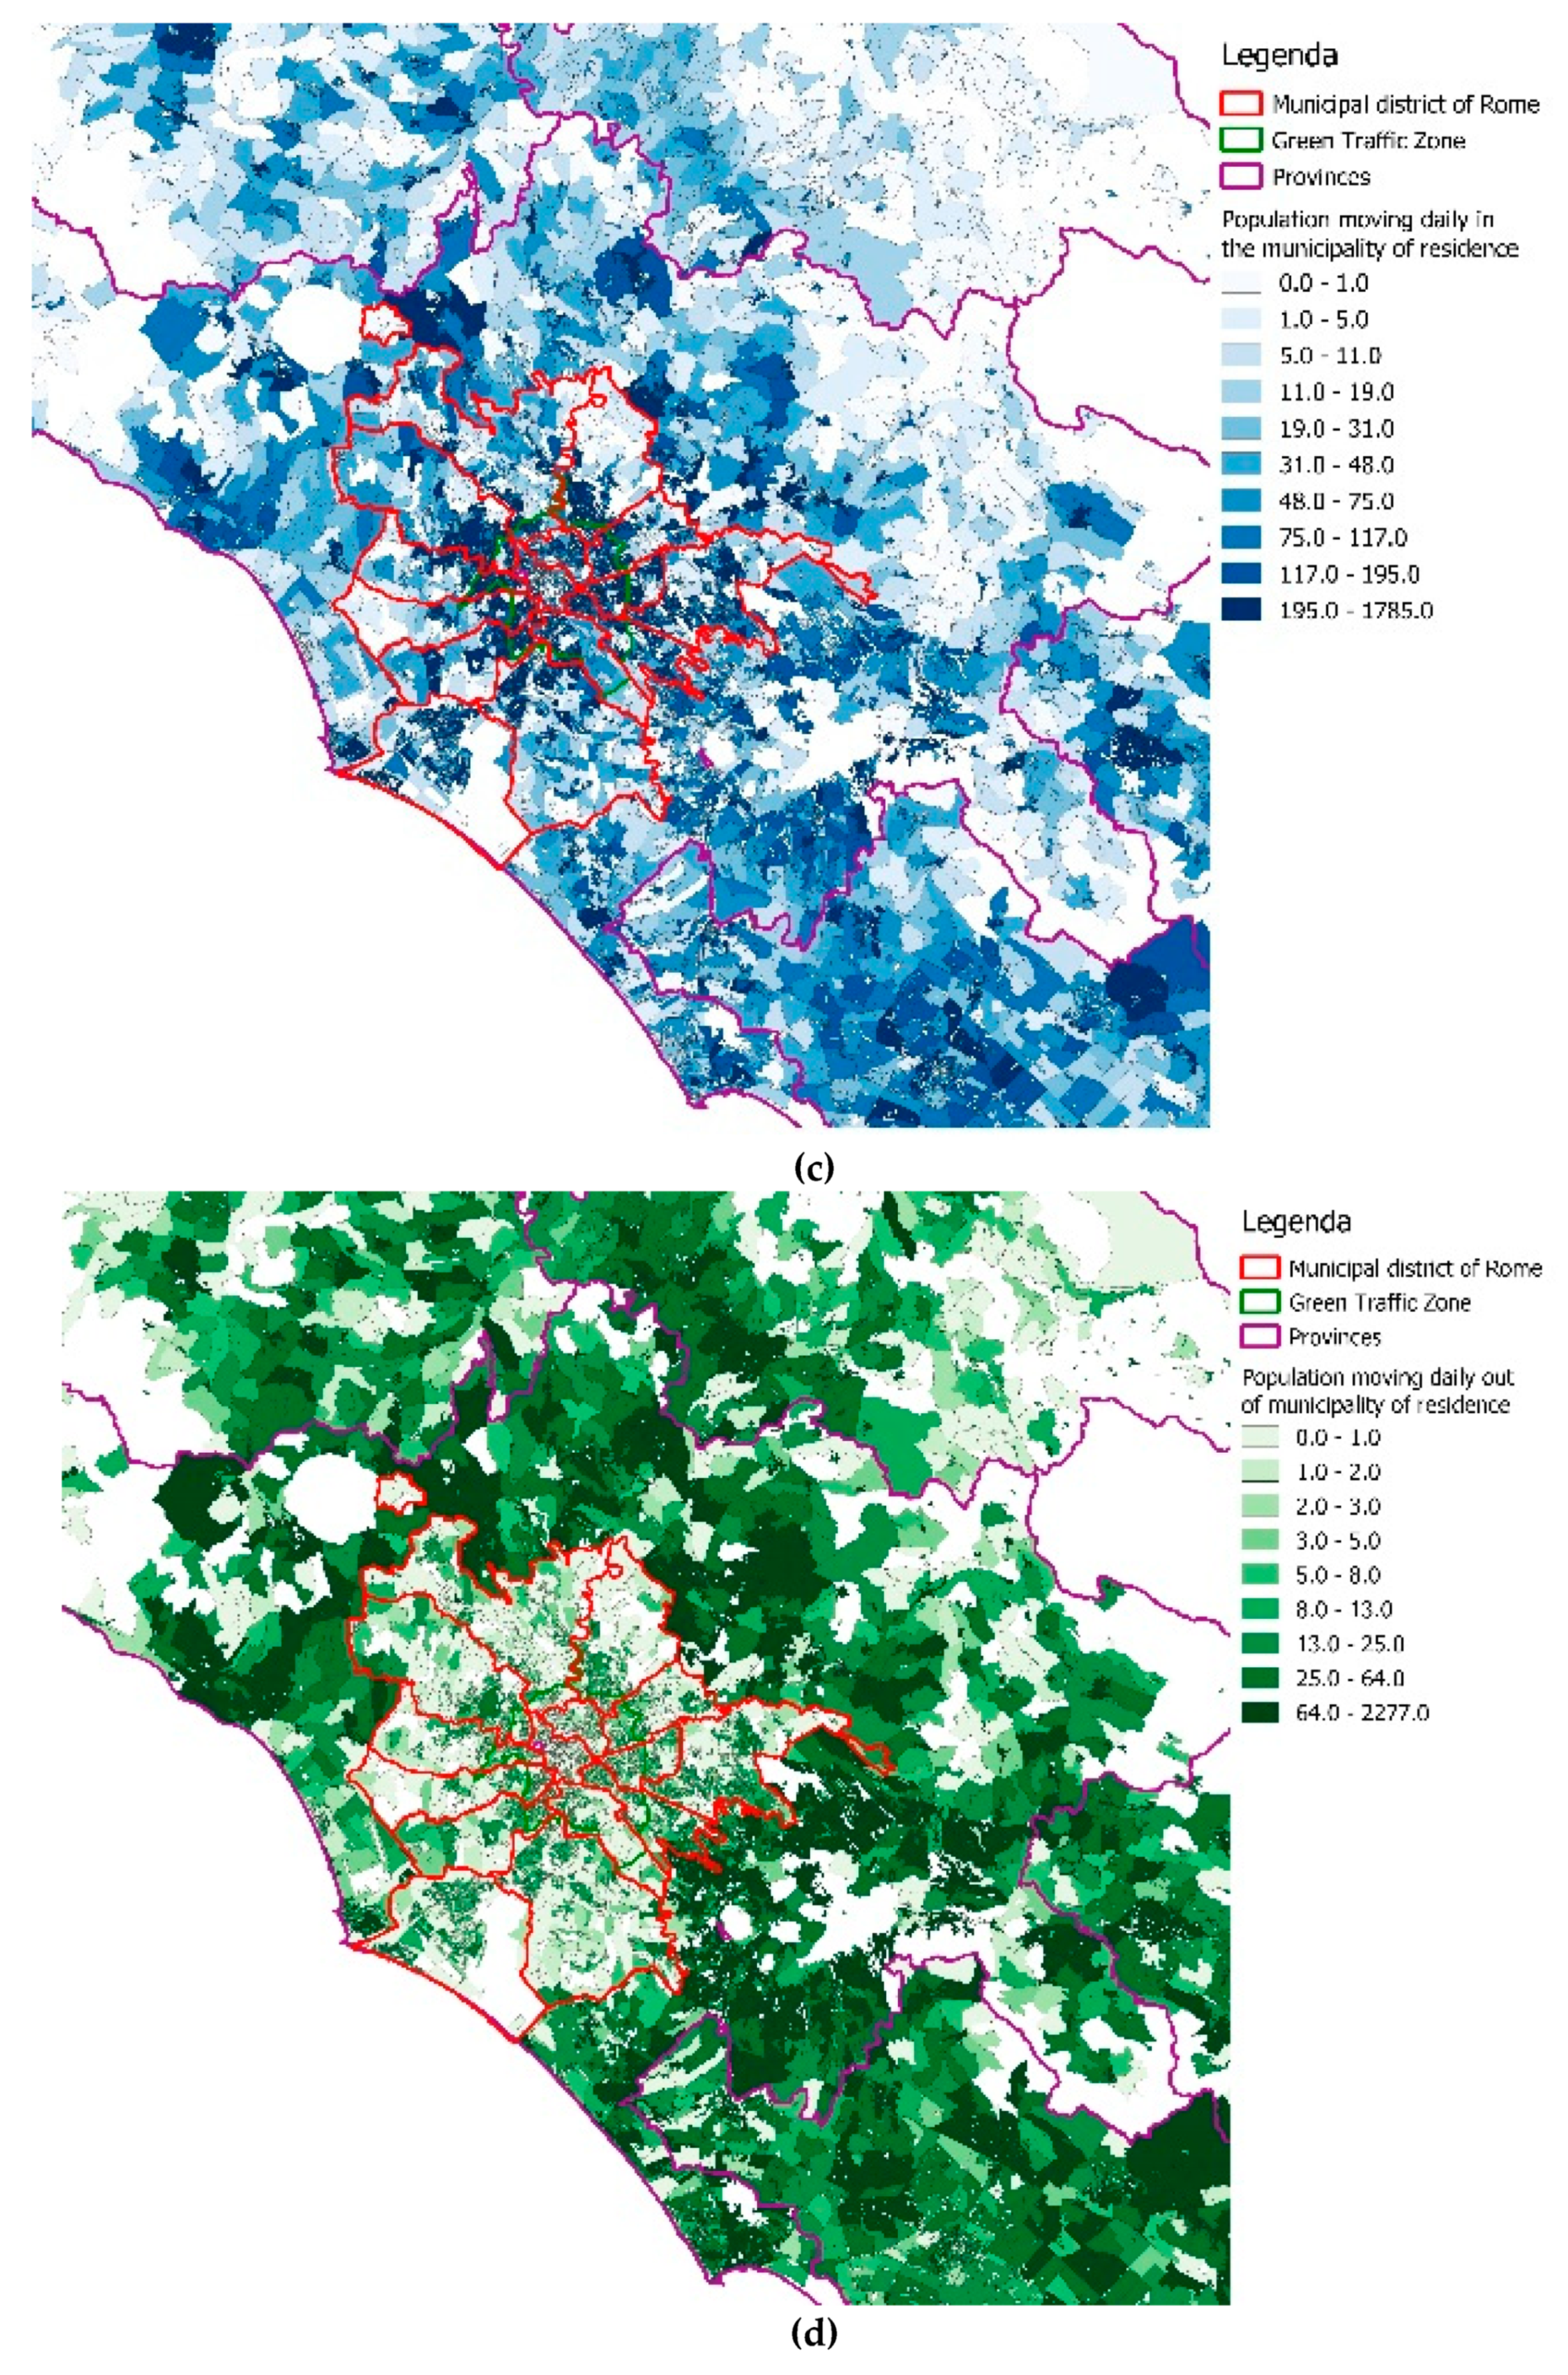
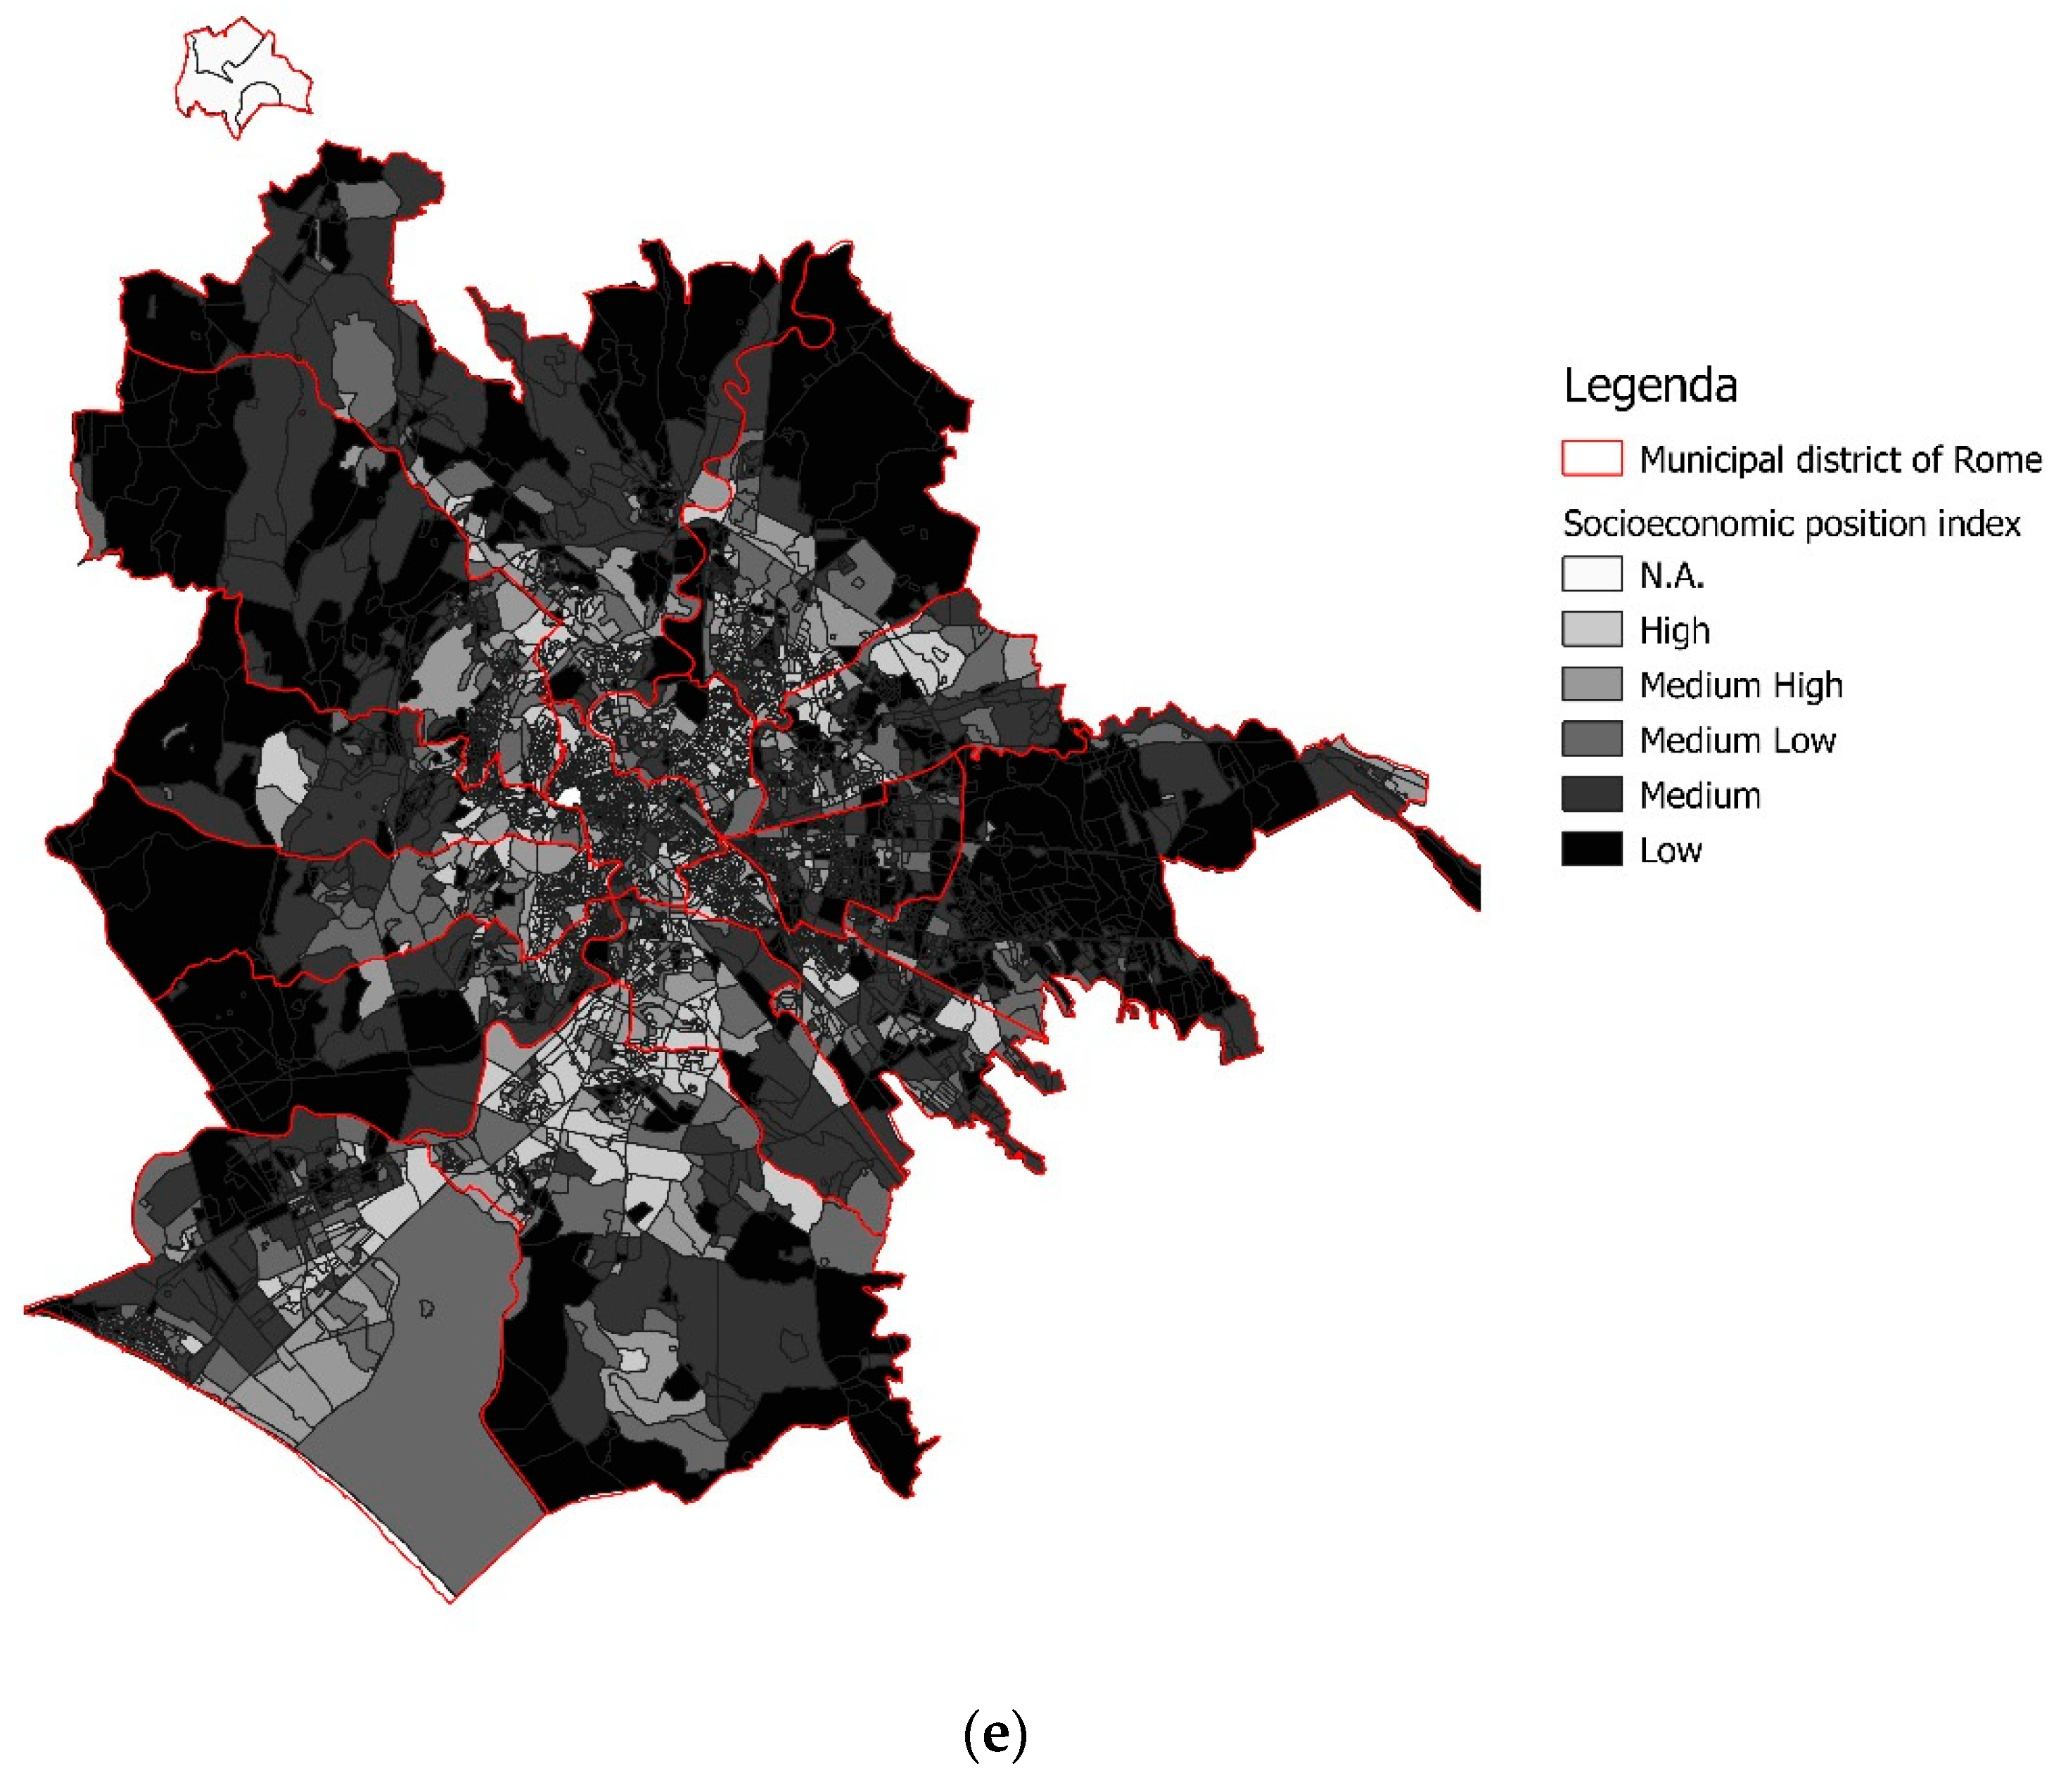
4.1. Spatial Characteristics of Census Data

Figure 4a–e show maps of resident population; number of buildings used for production, commercial, and services; and population moving daily in and out the municipality of residence, based on census data. The resident population map (Figure 4a) shows the highest densities downtown the city, as expected, reducing towards the neighbor municipal districts. High density of population are also detected out of the municipal districts of Rome. Figure 4c,d describes the amount of population who daily move within and out of the municipality of residence. It is worth noting the population living in Rome is likely to move within its municipality of residence (Figure 4c); while a fraction of population living in the province of Rome seems to move daily out of its municipality of residence (Figure 4d). Table 3 shows the fractions of resident population moving within/out the Province of Rome based on Census data. It can be seen that when the whole resident population of Province of Rome is taken into account, ~40% move daily within and 9% out of the municipality of residence. When residents of the municipality of Rome are selected, only 2% move daily out of their municipality and about 48% tend to move daily within it. Equal values for within and out (23–25%) are observed for population living in the Province of Rome (out of the municipality of Rome).
These results indicate that the human mobility in Rome is affected from a significant contribution coming from intra-urban movements of resident population, and from a lower contribution of not resident persons who come into the city from other municipalities of the Roma’s Province or resident population who move away to other municipalities.
Figure 4b shows that the buildings used for production, commercial, and services are mainly located in the downtown area of Rome, attracting employees for working reasons. A map of the socioeconomic position index is shown in Figure 4e for the municipality of Rome. It clearly indicates a spatial gradient toward the center of the city, with people having higher socioeconomic positions located downtown and lower positions in the neighborhood districts. Consequently, it is likely for people with lower socioeconomic positions to commute from suburban districts to central ones. This hypothesis is also consistent with the downtown location of buildings for production, commercial, and services shown in Figure 4b.

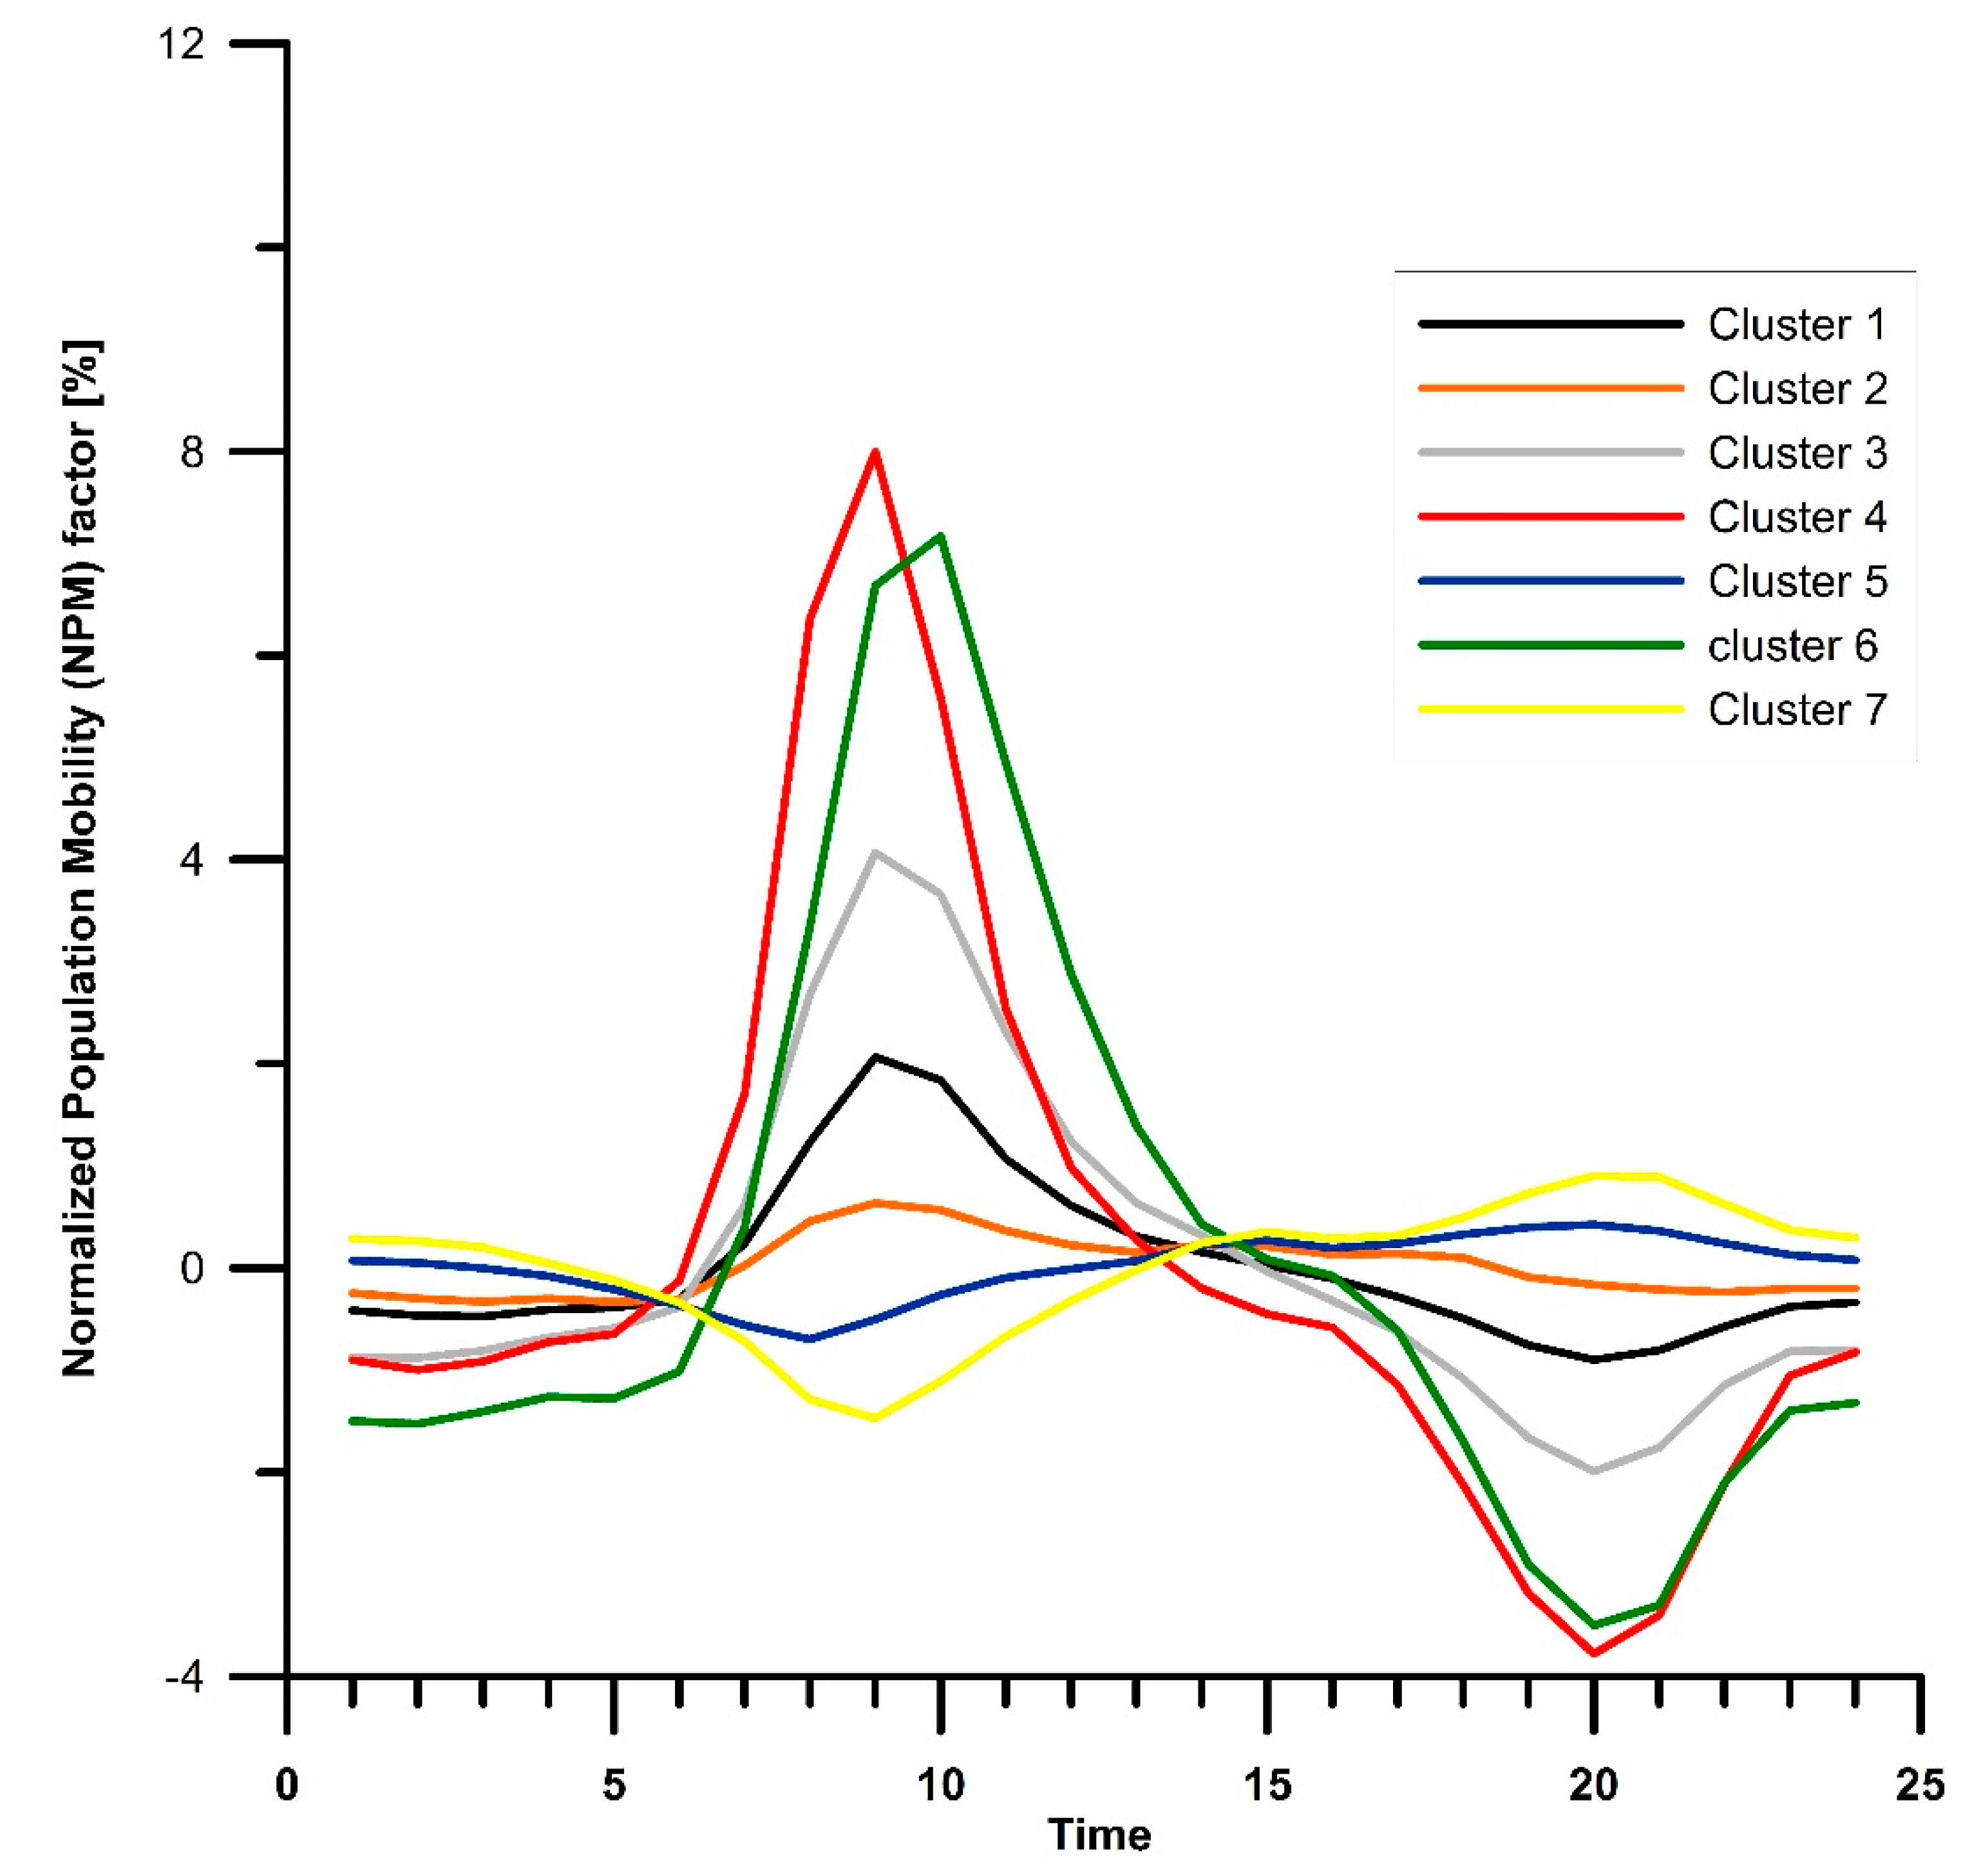
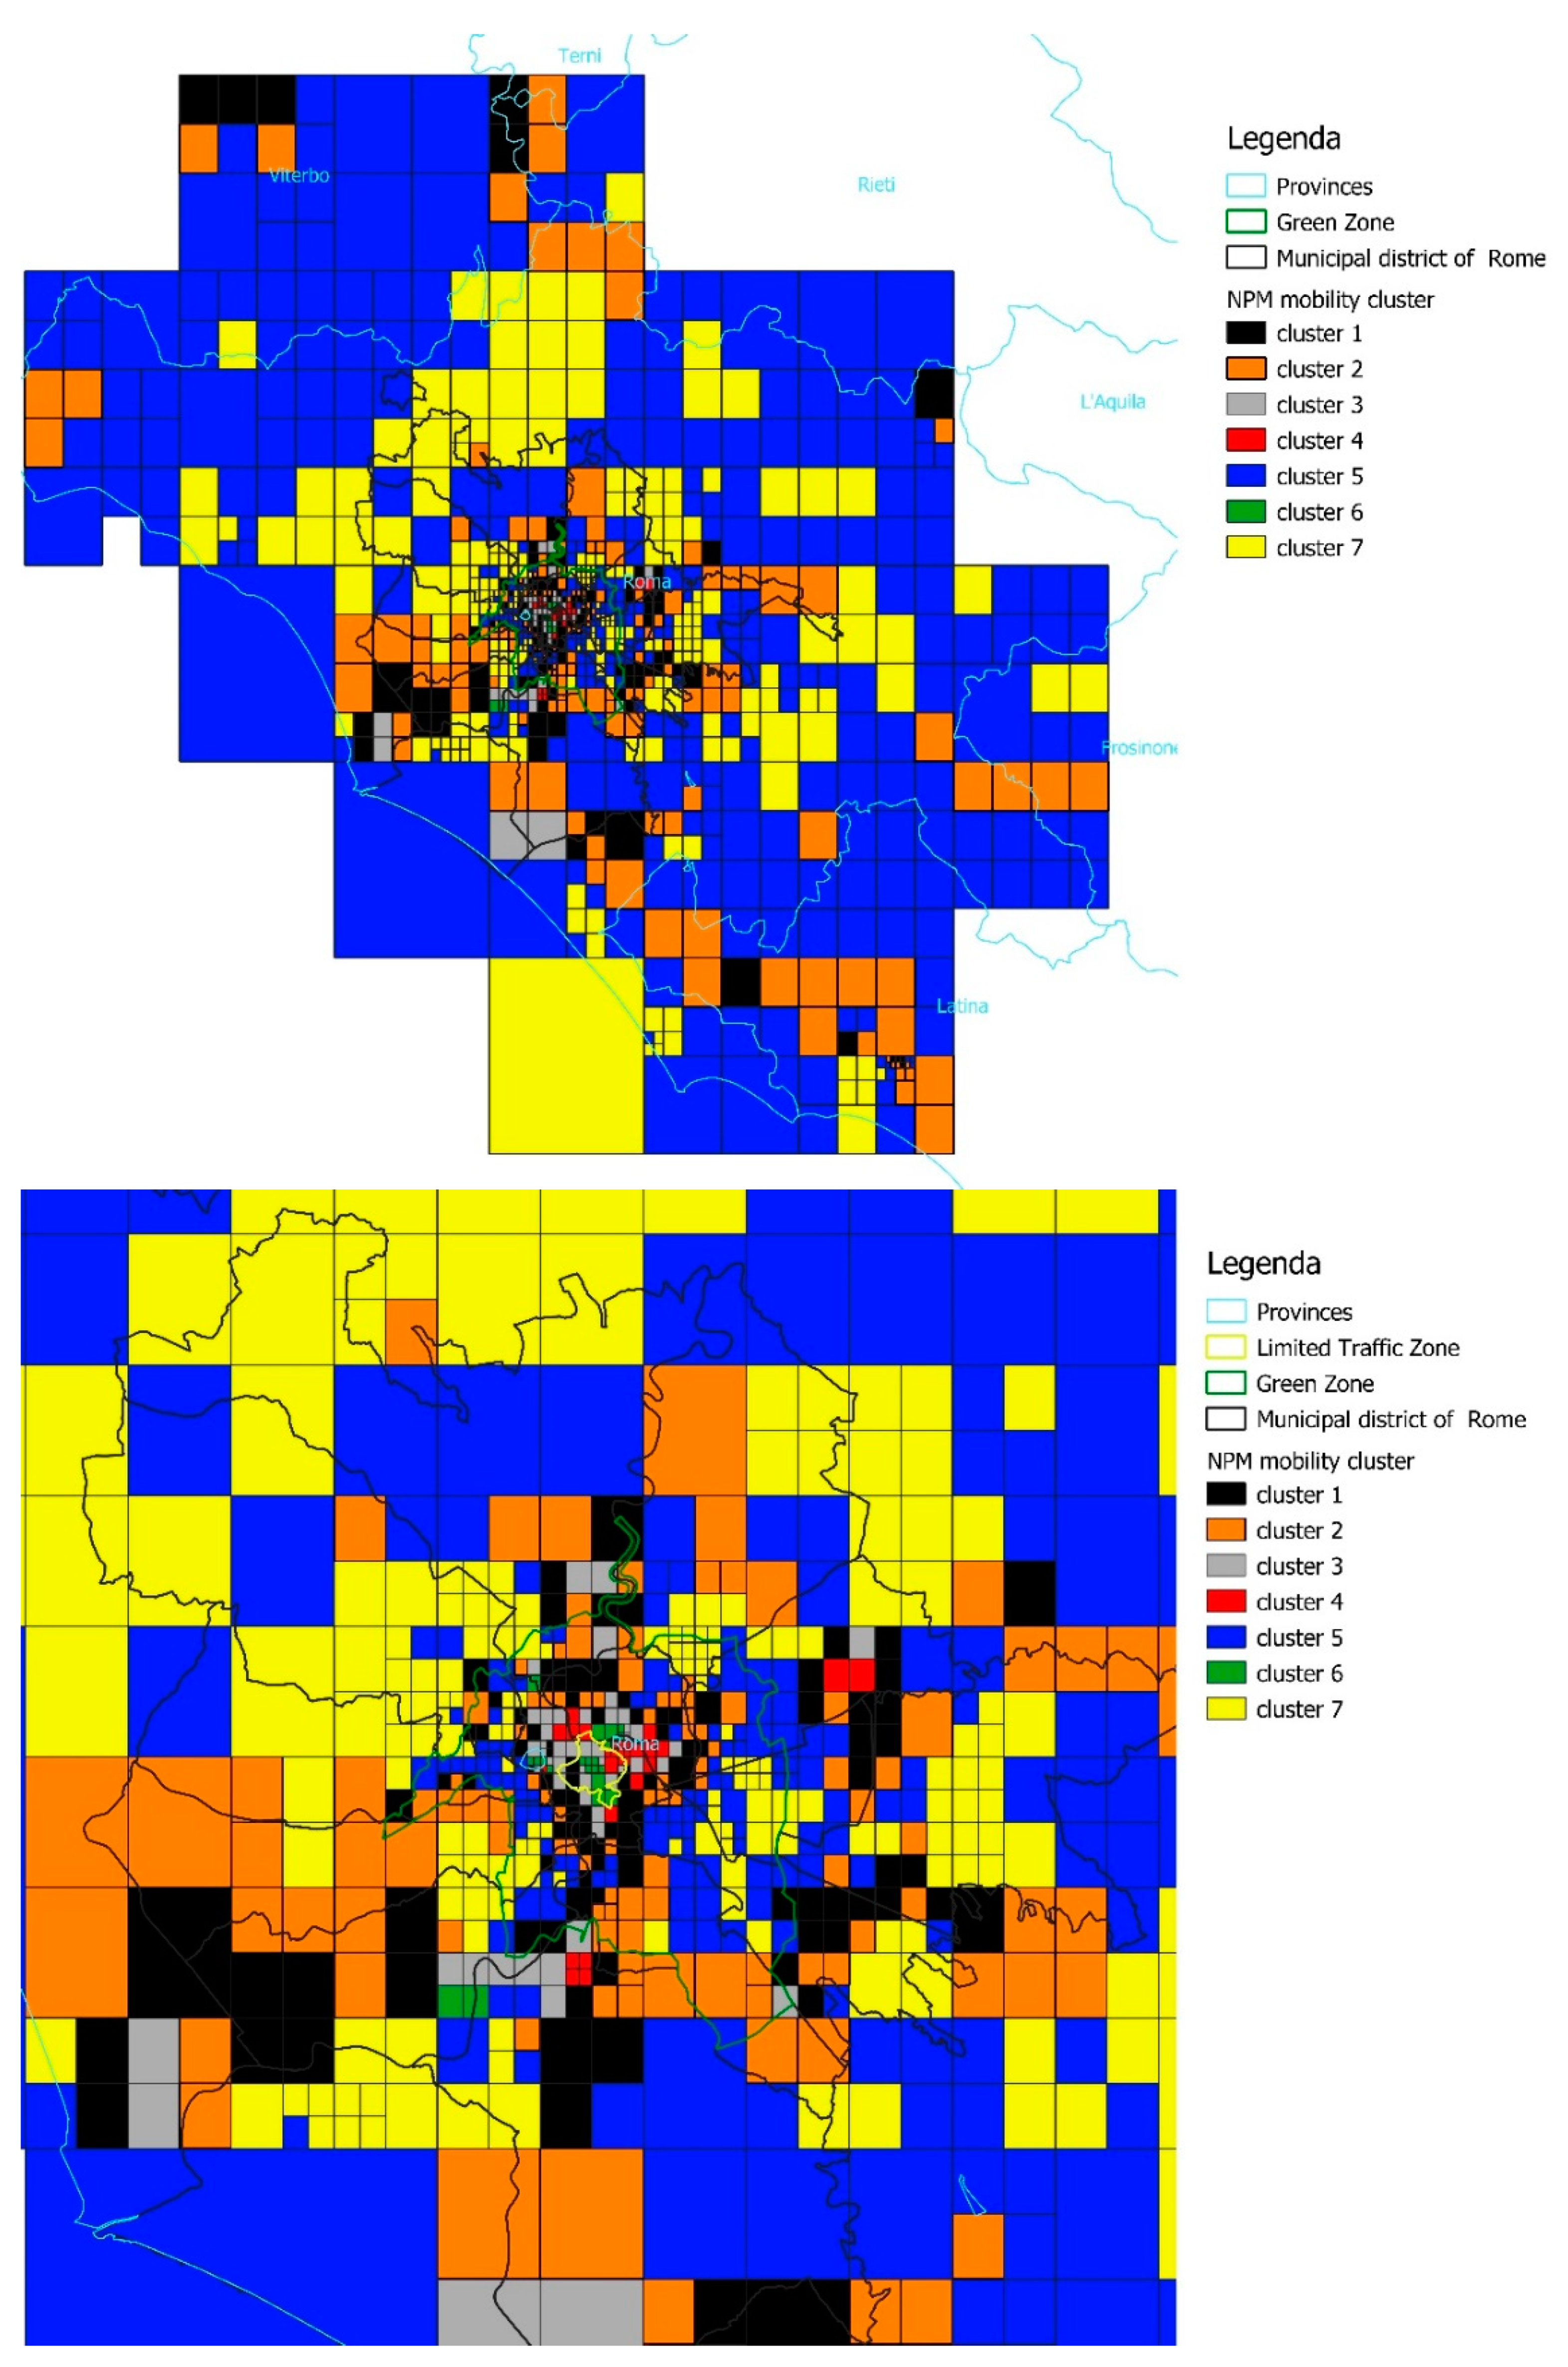
4.2. Temporal and Spatial Characteristics of Classified Population Mobility Patterns

Based on the cluster classified daily NPM mobility time-patterns, a first synthetic clusters interpretation was carried out according to the characteristics of time profile of mobility patterns, the location of each cluster in the studied area, and information about the location of residential, business, commercial and touristic areas. Table 4 shows a list of the clusters found and the correspondent number of cell members.
Figure 5 shows the mean daily profiles of clustered NPM population mobility time-patterns on working days. Then based on this classification, each cell of the studied region was ascribed to a specific NPM mobility time-pattern depending on its belonging to a specific cluster. Next a map of NPM mobility pattern was obtained, which is shown in Figure 6.
The clusters are characterized by morning and evening trends with different shape and intensities. In detail, clusters 1, 2, 3, 4, and 6 show morning maximum of different intensity, corresponding to an increase of population during the time interval 6:00–12:00 a.m., as well as a negative minimum in the evening with depletion of population during the interval 17:00–22:00. Clusters 1, 2, and 3 (black, orange, and gray colors in Figure 5 and Figure 6) correspond to areas with commercial and services activities at different densities, which people populate both for working and living reasons. Overall, they represent 34% of the total number of cells and are mainly positioned in the center area of Rome and in some medium-small size towns (see Figure 6). Clusters 4 and 6 (red and green in Figure 5 and Figure 6) have the strongest positive and negative morning maximum. They cover 5% of the total cells, representing hot spots areas with high concentration of business/services and touristic/commercial activities, respectively. As seen in Figure 6, they are typical located downtown. Clusters 5 and 7 (blue and yellow colors in Figure 5 and Figure 6, respectively) have an opposite trend with respect to the previous ones: they exhibit a negative minimum during morning hours, which implies a depletion of population and a low and wide positive peak in the evening. This behavior is typical of neighbor residential areas, where population is expected to commute toward central city areas for working reasons. They have 36% and 25% of cell members within the studied area (see Table 4), respectively.
To validate results, the census data about the number of both residential, and workplace (production, commercial, and services) buildings were derived for each cell. Such data represents a proxy of land use. Mean values were calculated and compared with the total mean early morning (06:00–11:00) NPM mobility by cluster. The Table 5 summarizes the results. Mobility is expected to depend on the density of workplace buildings, as a destination, for its demand of workforce, as well as on the density of residential building, considered as an origin of mobility. This assumption is consistent with results shown in Table 5. Clusters with the highest total mean early morning NPM mobility factor, such as clusters 4 and 6, have the greatest densities of workplace buildings. Conversely, the clusters with negative values of the total mean early morning NPM mobility factor, corresponding to depletion of population, exhibit the lowest densities of workplaces buildings. The total mean early morning NPM mobility is found to have a log relationship with the residential to workplace building ratio (R2 = 0.97, see Figure S3 in the Supplementary Material for results). The highest mobility (24.07 in Table 5) is found for areas where the residential to workplace buildings ratio equals one (1.01 in Table 5). Conversely, the lowest NPM mobility (−5.59, cluster 7) is found for areas where the mean density of residential buildings is about 5 times the workplace one (5.66 as ratio in Table 5). These results confirm the above hypothesis and validated the findings of land use assignments.

4.3. Effect of Population Mobility on Demography

The daytime (8:00–21:00) hourly demographic distributions of population where averaged on a daily bases and aggregated at cell level by clusters of mobility patterns. This analysis should provide the mean demographic characteristics by mobility time-patterns. Figure 7 shows the whisker box-plot of the mean normalized age population distributions obtained from the Demographic dataset by cluster for the Municipality of Rome.
The results show the same shape of census distribution reported in Table 1, but with larger dispersion of population for some age classes (e.g., <18 and >60) depending on clusters. Hot spots of population are observed for age class lower than 18 with values up to 42% (see cluster 5 and 6 in Figure 7). The clusters showing the highest NPM mobility factor (clusters 4 and 6 in Figure 5) show the highest and the lowest median values of population for age classes 18–30 (13%) and >60 (18%) respectively. It could mean that young working age population mainly contributes to the mobility in these high mobility cells (high-density business & services areas and touristic & commercial areas).
In order to assess in what extent, mobility of population affects the age population distribution with reference to that provided by census data, the maximum difference of mobile and census CDFs (provided by the Kolmogorov–Smirnov two-sample test procedure) by clusters were calculated for the Municipality of Rome. As described in Section 3.4, this test is usually applied to verify whether two samples come from the same distribution. Figure 8 shows a whisker box-plot of results. The median values of the maximum difference of CDFs range between 0.12 and 0.22. Hotspots at 0.68 are also detected (see cluster 1 on Figure 8) addressing for a high dissimilarity from the census age population distribution. Results shows that on average mobility slightly modifies the age distribution of population (0.15 on average in a range 0–1). It is worth to notice that the highest median values of maximum difference of CDFs are observed for clusters showing the highest values of NPM mobility factor (see cluster 4 and 6 on Figure 5 and Figure 8). The cells ascribed to these two clusters are likely involved by the greatest difference from the baseline Census age population distribution. As seen above, working age population is the main responsible for these differences. Figure S2 in the Supplementary Material shows a map of maximum difference of CDFs for the city of Rome where high spatial heterogeneity can be observed.

4.4. Connection of Mobility Patterns with the Economic Structure

In order to assess the relationship between population mobility and amount of workforce, the total early morning (06:00 to 11:00 am) NPM mobility factor was calculated and coupled at cell level with the number of employees per 100 residents. Results are shown in Figure 9. The total early morning NPM seems to have a linear relationship with the logarithm of the number of employees per 100 residents. The relationship is statistically significant with a value of R2 of 0.88. Negative values of the total early morning NPM factor, corresponding to depletion of population, relate with low values of the number of employees per 100 residents, which represent zones that do not attract people for working reasons. Conversely, higher positive values of the total morning mobility relate with higher values of the number of employees per 100 residents, representing areas with a high demand of mobility due to the high density of working positions.
By selecting the number of employees belonging to each of the 19 economical macrocategories at cell level, and by aggregating for clusters of NPM mobility time-patterns, it is possible to study the contribution of each economic macrocategory to the identified mobility patterns. Results are shown in Figure 10. The main contributors to the number of employees, in decreasing order, are Information and Communication; Transport and Storage services; Artistic, Sports and Entertainment activities; Manufacturing; and Public administration. Wholesale and Retail Commerce, as well as Professional, Scientific, and Technical services follow.
Most employees are in cells having higher values of mobility, such as those belonging to cluster 4 (red in Figure 5, Figure 6 and Figure 10) and cluster 6 (green in Figure 5, Figure 6 and Figure 10), which contribute in total 1805 (37%) and 1746 (36%) employees/100 inhabitants respectively, with a composite economic pattern mainly dominated by services activities. These results are consistent with the cluster interpretation reported in Table 4 and confirm the demography results obtained above for the same clusters. The third contributor in terms of number of employees/100 inhabitants (see Figure 10) are cells having the third higher morning mobility time-pattern (gray in Figure 5) and cluster 3 as a representative NPM mobility time-pattern with 837 (17%) employees per 100 residents, and Transport and Storage services as the main driving economic macrocategory. As expected, areas with negative values of morning NPM mobility factor (e.g., depletion of population), such as those having cluster 5 (blue in Figure 5 and Figure 10) and 7 (yellow in Figure 5 and Figure 10) as representative mobility time-pattern, do not show a significant number of employees (0.8 and 0.5% respectively) to develop mobility of population towards them. The residential attribution assigned to these clusters (Table 4) is consistent with these results.

5. Discussion

The above results point out the significance of population mobility in large metropolitan areas and its connection with the workforce.
Mobile phone traffic, used as a proxy of population presence, is able to track the location of people with high spatial–temporal detail, providing variations of population that are largely due to mobility. Time-pattern of population were found to be consistent with other studies carried out in Rome [3], Milan [30], Korean cities [24], and Paris [28] exhibiting common time features related with daily activity rhythms.
The mobility factor (NPM) introduced in this work, allowed the mobility phenomena to be identified and assessed. Hourly time profiles of the mobility factor were calculated and classified in seven clusters. Results were then validated with population, mobility, and type of building census data. A former study [3] applied a cluster analysis on six time intervals of Erlang data (a measure of network bandwidth usage) collected in the city of Rome, identifying eight clusters. Although they revealed an overall structure of the city linked with the type of human activities, they could not connect it with cell signatures. Our work improved those results by obtaining a mobility map of the Rome metropolitan area, assigning mean clustered mobility time-patterns to the cells and linking them to the specific ongoing economic activities and workforce. Being based on aggregated cell level population data, this study could not deal with complex analysis and methods such as identification of travel, activity or mobility patterns as well as with identifying important living places, social events or with classifying mobile phone users into behavioral categories, as those analysis are based on processing of individual mobile phone cards or GPS data not available in this dataset. Consequently, the goal of this paper is not to present a new analysis/technology or to carry out a mobility pattern analysis. Rather, the study takes advantage of open mobile phone data to carry out a conventional mobility study using time variations of population density as a proxy of mobility, classifying the study domain by daily mobility patterns and linking it with other unconventional data like dynamic demography and workforce/economic sectors census data.
Dynamic demographic data by age classes, allowed to get information on the type of population involved in this mobility and to get insight in the related composition of population. Although the mean age class population distributions obtained from mobile phone are consistent with those of census data, a large spread (±15%) of variation are detected for each age class. Consequently, the mobility of urban population does affect its composition. The comparison at cell level of these mobile derived age population distributions with census data, permitted to assess the amount of variations of age population distributions due to mobility. In a range between 0 and 1, the maximum difference between the mobile based and the census CDFs was 0.15 on average with peaks up to 0.68. The areas with the highest values of NPM mobility factor were found to have the greatest variations on the age population distributions, mainly produced by the working age classes. Therefore possible intervention measures should be applied in these areas. These demographic results are new and contribute to the analysis of Rome’s urban mobility.
This study found that the number of employees per 100 inhabitants has a log linear relationship with the total early morning mobility and a strong spatial association with the time-patterns of the NPM mobility factor derived by cluster analysis. Although some general results are expected, the analysis carried out allowed the quantification of the phenomenon of mobility in this large metropolis and its characterization. A former study [8] analyzed Erlang data collected in the city of Rome during seven weeks. It found that different hours of the day differently affect the mobile activity levels of diverse areas of the city and that differences in activity patterns among areas can partially be attributed to differences in their demographics, establishments, and built environment. This study improves these former results, by providing demographic information and by quantifying the contribution of employees’ per economic activity to mobility. Spatial consistencies with Census data about the population moving daily within or out from the municipality of residence and about both socioeconomic index and buildings used for production, commercial and services, were also found. The combined information on mobility-employees-economic sector could be used to assess the effect on mobility due to relocation of offices owning to economic macrocategories found to be of high contribution on mobility such as those of cluster 4 and 6 (high density business & services areas and touristic & commercial areas). Mobile phone data were already used to relate mobility with socioeconomic positions. Blumenstock [40] reviewed how data can be useful to measure wealth and poverty in developing countries. Pappalardo et al. [41] used mobility measures and social measures extracted from mobile phone data to estimate indicators for socioeconomic development and well-being in France. Marchetti et al. [42] showed how big data has the potential to mirror aspects of well-being and other socioeconomic phenomena. They suggested three ways to use big data together with small area estimation techniques: to create local indicators and compare them to those obtained with small area estimation methods; use big data sources to generate new covariates; use survey data to check and remove the self-selection bias of the values of the indicators obtained using Big Data. The present study partially relates with the first and the third suggested ways. It creates a local mobility indicator (NPM cell based) and used survey data (population moving daily, socioeconomic position index, and amount of employees per economic sector) to check spatial consistency and validates results.
A few limitations of this study have been identified. Firstly, the short period of analysis (two months) does not permit conclusive evaluations about the variability of population mobility by seasons. Secondly, for individuals having low rate phone activity, the tracking of their positions could lack of accuracy. Demographic data might underrepresent some age classes, particularly those who are not frequent callers, such as elderly people. In addition, because population data were not separated as individuals, we could not detect variations of population determined by exchanges of the same amount of people moving to and from connected grid cells (intercell mobility); these are supposed to produce null effects on the related population amount. The lack of individual data do not allow to carry out a deeper analysis on travel, activity or mobility patterns as those conducted in many mobility studies [17,18,19,20,21,23,24,25,26]. Being based on offline analysis of presence data derived from mobile phone communications, this study does not provide tools for real-time applications such as those able to monitor population and its composition, support emergency analysis involving population, or deliver information services to public transportation systems. Nevertheless, the study represents the first insight on actual time dependent distribution of people in the complex reality of the city of Rome.
Exploiting aggregated data available as open-data for the first time in Italy, the study provides for the city of Rome and its Province an accurate and deep understanding of the population mobility in the metropolitan area, providing its timing, spatial distribution, demographic effects and driving mechanisms in terms of workforce contributions from different macroeconomic categories. These results could support the identification and effectiveness of mobility measures aimed to reduce the work related commuting between home and work places and consequently the risk of road accidents with related injuries. These latter occur mainly due to poor use of public transport for individual commuting, hence mobility driven measures of urban planning can positively reflect on reduction of social/health costs caused by home–work commuting and work-related road accidents with related injuries. The timing of mobility at cell level could support, as an example, the tuning of public transportation plans to provide services where they are needed. The workforce contributions from specific economic sectors to the classified mobility patterns could provide data to evaluate the effectiveness of relocation of selected economic activities to reduce work related mobility. Finally, the demographic results provide information about the people involved in the mobility phenomena allowing to correctly design and target specific communication campaigns or marketing measures.

6. Conclusions

An urban population mobility study was carried out in the large metropolitan area of Rome by using mobile phone traffic data collected over two months (from 1 March to 30 April, 2015). Locations of more than a million people using a mobile phone were registered at high spatial and temporal resolution with demographic information. A specific mobility factor was introduced to characterize the mobility phenomena at metropolitan scale.
Daily mobility time profiles were obtained and classified by means of a cluster analysis technique, allowing the identification of areas with different time profile of population mobility. Seven distinct population mobility time patterns were identified and related with land use territory and its rhythms. The age distributions of population provided by mobile traffic were linked with mobility time-patterns getting insight in the type of population involved in this mobility. Mobility was found to modify the demography of population with different extent depending on the classified urban zones. The above mobility patterns were found to be driven by the presence of production units and their need of employees, with a composite contribution from different macroeconomic categories.
The findings derived from this study provide insight about the location, time and intensity of the mobility of people in Rome, which is helpful to support urban local planning for human mobility. In particular the identification of mobility time-patterns, their relationship with the amount of workforce, and the relative contribution from specific economic macrosectors, could be used to figure out the potential impact on mobility of measures of relocation of selected economic activities aimed to reduce work-related mobility with possible effects on the reduction of social/health costs caused by home–work commuting and work-related road accidents.

Supplementary Materials

The following are available online at https://www.mdpi.com/2306-5729/4/1/8/s1, Figure S1: Time series of the total population located in the grid domain during the study period, Figure S2: Map of the maximum difference of mobile phone and census age population CDFs for the city of Rome, Figure S3: Plot of Total mean early morning NMP mobility vs. mean density of residential to workplace buildings ratio, Figure S4: Plot of Sum Squared Error (SSE) and Silhoutte vs. number of clusters. Table S1: Amount of units and employees in the Lazio region by economic macrocategories according to Census 2011.

Author Contributions

C.G.: Conceptualization, Methodology, Data Collection, and Analysis, and Writing—Original Draft Preparation. A.P.: Conceptualization, Methodology, the application of cluster analysis, and the internal revision of the paper. M.P.B.: GIS data processing and the internal revision of the paper.

Funding

This research received no external funding.

Acknowledgments

The TIM Big Data Challenge 2015 (www.telecomitalia.com/bigdatachallenge) is acknowledged for the provision of the mobile phone derived population data.

Conflicts of Interest

The authors declare no conflicts of interest.

References

  1. Pucci, P.; Manfredini, F.; Tagliolato, P. Mapping Urban Practices Through Mobile Phone Data; Springer Briefs in Applied Science and Technology; Springer: Cham, Switzerland; Heidelberg, Germany; New York, NY, USA; Dordrecht, The Netherlands; London, UK, 2015. [Google Scholar]
  2. Ratti, C.; Frenchman, D.; Pulselli, R.M.; Williams, S. Mobile landscapes: Using location data from cell phones for urban analysis. Environ. Plan. B Plan. Des. 2006, 33, 727–748. [Google Scholar] [CrossRef]
  3. Reades, J.; Calabrese, F.; Sevtsuk, A.; Ratti, C. Cellular census: Explorations in urban data collection. IEEE Pervasive Comput. 2007, 6, 30–38. [Google Scholar] [CrossRef]
  4. Steenbruggen, J.; Tranos, E.; Nijkamp, P. Data from mobile phone operators: A tool for smarter cities? Telecommun. Policy 2015, 39, 335–346. [Google Scholar] [CrossRef] [Green Version]
  5. Wang, Z.; He, S.Y.; Leung, Y. Applying mobile phone data to travel behaviour research: A literature review. Travel Behav. Soc. 2018, 11, 141–155. [Google Scholar] [CrossRef]
  6. Calabrese, F.; Ferrari, L.; Blondel, V.D. Urban Sensing Using Mobile Phone Network Data: A Survey of Research. ACM Comput. Surv. 2014, 47, 25. [Google Scholar] [CrossRef]
  7. Ahas, R.; Aasa, A.; Yuan, Y.; Raubal, M.; Smoreda, Z.; Liu, Y.; Ziemlicki, C.; Tiru, M.; Zook, M. Everyday space–time geographies: Using mobile phone-based sensor data to monitor urban activity in Harbin, Paris, and Tallinn. Int. J. Geogr. Inf. Sci. 2015. [Google Scholar] [CrossRef]
  8. Sevtsuk, A.; Ratti, C. Does urban mobility have a daily routine? Learning from aggregate data of mobile networks. J. Urban Technol. 2010, 17, 41–60. [Google Scholar] [CrossRef]
  9. Demissie, M.G.; de Almeida Correia, G.H.; Bento, C. Exploring cellular network handover information for urban mobility analysis. J. Transp. Geogr. 2013, 31, 164–170. [Google Scholar] [CrossRef]
  10. Isaacman, S.; Becker, R.; Càceres, R.; Kobourov, S.; Martonosi, M.; Rowland, J.; Varshavsky, A. Ranges of human mobility in Los Angeles and New York. In Proceedings of the Ninth Annual IEEE International Conference on Pervasive Computing and Communications—PerCom 2011, Seattle, WA, USA, 21–25 March 2011. [Google Scholar]
  11. Gonzàlez, M.C.; Hidalgo, C.; Barabàsi, A. Understanding individual human mobility pattern. Nature 2008, 453. [Google Scholar] [CrossRef] [PubMed]
  12. Isaacman, S.; Becker, R.; Càceres, R.; Kobourov, S.; Martonosi, M.; Rowland, J.; Varshavsky, A.; Willinger, W. Human mobility modeling at metropolitan scales. In Proceedings of the 10th International Conference on Mobile Systems, Applications, and Services; ACM: New York, NY, USA, 2012. [Google Scholar]
  13. Widhalm, P.; Yang, Y.; Ulm, M.; Athavale, S.; González, M.C. Discovering urban activity patterns in cell phone data. Transportation 2015, 42, 597–623. [Google Scholar] [CrossRef] [Green Version]
  14. Secchi, P.; Vantini, S.; Vitelli, V. Analysis of spatio-temporal mobile phone data: A case study in the metropolitan area of Milan. Stat. Methods Appl. 2015, 24, 279–300. [Google Scholar] [CrossRef]
  15. Phithakkitnukoon, S.; Smoreda, Z.; Olivier, P. Socio-geography of human mobility: A study using longitudinal mobile phone data. PLoS ONE 2012, 7, e39253. [Google Scholar] [CrossRef] [PubMed]
  16. Deville, P.; Linard, C.; Martin, S.; Gilbert, M.; Stevens, F.R.; Gaughan, A.E.; Blodel, V.D.; Tatem, A.J. Dynamic population mapping using mobile phone data. Proc. Natl. Acad. Sci. USA 2014, 11, 15888–15893. [Google Scholar] [CrossRef] [PubMed]
  17. Fang, Z.; Yang, X.; Xu, Y.; Shaw, S.L.; Yin, L. Spatiotemporal model for assessing the stability of urban human convergence and divergence patterns. Int. J. Geogr. Inf. Sci. 2017, 31, 2119–2141. [Google Scholar] [CrossRef]
  18. Yang, X.; Zhao, Z.; Lu, S. Exploring Spatial-Temporal Patterns of Urban Human Mobility Hotspots. Sustainability 2016, 8, 674. [Google Scholar] [CrossRef]
  19. Yang, X.; Fang, Z.; Xu, Y.; Shaw, S.-L.; Zhao, Z.; Yin, L.; Zhang, T.; Lin, Y. Understanding Spatiotemporal Patterns of Human Convergence and Divergence Using Mobile Phone Location Data. ISPRS Int. J. Geo-Inf. 2016, 5, 177. [Google Scholar] [CrossRef]
  20. Yuan, Y.; Raubal, M. Extracting Dynamic Urban Mobility Patterns from Mobile Phone Data. In GIScience 2012: Geographic Information Science; Lecture Notes in Computer Science; Xiao, N., Kwan, M.P., Goodchild, M.F., Shekhar, S., Eds.; Springer: Berlin/Heidelberg, Germany, 2012; Volume 7478. [Google Scholar]
  21. Kang, C.; Sobolevsky, S.; Liu, Y.; Ratti, C. Exploring Human Movements in Singapore: A Comparative Analysis Based on Mobile Phone and Taxicab Usages. In Proceedings of the 2nd International Workshop on Urban Computing (UrbComp’13), Chicago, IL, USA, 11 August 2013. [Google Scholar]
  22. Sun, J.B.; Yuan, J.; Wang, Y.; Si, H.B.; Shan, X.M. Exploring space–time structure of human mobility in urban space. Phys. A 2011, 390, 929–942. [Google Scholar] [CrossRef]
  23. Xu, Y.; Shaw, S.; Zhao, Z.; Yin, L.; Fang, Z.; Li, Q. Understanding Aggregate Human Mobility Patterns using Passive Mobile Phone Location Data—A Home-based Approach. Transportation 2015, 42, 625–646. [Google Scholar] [CrossRef]
  24. Lee, K.S.; You, S.Y.; Eom, J.K.; Song, J.; Min, J.H. Urban spatiotemporal analysis using mobile phone data: Case study of medium- and large-sized Korean cities. Habitat Int. 2018, 73, 6–15. [Google Scholar] [CrossRef]
  25. Jiang, S.; Ferreira, J.; Gonzalez, M.C. Activity-Based Human Mobility Patterns Inferred from Mobile Phone Data: A Case Study of Singapore. IEEE Trans. Big Data 2017, 3, 208–219. [Google Scholar] [CrossRef]
  26. Fan, Z.; Pei, T.; Ma, T.; Du, Y.; Song, C.; Liu, Z.; Zhou, C. Estimation of urban crowd flux based on mobile phone location data: A case study of Beijing, China. Comput. Environ. Urban Syst. 2018, 69, 114–123. [Google Scholar] [CrossRef]
  27. Calabrese, F.; Colonna, M.; Lovisolo, P.; Parata, D.; Ratti, C. Real-time urban monitoring using cell phones: A case study in Rome. IEEE Trans. Intell. Transp. Syst. 2011, 12, 141–151. [Google Scholar] [CrossRef]
  28. Trasarti, R.; Olteanu-Raimond, A.; Nanni, M.; Couronnè, T.; Furletti, B.; Giannotti, F.; Smoreda, Z.; Ziemlicki, C. Discovering urban and country dynamics from mobile phone data with spatial correlation patterns. Telecommun. Policy 2015, 39, 347–362. [Google Scholar] [CrossRef]
  29. Furletti, B.; Trasarti, R.; Cintia, P.; Gabrielli, L. Discovering and Understanding City Events with Big Data: The Case of Rome. Information 2017, 8, 74. [Google Scholar] [CrossRef]
  30. Manfredini, F.; Tagliolato, P.; Di Rosa, C. Monitoring temporary populations through cellular core network data. In Proceedings of the 11th International Conference on Computational Science and Its Applications, Santander, Spain, 20–23 June 2011; Springer: Berlin/Heidelberg, Germany, 2011; Volume Part II, pp. 151–161, ISBN 978-3-642-21887-3. [Google Scholar]
  31. Soto, V.; Frias-Martinez, E. Robust land use characterization of urban landscapes using cell phone data. In Proceedings of the First Workshop on Pervasive Urban Applications PURBA 2011, San Francisco, CA, USA, 12–15 June 2011. [Google Scholar]
  32. Isaacman, S.; Becker, R.; Càceres, R.; Kobourov, S.; Martonosi, M.; Rowland, J.; Varshavsky, A. Identifying important places in people’s lives from cellular network data. In Proceedings of the 9th International Conference on Pervasive Computing, San Francisco, CA, USA, 12–15 June 2011. [Google Scholar]
  33. Gabrielli, L.; Furletti, B.; Trasarti, R.; Giannotti, F.; Pedreschi, D. City users’ classification with mobile phone data. In Proceedings of the 2015 IEEE International Conference on Big Data, Santa Clara, CA, USA, 9 October–1 November 2015; pp. 1007–1012. [Google Scholar]
  34. Traag, V.A.; Browet, A.; Calabrese, F.; Morlot, F. Social event detection in massive mobile phone data using probabilistic location inference. In Proceedings of the 2011 IEEE Third International Conference on Privacy, Security, Risk and Trust and 2011 IEEE Third International Conference on Social Computing, Boston, MA, USA, 9–11 October 2011. [Google Scholar]
  35. Gariazzo, C.; Pelliccioni, A.; Bolignano, A. A dynamic urban air pollution population exposure assessment study using model and population density data derived by mobile phone traffic. Atmos. Environ. 2016, 131, 289–300. [Google Scholar] [CrossRef]
  36. ISTAT. Matrici di Pendolarismo ISTAT. 2014. Available online: http://www.istat.it/it/archivio/139381 (accessed on 7 January 2019). (In Italian).
  37. ISTAT. Censimento Dell’industria e dei Servizi. 2011. Available online: http://dati-censimentoindustriaeservizi.istat.it/Index.aspx (accessed on 7 January 2019). (In Italian).
  38. ISTAT. Popolazione e Famiglie. 2016. Available online: https://www.istat.it/it/popolazione-e-famiglie?dati (accessed on 7 January 2019). (In Italian).
  39. Cesaroni, G.; Agabiti, N.; Rosati, R.; Forastiere, F.; Perucci, C.A. An index of socioeconomic position based on 2001 Census, Rome. Epidemiol. Prev. 2006, 30, 352–357. (In Italian) [Google Scholar]
  40. Blumenstock, J.E. Fighting poverty with data. Science 2016, 353. [Google Scholar] [CrossRef]
  41. Pappalardo, L.; Vanhoof, M.; Gabrielli, L.; Smoreda, Z.; Pedreschi, D.; Giannotti, F. An analytical framework to nowcast well-being using mobile phone data. Int. J. Data Sci. Anal. 2016, 2, 75–92. [Google Scholar] [CrossRef] [Green Version]
  42. Marchetti, S.; Giusti, C.; Pratesi, M.; Salvati, N.; Giannotti, F.; Pedreschi, D.; Rinzivillo, S.; Pappalardo, L.; Gabrielli, L. Small area model-based estimators using Big Data sources. J. Off. Stat. 2015, 31, 263–281. [Google Scholar] [CrossRef]
Figure 1. Map of the TIM gridded population datasets derived from mobile phone traffic (top) and detailed map of TIM gridded population datasets over the metropolitan area of Rome (bottom).
Data 04 00008 g001aData 04 00008 g001b
Figure 2. Scatter plot of gridded values of night-time (3:00–5:00 a.m.) population derived by mobile phone vs. census 2011 based resident population for the metropolitan area of Rome during workdays.
Data 04 00008 g002
Figure 3. Daily profiles of typical workdays of the normalized population mobility (NPM) factor for three representative different cells of the metropolitan area of Rome (upper plot) and distributions of NPM across the cells in the grid for selected time of the day (bottom plot).
Data 04 00008 g003
Figure 4. Census maps of resident population (a); buildings used for production, commercial, and services (b); population moving daily within the municipality of residence (c); population moving daily out the municipality of residence (d); and socioeconomic position index (e). Boundaries of the municipality district of Rome, Green Traffic Zone, and Provinces are also shown.
Data 04 00008 g004aData 04 00008 g004bData 04 00008 g004c
Figure 5. Mean daily profiles of cluster’s NPM population mobility patterns on working days.
Data 04 00008 g005
Figure 6. Maps of NPM population mobility time-patterns of the studied area. Whole domain (upper figure) and zoom over the metropolitan area of Rome (bottom figure). Colors correspond to the clusters of population mobility time-patterns shown in Figure 5. Black, green, and yellow lines delimit local municipalities, green traffic zone, and limited traffic zone of Rome, respectively.
Data 04 00008 g006
Figure 7. Whisker box-plot of the mean normalized age population distributions of the Municipality of Rome obtained from the mobile phone Demographic dataset by cluster. Colors correspond to the clusters of NPM population mobility time-patterns shown in Figure 5.
Data 04 00008 g007
Figure 8. Whisker box-plot of the maximum difference mobile and census cumulative distribution functions (CDFs) by clusters for the Municipality of Rome. Colors correspond to the clusters of population mobility patterns shown in Figure 2.
Data 04 00008 g008
Figure 9. Total early morning NPM vs. number of employees per 100 inhabitants for the city of Rome and its surroundings. Bars represent the value of one standard deviation within each class of employees.
Data 04 00008 g009
Figure 10. Average number of employees per 100 inhabitants in the city of Rome by economical macrocategories and by city areas exhibiting similar NPM population mobility time-pattern (cluster). Colors correspond to clustered NPM population mobility patterns shown in Figure 5.
Data 04 00008 g010
Table 1. Comparison of population derived from mobile phone traffic and census data.
Census 2011 Updated 2015Mobile Phone Traffic Based PopulationCoverage [%]
Rome and northern Latina provinces4.46 × 1061.77 × 10639.6
Demography of Rome Municipality
<185.17.6
18–3011.110.1
31–4016.213.2
41–5019.723.0
51–6015.621.1
>6032.425.0
Table 2. Amount of population (%) involved in province–municipality morning commuting during workdays based on 2011 Census data for the city of Rome.
Exit TimeTrip Duration
<7:157:15–8:158:15–9:14>9:15<15 min16–30 min31–60 min>60 min
Rome30.544.217.77.728.428.629.513.5
Table 3. Fractions of resident population moving daily in the Province of Rome based on census data.
Population Moving within the Municipality of Residence [%]Population Moving out the Municipality of Residence [%]
Province of Rome40.09.5
Province of Rome out of Rome’s Municipality25.223.3
Municipality of Rome48.02.4
Table 4. Clusters of NPM mobility patterns and the correspondent amount of member cells.
ClusterLand UseNumber of Cells
cluster-1Medium density commercial and services areas114 (12%)
cluster-2Low density commercial and services areas154 (17%)
cluster-3High density commercial and services areas50 (5%)
cluster-4High density business & services areas28 (3%)
cluster-5Residential & rural areas332 (36%)
cluster-6Touristic & commercial areas21 (2%)
cluster-7Residential areas228 (25%)
Table 5. Comparison of total mean early morning (06:00–11:00) NPM mobility with mean densities of residential and workplace (production, commercial, and services) buildings by cluster.
ClusterTotal Mean Early Morning NPM MobilityMean Number of Residential Buildings per km2Mean Number of Workplace Buildings per km2Residential to Workplace Buildings Ratio
cluster-7−5.59251.8244.465.66
cluster-5−2.49152.4134.324.44
cluster-21.74135.3945.612.97
cluster-16.14197.5989.532.21
cluster-312.95305.15152.342.00
cluster-621.54250.00224.211.12
cluster-424.07195.50193.351.01

