The Importance of Measuring Students’ Opinions and Attitudes


Abstract
:
1. Summary
2. Data Description
- Practical case 1: mass and energy balances (5 points; no pass mark).
- Practical case 2: reaction kinetics (5 points; no pass mark).
- Lab report in groups. Each group of four students attends the labs together and does a joint report on four of the following six experiments (10 points; 40% pass mark): (1) kinetics (ethyl acetate saponification), (2) catalyst preparation, (3) rheology, (4) determination of effective diffusion coefficients, (5) mass balances (Maple software by Maplesoft; Maple 14 version), and (6) energy balances (Maple software).
- Individual lab exam (10 points; 40% pass mark).
- Midterm Exam 1: Part 1, lessons 1, 2 and 3 (15 points; no pass mark).
- Midterm Exam 2: Part 2, lessons 4 and 5 (15 points; no pass mark).
- Final exam: consisting of two exams analogous to the midterms (20 points each part; 40% pass mark each exam).
 R is carried out in the liquid phase. The starting mixture has a concentration of 0.5 mol A/L, with no R. The equilibrium conversion is of 66.7%, and a conversion of 33.3% is reached in 8 min. Obtain the kinetic equation.
3. Methods
Funding
Acknowledgments
Conflicts of Interest
References
- Marzano, R.J. A Different Kind of Classroom: Teaching with Dimensions of Learning; Association for Supervision and Curriculum Development: Alexandria, VA, USA, 1992; ISBN 0871201925. [Google Scholar]
- Sanz-Pérez, E.S. Students’ performance and perceptions on continuous assessment. Redefining a chemical engineering subject in the European higher education area. Educ. Chem. Eng. 2019. [Google Scholar] [CrossRef]
- Sanz-Pérez, E.S. Survey on students’ Performance and Perceptions on Continuous Assessment 2018. Available online: https://data.mendeley.com/datasets/c7hdf4jpyn/2 10.17632/c7hdf4jpyn.3 (accessed on 18 March 2019).
- Online Surveys. Tool for Creating Surveys. Available online: https://www.e-encuesta.com/ (accessed on 19 November 2018).
- R Core Team. R: A Language and Environment for Statistical Computing; R Foundation for Statistical Computing: Vienna, Austria, 2017. [Google Scholar]
- Bryer, J.; Speerschneider, K. jbryer/likert: Analysis and Visualization Likert Items 2017. Available online: https://github.com/jbryer/likert (accessed on 16 August 2017).
- Lüdecke, D. sjPlot: Data Visualization for Statistics in Social Science 2017. Available online: https://strengejacke.github.io/sjPlot/ (accessed on 16 August 2017).

| Year | Exam | Phase Equilibria | Mass Balances | Energy Balances | |||||
|---|---|---|---|---|---|---|---|---|---|
| Liquid-Gas Eq. | Gas Solubility | Liquid-Liquid Eq. | w/o Chemical Reaction | w/ Chemical Reaction | w/ Chemical Reaction | w/ Phase Change | Combined Balances (Mass & Energy) | ||
| 1 | Midterm 1 | 2 | 4 | 4 | |||||
| Final 1 | 2 | 4 | 4 | ||||||
| Final 1.2 | 2 | 4 | 4 | ||||||
| 2 | Midterm 1 | 2 | 4 | 4 | |||||
| Final 1 | 2 | 4 | 4 | ||||||
| Final 1.2 | 2 | 4 | 4 | ||||||
| Year | Exam | Transport Phenomena | Kinetics and Catalysis | ||||||
| Momentum | Energy | Mass | Classical Kinetics | Enzimatic Kinetics | Catalysis | Reactors | |||
| 1 | Midterm 2 | 2 | 2 + 2 | 1.5 | 1.5 | 1 | |||
| Final 2 | 3 | 1.5 + 2 | 1.5 | 2 | |||||
| Final 2.2 | 1 | 3 | 3 + 1.5 | 1.5 | |||||
| 2 | Midterm 2 | 3 | 2.5 + 0.5 | 1 | 2 | 1 | |||
| Final 2 | 2 | 2 | 1.5 + 1.5 | 3 | |||||
| Final 2.2 | 1 | 1.5 | 2 | 3 + 1.5 | 1 | ||||
| T (°C) | k (cm3/mol·s) |
|---|---|
| 508 | 0.1059 |
| 427 | 0.00310 |
| 393 | 0.000588 |
| 356 | 80.9·10−6 |
| 283 | 0.942·10−6 |
| Number of Item | Question |
|---|---|
| 1 | Age (1) |
| 2 | Gender |
| 3 | Degree studying |
| 4 | How many times have you been enrolled in this subject? (including the present year) |
| 5 | In your opinion, what is the difficulty of your degree as a whole? 1. Very easy 2. Somehow easy 3. Neither easy nor difficult 4. Somehow difficult 5. Very difficult |
| 6 | And what is the difficulty of the “Chemical Engineering” subject? 1. Very easy 2. Somehow easy 3. Neither easy or difficult 4. Somehow difficult 5. Very difficult |
| 7 | How frequently do you attend lessons in this subject? 1. Almost never (0–25%) 2. Sometimes (25–50%) 3. Often (50%) 4. Very often (50–75%) 5. Almost always (75–100%) |
| 8 | When you attend the lessons: how frequently do you take notes? 1. Almost never (0–25%) 2. Sometimes (25–50%) 3. Often (50%) 4. Very often (50–75%) 5. Almost always (75–100%) |
| 9 | After each lesson, hoy frequently do you understand the concepts explained? 1. Almost never (0–25%) 2. Sometimes (25–50%) 3. Often (50%) 4. Very often (50–75%) 5. Almost always (75–100%) |
| 10 | What is the difficulty of the problems solved in class? (2) 1. Very easy 2. Somehow easy 3. Neither easy or difficult 4. Somehow difficult 5. Very difficult |
| 11 | When the teacher uploads problem sheets before solving them in class, how often do you do them before by yourself? 1. Almost never (0–25%) 2. Sometimes (25–50%) 3. Often (50%) 4. Very often (50–75%) 5. Almost always (75–100%) |
| 12 | When the teacher leaves problems unsolved and proposes them as homework, how often do you try to solve them? 1. Almost never (0–25%) 2. Sometimes (25–50%) 3. Often (50%) 4. Very often (50–75%) 5. Almost always (75–100%) |
| 13 | How often do you look for new sources of problems (books, etc.)? 1. Almost never (0–25%) 2. Sometimes (25–50%) 3. Often (50%) 4. Very often (50–75%) 5. Almost always (75–100%) |
| 14 | What are your study habits in this subject? (from continuous day-to-day study to last-minute preparation) 1. I am up to date with work. 2. I study mostly one-two weeks before the exam. 3. I study mostly one-two days before the exam. |
| 15 | What do you think was your own preparation before midterm exams? (2) 1. I did not take the exam. 2. Low 3. Average 4. High 5. Very high |
| 16 | If the existing midterm exams replaced the final exam (exempting-midterms): Would you have prepared more the midterm exams? 1. Yes 2. No |
| 17 | If the existing midterm exams replaced the final exam (exempting-midterms): Do you think the subject would be easier to pass/achieve higher marks? 1. Yes 2. No |
| 18 | What do you think it was your own preparation before final exams? (2) 1. I did not take the exam. 2. Low 3. Average 4. High 5. Very high |
| 19 | In general, do you think that the time given during exams is enough? 1. Strongly disagree 2. Disagree 3. Neither agree nor disagree 4. Agree 5. Strongly agree |
| 20 | What is the difficulty of the problems proposed in the exams? (2) 1. Very easy 2. Somehow easy 3. Neither easy or difficult 4. Somehow difficult 5. Very difficult |
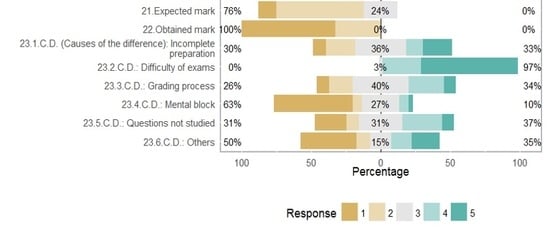
| 21 | According to your performance in this course, what mark did you expect to obtain? 1. Not taken 2. Fail (<50%) 3. Pass (50–69%) 4. Very good (70–89%) 5. Excellent (90–100%) |
| 22 | What mark did you actually obtain? 1. Not taken 2. Fail (<50%) 3. Pass (50–69%) 4. Very good (70–89%) 5. Excellent (90–100%) |
| 23 | If you did not obtain the mark you expected, what are in your opinion the causes of the difference? (more than one answer is accepted) 1. Strongly disagree 2. Disagree 3. Neither agree nor disagree 4. Agree 5. Strongly agree |
| 23.1 | Incomplete preparation (3) |
| 23.2 | Difficulty of exams |
| 23.3 | Severe grading process |
| 23.4 | Mental block during the exam |
| 23.5 | Some questions of the exam covered concepts that I did not control completely (3) |
| 23.6 | Others |
| 24 | Do you have any other comment? Evaluation method, course development, etc. (4) |
| Item | Variable | Numerical Coding |
|---|---|---|
| 2 | Gender | 0 if man; 1 if woman |
| 3 | Degree (1) | 1 if Energy Engineering (E1); 2 if Energy Engineering-Industrial Engineering (E2); 3 if Energy Engineering-Environmental Engineering (E3) |
| 11–13 | Problems done by students | Sum of responses given to items 11 to 13, each one in a 1–5 Likert scale |
| 16 | More preparation in exempting midterms | 0 if no; 1 if yes |
| 17 | Subject easier with exempting midterms | 0 if no; 1 if yes |
| DIF | Differences between expected and obtained marks | 0 if marks have no difference; 1 if they are different |
| Respondent | Answers | Coding |
|---|---|---|
| 2 | In my opinion the difficulty of mass and energy problems in the exams did not correspond to the level developed during the classes; the latter was much lower. | C1.2, C3.1 |
| 3 | I would require a minimum pass mark in the exams of each part of the subject. 1 | C4.4, C5 |
| 4 | It would be appreciated if the class exercises were in line with those of the exam, thus allowing us to apply what was studied. | C2 |
| 4 | We did not receive exercises from the teacher to practice at home.2 | C7 |
| 5 | It would be okay for class exercises to match those done in class.3 | C1.2 |
| 5 | It would also be good if the problems of the first part were sent earlier. | C3.1 |
| 6 | More teaching hours to do more problems and seminars. | C4.1 |
| 6 | Exams with similar level to the class. | C1.1 |
| 6 | Multimedia or visual resources of the most complicated concepts. | C2.2 |
| 10 | It would be interesting to do exercises in class similar to those that are going to come up in the exam, since the class exercises were very easy compared to those in the exam. | C1.2 |
| 10 | Regarding transport phenomena and kinetics it would be better to have some slides, since taking notes at high speed makes it difficult to write down all the information and it is difficult to study for the exams. | C3.2, C4.1 |
| 10 | Finally, regarding the midterm exams, there was not enough time to do them because exercises were very long or time too little to do them. I hope this serves to improve the subject. | C4.3 |
| 11 | In my opinion, the knowledge acquired during the classes of this subject should be similar to that required in the tests. The problems solved throughout the course should also be similar to those in the exam. | C1.2 |
| 12 | I believe that a high level of demand by the teachers is positive for our academic formation provided we have the tools to meet these demands. I mean that there should be more class hours, since there are more lessons than in other courses. | C4.1 |
| 12 | More materials should be provided to the student, like having additional exam-type problems. | C2.1 |
| 12 | For me, one of the biggest difficulties has been the difference of level in class problems compared to exams. | C1.2 |
| 12 | The lab exam should be sat after the lab reports are corrected, just in case someone did not know how to do something. | C4.1 |
| 12 | Finally, I appreciate initiatives like this survey to facilitate and encourage students to give their opinion. | - |
| 13 | Especially referring to the last question,4 I think it would be better to have more problems with final solutions to practice. Since there are not many solved problems, in the end, you learn them by heart, not reasoning. Thus, it would be very positive having many more problems with which to practice, especially problems of similar difficulty to those of the exam. | C2.1 |
| 14 | I think it would be very useful to do more complex problems in class. | C1.2, C2.1 |
| 15 | This course covers many topics, and there is not time enough to go through them as it should be done. | C4.1 |
| 15 | If in the examination there are exercises of a certain level, that level should be acquired with the problems proposed in class. | C1.2 |
| 15 | The laboratory practices seemed very unproductive, very fast, poorly explained... an overall low performance. | C6 |
| 15 | The evaluation criteria seem correct to me, although I do not understand how a person can fail a subject so diverse only by not reaching a minimum pass mark in the lab exam (worth 10% of the points), and, even more, as I said before, with the low performance of the labs. | C4.4 |
| 16 | The content of the subject should be reduced, since it is excessive for 4 months of class. | C4.1 |
| 16 | Another important point is to finish completely the class exercises, since leaving some halfway-unresolved does not help the student to solve them during exams. | C4.2 |
| 16 | Exam exercises should be similar to those done in class. In the exams, the exercises are of an exaggeratedly higher level to those solved in class. | C1.2 |
| 16 | The lab exam should be deleted, since practices have already been passed (lab reports), they should not be reassessed. | C4.4 |
| 17 | It would be appropriate for the theory explained and the problems solved to match in both content and difficulty those of the exams. | C1.2 |
| 17 | I would be grateful if the standard-exercises for better preparation of the exam were uploaded even earlier. | C4.2 |
| 19 | The problem I have seen in this subject is that the problems of exams were much more difficult than the ones solved in class and therefore it was very difficult to solve them in the short time given. In my opinion, the classes teach you things that are too basic, but since there are many lessons, it is impossible to teach them in depth. | C1.2 |
| 19 | This subject should be divided into two courses because, otherwise, it is impossible to acquire the knowledge that will be applied in the future. I had a hard time trying to understand the enzymatic catalysis part, at least the problems, although I am aware that is not very important for my degree. | C4.1 |
| 20 | I believe that it is very necessary to insist to the students in the resolution of exercises additional to those given by the teacher of the subject. | C4.1 |
| 20 | In addition, the teacher should give us bibliographic sources to obtain problems that allow us to prepare exercises of the same difficulty as those found in the exams, since there is a great difference between the class problems and those of the exams. | C1.2, C2.1 |
| 20 | In my opinion, I believe that this is the main problem with the marks, in addition to the little time available to teach an extensive and complex subject like this one. Best regards. | C4.1 |
| 21 | It would be appreciated if the notes of all the lessons were uploaded to the course app. It would facilitate taking additional notes, just expanding the ones already received. | C4.1 |
| 23 | It is necessary to spend more class time doing exercises. | C4.1 |
| 25 | To dedicate more hours to the second part of the subject than to the first one, due to the greater complexity of the second. To do more exercises. | C3.2, C4.1 |
| 26 | Try to make exercises of the exams and those given in class more similar, since the difficulty is very different between them. | C1.2 |
| 27 | I think it would be necessary to do more problems in class, since the ones done this year are not enough to prepare the subject well. | C2.1 |
| 28 | To deepen less in chemical kinetics and more in other lessons like transport phenomena or energy balances. | C4.1 |
| 30 | Exam exercises should be more similar to those done in class. In my opinion, they are much more difficult in the exams. | C1.2 |
| 31 | I think that one of the problems of the subject is that little time is dedicated to do problems with an “exam” level of difficulty. | C1.2 |
| 32 | I would sincerely like to do exam-like exercises in class, because in my opinion, they are completely different and we left the exam with the feeling of being teased. | C1.2 |
| 33 | To improve the notes of the subject, I suggest uploading explanatory slides for all the lessons instead of making us take notes. Besides, some interesting points are: | C4.1 |
| 33 | -To do more exercises in class or in seminars including exam-type exercises, that is, of similar difficulty as those of written tests. | C1.2, C4.1 |
| 33 | -To give longer than one week to do the lab reports in order to be able to better assimilate the concepts and to perform them as best as possible. Doing a better job in the reports would increase our mark in the lab reports and also in the lab exam. | C4.1 |
| 35 | I think we should do more exercises in class, or at least we should be given more exercise sheets including the results. | C2.1 |
| 36 | The difficulty I have noticed is that the level of the exercises performed in class does not correspond to the level required in the examination, with the latter being much more difficult and complicated. If exercises that are more complex were performed in the classroom, this would greatly facilitate our learning. | C1.2 |
| 37 | It would be important to follow less the teaching guide and the lessons that are supposed to be taught, and more the development of the class with respect to the subject. | - |
| 38 | Explain better the lesson on kinetics, both the theory and the most complex problems. | C3.2 |
| 40 | Make basic concepts clearer before dealing with long theory lessons. | C4.1 |
| 42 | I would like the exercises-exam dynamic not to be like that of the 2012/13 course, i.e., the difficulty of the exercises solved by the teacher in class was simple and that of the exams very high. | C1.2 |
| 45 | The difficulty of the problems in the exams is much superior to those done in class. | C1.2 |
© 2019 by the author. Licensee MDPI, Basel, Switzerland. This article is an open access article distributed under the terms and conditions of the Creative Commons Attribution (CC BY) license (http://creativecommons.org/licenses/by/4.0/).
Share and Cite
Sanz-Pérez, E.S. The Importance of Measuring Students’ Opinions and Attitudes. Data 2019, 4, 43. https://doi.org/10.3390/data4010043
Sanz-Pérez ES. The Importance of Measuring Students’ Opinions and Attitudes. Data. 2019; 4(1):43. https://doi.org/10.3390/data4010043
Chicago/Turabian StyleSanz-Pérez, E. S. 2019. "The Importance of Measuring Students’ Opinions and Attitudes" Data 4, no. 1: 43. https://doi.org/10.3390/data4010043
APA StyleSanz-Pérez, E. S. (2019). The Importance of Measuring Students’ Opinions and Attitudes. Data, 4(1), 43. https://doi.org/10.3390/data4010043