Data Descriptor

Graphing Ecotoxicology: The MAGIC Graph for Linking Environmental Data on Chemicals

1
Institute for Environmental Sciences, University of Koblenz-Landau, D-76829 Landau, Germany
2
Eusserthal Ecosystem Research Station, University of Koblenz-Landau, D-76857 Eusserthal, Germany
*
Author to whom correspondence should be addressed.
Submission received: 29 December 2018 / Revised: 15 February 2019 / Accepted: 19 February 2019 / Published: 22 February 2019

Abstract

:
Assessing the impact of chemicals on the environment and addressing subsequent issues are two central challenges to their safe use. Environmental data are continuously expanding, requiring flexible, scalable, and extendable data management solutions that can harmonize multiple data sources with potentially differing nomenclatures or levels of specificity. Here, we present the methodological steps taken to construct a rule-based labeled property graph database, the “Meta-analysis of the Global Impact of Chemicals” (MAGIC) graph, for potential environmental impact chemicals (PEIC) and its subsequent application harmonizing multiple large-scale databases. The resulting data encompass 16,739 unique PEICs attributed to their corresponding chemical class, stereo-chemical information, valid synonyms, use types, unique identifiers (e.g., Chemical Abstract Service registry number CAS RN), and others. These data provide researchers with additional chemical information for a large amount of PEICs and can also be publicly accessed using a web interface. Our analysis has shown that data harmonization can increase up to 98% when using the MAGIC graph approach compared to relational data systems for datasets with different nomenclatures. The graph database system and its data appear more suitable for large-scale analysis where traditional (i.e., relational) data systems are reaching conceptional limitations.
Dataset: The dataset can be found in Supplementary Materials, www.mdpi.com/xxx/s1.
Dataset License: CC-BY-SA

1. Summary

The primary concern of ecotoxicology is the impact of chemicals on the environment [1]. To assess this impact at a large-scale, i.e., continental or global context, data of environmental concentrations, effects, use types or application rates have to be incorporated into a consistent structure. Today, science can rely on numerous databases providing these data (Table 1) for potential environmental impact chemicals (PEICs, e.g., pesticides, industrial chemicals, flame retardants, and solvents). However, the process of linking them takes significant harmonization efforts, even after a common semantic framework has been established, i.e., even after their integration into a coherent base. Among the most fundamental reasons hindering instant data linkage and affecting dimensions of the ecotoxicological data are differing nomenclatures and differing levels of specificity (see Table 2 for examples). For instance, when linking data spatially, some problems typically arise around issues of specificity, i.e., data present at different spatial scales or resolutions, while linking data within chemical dimension is often impeded by the usage of different nomenclatures. For ecotoxicology, however, the specific interest lies in the chemical dimension, as it applies to all core data (Table 1).
The usage of different nomenclatures is a well-known issue in chemistry [7,8]. Although a chemical compound is defined by its molecular structure, there is no exclusive convention for naming or identifying it. Instead, there are many concurring schemes based on two different approaches: naming chemicals based on their molecular structure (International Chemical Identifier (InChI) and Simplified Molecular Input Line Entry Specification (SMILES) [7,9]) or assigning arbitrary, yet unique, identifiers to them (e.g., Chemical Abstract Services registry number (CAS RN) and Distributed Structure-Searchable Toxicity substance identifier (DTXSID) [10,11]). In addition, many chemicals, such as pesticides, also have various other names (e.g., trivial, brand, and formulation names) that may also differ among languages (Table 2). The co-existence of these naming schemes results in a high number of synonyms making nomenclature an important issue, particularly when linking larger datasets. This issue further aggravates in analyses that operate in a trans-national or global context, consider many PEICs and require harmonizing many different data sources.
Differing data specificity is also an issue when linking chemical data. Measured environmental concentrations or effect endpoints may be provided in different databases specifically for any kind of isomers, including data specific to enantiomers or diastereomers, or at the level of unique compound structures, ignoring stereo-compositions and, thus, including isomeric and racemic mixtures. Differing specificity, if not addressed, substantially hinders the integration of data from different sources for some of the ecotoxicologically most important groups of compounds, e.g., insecticides [12], that may act substantially differently based on their stereo-chemical composition [13].
For analyses that cover only relatively small sets of PEICs, problems of nomenclature and specificity can be handled manually by expert judgment. Knowledge of PEICs thereby allows constructing data analysis workflows that cover all deviations in chemical names and that reasonably span different levels of specificity. Larger analyses that cover several dozens, or more, of PEICs are often based on relational data representations [12]. In the case only two different naming schemes are involved, e.g., if only two data sources are linked, differing identifiers of the same chemical can still be resolved by establishing a synonym table. However, relational database joins are costly, and linking more than two different data sources by joining their chemical identifiers (e.g., chemical name) with synonym tables increases the processing complexity significantly, quickly reaching points where complex data analyses become cumbersome [14]. Moreover, resolving different levels of specificity within and among relational datasets requires sophisticated techniques that entail even more effort to develop and that can hardly be established without significant lack of performance [15]. At least when combining more than two data sourcesa requirement of many ecotoxicological meta-analysesrelational data representations are suboptimal due to their constraints in performance and usability [15,16,17].
Labeled property graph databases represent an effective tool to address the aforementioned issues of extendibility, scalability, and flexibility [14,18,19]. Briefly, a labeled property graph consists of nodes (vertices) that are connected through relationships (directed edges) [19]. Both nodes and relationships can be labeled to distinguish functional roles and can be enriched with properties (see Appendix A for further details). In contrast to relational database systems, the number and type of relationships between entities is, thus, not strictly defined and allows linking information very flexibly [18,20]. This flexibility and the graph’s emphasis on relationships appear well suited for the establishment of a synonym database that can also resolve hierarchical relationships [14,15]. Consequently, over the last years, graph databases have evolved as a technical alternative to the established relational database systems, featuring large-scale business (e.g., logistics, social media, and health management) and scientific applications (e.g., web science and sociology) where relational solutions become unfeasible [21,22]. However, even after an extensive literature review, we could not find any published approach that uses a graph for managing and analyzing data in ecotoxicology.
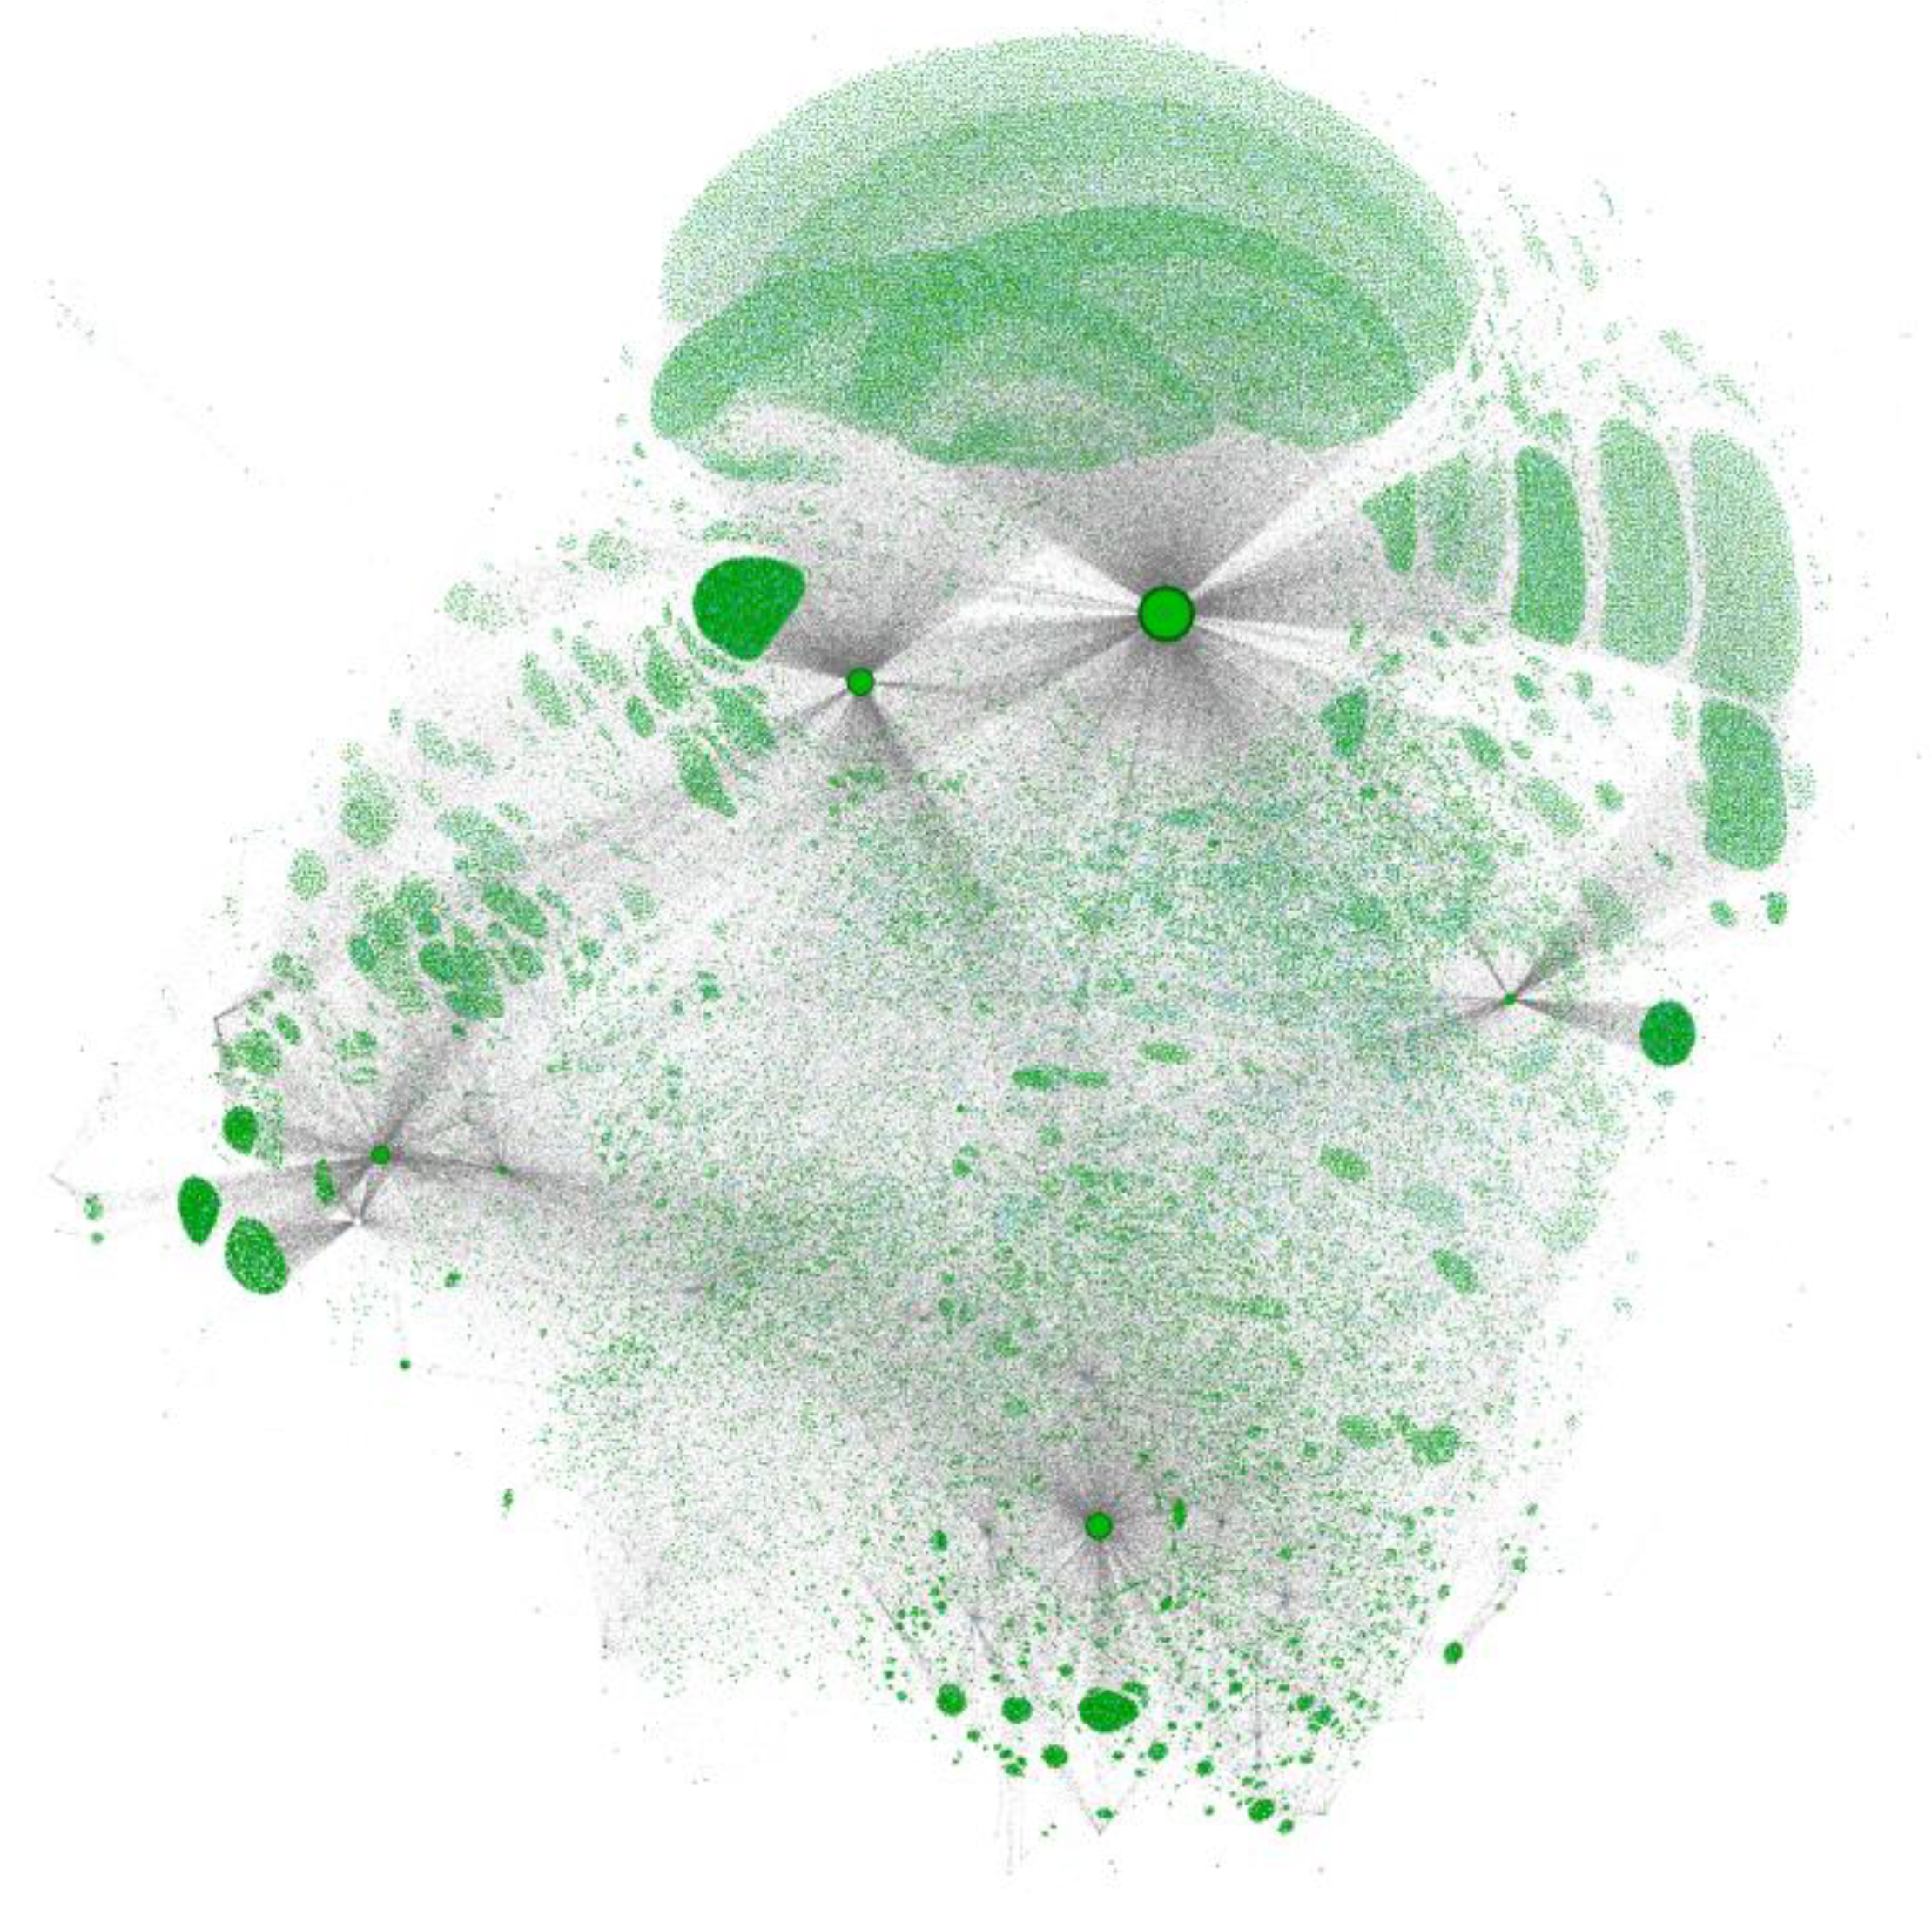
The aim of this study was to assess the usability of graph databases for large-scale ecotoxicological meta-analyses that integrate and link a wide range of relevant data (Table 1) and was conducted by the research group “Meta-Analysis of the Global Impact of Chemicals” (MAGIC). In addition, multiple ecotoxicologically-relevant databases were used to perform a data harmonization, using U.S. EPA Chemical Dashboard (CDDB) [11] as a synonym provider, demonstrating the method’s applicability in a large-scale ecotoxicological scope and quantifying the method’s advantages compared to relational joins. The data were subsequently reprojected into tabular form, granting easy accessibility to researchers and professionals. The Microsoft® Excel worksheet published with this data description summarizes the information that is currently contained in the MAGIC graph in a tabular format, while an up-to-date version of the MAGIC graph can be explored using our website (https://magic.eco; see User Notes). Harmonized data for 16,739 PEICs in the MAGIC graph contain information about unique identifiers (CAS RN and DTXSID), valid synonyms, respective chemical classes, use type classification and their inclusion in various databases.
We are positive that the MAGIC graph can serve as a reliable proof that, with graph databases, one already has a suited data integration tool at hand. With it already being actively integrated in large-scale risk analysis at the national level [23], the MAGIC graph will find further applications and become a central tool in trans-national or global risk analyses in the future (DFG SCHU 2271/6-2). The MAGIC graph is publicly available and will provide a continuously expanding feature set, allowing researchers to take advantage of graph database solutions.

2. Data Description

2.1. Database

The MAGIC graph contains 16,731 PEICs (see Microsoft® Excel worksheet for complete list). For these chemicals, chemical identifiers (n = 66,636) used by relevant datasets (Table 1) are stored and linked to the chemicals they identify. Each chemical has a preferred name for consistent creation of output. Use types and chemical classes, as provided by external datasets, are included in the MAGIC graph and linked with the chemical identifier used by the external dataset. The resulting schema (Figure 1) allows collecting chemical information over multiple databases regardless of the individually used identifiers by navigating the graph (Figure 2). Up-to-date contents of the graph can be retrieved using the website https://magic.eco (also see user notes).

2.2. Summary Microsoft® Excel Worksheet

Published with this data descriptor is a Microsoft® Excel worksheet that summarizes the content of the MAGIC graph. The columns of this worksheet are described in Table 3.

2.3. Database Linkage and Pesticide Use Types

The databases listed in Table 1 were integrated into the MAGIC graph and subsequently analyzed individually regarding the chemical identifiers they contain (Table 4). These databases were selected because they are the most comprehensive resources for large-scale ecotoxicological core data from governmental and non-governmental sources. The MAGIC graph made it possible to evaluate how many of the identifiers used by each dataset actually identified chemicals, and how the identified chemicals were distributed among chemicals with stereo-chemical information and those without. Further, the number of synonymous identifiers within each dataset was identified.
The considered databases vary in the absolute number of chemicals they cover and the proportion of identifiers for chemicals (Table 4). For instance, 35% of WQP identifiers are not categorized as a “chemical”, because they refer to mixtures, physical attributes (e.g., temperature and flow velocity), biological parameters (e.g., algal density and toxicity endpoints) or other, non-chemical information. Lower proportions of chemical identifiers may primarily indicate that the respective database is not only focused on PEICs but also on other entities, such as formulations, mixtures, etc. However, lower proportions may also be a result of low-quality data reporting, such as non-adherence to standardized nomenclature.
The characterization of databases further reveals that PEICs with isomeric information constitute 11–18% of chemicals in all analyzed databases (Table 4). Integration of hierarchical structuring is therefore a graphs’ valuable feature that not only allows for a more detailed differentiation among chemicals but also enables transparent analyses over multiple levels of specificity. Synonym analysis shows that, for instance, in the ECOTOX database, synonymous relationships are rare (n = 28; <0.2%), which underlines the CAS RNs’ suitability as identifiers. Nonetheless, while CAS RNs uniquely identify chemicals, there may be multiple CAS RNs (e.g., CAS RN vs. deprecated CAS RN) referring to the same chemical (e.g., cyfluthrin). This may produce spurious analysis results, if unaddressed. With the MAGIC graph, however, analyses are based on chemicals, instead of identifiers, and all data, related to a chemical, are considered equally, regardless of the chemical identifier used.
We also assessed to what extent the MAGIC graph allows linking more chemicals over the different datasets compared to a relational approach where only same-spelling identifiers were considered linkable (Figure 3). We found that linkage increased only marginally (1–2%) when using the graph in the case both merged databases used CAS RN (see Table 4). This increase, although only small, underlines that, even with CAS RN, nomenclature can be an issue for data linkage. Relational joins using same-spelling names were only successful for 0–63% compared to the graph approach (Figure 3), signifying that joins relying on names are substantially affected by differing nomenclatures. In contrast, the graph approach successfully linked 21–99% of entries. With relational joins, it was impossible to link CAS RN from one dataset and chemical names from another, whereas, with the graph approach, we successfully linked 98% of the data from ECOTOX and FOODTOX, a linkage that depends on using CAS RN and names simultaneously (Table 4). While this case may also be partially resolved using relational joins, prior manual harmonization of chemical identifiers would be required, which is time-intensive, yet unnecessary, when using the graph approach. Figure 3 provides further information, e.g., on fractions for individual database pairs or total linkage of chemical data. In large-scale ecotoxicological assessments, transcending national or continental boundaries, harmonization and subsequent linking of data may become unfeasible, while the MAGIC graph approach can provide better performance and coverage compared to traditional relational joins.
The use types and chemical classes of the PAN database give an example of how data, included in the MAGIC graph, can be used for characterizing datasets: the ECOTOX, FOODTOX and PAN databases cover a broad range of chemicals, including similar proportions of insecticides, herbicides, fungicides and microbiocides (Figure 4). In contrast, the USE dataset shows a higher proportion of insecticides, herbicides and fungicides, and a lower proportion of microbiocides, reflecting its focus on agricultural pesticide applications. Similarly, the WQP contains relatively fewer data of insecticides, herbicides and fungicides, since the number of chemicals being breakdown products (classified as other use type) in this environmental concentration dataset is rather high. The integration of the PAN database use types into the MAGIC graph thus enables an unprecedentedly comprehensive overview of the kind of PEICs that are contained in individual datasets (Figure 4). In addition, the successful data harmonization further demonstrates that ancillary chemical data can be readily incorporated into the MAGIC graph. For instance, supplementing regulatory information (e.g., regulatory status, environmental quality criteria) may now be added with only little effort.

3. Methods

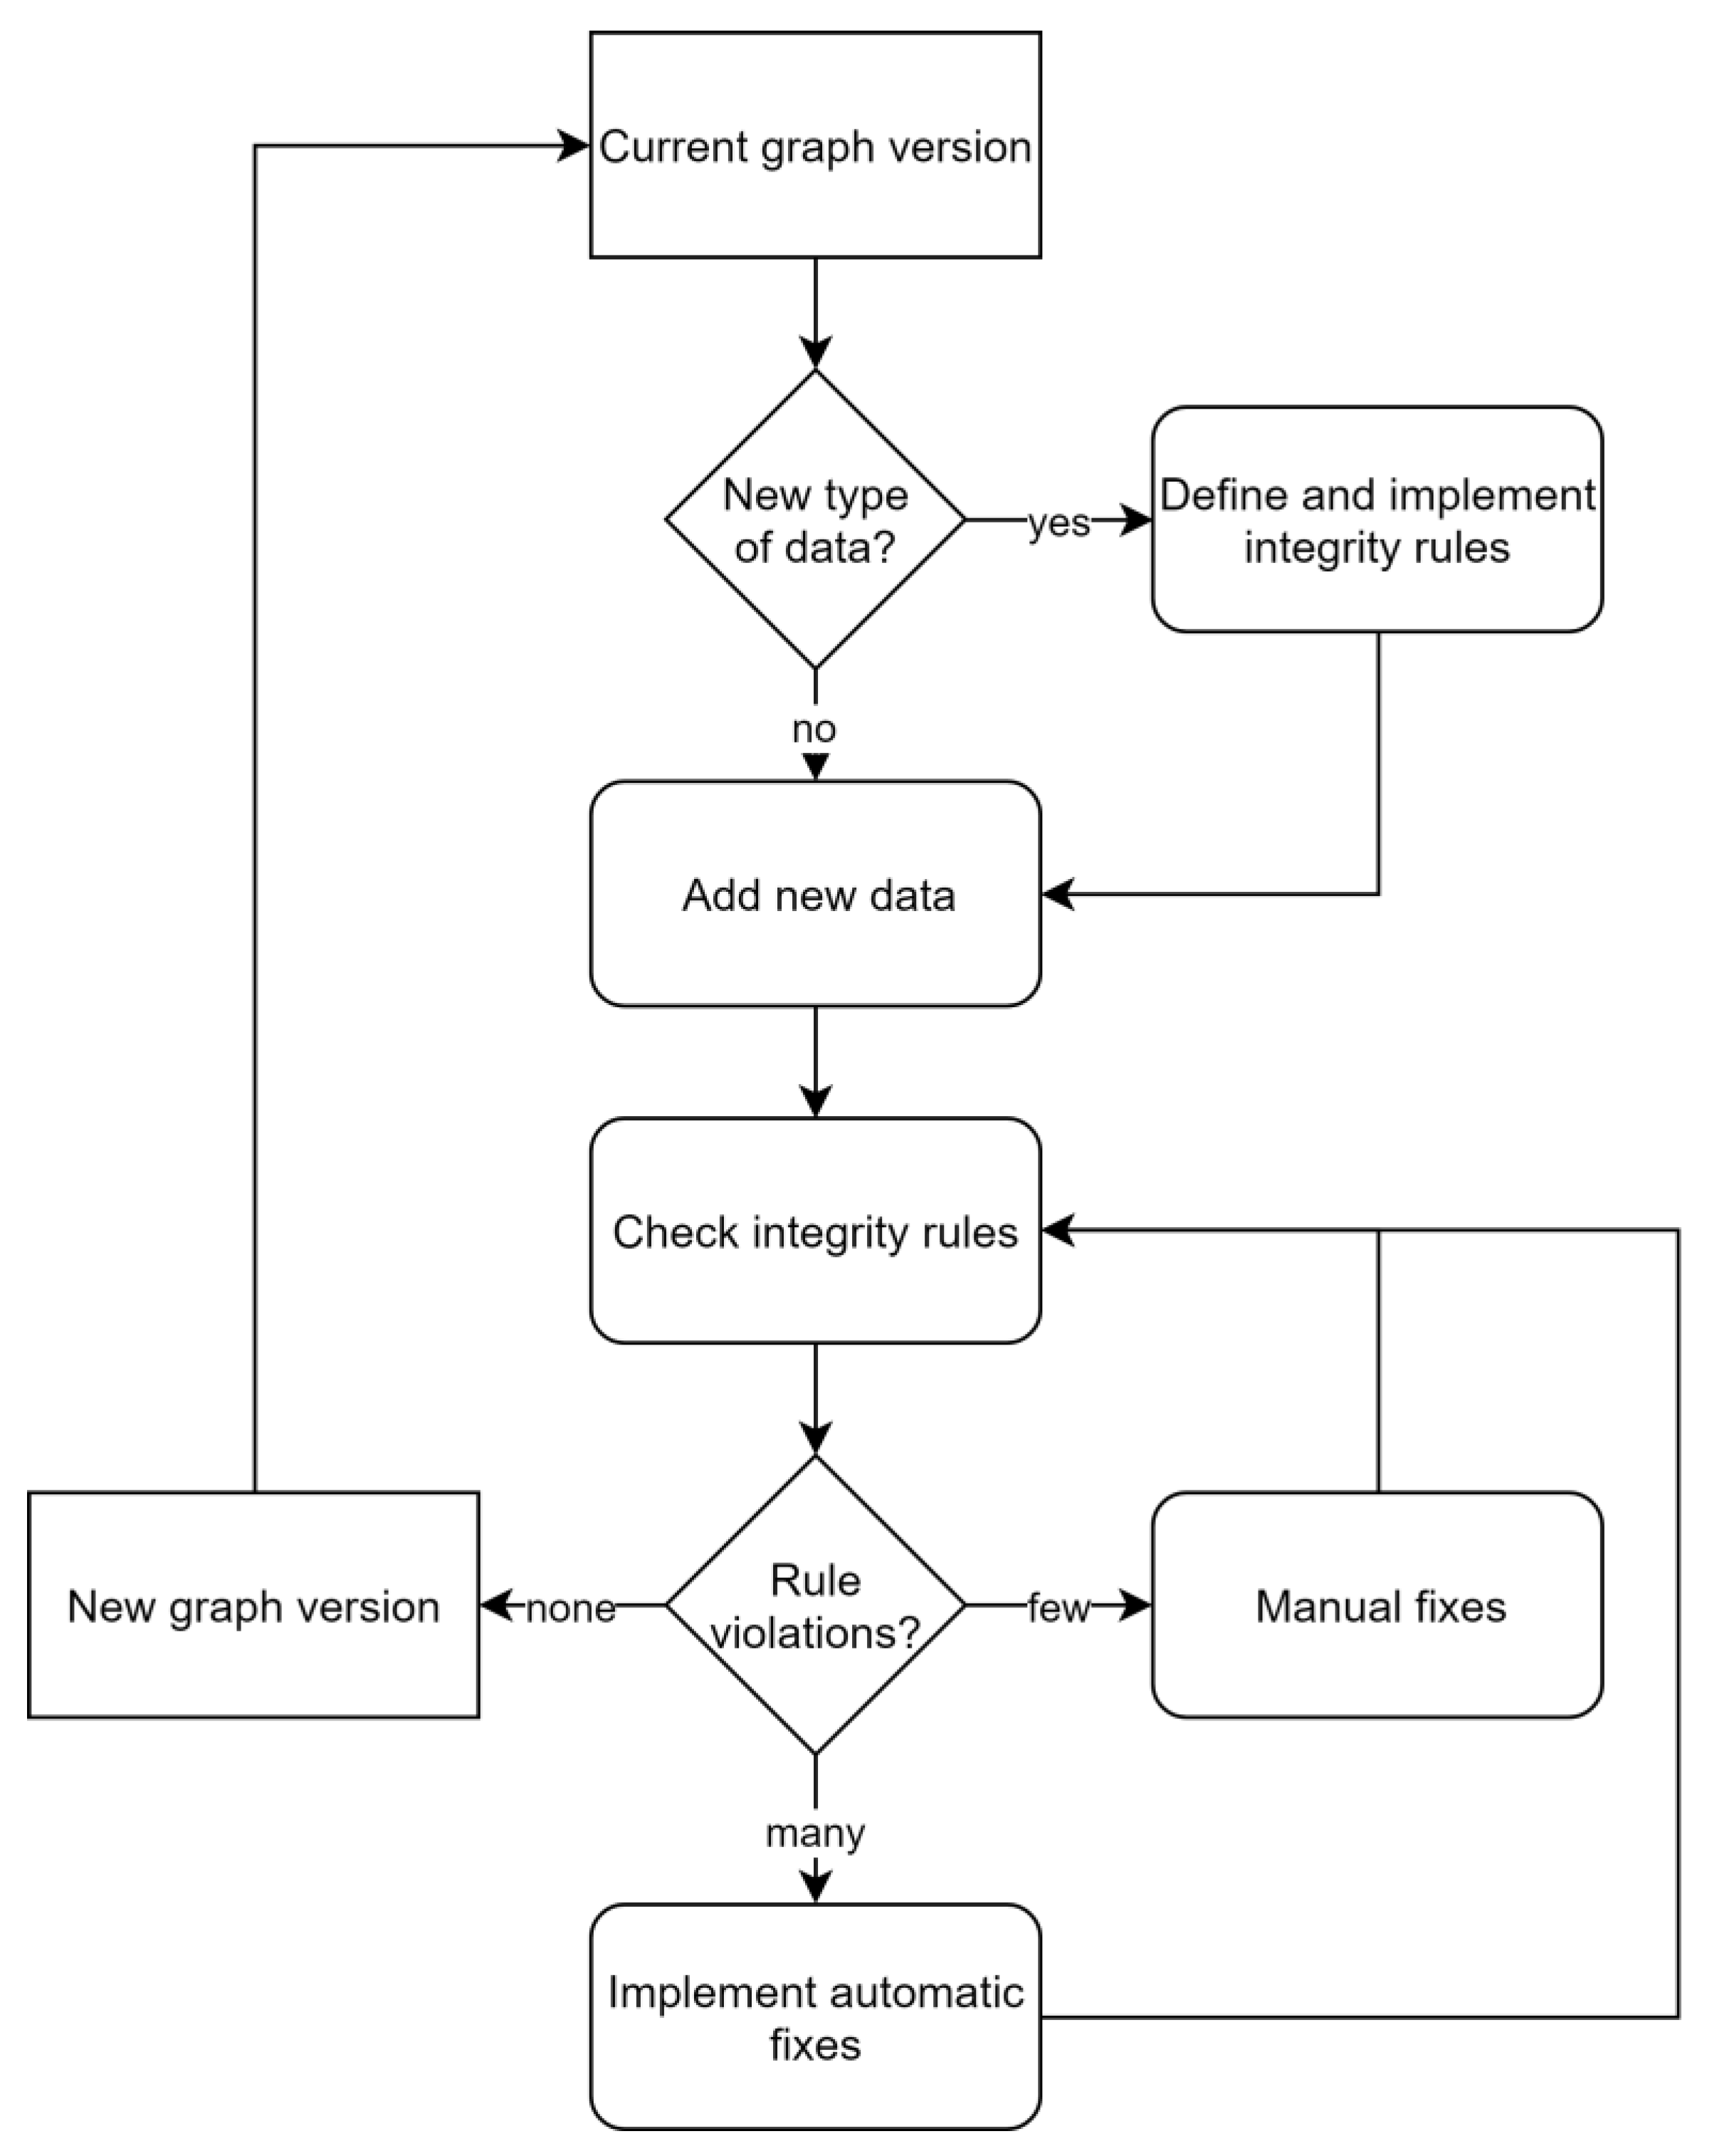
In contrast to relational database management systems, graph databases do not depend on predefined schemata. Briefly, nodes, relationships, labels, types and properties can be added, modified and removed ad hoc and as needed. While this tremendously facilitates the management of changing and growing heterogeneous datasets, it also complicates the usage of these data. Without a static and technically binding schema, the current semantics have to be discovered dynamically: it has to be found what kinds of nodes there are, what properties they have, how nodes are related to other nodes, etc. These concerns were addressed by specifying features of the data model informally outside the database and included semantics of node labels, relationships between nodes and restrictions of properties. To maintain consistency between this specification and the content of the database, as well as safeguard data integrity, 32 rules, checking specific aspects of the data model, were implemented (Appendix B, Table A1). Rules were iteratively formulated by expert judgment whenever new conceptual or technical requirements arose, while it was generally aimed at maintaining a small set of rules. Violations of the rules result in notifications that have to be resolved manually or semi-automatically (Figure 5). This rule-based approach provides a balanced tradeoff between benefits of an agreed schema and flexibility of a graph database. Turning the a priori schema known from relational databases into a posteriori applied consistency rules also resulted in work-flows that resemble those of test-driven developments [24]. For instance, extension of the domain of the graph database application, e.g., by additionally linking taxonomic data to effect data, is achieved in the two following steps. First, one specifies and implements a set of additional rules, e.g., “species and genus are allowed labels”, “an effect must be linked to a species”, “a species belongs to a genus”, etc., and afterwards modifies the database by adding nodes and relationships until all rules are fulfilled. Fulfillment of all rules then marks a new version of the database application that provides additional information.
Initially, six publicly available chemical databases were identified and compared regarding quality of synonyms they provide for an array of organic pesticides (n = 655). After extensive quantity and quality assessments of the generated synonym links, the U.S. EPA Chemical Dashboard [11], containing approximately 765,000 chemical entries, was chosen as a synonym provider (see Appendix C).
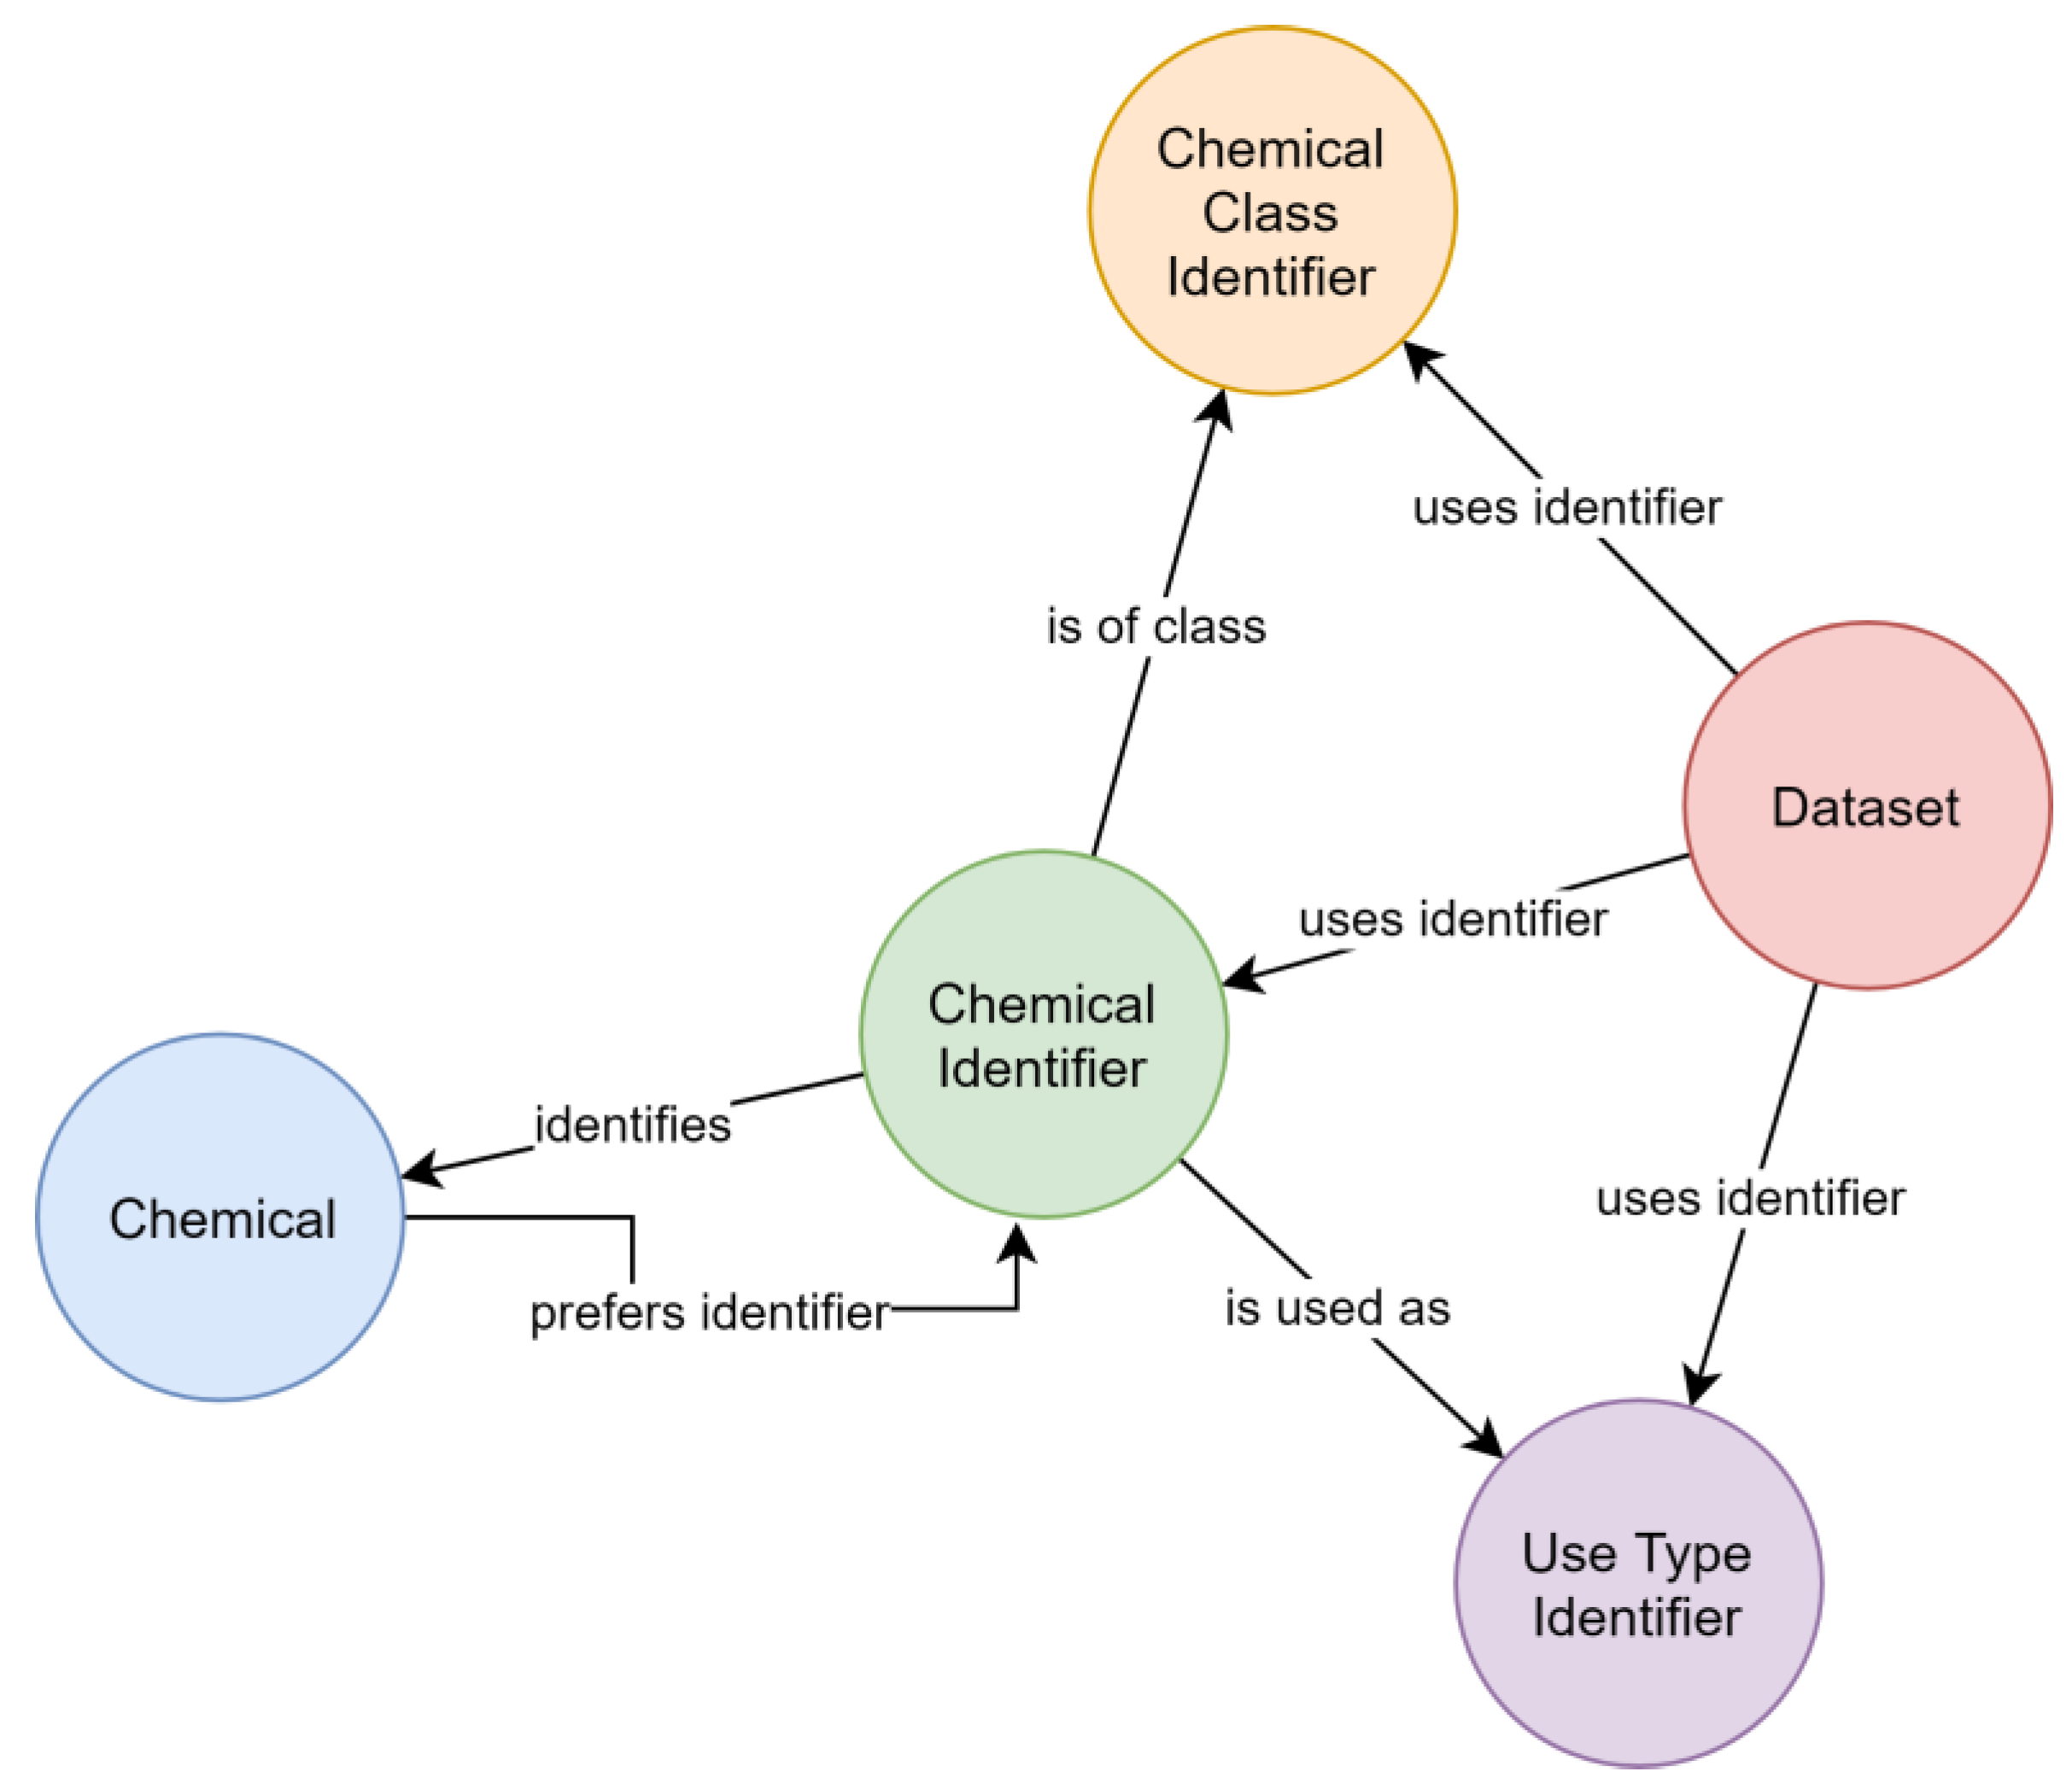
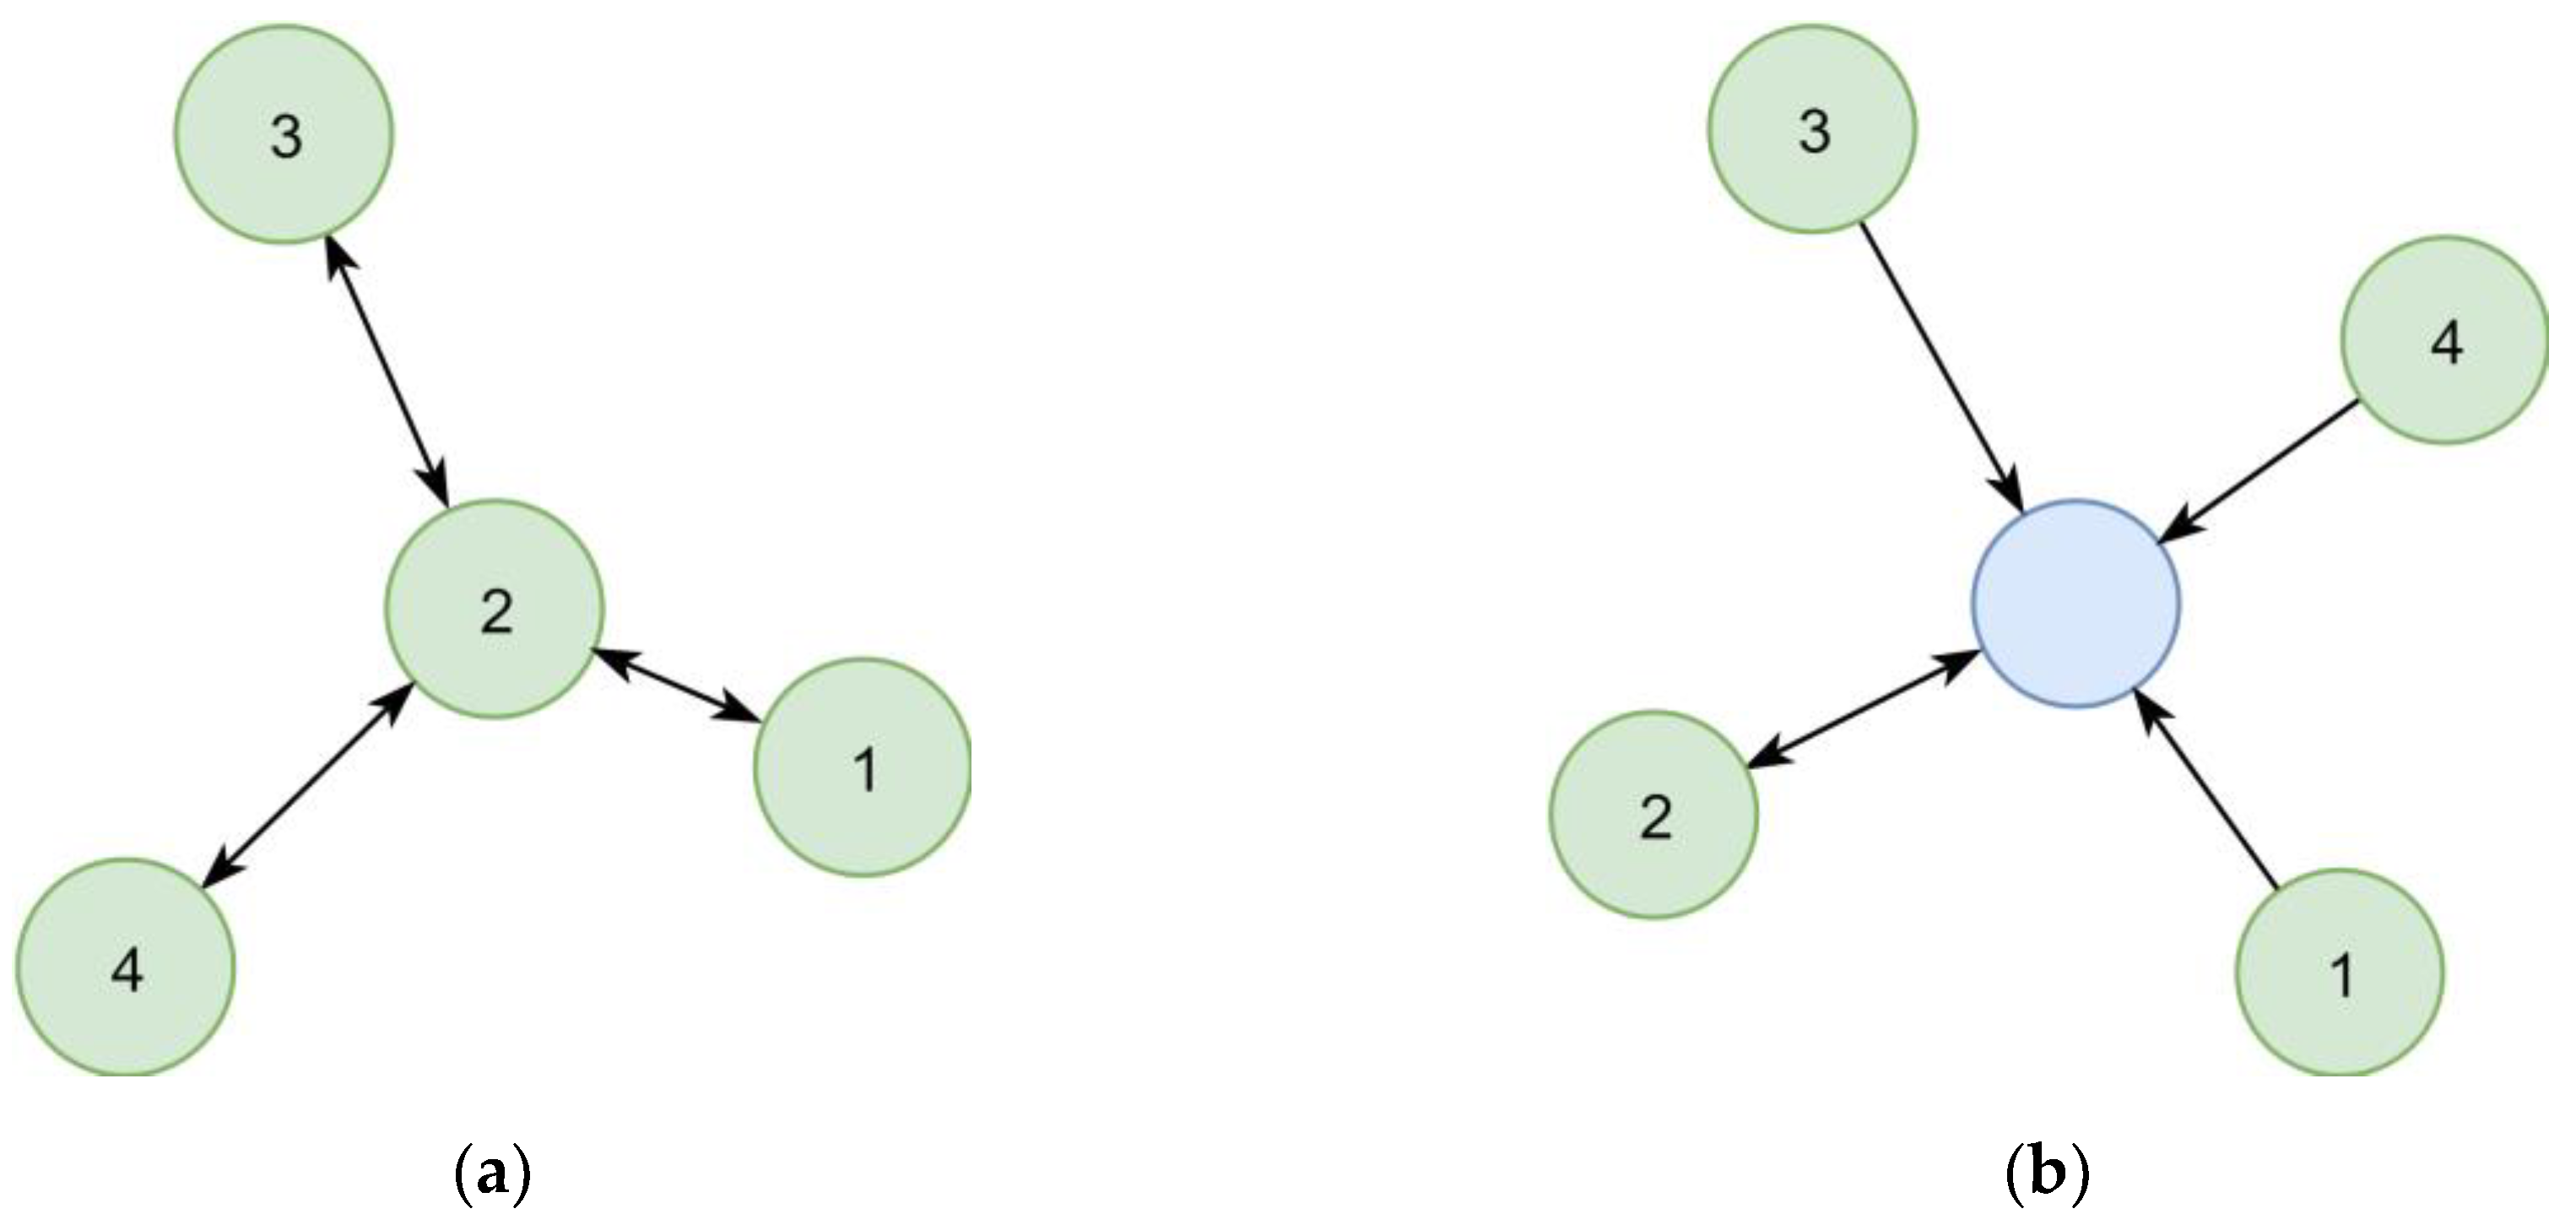
In the first implementation, synonymous chemical identifiers (e.g., substance names) were interlinked directly (Figure 6a). However, following this concept, the number of steps necessary to collect all synonyms of a given identifier varied between queries, which resulted in complex queries. This concept also complicated the estimation of the quality of synonym relationships, as two distant identifiers could be linked over relationships of different certainty. A later refined representation distinguished between the chemical itself and its identifiers (Figure 6b), leading to a representation where the step sequence for collecting all synonyms of a chemical is well defined and only requires two steps. This adjustment improved the computational efficacy, at the same time allowing to add further chemical identifiers without increasing the maximum number of steps required.
Consistency between chemical query results was achieved by attributing each chemical a preferred identifier (used by the CDDB), so that chemicals can be identified in a default way. A descriptive property was attributed to relationships between identifiers and chemicals to reflect the identification type, e.g., CAS RN. Data output for chemicals can, thus, be restricted to specific types of relationships for identifying chemicals.
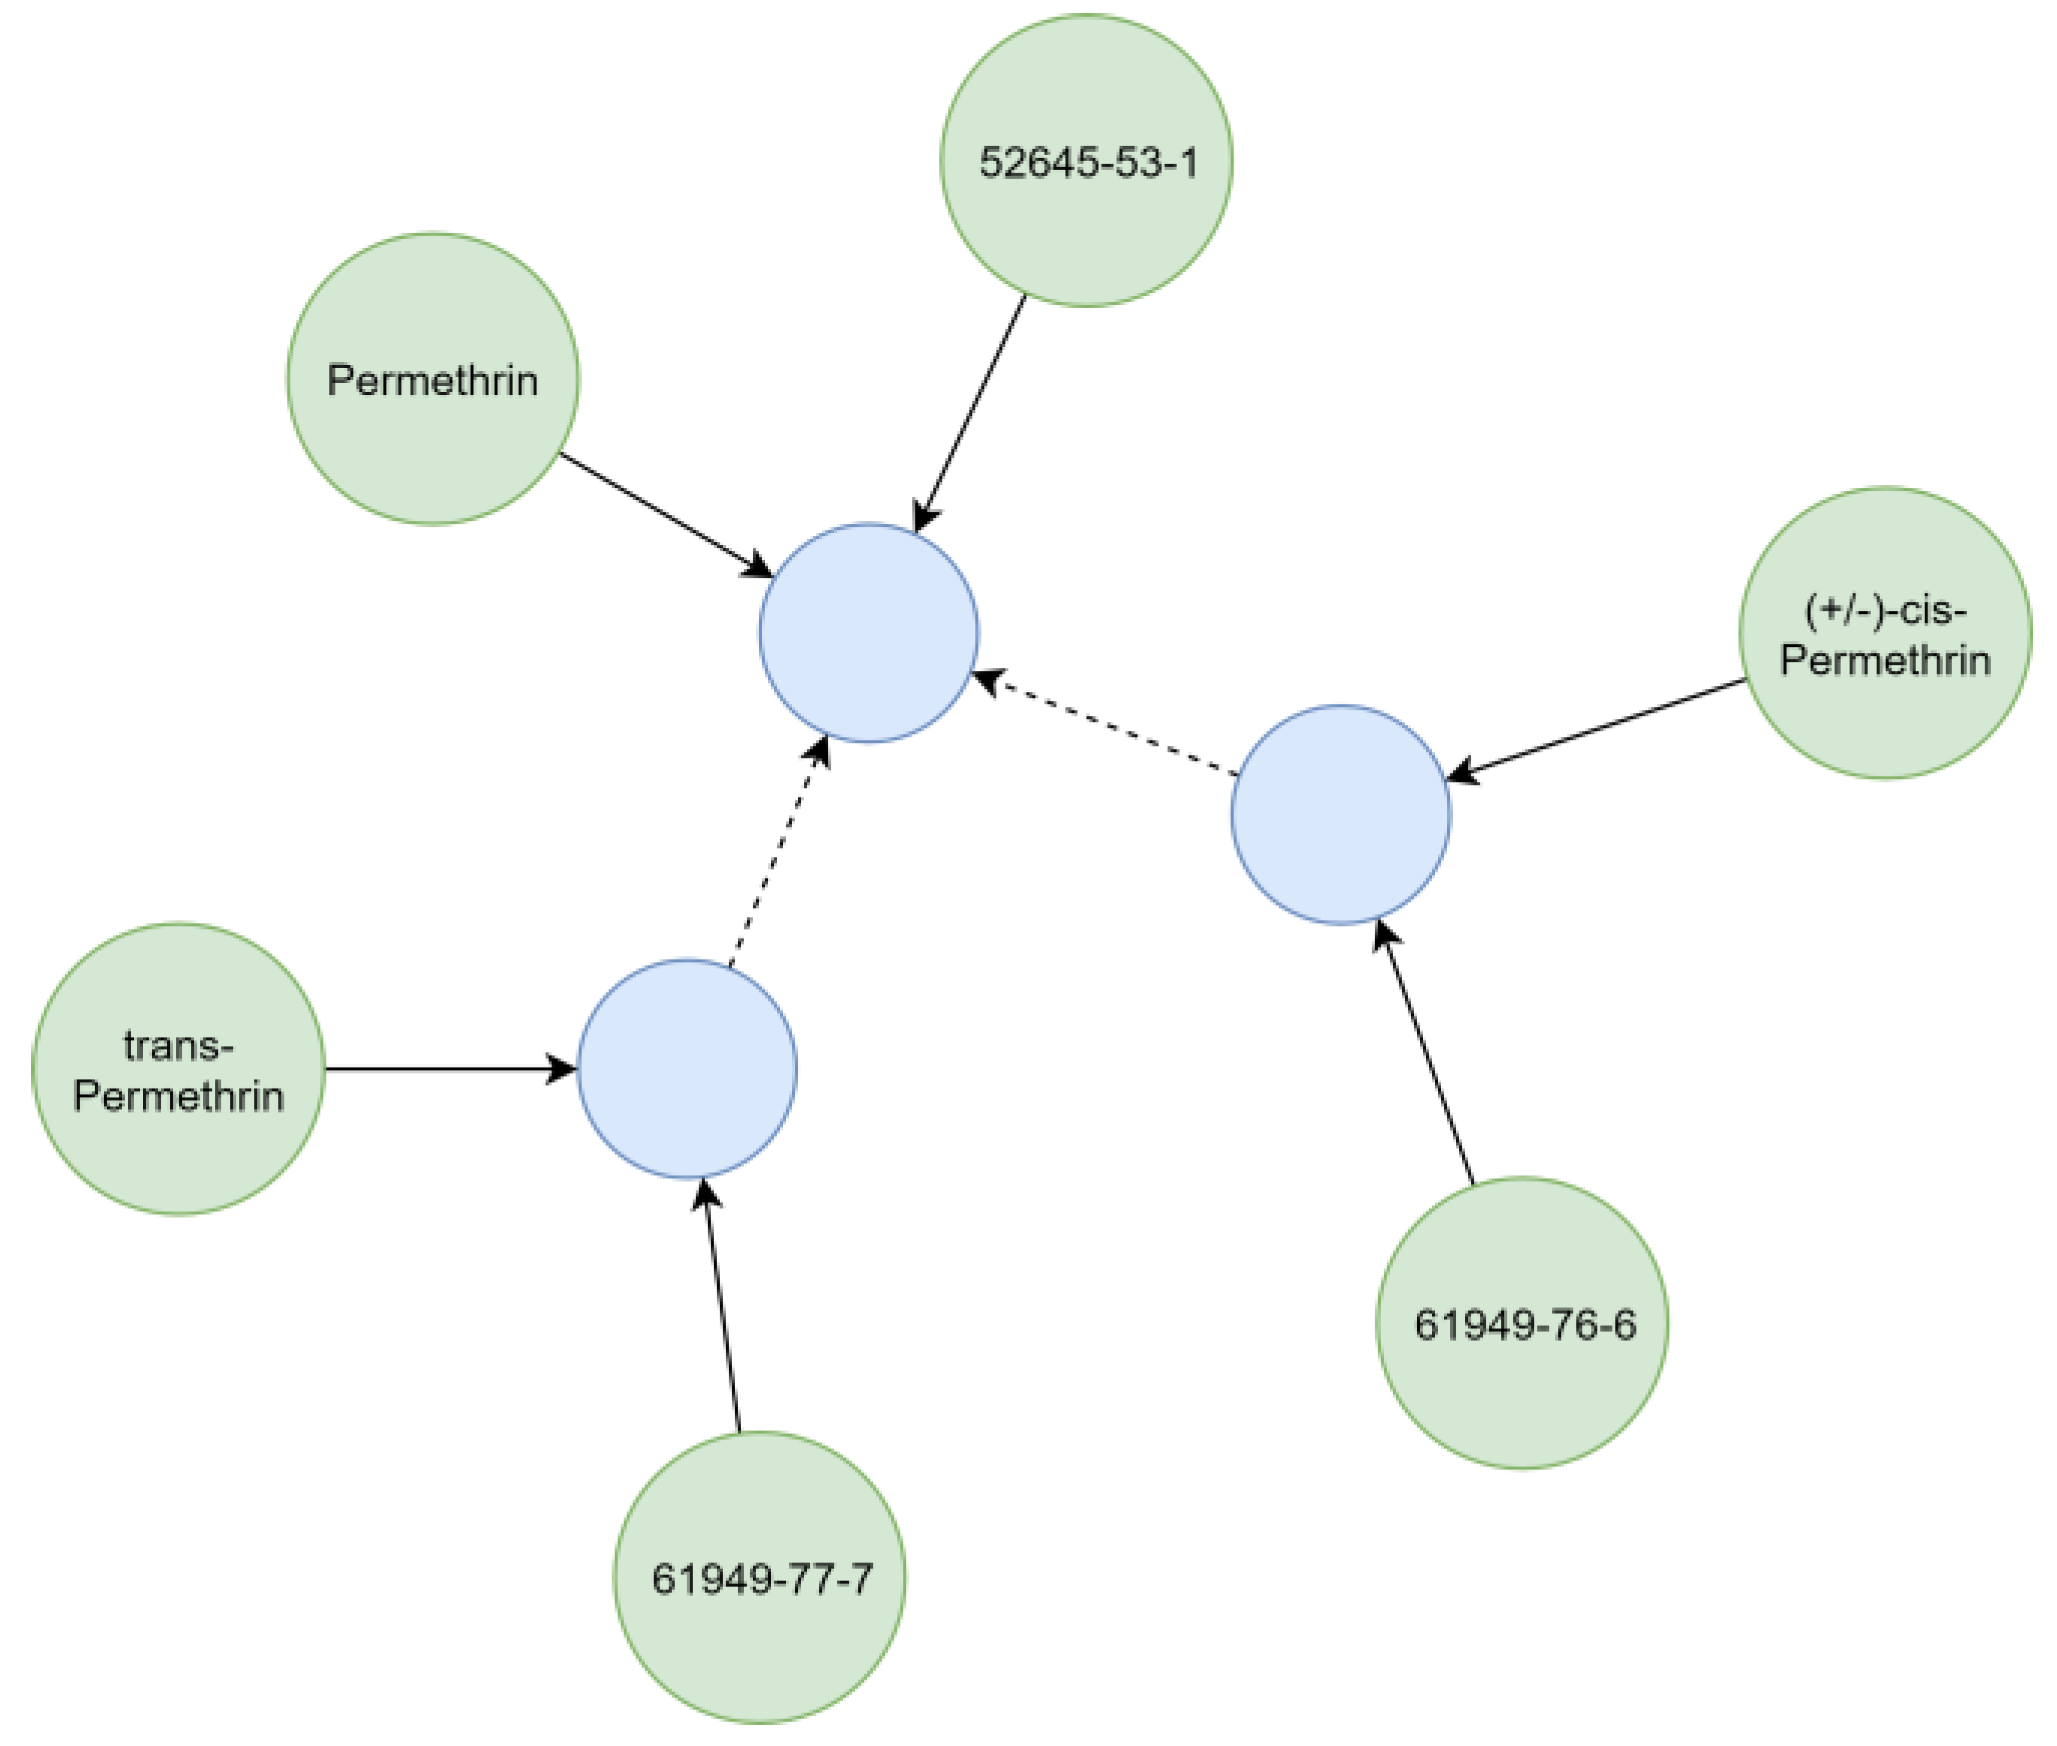
Substances relevant in ecotoxicological contexts can be described by varying detail of specificity (e.g., isomerism), which was addressed by creating hierarchical chemical sub-graphs. For example, permethrin (Figure 7), an insecticidal compound, represents a stereoisomeric mixture of cis- and trans-permethrin isomers. The respective relationships between chemicals were resolved considering the presence of stereo-layers in their standard InChI strings [25], creating a hierarchical sub-graph (Figure 7). Further distinction of hierarchical levels (e.g., enantiomers and diastereomers) currently is not technically possible, as standard InChI strings do not support this operation [25]. However, it is also rarely needed for ecotoxicological assessments using field concentrations.
After evaluation of different solutions, the MAGIC graph was hosted using the Neo4j native graph database, a mature, actively developed and widespread graph database product that is available as an Open Source Community Edition (GPLv3 license) and as an extended Enterprise Edition. The MAGIC graph was implemented using versions 3.4.5 to 3.5.0 of the Community Edition (updates were applied as soon as available). Validation rules (Appendix B), as well as tools for automatic rule violation fixes, were implemented using PHP and integrated into an Apache 2 web server. For conducting manual fixes, a set of graphical tools was evaluated (Appendix D). The web server hosts a publicly available website (https://magic.eco) that allows, among other functions, to access the data of the MAGIC graph (see user notes).
Currentness of data is accomplished by synchronization routines, which update the MAGIC graph when some external data sources, especially the synonym provider, change. To detect differences between the graph and external sources, we reapplied the rule-based approach by implementing a set of synchronization rules (Table A2). Violations of these rules indicated differences between databases, prompting a synchronization routine.

4. User Notes

The website https://magic.eco provides access to the most recent version of the MAGIC graph. It offers the possibility to visit individual chemical identifiers and to discover the synonyms and generalizations as well as the data that are currently connected to the chemical. The website also provides a user with an option to download an up-to-date version of the Microsoft® Excel worksheet published with this data descriptor.

Supplementary Materials

MAGIC Graph Summary.xlsx, https://www.mdpi.com/2306-5729/4/1/34/s1.

Author Contributions

Conceptualization, S.B. and J.W.; methodology, S.B. and J.W.; software, S.B.; validation, S.B. and J.W.; formal analysis, J.W.; investigation, J.W.; resources, R.S.; data curation, S.B. and J.W.; writing—original draft preparation, S.B., J.W., S.S., L.L.P. and R.S.; writing—review and editing, S.B., J.W., S.S., L.L.P. and R.S; visualization, S.B.; supervision, S.S. and R.S.; project administration, S.S. and R.S.; and funding acquisition, S.S. and R.S.

Funding

This study was funded by the German Society for the Advancement of Sciences (DFG SCHU 2271/6-2).

Acknowledgments

We thank Engelbert Niehaus for his valuable input and discussions. We thank Ekaterina Bub for her language check.

Conflicts of Interest

The authors declare no conflict of interest.

Appendix A

A graph consists of vertices that are connected by edges. There is a variety of graph models that define the specifics of how vertices are connected by edges, but we adhere to the conceptually simple, yet powerful, labeled property graph model. A graph consists, according to this model, of vertices named nodes that are interconnected by directed edges named relationships [19]. Relationships always connect two nodes but nodes may have an arbitrary number of out- or ingoing relationships, including relationships to itself or multiple relationships to the same other node. Nodes have zero to many labels that allow differentiating them functionally. Similarly, relationships have types, but the number of types per relationship is limited to one. Nodes and relationships can be enriched by attaching an arbitrary number of properties to them, each containing additional information to the node or relationship. In essence, the labeled property graph model offers a high degree of flexibility while it provides constructs such as labels, types, and properties that help in structuring the data.

Appendix B

A rule-based approach has been chosen to maintain integrity of the MAGIC graph and to keep it synchronized with its synonym provider. This appendix sections lists the rules that have been defined and implemented in the MAGIC graph.
Table A1. Rules defining the MAGIC chemical graph.
ID“Rule” and Rule Description
G1“All nodes must have a single label”: Ensuring that each node has exactly one label results in a graph that is easier to maintain, as other rules can refer to specific sets of nodes without having to deal with possible labeling overlaps. If the graph gets more complex in the future, it might however become advantageous to allow multiple labels per node.
G2“Only a set of predefined labels is allowed for nodes”: Restricting labels to a predefined set prevents nodes in the graph that are not targeted by rules. The MAGIC graph may currently contain nodes with labels “ChemicalIdentifier”, “Chemical” and “Dataset”.
G3“Nodes should have a label with an associated view”: Making sure that each label has a defined way that it is represented by the front-end website makes the MAGIC graph completely navigable.
G4“Only a set of predefined types is allowed for relationships”: Predefining types assures that all relationships are addressed by rules. Currently, the relationship types “identifies”, “prefers_identifier”, “uses_identifier” and “specifies” are allowed in the MAGIC graph.
G5“Every item in the MAGIC graph must have a name”: Naming items provides an endpoint for visiting the item using the website front-end and facilitates modifications and synchronization of the graph by allowing identification of individual nodes. For many types of items, such as chemical identifiers, the name is a natural part of the data.
G6“Labels should have an associated edit view”: Edit views allow smaller modifications of items using the website front-end and the provision of such edit views helps in maintaining the graph database.
G7“MAGIC graph items should have at least one ingoing relationship”: Items, having no ingoing relationship, lack in significance because they are not navigable along the graph relationships and should not be part of the graph. Some items are considered as entry points to the graph (e.g., datasets) and are marked as globally available. The rule does not apply to these items.
CI1“All chemical identifiers nodes must have a timestamp”: Registering the date of item creation assists in synchronization chemical identifiers with external data sources and helps to resolve rule conflicts by indicating which item is more recent.
CI2“All chemical identifiers that actually identify a chemical should be linked to exactly one chemical”: A chemical identifier should identify a chemical, otherwise it is irrelevant for the chemical graph. However, there are two typical occasions when a chemical identifier does not identify a chemical: (1) when a data source, from which data were imported into the graph listed an identifier as a chemical identifier, but further investigation revealed that the identifier did not refer to a chemical in a strict sense (e.g., it identifies a mixture of chemicals); and (2) when a chemical identifier was not found by the synonym provider. Violating this rule gives the user a chance to recognize and mitigate the second occasion, e.g., by adding manual synonym relationships. The user also has a chance to mark a chemical identifier in such a way that it does not trigger this rule anymore (by marking it as a chemical identifier that does not actually identify a chemical), which also signifies that the rule violation was recognized and managed manually.
CI3“All chemical identification relationships should have a timestamp”: Registering the date of relationship creation assists in synchronization with external data sources and helps to resolve rule conflicts by indicating which relationship is more recent.
CI4“All chemical identifications should have a type”: Specifying the mode in which a chemical identifier identifies a chemical helps in estimating the quality and uncertainty of the relationship. It also helps to output specific sets of identifiers, e.g., only CAS RN. The types used for specifying the relationship of identification are currently not restricted but may be a predefined set in the future.
CI5“All chemical identifiers should be used by at least one dataset”: The data sources where a chemical identifier is used should be given. If this is not the case, retracing the origin of chemical identifiers is not possible which decreases the overall quality of the MAGIC graph.
CI6“All chemical identifiers should have an identifier from a predefined list showing what is actually identified”: Other rules depend on the information that a chemical identifier actually identifies a chemical, that is, there applies a stricter meaning of chemical than in some other databases. To provide this information, a chemical identifier should describe what it actually identifies. Currently, the following possibilities are considered here: chemical, mixture, unmatched chemical (by no means a corresponding chemical could be identified), unspecific (is not specific enough to identify exactly one chemical) and ignored (for any reason).
CI7“A chemical identifier, that does not actually identify a chemical, should not be linked with a chemical”: Specifying that a chemical identifier identifies a chemical only does make sense in case the chemical identifier is marked as actually identifying a chemical. If this is not the case, but an identifying relationship exists nonetheless, a manual examination of the case is advised.
C1“All chemicals must have a timestamp”: Registering the date of item creation assists in resolving conflicts involving chemicals by indicating which item is more recent.
C2“All chemicals should have exactly one preferred name”: According to the MAGIC graph data model, a chemical is considered having many names. Making sure that every chemical has exactly one designated preferred name still allows it to be referred to in outputs in a harmonized way.
C3“All chemicals should be identified by at least one chemical identifier”: Chemicals that have no identifier cannot be related to actual chemicals and should be removed from the graph.
C4“All identifier preferences should have a timestamp”: Name preferences of chemicals, especially when taken from external sources, may change over time. In these occasions, timestamps help to identify the more recent preference.
C5“All chemicals should indicate whether they have bond stereo-chemical information”: To understand which level of specificity regarding stereo-chemistry a chemical has, presence or absence of stereo-information at double bonds should be indicated.
C6“All chemicals should indicate whether they have tertrahedral stereo-chemical information”: To understand which level of specificity regarding stereo-chemistry a chemical has, presence or absence of stereo-information at tetrahedral stereo centers should be indicated.
C7“Chemicals with stereo-information should specify other chemicals or indicate to not do so”: The purpose of considering stereo-information is to distinguish two levels of specificity regarding stereo-chemistry: absence and presence of stereo-information. In the case of stereo-information presence, a chemical should specify a chemical without stereo-information but with the same chemical structure, so representing the two levels of specificity in the graph. For some chemicals, it is not reasonable to find a chemical with the same structure but without stereo-information. In this case, the more specific chemical should be marked such that this rule can be ignored.
C8“Chemicals may not specify themselves”: Violations of this rule may occur when stereo-information in external data sources changes.
D1“All datasets must have a timestamp”: Registering the date of item creation assists in resolving conflicts in datasets by indicating which item is more recent.
D2“All datasets must have a title”: A title provides a more extensive way for a short description of the dataset but is not, unlike its name, used as an identifier.
D3“All datasets must have a description”: A description is an even more extensive opportunity to characterize a dataset by text.
D4“All datasets should haven an indicator of whether they are published”: Distinction between published and non-published datasets allows to decide which datasets are accessible by the website front-end.
D5“All datasets should be published”: At least at later stages, after inserting a dataset into the graph and fixing possible rule violations, the dataset should be published to make its data available.
D6“All datasets must have at least one author”: Assigning authors to a dataset is an attribution to the persons who were responsible for inserting the dataset into the graph.
UTI1“All Use Type Identifiers should be used by at least one dataset”: Use type identifiers originate from datasets and attributions to these datasets should be given.
UTI2“All Use Type Identifiers should be used by at least one chemical identifier”: All use type identifiers should be linked to at least one chemical identifier, otherwise they are of limited use for assessments.
CCI1“All Chem Class Identifiers should be used by at least one dataset”: Chemical class identifiers originate from datasets and an attribution to this dataset should be given.
CCI2“All Chem Class Identifiers should be used by at least one chemical identifier”: All chemical class identifiers should be linked to at least one chemical identifier, otherwise they are of limited use for assessments.
Table A2. Synchronization rules.
IDRule and Description
SyncCDDB1 “All identifiers in the MAGIC graph that actually identify a chemical should have exactly one match in the CDDB”: Identifiers that have no match in the CDDB have been removed from there and should also be removed from the MAGIC graph. In some (rare) cases, chemical identifiers have two or more matches in the CDDB. These cases should be resolved manually, e.g., by ignoring the chemical identifier.
SyncCDDB2“All identifiers of a specific chemical in the MAGIC graph should have the same preferred name and DTXSID in the CDDB”: Having different preferred names among the synonym identifiers of a chemical is a strong indicator that synonym relationships in the CDDB have changed. This should result in an update of synonym relationships in the MAGIC graph as well.
SyncCDDB3“The preferred name of a chemical in the MAGIC graph should be the same as the preferred name in the CDDB”: Preferred names of the CDDB may change. Making sure we use the same preferred name in the MAGIC graph as in the CDDB circumvents the need to establish a custom scheme for preferred names.
SyncCDDB4“The stereo-information of a chemical in the MAGIC graph should be the same as the stereo-information of that chemical in the CDDB”: This rule captures changes in the chemical structure stored in the CDDB. Again, these changes should be synchronized with the MAGIC graph to reflect the most recent specifying relationships.
SyncCDDB5“The identifier type of the relationship between a chemical identifier and a chemical in the MAGIC graph should be the same as in the CDDB”: Synchronizing the identifier type between CDDB and MAGIC graph eliminates the necessity to manage a custom set of identifier types while still allowing to use the benefits of typed identifiers.
SyncCDDB6“All identifiers in the MAGIC graph that do not actually identify a chemical should have no match in the CDDB”: On some occasions, new identifiers become recognized by the CDDB. This rule captures those instances where the newly recognized identifiers match identifiers in the MAGIC that previously have been marked as not actually identifying chemicals.

Appendix C

In total, 655 substance names—categorized as organic contaminants—were obtained from the Water Quality Portal (https://www.waterqualitydata.us/) and used for benchmarking six databases. First, successful synonym attribution was compared quantitatively (Table A3) between databases, and then the quality of synonym relationships was manually assessed by validating correctness of generated links using assigned standard InChI-Keys.
Table A3. Comparison of chemical synonym providers regarding automated attribution of InChI-Keys for 655 organic contaminants.
DatabaseCoverage (%)Remarks
U.S. EPA Chemical Dashboard 1586 (89.5%)correct links
PubChem 2645 (98.5%)ambiguous response, incorrect links
PUG REST 3604 (92.2%)ambiguous response, incorrect links
SRS 4601 (91.8%)rarely incorrect links
ChemSpider 5346 (52.8%)low coverage
Chemical Translation Service 6613 (93.6%)ambiguous response, incorrect links
Attribution of synonyms and InChI-Keys was high for all six databases with the exception of one (ChemSpider), which was removed from subsequent analyses due to its comparatively low coverage (Table A3). Following this, manual validation of assigned InChI-Keys revealed that attribution was frequently incorrect or query responses were ambiguous, except for the U.S. EPA Chemical Dashboard (CDDB). Although multiple factors leading to misattribution of InChI-Keys or synonyms were identified, automatic aggregation of synonym lists from online-sources lacking expert curation was found the most prevalent factor that adversely affected attribution quality. The CDDB, that, unlike the other considered databases, curates records and gives quality indicators, was thus identified as the most reliable source for synonyms and corresponding InChI-Keys (see below for sample data retrieved from the CDDB). Synonym quality provided by the CDDB was further assessed to sustain the robustness of the method. Although automated linking of Chemical Identifiers to chemicals was high (89.5%, n = 586) when using the CDDB (Table A3), 69 WQP entries could not be automatically assigned to Chemical Identifiers. Missing entries were manually assigned CAS RN and InChI-Keys via cross-validation using, among other databases, PubChem, PAN and PPDB. Attributed CAS RN and InChI-Keys were then used to link missing entries with the corresponding CDDB entry, which was successful in 75.4% (n = 52) of remaining cases. No manual links could be established in 24.6% (n = 17) of cases, because no corresponding entry was found in the CDDB. Failure to automatically establish synonym relationships was mostly due to chemical names in WQP being abbreviated, using wrong or uncommon identifiers, or referring to entities that are not chemicals in a strict sense (i.e., mixtures). Most importantly, a manual check revealed that no false synonym relationships (i.e., incorrect links) were generated automatically using the CDDB as synonym provider, which was manually checked. Thus, overall correctness and reliability of generated links were without any noticeable concern.
Data were retrieved from the EPA Chemistry Dashboard (https://comptox.epa.gov/dashboard) using its batch search. The following is an excerpt of data retrieved:
  • Input: Lindane, Found by: Approved Name, DTXSID: DTXSID2020686, Preferred name: Lindane, InChI key: JLYXXMFPNIAWKQ-GNIYUCBRSA-N, InChI string: InChI=1/C6H6Cl6/c7-1-2(8)4(10)6(12)5(11)3(1)9/h1-6H/t1-,2-,3-,4+,5+,6+
  • Input: cis-Permethrin, Found by: Expert Validated Synonym, DTXSID: DTXSID0038338, Preferred name: (+/−)-cis-Permethrin, InChI key: RLLPVAHGXHCWKJ-HKUYNNGSSA-N, InChI string: InChI=1/C21H20Cl2O3/c1-21(2)17(12-18(22)23)19(21)20(24)25-13-14-7-6-10-16(11-14)26-15-8-4-3-5-9-15/h3-12,17,19H,13H2,1-2H3/t17-,19-/s2
  • Input: lambda-Cyhalothrin, Found by: Synonym from Valid Source, DTXSID: DTXSID7032559, Preferred name: λ-Cyhalothrin, InChI key: ZXQYGBMAQZUVMI-GCMPRSNUSA-N, InChI string: InChI=1/C23H19ClF3NO3/c1-22(2)17(12-19(24)23(25,26)27)20(22)21(29)31-18(13-28)14-7-6-10-16(11-14)30-15-8-4-3-5-9-15/h3-12,17-18,20H,1-2H3/b19-12-/t17-,18+,20-/s2
These data are sufficient: (1) to identify synonymous identifiers (Input, DTXSID, Preferred name, (InChI key, InChI string)); (2) to evaluate the quality of the synonym relationship (Found by); (3) to assess the presence of stereo-chemical information in a chemical and compare chemicals with the same structure (InChI string, InChI key); and (4) to assign a common preferred name to a chemical (Preferred name).

Appendix D

Various graphical user interfaces have been tested to identify a suitable tool for minor interactive modifications of the MAGIC graph, preferably without coding Cypher queries (Table A4).
Table A4. Comparison of graphical user interfaces for Neo4j databases.
NameVersionLicense Graph EditLast UpdateRemarks
Bloom commercial+recentlyhttps://neo4j.com/bloom/
Cytoscape3.7.0GNU10/2018Does not support Neo4j natively, but possibly via (outdated) plug-in 1; http://www.cytoscape.org/
Gephi0.9.2commercial (free edition)9/2017Does not support Neo4j natively, but possibly via plug-in2; https://gephi.org/
Graphexp Apache+10/2018Does not support Neo4j natively; https://github.com/bricaud/graphexp
Graphileon2.0.0-betaGNU+8/2018Graphs with datetime properties (introduced in Neo4j v3.4) cannot be visualized or edited; https://graphileon.com/graphileon-personal-edition/
Keylines5.0commercial11/2018https://cambridge-intelligence.com/keylines
Linkurious2.5.4commercial+7/2018Offers trial version, without price information; https://linkurio.us/solution/neo4j/
Neo4j Browser3.2.5GNU11/2018Shipped with Neo4j database; https://neo4j.com/developer/guide-neo4j-browser/
Neo4j Browser (forked)3.2.7GNU+11/2018Extends Neo4j Browser by editing functionality; https://github.com/phdd/neo4j-browser
Neo4js2open source+5/2018https://github.com/adadgio/neo4j-js-ng2
Neoclipse1.9.5open source+9/2014Does not support current Neo4j version; https://github.com/neo4j-contrib/neoclipse
Structr3.0.3commercial+9/2018https://structr.com/
Tom Sawyer8.2.2commercial11/2018https://www.tomsawyer.com/graph-database-browser/

References

  1. Newman, M.C. Fundamentals of Ecotoxicology: The Science of Pollution, 4th ed.; CRC Press: Boca Ration, FL, USA, 2014. [Google Scholar]
  2. National Water Quality Monitoring Council. Water Quality Portal. Available online: https://www.waterqualitydata.us/ (accessed on 27 October 2018).
  3. Russom, C.L. U.S. EPA’s ECOTOX Database. In Proceedings of the Joint regional SETAC/SOT Annual Meeting, Duluth, MN, USA, 9–10 April 2002. [Google Scholar]
  4. European Food Safety Authority. Openfoodtox. Available online: https://dwh.efsa.europa.eu/bi/asp/Main.aspx (accessed on 27 October 2018).
  5. Pesticide Action Network. Pesticide Database—Chemicals. Available online: http://www.pesticideinfo.org/Search_Chemicals.jsp (accessed on 27 October 2018).
  6. Baker, N.T. Agricultural Pesticide Use Estimates for the USGS National Water Quality Network, 1992–2014. In U.S. Geological Survey Data Release; U.S. Geological Survey: Reston, VA, USA, 2016. [Google Scholar]
  7. Heller, S.; McNaught, A.; Stein, S.; Tchekhovskoi, D.; Pletnev, I. InChI—The Worldwide Chemical Structure Identifier Standard. J. Cheminform. 2013, 5, 7. [Google Scholar] [CrossRef] [PubMed]
  8. Wiswesser, W.J. 107 Years of Line-Formula Notations (1861–1968). J. Chem. Doc. 1968, 8, 146–150. [Google Scholar] [CrossRef]
  9. Weininger, D. Smiles, a Chemical Language and Information System. 1. Introduction to Methodology and Encoding Rules. J. Chem. Inf. Comput. Sci. 1988, 28, 31–36. [Google Scholar] [CrossRef]
  10. CAS Registry System. J. Chem. Inf. Comput. Sci. 1978, 18, 58. [CrossRef]
  11. Williams, A.J.; Grulke, C.M.; Edwards, J.; McEachran, A.D.; Mansouri, K.; Baker, N.C.; Patlewicz, G.; Shah, I.; Wambaugh, J.F.; Judson, R.S.; et al. The Comptox Chemistry Dashboard: A Community Data Resource for Environmental Chemistry. J. Cheminform. 2017, 9, 61. [Google Scholar] [CrossRef] [PubMed]
  12. Stehle, S.; Schulz, R. Agricultural Insecticides Threaten Surface Waters at the Global Scale. Proc. Natl. Acad. Sci. USA 2015, 112, 5750–5755. [Google Scholar] [CrossRef] [PubMed]
  13. Smith, S.W. Chiral Toxicology: It’s the Same Thing…Only Different. Toxicol. Sci. 2009, 110, 4–30. [Google Scholar] [CrossRef] [PubMed]
  14. Vicknair, C.; Macias, M.; Zhao, Z.; Nan, X.; Chen, Y.; Wilkins, D. A Comparison of a Graph Database and a Relational Database: A Data Provenance Perspective. In Proceedings of the 48th Annual Southeast Regional Conference, Oxford, MS, USA, 15–17 April 2010. [Google Scholar]
  15. Batra, S.; Tyagi, C. Comparative Analysis of Relational and Graph Databases. Int. J. Soft Comput. Eng. 2012, 2, 509–512. [Google Scholar]
  16. Holzschuher, F.; Peinl, R. Performance of Graph Query Languages: Comparison of Cypher, Gremlin and Native Access in Neo4j. In Proceedings of the Joint EDBT/ICDT 2013 Workshops, Genoa, Italy, 18–22 March 2013. [Google Scholar]
  17. Constantinov, C.; Mocanu, M.L.; Poteras, C.M. Running Complex Queries on a Graph Database: A Performance Evaluation of Neo4j. Ann. Univ. Craiova 2015, 12, 38. [Google Scholar]
  18. Nayak, A.; Poriya, A.; Poojary, D. Type of NOSQL Databases and Its Comparison with Relational Databases. Int. J. Appl. Inf. Syst. 2013, 5, 16–19. [Google Scholar]
  19. Robinson, I.; Webber, J.; Eifrem, E. Graph Databases, 1st ed.; O’Reilly Media, Inc.: Sebastopol, CA, USA, 2013. [Google Scholar]
  20. Tauro, C.J.M.; Aravindh, S.; Shreeharsha, A.B. Comparative Study of the New Generation, Agile, Scalable, High Performance NOSQL Databases. Int. J. Comput. Appl. 2012, 48, 1–4. [Google Scholar] [Green Version]
  21. Lakshman, A.; Malik, P. Cassandra: A Decentralized Structured Storage System. ACM SIGOPS Oper. Syst. Rev. 2010, 44, 35–40. [Google Scholar] [CrossRef]
  22. Sivasubramanian, S. Amazon dynamoDB: A Seamlessly Scalable Non-Relational Database Service. In Proceedings of the 2012 ACM SIGMOD International Conference on Management of Data, Scottsdale, AZ, USA, 20–24 May 2012. [Google Scholar]
  23. Wolfram, J.; Stehle, S.; Bub, S.; Petschick, L.L.; Schulz, R. Meta-Analysis of Insecticides in United States Surface Waters: Status and Future Implications. Environ. Sci. Technol. 2018, 52, 14452–14460. [Google Scholar] [CrossRef] [PubMed]
  24. Beck, K. Test-Driven Development: By Example, 1st ed.; Addison-Wesley Professional: Boston, MA, USA, 2003. [Google Scholar]
  25. InChI Technical FAQ. Available online: https://www.inchi-trust.org/technical-faq-2/ (accessed on 25 December 2018).
Figure 1. Schema of the “Meta-analysis of the Global Impact of Chemicals” (MAGIC) graph depicting typed relationships (arrows) between labeled nodes (circles).
Data 04 00034 g001
Figure 2. Network map of the MAGIC graph. A subset of chemical identifiers is shown as green dots. Larger circles outlined in black represent the datasets included in the graph. Grey lines connect the datasets with chemical identifiers, and individual identifiers with chemicals (cyan circles, rarely visible).
Data 04 00034 g002
Figure 3. Linkage of chemical data relative to a theoretical maximum for different databases. Complete linkage presumes that all chemicals listed in the smaller database are contained in the larger one. Linkage with a relational approach, where only CAS RN (light blue) or same-spelling chemical identifiers match (dark blue), is compared to the additional gain with the graph approach (orange). See Table 4 for the types of identifiers that were available for each database.
Data 04 00034 g003
Figure 4. PAN use types of the chemicals in different datasets after linking them with the MAGIC graph. Chemicals may have multiple use types and are then included in several categories.
Data 04 00034 g004
Figure 5. Workflow for adding data to the MAGIC graph while maintaining its integrity.
Data 04 00034 g005
Figure 6. Two representations of four synonym identifiers (1–4) in a graph. (a) Links between identifiers indicate known synonym relationships. Synonyms of an identifier are all directly or indirectly connected other identifiers. (b) Identifiers point to the identified chemical (blue circle). All identifiers pointing to the same chemical are synonyms. The chemical has a preferred identifier (double arrow).
Data 04 00034 g006
Figure 7. Representation of some synonyms and different levels of specificity for permethrin. Identifiers (green) refer (solid arrows) to chemicals (blue). Chemicals with stereo-information refer (dashed arrow) to a structural identical chemical without stereo-information.
Data 04 00034 g007
Table 1. Core data, their dimensions and exemplary datasets, providing these data and being used in this study.
Type of DataDimensionsExample Datasets
Environmental ConcentrationsSpace, time, medium, chemicalWQP 1
Biological effectsSpecies, medium, chemicalECOTOX 2, FOODTOX 3
Use typesChemicalPAN 4, (WQP)
Application ratesSpace, time, chemicalUSE 5
1 National Water Quality Monitoring Council—Water Quality Portal (WQP) [2]. 2 U.S. EPA ECOTOX database (ECOTOX) [3]. 3 European Food Safety Authority—OpenFoodTox (FOODTOX) [4]. 4 Pesticide Action Network—Pesticide Database (PAN) [5]. 5 U.S. Geological Survey—Estimated Annual Agricultural Pesticide Use (USE) [6].
Table 2. Examples of problems occurring when linking data from different sources.
Field of ProblemAffected DimensionProblemExample
NomenclatureChemicalDifferent spellingsLambda-cyhalothrin–cyhalothrin, lambda
Different nomenclaturesThiametoxam (trivial name)–153719-23-4 (CAS RN)
SpaceDifferent languagesUnited States of America–Estados Unidos de América
SpecificityChemicalDifferent stereo-chemical information Concentration of beta-cyfluthrin–threshold of cyfluthrin
SpaceDifferent spatial resolutionConcentration at GPS coordinate–use rate at county-level
TimeDifferent temporal resolutionConcentration with date–use data in yearly resolution
Table 3. Description of the submitted Microsoft® Excel worksheet.
ColumnDescription
ChemicalThe preferred name of the chemical as derived from the CDDB. In most instances, the name given here equals the preferred name of the CDDB.
CAS RNThe currently valid Chemical Abstract Service registry number as given by the CDDB. Alternative CAS RNs, such as deleted numbers, are given under synonyms if they are used by at least one of the databases included in the MAGIC graph.
DTXSIDThe substance identifier of the distributed structure-searchable toxicity database as provided by the CDDB
SynonymsAdditional identifiers of the chemical. Synonyms are only listed if they are used by at least one of the databases included in the MAGIC graph.
Chemical ClassThe chemical class according to the PAN and WQP dataset. Only chemicals occurring in one of these datasets are classified and classifications are given here as is. Chemical classifications will be extended by considering further databases and harmonized among databases in the future.
StereochemicalAn “x” indicates stereo-chemical information is associated with the chemical.
InsecticideAn “x” indicates that the chemical is used as an insecticide according to the PAN database.
HerbicideAn “x” indicates that the chemical is used as an herbicide according to the PAN database.
FungicideAn “x” indicates that the chemical is used as a fungicide according to the PAN database.
MicrobiocideAn “x” indicates that the chemical is used as a microbiocide according to the PAN database.
Other UsesA list of other uses of this chemical (excluding insecticide, herbicide, fungicide and microbiocide) according to the PAN and WQP databases. As with chemical classes, use type classification will be improved continuously over the next versions of the MAGIC graph.
WQPEntries marked “x” indicate that the WQP database contains records of this chemical, using any of its identifiers.
ECOTOXEntries marked “x” indicate that the ECOTOX database contains records of this chemical, using any of its identifiers.
FOODTOXEntries marked “x” indicate that the FOODTOX database contains records of this chemical, using any of its identifiers.
USEEntries marked “x” indicate that the USE database contains records of this chemical, using any of its identifiers.
PANEntries marked “x” indicate that the PAN database contains records of this chemical, using any of its identifiers.
Table 4. Characterization of ecotoxicologically-relevant datasets using the MAGIC graph.
DatasetID TypeIdentifiersSyno-nyms 4Chemicals
Chemical 1,2Other 2,3Stereo- 5Non-Stereo 5
WQP CAS RN, name6384 (65%)3374 (35%)3133385 (11%)2987 (89%)
ECOTOXCAS RN 11,550 (73%)4214 (27%)281454 (13%)10,068 (87%)
USEName451 (92%)40 (8%)258 (13%)391 (87%)
PANCAS RN, name10,399 (69%)4640 (31%)4453707 (12%) 5388 (88%)
FOODTOXCAS RN, name4190 (75%)1375 (25%)752636 (18%)2802 (82%)
1 Identifiers that were linked to specific structurally unique compounds using the CDDB. 2 Percentages refer to the entirety of chemical identifiers in the dataset. 3 Identifiers used by the respective dataset that could not be linked to a specific chemical using the CDDB. 4 Synonyms refer to the amount of additional chemical identifiers attributed to chemicals. 5 Percentages refer to the entirety of chemicals in the dataset.

