1. Summary
The local-national gap is a problem currently plaguing the adoption of emerging technologies targeted at resolving energy transition issues that are characterized by disparities in the adoption of innovations and policies on a local level in response to national policy implementation. It is becoming increasingly apparent that individual communities do not necessarily share the same energy wants and needs with one another, and as noted in multiple studies of energy development projects [
1,
2], the alignment of value systems between energy sources and local needs plays a significant role in how, if at all, these sources are used [
3].
Studies of the barriers and opportunities for implementing social innovations in the deployment of solar photovoltaics include a variety of qualitative, quantitative, and mixed methods approaches. These analyses are broadly concerned with identifying and reducing the barriers to adoption that occur at the level of policy-making (state or national), or within the decision-making processes of individuals. Nation-state-level analyses seek to impact how policy conversations pertaining to technology development, incentive structures, and other financial mechanisms enable sustainable energy transitions. Agent-based modeling studies [
4,
5] leverage data gathered at the national scale, such as PV cost trends, solar irradiance, and incentive programs, to identify the capacity and location of future installations. A complimentary body of studies focuses on evaluating policy trends in high solar penetration areas (e.g., California) to generalize the possible impacts and limitations for other societies and institutional frameworks [
6,
7,
8,
9].
Individual and collective behavior analyses also seek to intercede in policy development. Where they differ is in the focus on identifying opportunities for social programs that enable knowledge sharing between individuals and communities. Individual adopter motivations [
10], social networks [
11,
12], and perceptions of the technology [
13,
14,
15] are the focus: these are elucidated through a series of surveys, semi-structured interviewing, and in some cases, ethnographic analysis. A key result from this body of work is the recognition that non-financial factors such as peer effects and the perception of self as an innovator [
16] also drive when and how people adopt solar.
Nevertheless, gaps persist in our understanding of the disparities between national policy conversations about solar adoption and local action towards these goals. Known as the “local-national gap,” this burgeoning area of research seeks to establish a space for national policy analyses and studies of individual motivations with community-level dynamics. Wüstenhagen, Wolsink, and Burer [
17] noted that societal acceptance of energy technologies such as solar depends on factors such as socio-political acceptance, community acceptance, and market acceptance. These factors highlight that communities respond to new technologies in complex ways that belie perceptions of pro- and anti-innovation communities (NIMBYism). Batel and Devine-Wright [
18] and Hess et al. [
19] further posited that redressing the incoherence between national and local trends will require examining how actors independently and collectively interact and make decisions at scales ranging from individual communities to national action.
As described in Tidwell, Tidwell, and Nelson [
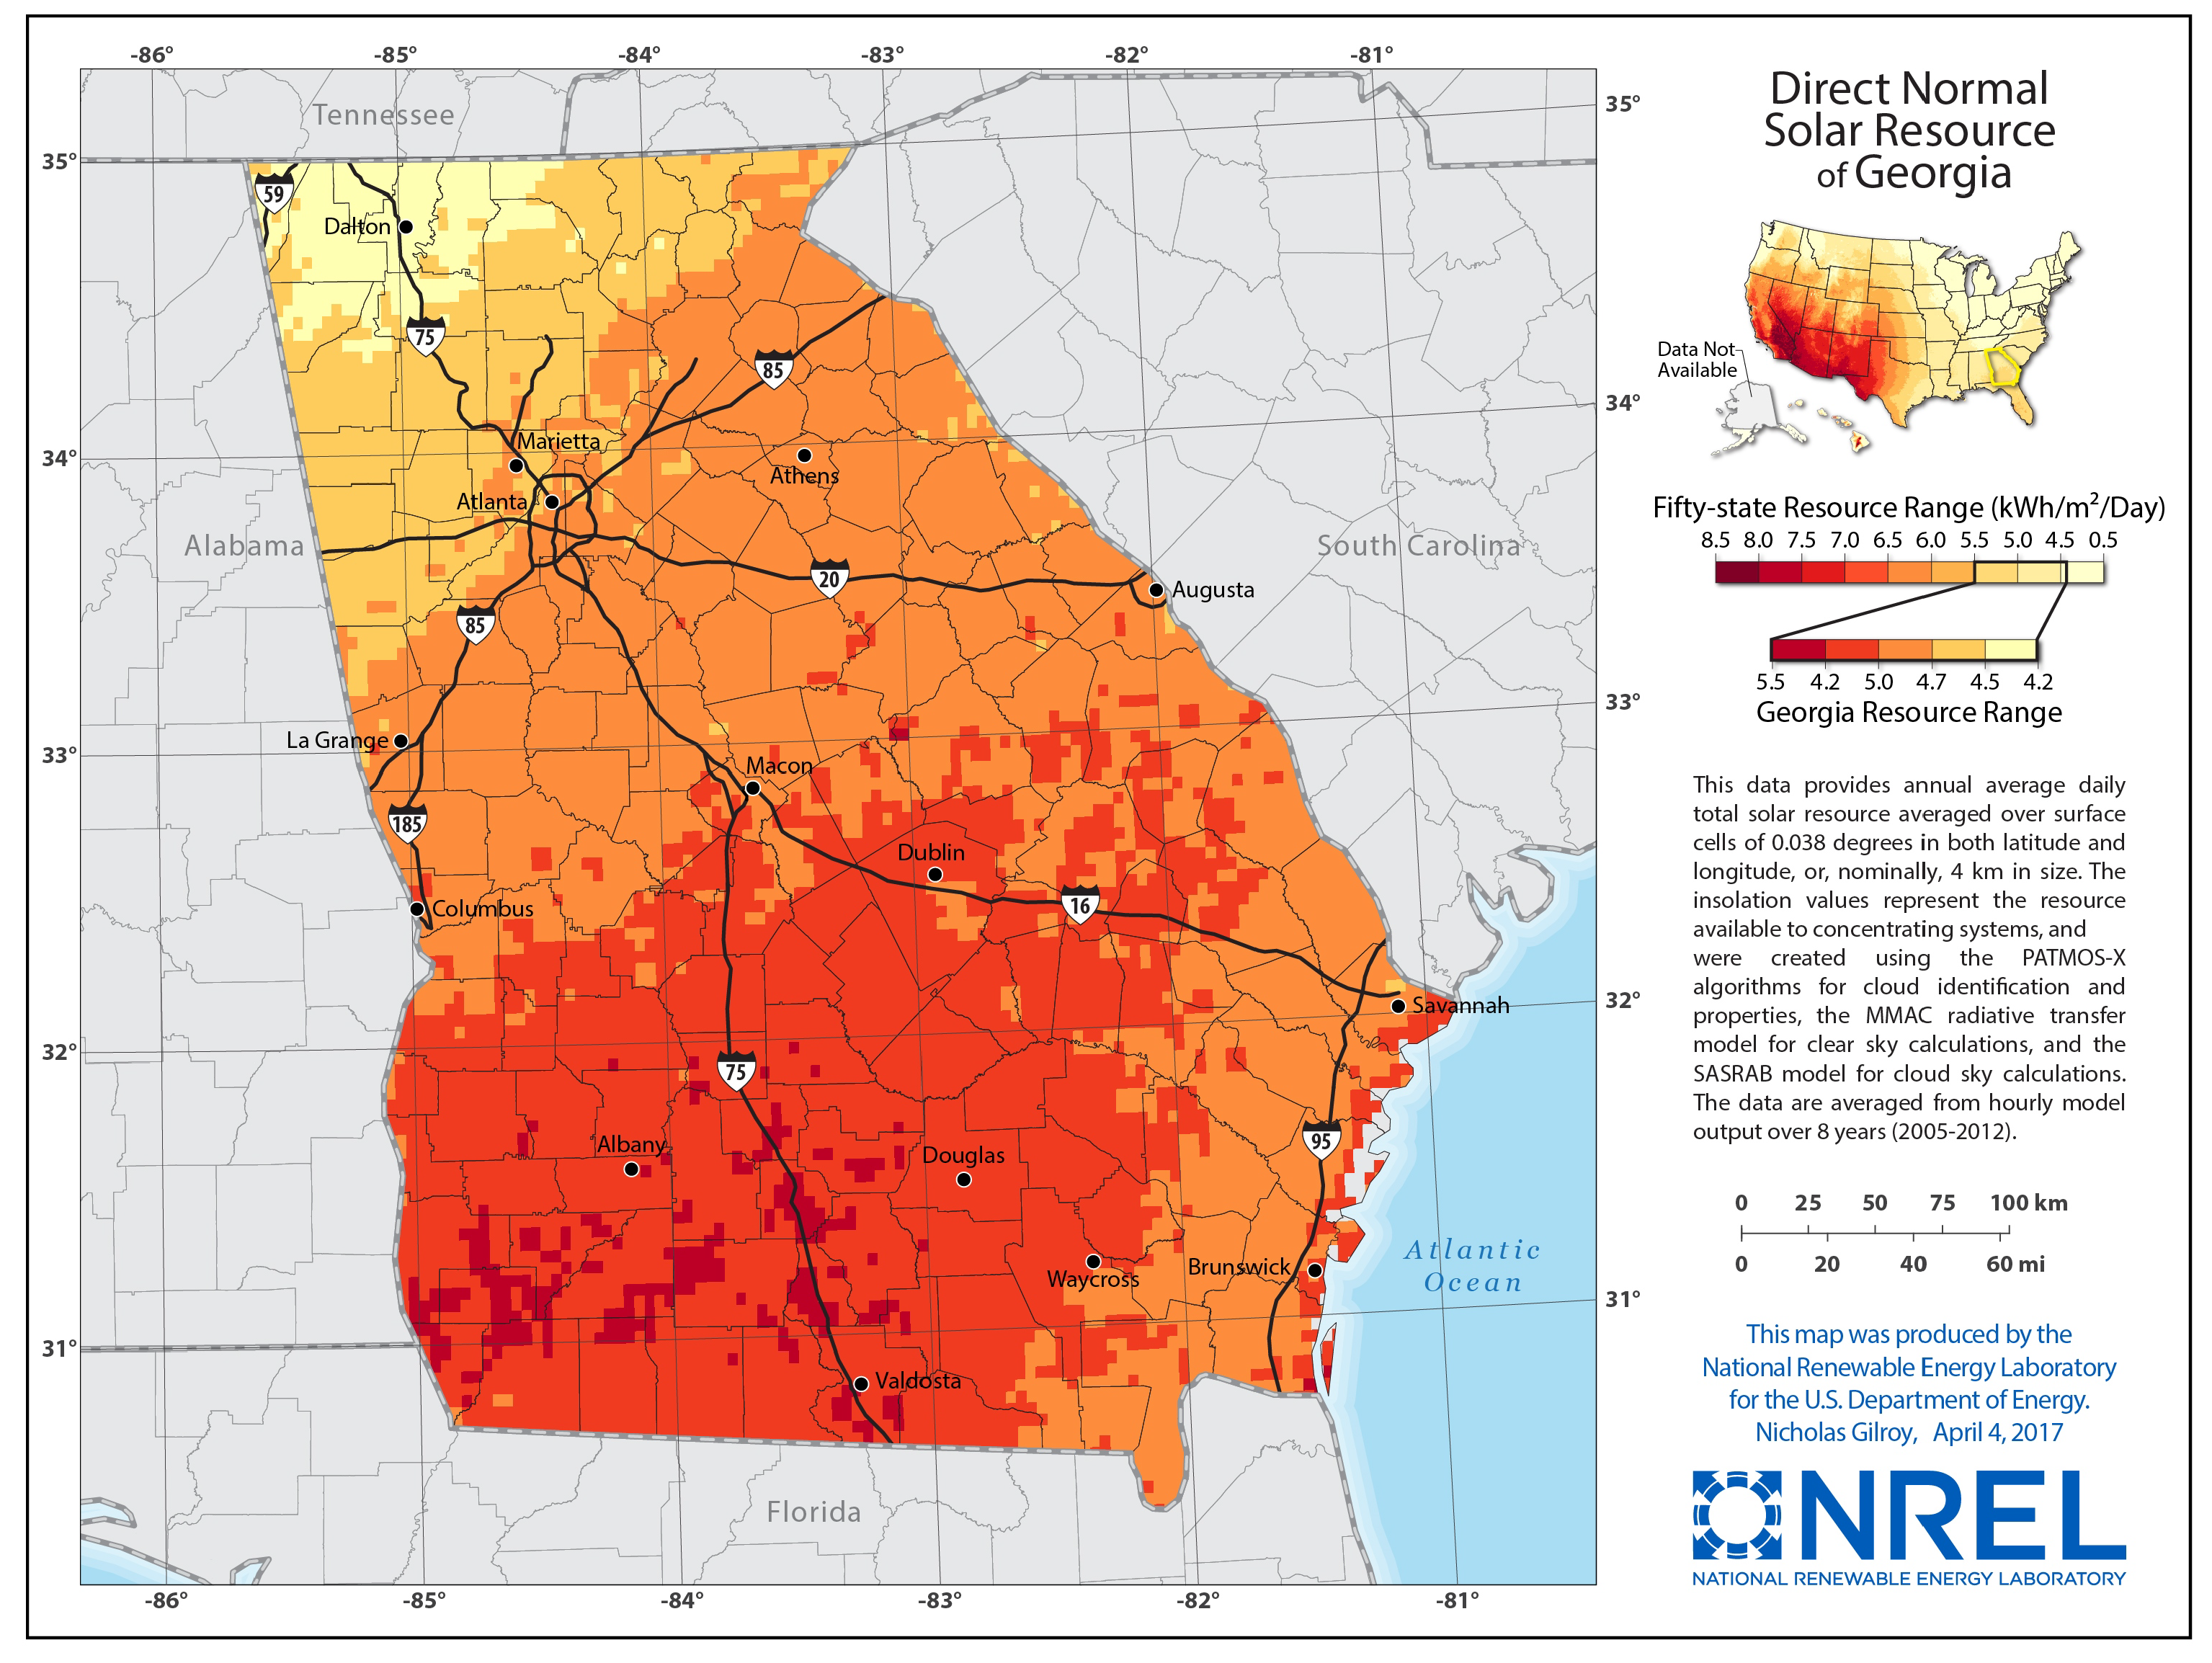
20], there is a state within the United States of America that proves to be an interesting case study for investigating issues of local adoption of national renewable energy policy: Georgia. The Energy Information Administration positions Georgia as a leader in biomass energy production and an emerging space for the deployment of photovoltaic solar in the utility, commercial, and residential sectors [
21]. Its status as an emergent space for PV solar is reflective of the perceived high potential for solar energy in Georgia in terms of solar insolation, it having some of the highest in the southeastern United States (
Figure 1).
As a result of the size of the Georgian economy (ninth in the country by gross domestic product) and its existing energy system characteristics, Georgia is posited to be one of the states with the highest potential for solar deployment [
23]. Recent trends in solar adoption seem to reflect these analyses.
Between 2017 and 2018, total net generation from solar photovoltaic rose from 22
nd in the nation [
24] to ninth [
21], moving Georgia from laggard to leader in solar power production [
25]. Policy changes, including the Solar Power Free-Market Financing Act of 2015, have opened possibilities for integrating solar from third-party producers despite the lack of net metering policies or a renewable portfolio standard. Despite this seemingly positive uptake in energy generation through solar-powered technologies, a closer look locally indicates that the primary driving force is the integration of several utility and commercial-scale solar facilities. In 2018, Georgia ranked 37
th in power generated from residential PV solar, making it the lowest ranked state amongst the top ten in total PV solar energy production. Despite recent increases in the annual generation of electricity from solar installations in the State of Georgia—primarily a result of new utility-scale installations [
21]—there is still a significant amount of potential for solar technology adoption for Georgia (see
Table 1 [
26]).
Table 1.
Georgia energy data solar electric installations’ summary.
Table 1.
Georgia energy data solar electric installations’ summary.
| Use Sector | Number of Installations | Capacity | Annual Generation |
|---|
| Residential | 1046 | 5822.99 kW | 8,128,855.02 kWh |
| Non-Residential | 599 | 52,755.53 kW | 74,278,797.37 kWh |
| Utility | 235 | 1,250,862.51 kW | 1,873,396,033.13 kWh |
One might wonder how a state positioned for high technical potential could have such low levels of adoption.
Respecting the complex interactions that exist within the local-national gap requires an eye towards understanding the multi-modal flows of information that are attuned to local policy-making conditions. The Social Energy Atlas, a program funded by the United States Department of Energy Solar Energy Technology Office, leverages large-scale qualitative and quantitative data analysis for examining why residents of the State of Georgia do or do not adopt rooftop photovoltaic solar [
27]. The primary objective of this work is to develop more effective policy and programming to bridge the local-national gap in Georgia, through large-scale analysis of the stories people array when making such decisions about energy.
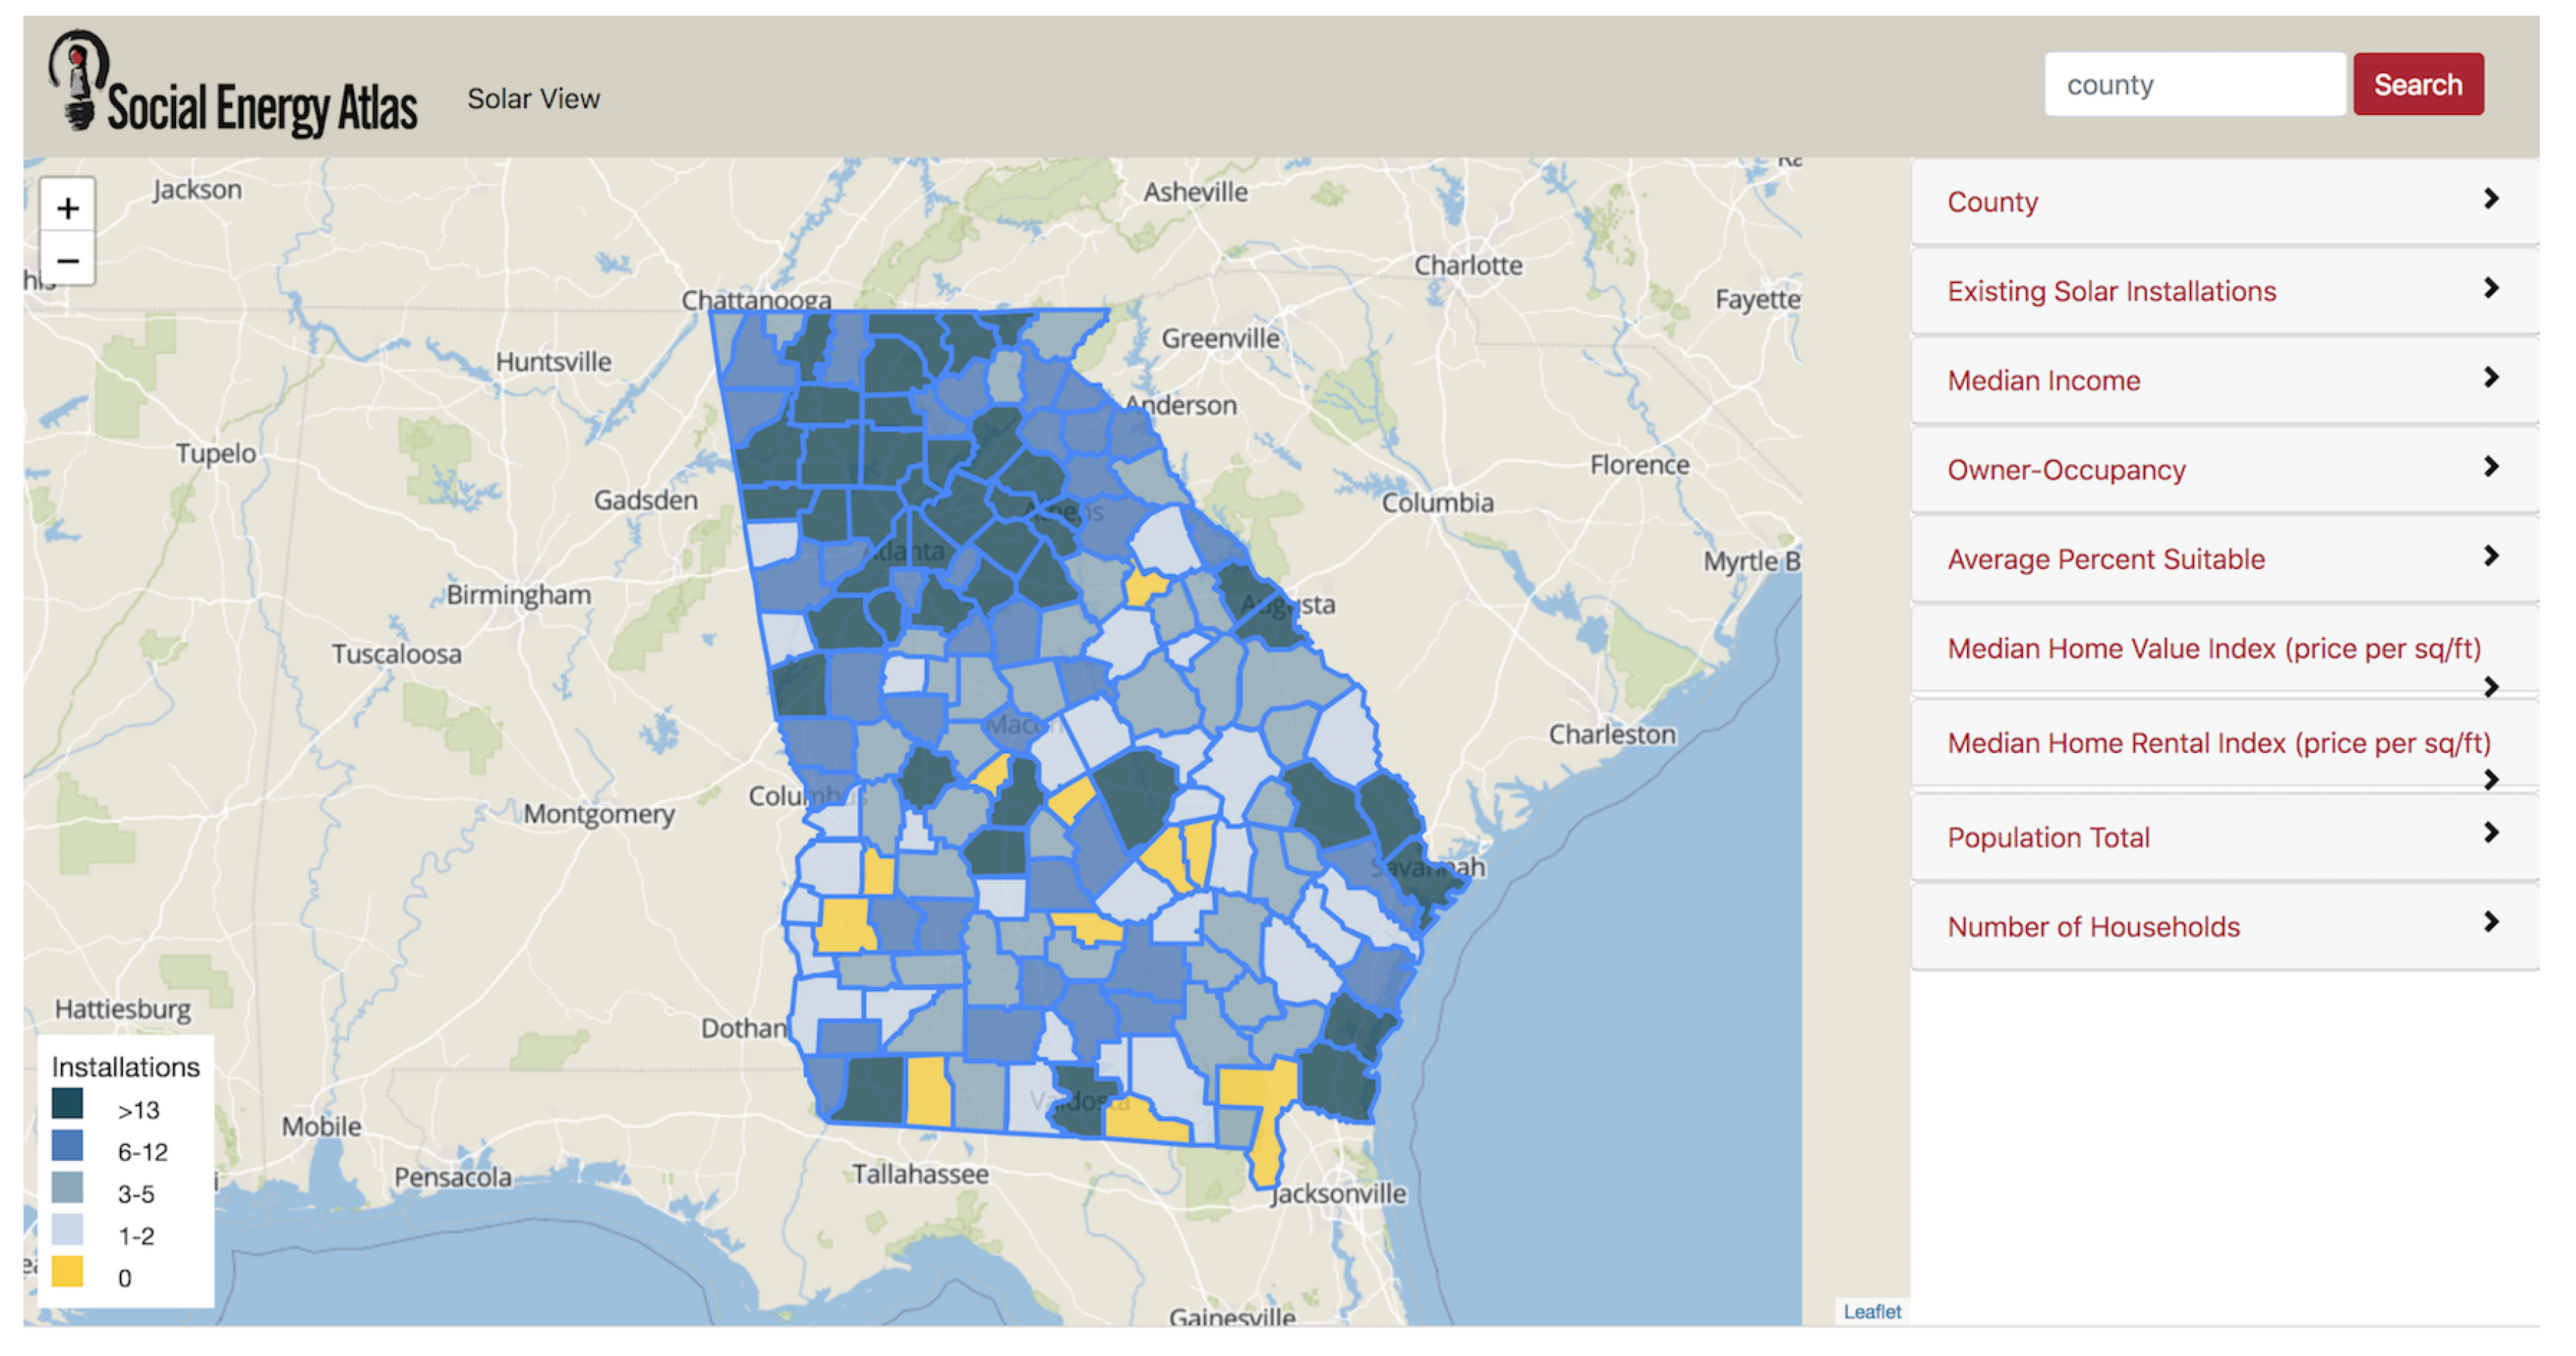
To address the limitation of existing adoption trend datasets at the scale of local governance (e.g., county governments), this data descriptor for SolarView, a web application designed by the Social Energy Atlas (see
Figure 2), depicts how the aggregation of seven independent databases was conducted, so as to afford the Social Energy Atlas the ability to contextualize solar technology adoption at a local level of scale through the analysis of quantitative data for the State of Georgia, U.S., and demonstrate the complexity systems that are currently giving rise to significant disparity in adoption practices in this state using Gini coefficient calculations [
20].
The rest of the paper seeks to describe the dataset that was produced during the first phase of the Social Energy Atlas’ research activities, as well as how it was brought together. In
Section 2, a detailed description of the data comprising SolarView is provided.
Section 3 provides the methods that were employed for curating and reusing the data. Finally, this data descriptor ends with
Section 4, detailing notes for users of this database going forward.
2. Data Description
The data contained within the Supplementary Materials provides a contextually-focused perspective on solar adoption in the State of Georgia, U.S., at the county level and is comprised of nine relational CSV files. While currently, there are no solar installation data points for 11 of Georgia’s 159 counties, this dataset does include contextual data that have been curated for every county. Descriptions of the variables included in the dataset are provided below, while justifications for the curation of this dataset from each data source can be found in
Section 3.
2.1. File Architecture
The Georgia SolarView dataset is a relational database. The .csv files described in this section are related to one another through either zip code or Federal Information Processing Standard (FIPS) ID.
A README file and a copy of
Figure 3 are included in the data archive as well.
2.2. County Identification
The primary variable upon which this dataset is organized is the FIPS code for each county within the State of Georgia. The data within county-name.csv are the basis upon which the entire database is organized.
2.3. Historical County Zip Code Directory
Zip codes, while useful to many social scientists, are a dynamic class of variables constantly being added to, changed, and realigned to different counties per the needs of the U.S. Postal Service [
28]. Thus, a historical directory of zip codes was determined to be necessary for this project, was included for the years 2010–2018, and can be found in sea-zipcode-county.csv.
Table 2.
List of variables included in sea-zipcode-county.csv.
Table 2.
List of variables included in sea-zipcode-county.csv.
| Variable | Description |
|---|
| sea-zip-id | Unique ID for zip code entries |
| zip | Zip code |
| fips | FIPScode for each county |
| year | Year for which a zip code and county relationship is valid |
2.4. Solar Installation Data
For each documented solar installation in the State of Georgia, a series of characteristics was included as part of the data analysis for better understanding the context underlying solar technology adoption on the county level.
Table 3.
List of variables included in sea-solar-installations.csv.
Table 3.
List of variables included in sea-solar-installations.csv.
| Variable | Description |
|---|
| sea-install-id | Unique ID for identifying originating data source |
| zipcode | Zip code for solar installation |
| fips | County FIPS ID of solar installation |
| town | Town or municipality of solar installation |
| state | State of solar installation location |
| system-type | Type of solar system for the installation |
| sector | Sector type for installation location: e.g., residential or utility |
| install-date | Date of installation |
| utility | Utility of the installation |
| federal-cong-dist | Federal Congressional District of installation |
| state-senate-dist | State Senate District of installation |
| state-house-dist | Federal House of Representatives District of installation |
| lat | Latitude of solar installation (key) |
| long | Longitude of solar installation (key) |
As these data were curated from multiple outside sources, their completeness is not guaranteed. Refer to
Section 3.2 for details regarding data verification for this table.
2.5. Solar Rooftop Suitability
Data are also included for better understanding the disparity in the presence of solar installations in the State of Georgia and that relationship in with the degree of rooftop suitability available for each county.
Table 4.
List of variables included in sea-solar-suitability.csv.
Table 4.
List of variables included in sea-solar-suitability.csv.
| Variable | Description |
|---|
| zipcode | Zip code for each rooftop suitability estimation |
| locale | Classification of the nature of the area: e.g., large suburb or fringe rural areas |
| nbld | Number of existing rooftops identified in that location and included in the estimation |
| pct-suitable | Estimated percent suitability of existing rooftops for PV |
2.6. County Demographics
A selected number of U.S. Census Bureau demographic variables were also included for contextual analysis. In addition to the county FIPS ID codes, critical contextual data that were necessary for establishing relationships to socioeconomic status (median income), housing status (percentage of owner occupancy), population density (total population), and race (estimated percentage by racial group) were selected for inclusion in the SolarView database.
Table 5.
List of variables included in sea-county-census.csv.
Table 5.
List of variables included in sea-county-census.csv.
| Variable | Description |
|---|
| fips | County FIPS ID |
| med-income | Median income for the county |
| owner-occ | Estimated percentage of homes occupied by its owner for the county |
| pop-total | Total estimated population for the county |
| dem-fem-pct | Estimated percentage of female residents in the county |
| dem-male-pct | Estimated percentage of male residents in the county |
| dem-white-pct | Estimated percentage of white residents in the county |
| dem-baa-pct | Estimated percentage of black or African American residents in the county |
| dem-aian-pct | Estimated percentage of American Indian or Alaskan Native residents in the county |
| dem-a-pct | Estimated percentage of Asian residents in the county |
| dem-nhpi-pct | Estimated percentage of Native Hawaiian or Pacific Islander residents in the county |
| dem-two-pct | Estimated percentage of residents identifying as being of two or more races in the county |
| dem-hl-pct | Estimated percentage of Hispanic or Latino residents in the county |
| dem-vet | Estimated number of veterans residing in the county |
| dem-hh | Estimated number of households in the county |
2.7. Zillow Indexes
Median home value and rental value indexes are also provided for analysis. Due to the rural nature of Georgia and limited number of available data points for public sales and rental information in some counties, there are not values for all of Georgia’s 159 counties. Refer to
Section 3.2 for details regarding data verification for this table.
Table 6.
List of variables included in sea-county-zillow.csv.
Table 6.
List of variables included in sea-county-zillow.csv.
| Variable | Description |
|---|
| fips | County FIPS ID |
| med-zhvi | Median Zillow Home Value Index |
| med-zrvi | Median Zillow Rental Value Index |
2.8. Renewable Energy Incentives
For each county, there are varying levels of renewable energy incentives documented as being available. The number of active incentives by type are provided in sea-dsire-incentives.csv.
Table 7.
List of variables included in sea-dsire-incentives.csv.
Table 7.
List of variables included in sea-dsire-incentives.csv.
| Variable | Description |
|---|
| fips | County FIPS ID |
| fed-total | Total number of federal incentives |
| fed-fin-incent-total | Total number of federal financial incentives |
| fed-fin-incent-corp-deprec | Number of federal corporate depreciation financial incentives |
| fed-fin-incent-corp-tax-credit | Number of federal corporate tax credit financial incentives |
| fed-fin-incent-corp-tax-deduction | Number of federal corporate tax deduction financial incentives |
| fed-fin-incent-corp-tax-exemption | Number of federal corporate tax exemption financial incentives |
| fed-fin-incent-grant-prog | Number of federal grant program financial incentives |
| fed-fin-incent-loan-prog | Number of federal loan program financial incentives |
| fed-fin-incent-pers-tax-credit | Number of federal personal tax credit financial incentives |
| fed-fin-incent-pers-tax-exemption | Number of federal personal tax exemption financial incentives |
| fed-reg-policy | Total number of federal regulatory policies |
| fed-reg-policy-appeq-eff-stand | Number of federal appliance and equipment efficiency standard regulatory policies |
| fed-reg-policy-energy-stand-build | Number of federal energy standards for public buildings’ regulatory policies |
| fed-reg-policy-gpp | Number of federal green power purchasing regulatory policies |
| fed-reg-policy-interconn | Number of federal interconnection regulatory policies |
| fed-tech-res | Total number of federal technical resources |
| fed-tech-res-energy-analysis | Number of federal energy analysis technical resources |
| fed-tech-res-training-info | Number of federal training information technical resources |
| state-total | Total number of state incentives |
| state-fin-incent-total | Total number of state financial incentives |
| state-fin-incent-grant-prog | Number of state grant program financial incentives |
| state-fin-incent-loan-prog | Number of state loan program financial incentives |
| state-fin-incent-other | Number of state other financial incentives |
| state-fin-incent-PACE-fi | Number of state Property Assessed Clean Energy (PACE) Financing programs
financing financial incentives |
| state-fin-incent-perf-based | Number of state performance-based financial incentives |
| state-fin-incent-rebate | Number of state rebate financial incentives |
| state-fin-incent-sales-tax | Number of state sales tax financial incentives |
| state-reg-policy | Total number of state regulatory policies |
| state-reg-policy-build-energy-code | Number of state building energy code regulatory policies |
| state-reg-policy-energy-stand-build | Number of state energy standards for public buildings’ regulatory policies |
| state-reg-policy-interconn | Number of state interconnection regulatory policies |
| state-reg-policy-net-metering | Number of state building net metering regulatory policies |
| state-reg-policy-solar-wind-access | Number of state solar and wind access regulatory policies |
| state-tech-res | Total number of state technical resources |
| state-tech-res-energy-analysis | Number of state energy analysis technical resources |
| state-tech-res-other | Number of state other technical resources |
| state-tech-res-training-info | Number of state training information technical resources |
2.9. Electric Utilities
As many diverse local governance structures the State of Georgia has, it also has a great number of utilities that help to provide infrastructural resources across the state. There are two files that help to provide information about the utility landscape of this state: a table listing the names and ownership structures of each utility (See
Table 8) and a table listing the utility rates by zip code for the state (See
Table 9).
Table 8.
List of variables included in sea-utility-id.csv.
Table 8.
List of variables included in sea-utility-id.csv.
| Variable | Description |
|---|
| utility-id | Unique identifier for each utility |
| name | Utility name |
| ownership | Ownership type |
Table 9.
List of variables included in sea-utility-rates.csv.
Table 9.
List of variables included in sea-utility-rates.csv.
| Variable | Description |
|---|
| sea-rate-id | Unique identifier for the utility rate for each zip code |
| year | Year for which the rate is provided |
| zip | Zip code for each utility rate |
| utility-id | Unique identifier for each utility |
| service-type | Type of rate service |
| comm-rate | Commercial rate per kWh |
| ind-rate | Industry rate per kWh |
| res-rate | Residential rate per kWh |


