Gridded Population Maps Informed by Different Built Settlement Products


 , ,
, , 

Abstract
:1. Summary
2. Data Description
3. Methods
3.1. Preprocessing of Input Data
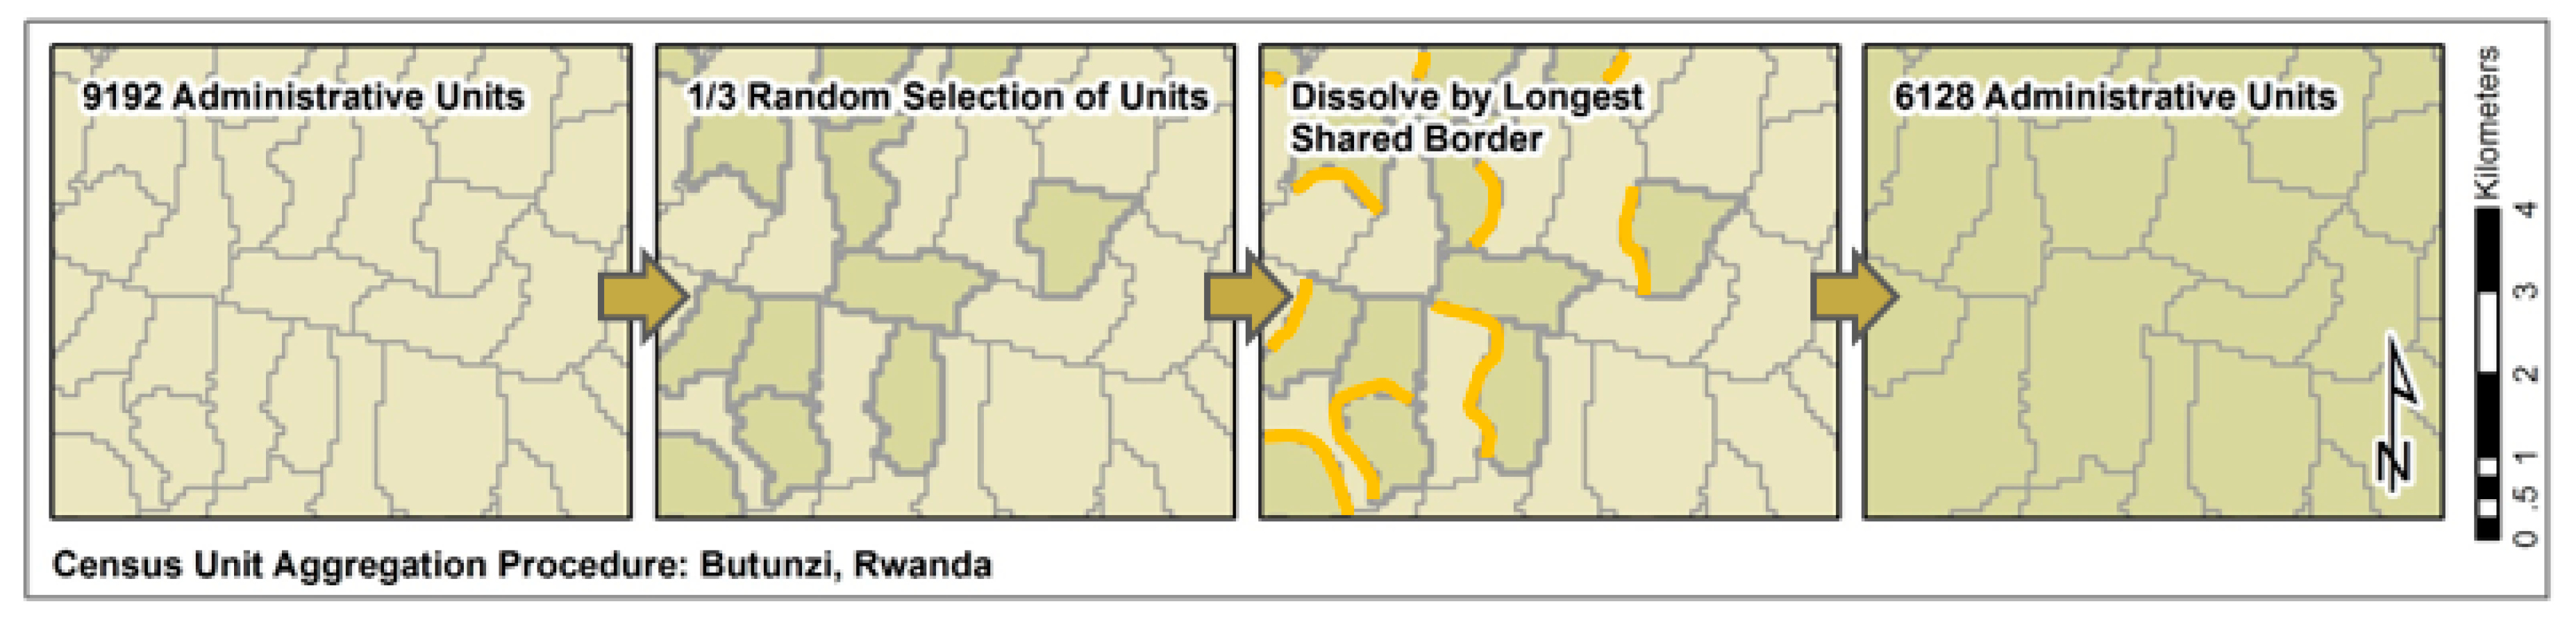
3.1.1. Census Data
3.1.2. Built Area Data
3.1.3. Additional Ancillary Data
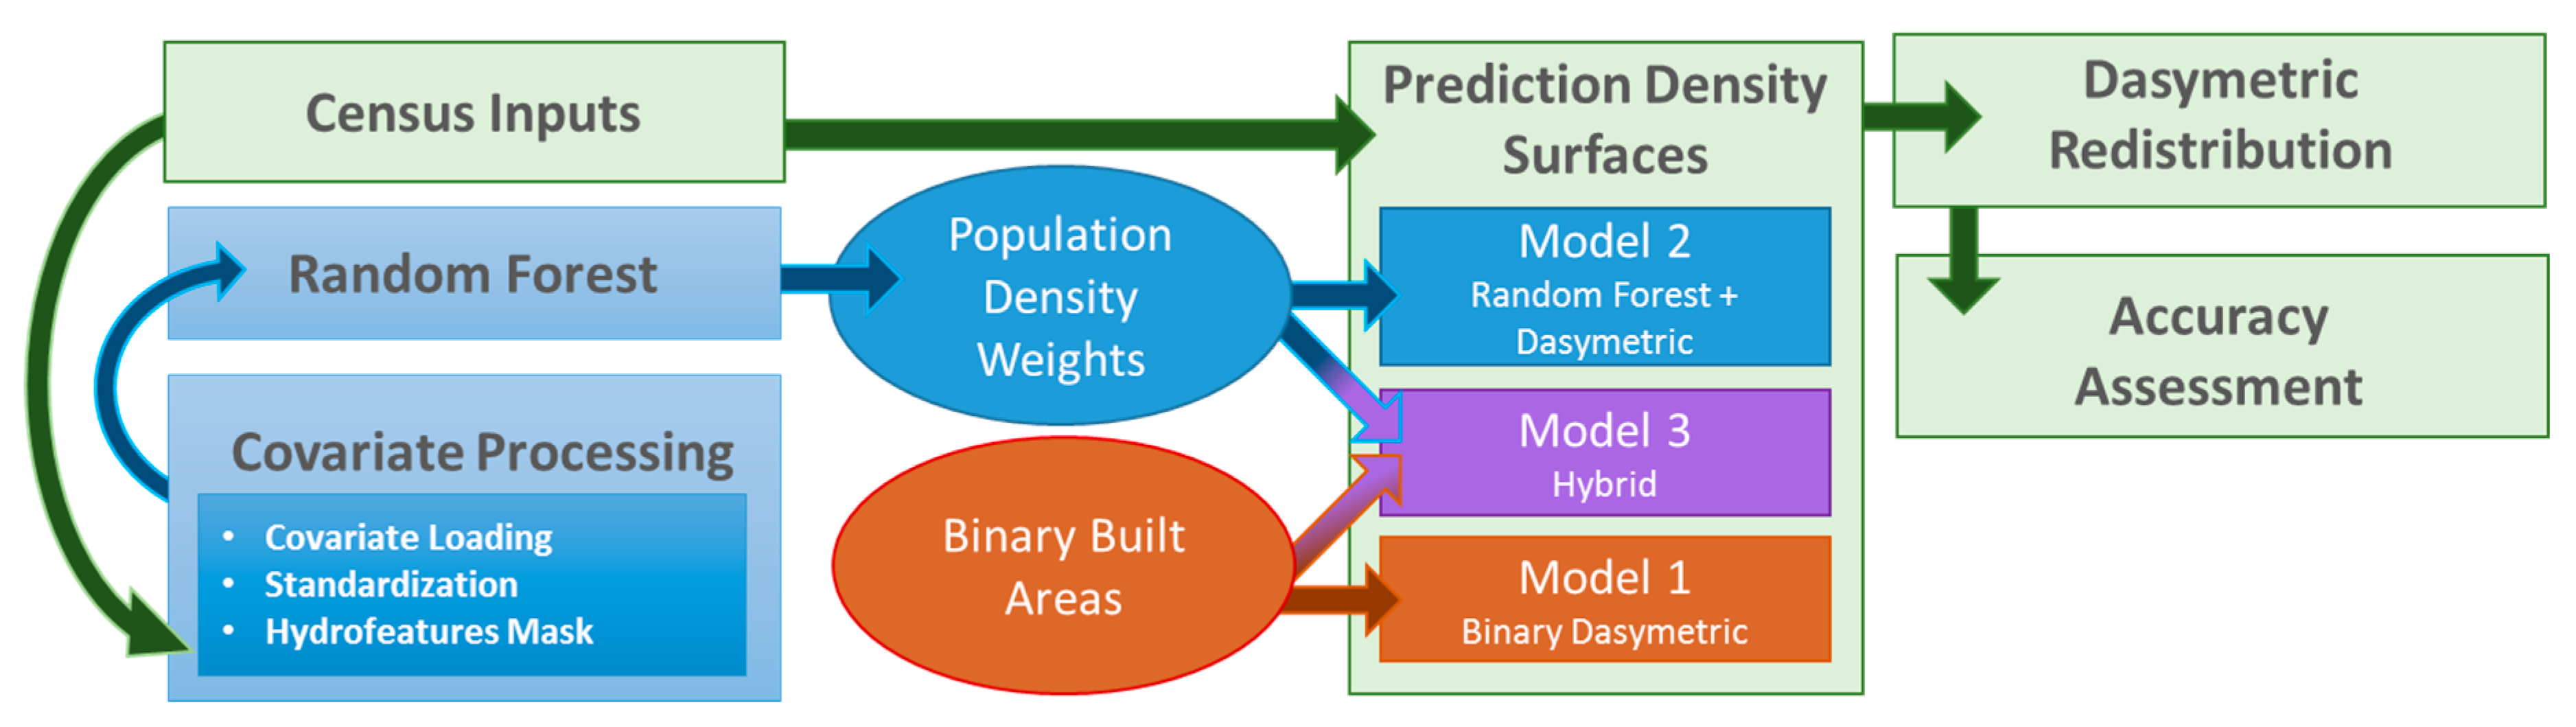
3.2. Data Production Workflow
3.3. Model Types and Construction
3.4. Technical Validation
3.5. Assessment of Gridded Population Datasets
4. User Notes
Supplementary Materials
Author Contributions
Acknowledgments
Conflicts of Interest
References
- UN World Population Prospects: The 2017 Revision. Available online: https://www.un.org/development/desa/publications/world-population-prospects-the-2017-revision.html (accessed on 23 April 2018).
- UN World Urbanization Prospects: The 2014 Revision. Available online: https://esa.un.org/unpd/wup/ (accessed on 23 April 2018).
- Tatem, A.J.; Campiz, N.; Gething, P.W.; Snow, R.W.; Linard, C. The effects of spatial population dataset choice on estimates of population at risk of disease. Popul. Health Metrics 2011, 9, 4. [Google Scholar] [CrossRef] [PubMed]
- Balk, D.; Deichmann, U.; Yetman, G.; Pozzi, F.; Hay, S.; Nelson, A. Determining Global Population Distribution: Methods, Applications and Data. In Advances in Parasitology Global Mapping of Infectious Diseases: Methods, Examples and Emerging Applications; Hay, S.I., Graham, A.J., Rogers, D.J., Eds.; Academic Press: Cambridge, MA, USA, 2007; pp. 119–156. ISBN 978-0120317646. [Google Scholar]
- Hay, S.I.; Noor, A.M.; Nelson, A.; Tatem, A.J. The accuracy of human population maps for public health application. Trop. Med. Int. Health 2005, 10, 1073–1086. [Google Scholar] [CrossRef] [PubMed] [Green Version]
- Linard, C.; Gilbert, M.; Snow, R.W.; Noor, A.M.; Tatem, A.J. Population Distribution, Settlement Patterns and Accessibility across Africa in 2010. PLoS ONE 2012, 7, e31743. [Google Scholar] [CrossRef] [PubMed]
- Bakillah, M.; Liang, S.; Mobasheri, A.; Arsanjani, J.J.; Zipf, A. Fine-resolution population mapping using OpenStreetMap points-of-interest. Int. J. Geog. Inf. Sci. 2014, 28, 1940–1963. [Google Scholar] [CrossRef]
- Mcgranahan, G.; Balk, D.; Anderson, B. The rising tide: Assessing the risks of climate change and human settlements in low elevation coastal zones. Environ. Urban. 2007, 19, 17–37. [Google Scholar] [CrossRef]
- United Nations: Millennium Development Goals. Available online: http://www.un.org/millenniumgoals/ (accessed on 6 July 2018).
- Gaughan, A.; Stevens, F.; Linard, C.; Patel, N.; Tatem, A. Exploring nationally and regionally defined models for large area population mapping. Int. J. Dig. Earth 2014, 8, 989–1006. [Google Scholar] [CrossRef]
- Goodchild, M.F.; Lam, N.S.N. Aerial Interpolation—A Variant of the Traditional Spatial Problem. Geo-Processing 1980, 1, 297–312. [Google Scholar]
- Balk, D.; Yetman, G. The Global Distribution of Population: Evaluating the Gains in Resolution Refinement. Available online: http://citeseerx.ist.psu.edu/viewdoc/download?doi=10.1.1.394.7599&rep=rep1&type=pdf (accessed on 23 April 2018).
- Linard, C.; Tatem, A.J. Large-scale spatial population databases in infectious disease research. Int. J. Health Geogr. 2012, 11, 7. [Google Scholar] [CrossRef] [PubMed] [Green Version]
- Tobler, W.R. Smooth Pycnophylactic Interpolation for Geographical Regions. J. Am. Stat. Assoc. 1979, 74, 519. [Google Scholar] [CrossRef] [PubMed]
- Mennis, J.; Hultgren, T. Intelligent Dasymetric Mapping and Its Application to Aerial Interpolation. Cartogr. Geogr. Inf. Sci. 2006, 33, 179–194. [Google Scholar] [CrossRef]
- Mennis, J. Dasymetric Mapping for Estimating Population in Small Areas. Geogr. Compass 2009, 3, 727–745. [Google Scholar] [CrossRef]
- Tiecke, T.G.; Liu, X.; Zhang, A.; Gros, A.; Li, N.; Yetman, G.; Talip, K.; Murray, S.; Blankespoor, B.; Prydz, E.B.; et al. Mapping the world population one building at a time. arXiv. 2017. Available online: https://arxiv.org/abs/1712.05839 (accessed on 23 April 2018).
- Willmott, C.J.; Matsuura, K. Smart Interpolation of Annually Averaged Air Temperature in the United States. J. Appl. Meteorol. 1995, 34, 2577–2586. [Google Scholar] [CrossRef] [Green Version]
- Bhaduri, B.; Bright, E.; Coleman, P.; Urban, M.L. LandScan USA: A high-resolution geospatial and temporal modeling approach for population distribution and dynamics. GeoJournal 2007, 69, 103–117. [Google Scholar] [CrossRef]
- Stevens, F.R.; Gaughan, A.E.; Linard, C.; Tatem, A.J. Disaggregating Census Data for Population Mapping Using Random Forests with Remotely-Sensed and Ancillary Data. PLoS ONE 2015, 10. [Google Scholar] [CrossRef] [PubMed]
- Gridded Population of the World (GPW), v4. Available online: http://sedac.ciesin.columbia.edu/data/collection/gpw-v4 (accessed on 6 July 2018).
- GADM 2018 Database of Global Administrative Areas. Available online: http://www.gadm.org/ (accessed on 8 November 2017).
- DLR, Earth Observation Center. Global Urban Footprint. Available online: https://www.dlr.de/eoc/en/desktopdefault.aspx/tabid-5242/8788_read-27139/sortby-lastname/ (accessed on 8 August 2018).
- Esch, T.; Heldens, W.; Hirner, A.; Keil, M.; Marconcini, M.; Roth, A.; Zeidler, J.; Dech, S.; Strano, E. Breaking new ground in mapping human settlements from space – The Global Urban Footprint. ISPRS J. Photogramm. Remote Sens. 2017, 134, 30–42. [Google Scholar] [CrossRef] [Green Version]
- Pesaresi, M.; Ehrlich, D.; Ferri, S.; Florczyk, A.; Carneiro, F.S.M.; Halkia, S.; Andreea, M.; Kemper, T.; Soille, P.; Syrris, V. Operating Procedure for the Production of the Global Human Settlement Layer from Landsat Data of the Epochs 1975, 1990, 2000, and 2014; Publications Office of the European Union: Luxembourg, 2016. [Google Scholar]
- Facebook Connectivity Lab and Center for International Earth Science Information Network. High Resolution Settlement Layer. University of Columbia: New York, NY, USA. Available online: https://ciesin.columbia.edu/data/hrsl/ (accessed on 27 October 2017).
- DLR, Earth Observation Center. Global Urban Footprint: Methodology. Available online: http://www.dlr.de/eoc/en/desktopdefault.aspx/tabid-9631/16580_read-40465/ (accessed on 27 October 2017).
- Global Human Settlement Layer. Available online: http://ghsl.jrc.ec.europa.eu/ (accessed on 12 July 2018).
- Gros, A.; Tiecke, T. Connecting the World with Better Maps. Available online: https://code.facebook.com/posts/1676452492623525/connecting-the-world-with-better-maps/ (accessed on 22 November 2017).
- Three Global LC Maps for the 2000, 2005 and 2010 Epochs. European Space Agency (ESA): Climate Change Initiative. Available online: https://www.esa-landcover-cci.org/?q=node/158 (accessed on 27 October 2017).
- Elvidge, C.D.; Baugh, K.E.; Zhizhi, M.; Hsu, F.C. Why VIIRS data are superior to DMSP for mapping nighttime lights. Proc. Asia Pac. Adv. Netw. 2013, 35, 62–69. [Google Scholar] [CrossRef]
- Hijmans, R.J.; Cameron, S.E.; Parra, J.L.; Jones, P.G.; Jarvis, A. Very high resolution interpolated climate surfaces for global land areas. Int. J. Climatol. 2005, 25, 1965–1978. [Google Scholar] [CrossRef] [Green Version]
- Lehner, B.; Verdin, K.; Jarvis, A. HydroSHEDS Technical Documentation. Available online: http://www.hydrosheds.org/images/inpages/HydroSHEDS_TechDoc_v1_2.pdf (accessed on 27 October 2017).
- Vector Map (VMap) Level 0. Available online: http://geoengine.nga.mil/geospatial/SW_TOOLS/NIMAMUSE/webinter/rast_roam.html (accessed on 8 November 2017).
- IUCN and UNEP. The World Database on Protected Areas (WDPA). Available online: http://www.protectedplanet.net (accessed on 27 October 2017).
- OpenStreetMap Base Data. Available online: http://www.openstreetmap.org/ (accessed on 27 October 2017).
- Reed, F.J.; Stevens, F.R.; Gaughan, A.E.; Nieves, J. Effectiveness of Remotely Sensed Built Areas to Dasymetrically Constrain Gridded Population Estimates—Script Samples. Available online: http://www.worldpop.org.uk/data/summary/?doi=10.5258/SOTON/WP00643 (accessed on 14 August 2018).
- Fotheringham, A.S.; Rogerson, P.A. GIS and spatial analytical problems. Int. J. Geogr. Inf. Syst. 1993, 7, 3–19. [Google Scholar] [CrossRef]
- Liaw, A.; Wiener, M. Classification and Regression by Random Forest. R News. Available online: http://cran.r-project.org/doc/Rnews/ (accessed on 2 November 2017).
- Rodriguez-Galiano, V.F.; Ghimire, B.; Rogan, J.; Chica-Olmo, M.; Rigol-Sanchez, J.P. An assessment of the effectiveness of a random forest classifier for land cover detection. ISPRS J. Photogramm. Remote Sens. 2012, 67, 93–104. [Google Scholar] [CrossRef]
- Reed, F.; Gaughan, A.; Stevens, F.; Yetman, G.; Tatem, A. Effectiveness of Remotely Sensed Built Areas for Constraining and Modelling Gridded Population Estimates. Remote Sens. 2018. under review. [Google Scholar]
- Chai, T.; Draxler, R.R. Root mean square error (RMSE) or mean absolute error (MAE)? Geosci. Model. Dev. Discuss. 2014, 7, 1525–1534. [Google Scholar] [CrossRef]
- Sorichetta, A.; Hornby, G.M.; Stevens, F.R.; Gaughan, A.E.; Linard, C.; Tatem, A.J. High-resolution gridded population datasets for Latin America and the Caribbean in 2010, 2015, and 2020. Sci. Data 2015, 2, 150045. [Google Scholar] [CrossRef] [PubMed] [Green Version]


| Type | Country | ISO | Census Year (Adm. Lvl.) | Admin Units | Total Pop | ASR |
|---|---|---|---|---|---|---|
| Finest Available | Haiti | HTI | 2015 (3) | 570 | 10,911,819 | 6.9 |
| Madagascar | MDG | 2006 (4) | 17,459 | 20,966,899 | 5.8 | |
| Malawi | MWI | 2008 (3) | 12,666 | 13,053,968 | 2.7 | |
| Nepal | NPL | 2011 (4) | 36,042 | 26,246,586 | 2.0 | |
| Rwanda | RWA | 2002 (4) | 9192 | 9,482,511 | 1.7 | |
| Thailand | THA | 2010 (3) | 7416 | 64,978,504 | 8.3 | |
| 2/3 Aggregate | Haiti | HTI | 2015 | 380 | 10,911,819 | 8.4 |
| Madagascar | MDG | 2006 | 11,639 | 20,966,899 | 7.1 | |
| Malawi | MWI | 2008 | 8444 | 13,053,968 | 3.4 | |
| Nepal | NPL | 2011 | 24,028 | 26,246,586 | 2.5 | |
| Rwanda | RWA | 2002 | 6128 | 9,482,511 | 2.0 | |
| Thailand | THA | 2010 | 4944 | 64,978,504 | 10.2 |
| Built Dataset | Year | Source | Nominal Resolution | Citation |
|---|---|---|---|---|
| WSF | 2015 | Landsat 8, Sentinel1 | 10 m | [24] |
| GHSL | 2014 | Landsat 8 | 38 m | [25] |
| HRSL | 2015 | DigitalGlobe | 0.5 m | [26] |
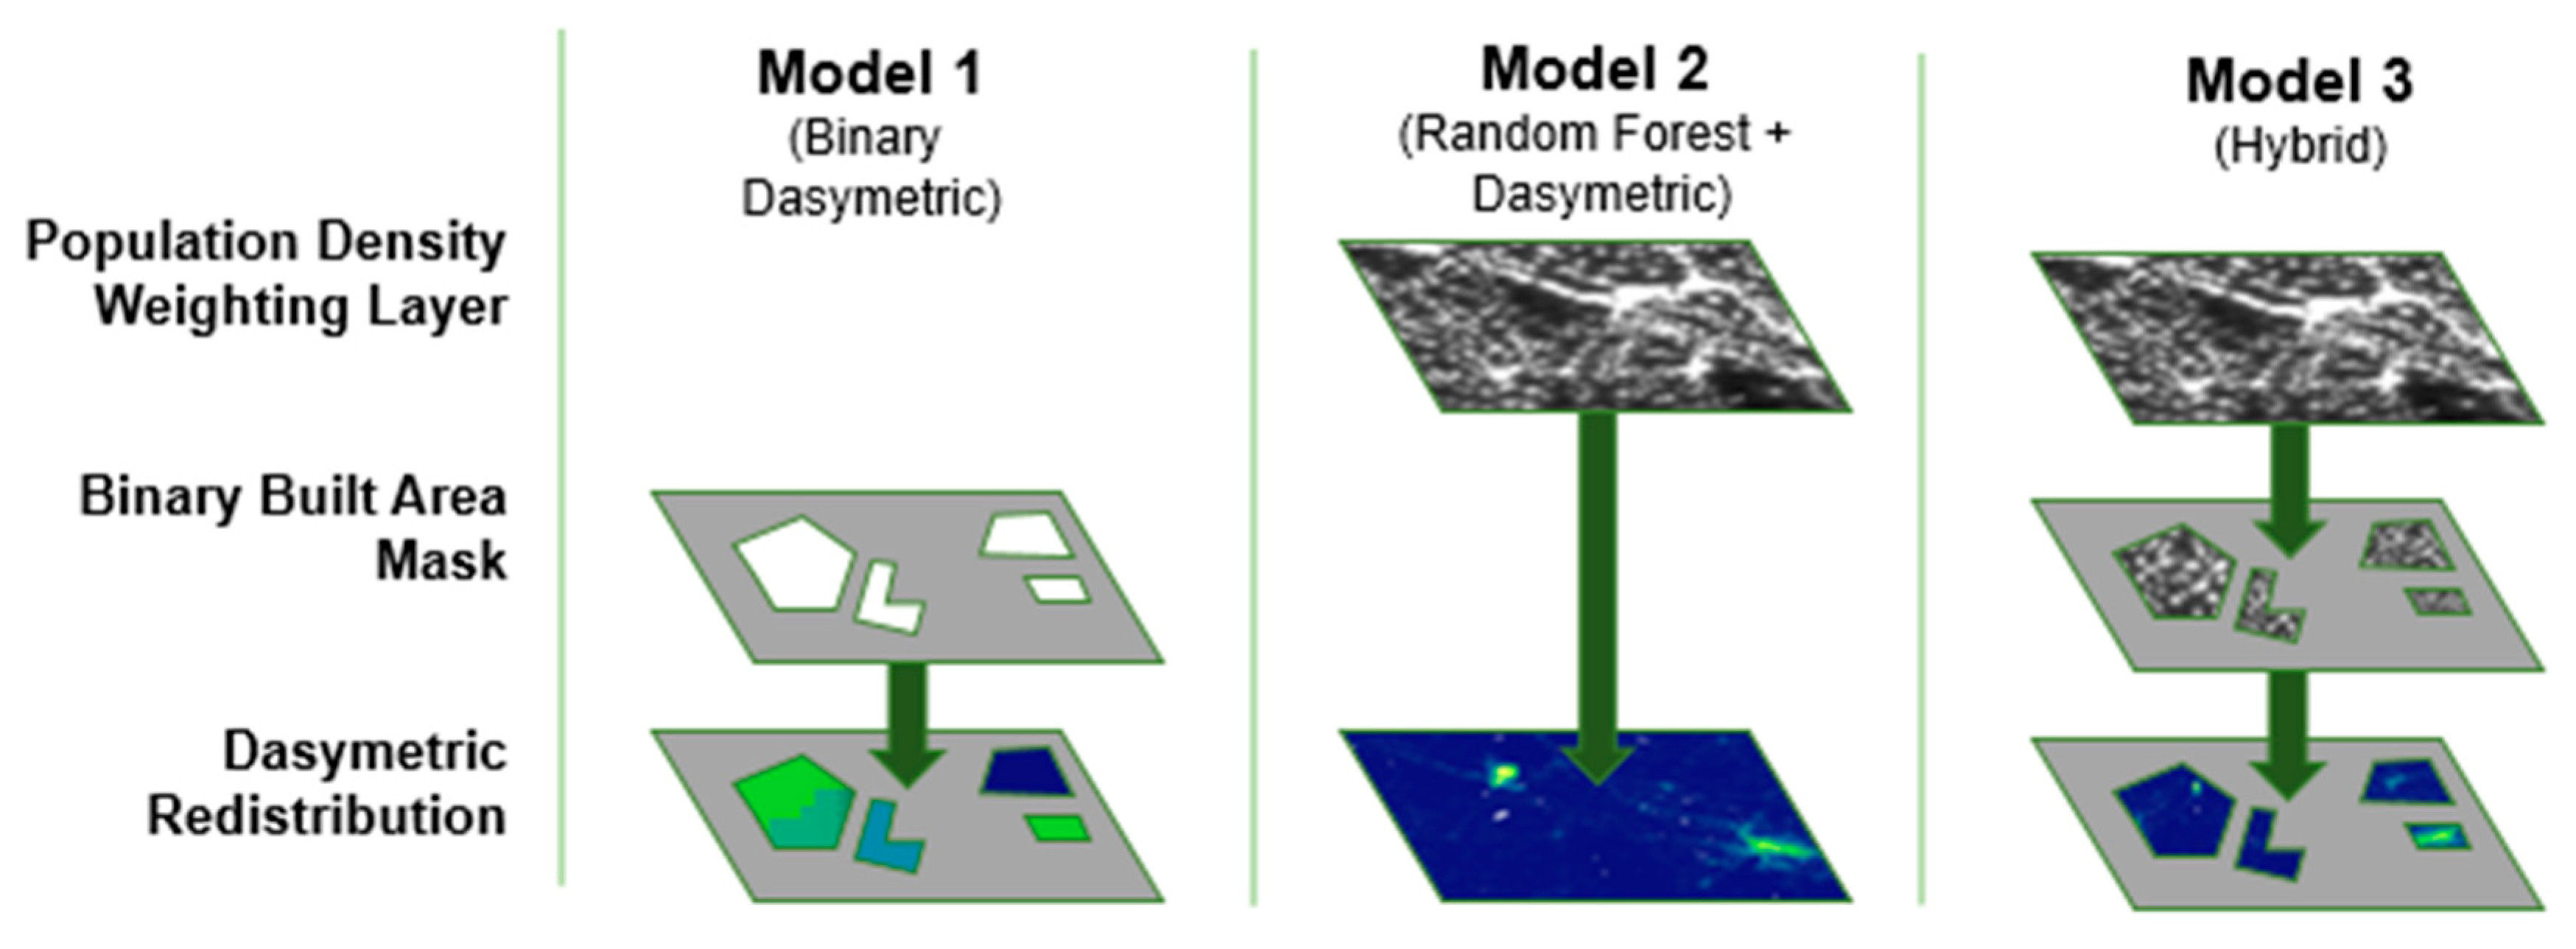
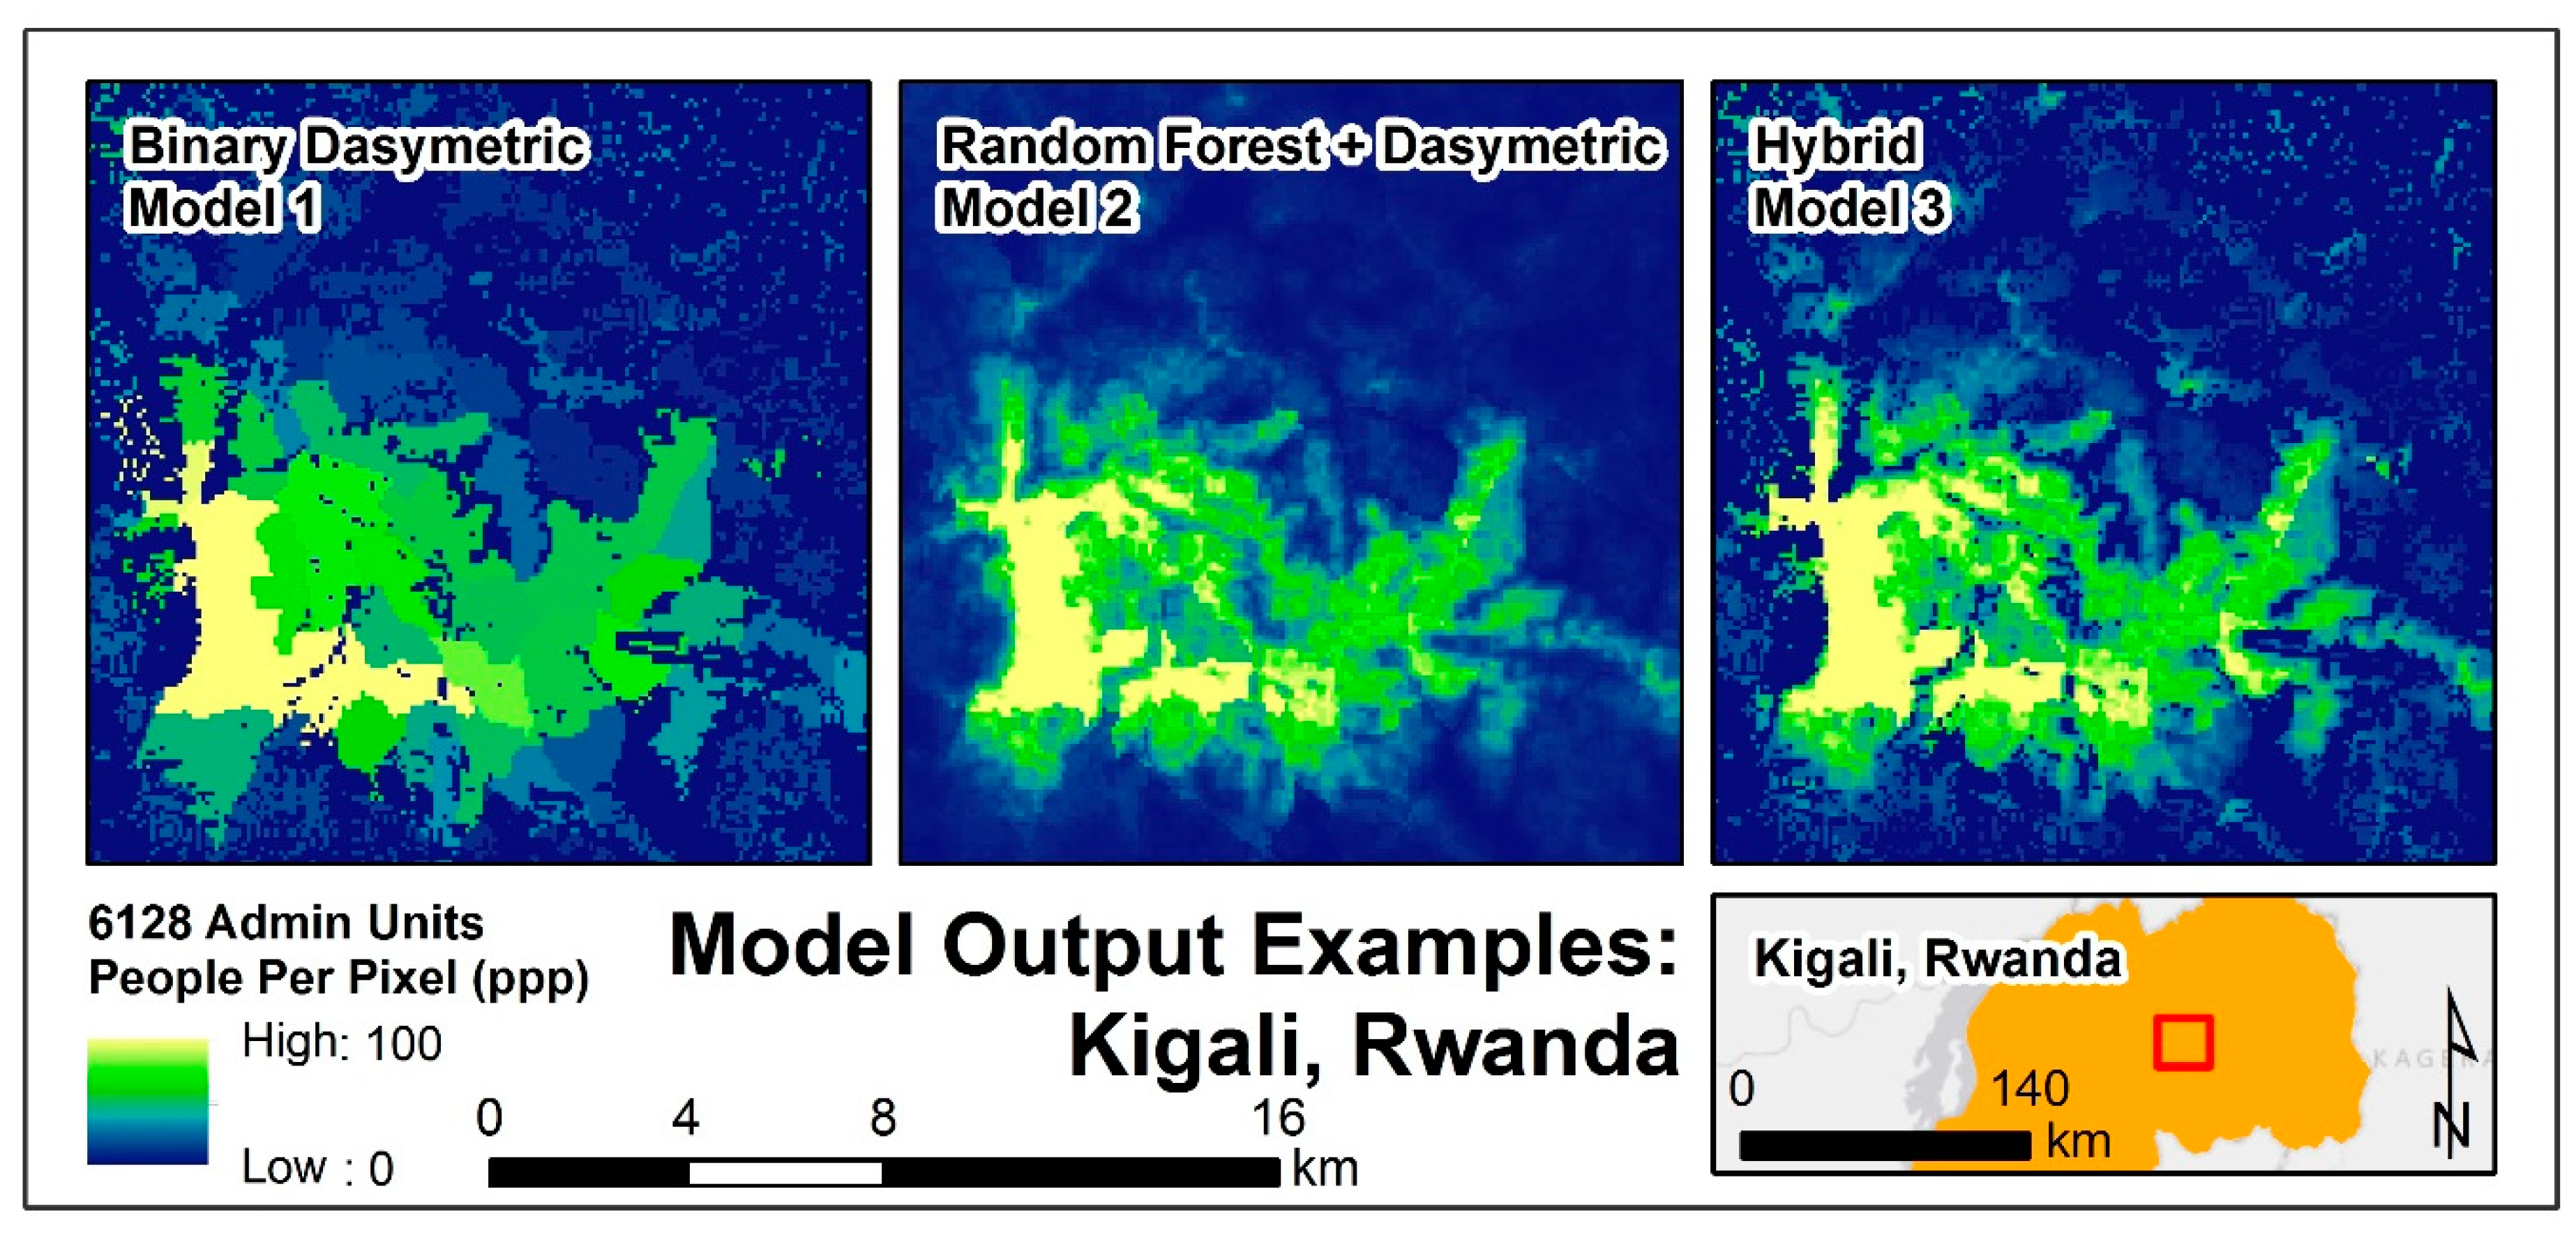
| Model | Name | Description | Raster Type | Output Maps |
|---|---|---|---|---|
| 1 | Binary Dasymetric | Redistribution of population into built areas. | Built Area Restricted | 24 |
| 2 | Random Forest + Dasymetric | Redistribution of population across weighted surface. | Continuous | 6 |
| 3 | Hybrid | Redistribution of population into weighted built areas. | Built Area Restricted | 24 |
| Description | Data Source, Year | Nominal Resolution | Citation | |
|---|---|---|---|---|
| Categorical | Cultivated Terrestrial Lands | ESA CCI Land cover, 2010 | 10 arc-second | [30] |
| Woody/Trees | ||||
| Shrubs | ||||
| Herbaceous | ||||
| Other Terrestrial Vegetation | ||||
| Aquatic Vegetation | ||||
| Urban Area | ||||
| Bare Area | ||||
| Waterbodies | ||||
| Continuous Raster | Lights at Night | Suomi VIIRS-Derived, 2012 | 15 arc-second | [31] |
| Mean Temperature | WorldClim/BioClim, 1950–2000 | 30 arc-second | [32] | |
| Mean Precipitation | WorldClim/BioClim, 1950–2000 | 30 arc-second | ||
| Elevation | HydroSHEDS, 2000 | 3 arc-second | [33] | |
| Slope | HydroSHEDS, 2000 | |||
| Built Distance to Outer Edge | WSF, 2015 | 10 m | [24] | |
| Built Distance to Outer Edge | GHSL, 2014 | 38 m | [25] | |
| Built Distance to Outer Edge | HRSL, 2015 | 5 m | [26] | |
| Converted Vector | Generic Populated Places | VMAP0 merged, 1979–1999 | NA | [34] |
| Distance to Protected Areas | WDPA, IUCN, 2012 | [35] | ||
| Distance to Roads | OSM, 2017 | [36] | ||
| Distance to Rivers/Streams | OSM, 2017 | |||
| Distance to Waterbodies | OSM, 2017 | |||
| Cities | OSM, 2017 | |||
| Villages | OSM, 2017 | |||
| Buildings | OSM, 2017 |
| Model | Built Area | RMSE | MAE | RMSE Density | MAE Density | Model | Built Area | RMSE | MAE | RMSE Density | MAE Density | ||||
|---|---|---|---|---|---|---|---|---|---|---|---|---|---|---|---|
| (a) | Dasymetric Masked | HRSL | 12861.2 | 3281 | 8.1 | 1.6 | Haiti | (b) | Dasymetric Masked | HRSL | 777.4 | 245.9 | 32.9 | 3.9 | Madagascar |
| Dasymetric Masked | GHSL | 13733.9 | 4807.7 | 8.5 | 2.1 | Dasymetric Masked | GHSL | 1142.1 | 401 | 33.5 | 4.8 | ||||
| Dasymetric Masked | WSF | 12206.1 | 4051.2 | 8.3 | 1.8 | Dasymetric Masked | WSF | 887.4 | 371.6 | 34.3 | 4.3 | ||||
| Dasymetric Masked | COMBO | 13148.8 | 3341.2 | 8.3 | 1.6 | Dasymetric Masked | COMBO | 835.1 | 252.9 | 36.1 | 4.3 | ||||
| Random Forest + Dasymetric | 11083.9 | 3021.8 | 7.3 | 1.5 | Random Forest + Dasymetric | 934.5 | 287.9 | 37.6 | 4.7 | ||||||
| Hybrid | HRSL | 11935.6 | 3061.9 | 7.9 | 1.5 | Hybrid | HRSL | 727.2 | 256.6 | 37.1 | 3.9 | ||||
| Hybrid | GHSL | 12823.1 | 4779 | 8.1 | 2 | Hybrid | GHSL | 1130.1 | 403.3 | 33.1 | 4.8 | ||||
| Hybrid | WSF | 12267.5 | 4548.4 | 8.1 | 2 | Hybrid | WSF | 897.2 | 380.4 | 33.7 | 4.3 | ||||
| Hybrid | COMBO | 11897.6 | 3116.8 | 7.9 | 1.5 | Hybrid | COMBO | 782.4 | 271.4 | 39.3 | 4.2 | ||||
| (c) | Dasymetric Masked | HRSL | 549.1 | 225.2 | 31.1 | 5 | Malawi | (d) | Dasymetric Masked | HRSL | 456.3 | 176.2 | 22 | 3.7 | Nepal |
| Dasymetric Masked | GHSL | 722.5 | 337.9 | 28 | 5.5 | Dasymetric Masked | GHSL | 638.2 | 205 | 27.4 | 4.6 | ||||
| Dasymetric Masked | WSF | 700.5 | 345 | 27.5 | 5.4 | Dasymetric Masked | WSF | 533 | 217.8 | 23.6 | 4.4 | ||||
| Dasymetric Masked | COMBO | 615.4 | 238.3 | 30.4 | 5.3 | Dasymetric Masked | COMBO | 452 | 173.6 | 21.9 | 3.7 | ||||
| Random Forest + Dasymetric | 567.6 | 213.6 | 27.7 | 4.8 | Random Forest + Dasymetric | 412.5 | 140.8 | 21.8 | 3.4 | ||||||
| Hybrid | HRSL | 529 | 233.7 | 30.2 | 4.9 | Hybrid | HRSL | 452.6 | 186.7 | 22.4 | 3.9 | ||||
| Hybrid | GHSL | 699.1 | 340.5 | 27.1 | 5.5 | Hybrid | GHSL | 645.5 | 209 | 27.6 | 4.6 | ||||
| Hybrid | WSF | 705.9 | 354.3 | 27.1 | 5.5 | Hybrid | WSF | 540.1 | 224.5 | 23.9 | 4.6 | ||||
| Hybrid | COMBO | 545.3 | 236.2 | 28.5 | 4.9 | Hybrid | COMBO | 448.5 | 185.2 | 21.9 | 3.8 | ||||
| (e) | Dasymetric Masked | HRSL | 390.9 | 146.7 | 11.3 | 1.7 | Rwanda | (f) | Dasymetric Masked | HRSL | 4040.9 | 1160.3 | 9.8 | 1.5 | Thailand |
| Dasymetric Masked | GHSL | 593.3 | 286.3 | 11.7 | 2.7 | Dasymetric Masked | GHSL | 4048.7 | 1493.2 | 9 | 1.5 | ||||
| Dasymetric Masked | WSF | 575.1 | 271.7 | 11.9 | 2.7 | Dasymetric Masked | WSF | 3986.7 | 1208.1 | 9.4 | 1.5 | ||||
| Dasymetric Masked | COMBO | 398.9 | 149.1 | 11.5 | 1.7 | Dasymetric Masked | COMBO | 4257.1 | 1183.5 | 10.9 | 1.6 | ||||
| Random Forest + Dasymetric | 343.4 | 110.3 | 11.1 | 1.4 | Random Forest + Dasymetric | 3802.9 | 1139.5 | 9.9 | 1.4 | ||||||
| Hybrid | HRSL | 376.3 | 153.2 | 10.7 | 1.7 | Hybrid | HRSL | 3697.2 | 1278.9 | 8.6 | 1.3 | ||||
| Hybrid | GHSL | 595.7 | 291.4 | 11.4 | 2.7 | Hybrid | GHSL | 4279 | 1789 | 8.3 | 1.6 | ||||
| Hybrid | WSF | 579 | 273.9 | 11.6 | 2.7 | Hybrid | WSF | 3932.4 | 1462.8 | 8.3 | 1.4 | ||||
| Hybrid | COMBO | 386.1 | 157.7 | 11 | 1.7 | Hybrid | COMBO | 3809.1 | 1299.5 | 9.6 | 1.4 | ||||
| Model | Built Area | RMSE | MAE | RMSE Density | MAE Density | Model | Built Area | RMSE | MAE | RMSE Density | MAE Density |
| Country | Variance Explained | Country | Variance Explained |
|---|---|---|---|
| Haiti | 52.4 | Nepal | 82.12 |
| Madagascar | 78.96 | Thailand | 84.49 |
| Malawi | 72.27 | Rwanda | 73.07 |
© 2018 by the authors. Licensee MDPI, Basel, Switzerland. This article is an open access article distributed under the terms and conditions of the Creative Commons Attribution (CC BY) license (http://creativecommons.org/licenses/by/4.0/).
Share and Cite
Reed, F.J.; Gaughan, A.E.; Stevens, F.R.; Yetman, G.; Sorichetta, A.; Tatem, A.J. Gridded Population Maps Informed by Different Built Settlement Products. Data 2018, 3, 33. https://doi.org/10.3390/data3030033
Reed FJ, Gaughan AE, Stevens FR, Yetman G, Sorichetta A, Tatem AJ. Gridded Population Maps Informed by Different Built Settlement Products. Data. 2018; 3(3):33. https://doi.org/10.3390/data3030033
Chicago/Turabian StyleReed, Fennis J., Andrea E. Gaughan, Forrest R. Stevens, Greg Yetman, Alessandro Sorichetta, and Andrew J. Tatem. 2018. "Gridded Population Maps Informed by Different Built Settlement Products" Data 3, no. 3: 33. https://doi.org/10.3390/data3030033