1. Introduction
Recent progress in sensor development results in increasing interest in recording and analyzing movement in team sports. In this article, we focus on team sports than can be classified as invasive team ball games with two opposing teams competing against each other and trying to score more points than the opponent to win a game. We have chosen this specific focus for two reasons. First, while the interaction of opposing teams in invasive team sports makes the analysis of sports data more challenging, it also opens up more opportunities for findings. Second, many of the world’s most popular team sports, e.g., soccer, football, basketball, hockey, rugby, handball, etc. are invasive. Due to the popularity of these sports, the availability of corresponding data sets and the interest in their analysis are currently on the rise. Professional team sport companies invest substantial resources to analyze the own team’s performance as well as the performance of future opposing teams. Various aspects and several data sources are important descriptors for the performance of a team. In practice, some of these data sets are kept confidential by respective stakeholders, e.g., when they contain exact movement trajectories. Other data sets, e.g., basic statistics, are publicly available for analysis purposes (see
Section 2.1 for several examples).
Depending on the available data, different analysis tasks can be executed. Analysts usually do not only want to have information about the what (e.g., “Team A won against Team B” or “Player X passed more often than player Y”) but instead want to investigate the why behind these facts. There is a need to understand why a certain movement happened and what the influencing factors were. For example, why did a player decide to move to Point A instead of Point B and what influence did this movement decision have on members of the own and opposing teams. The results of such analyses will help, e.g., in scouting or training. However, analysis often focuses on pure statistical approaches. For decades, movement and tactical analysis has been done manually by inspecting video recordings of past matches.
In this article, we give an overview of how to work with team sport data in general. Therefore, we introduce the various data types that are available and relevant for team sport analytics. Furthermore, we highlight the challenges that need to be overcome when gathering and working with team sport data. We focus on the different research aspects arising as displayed in
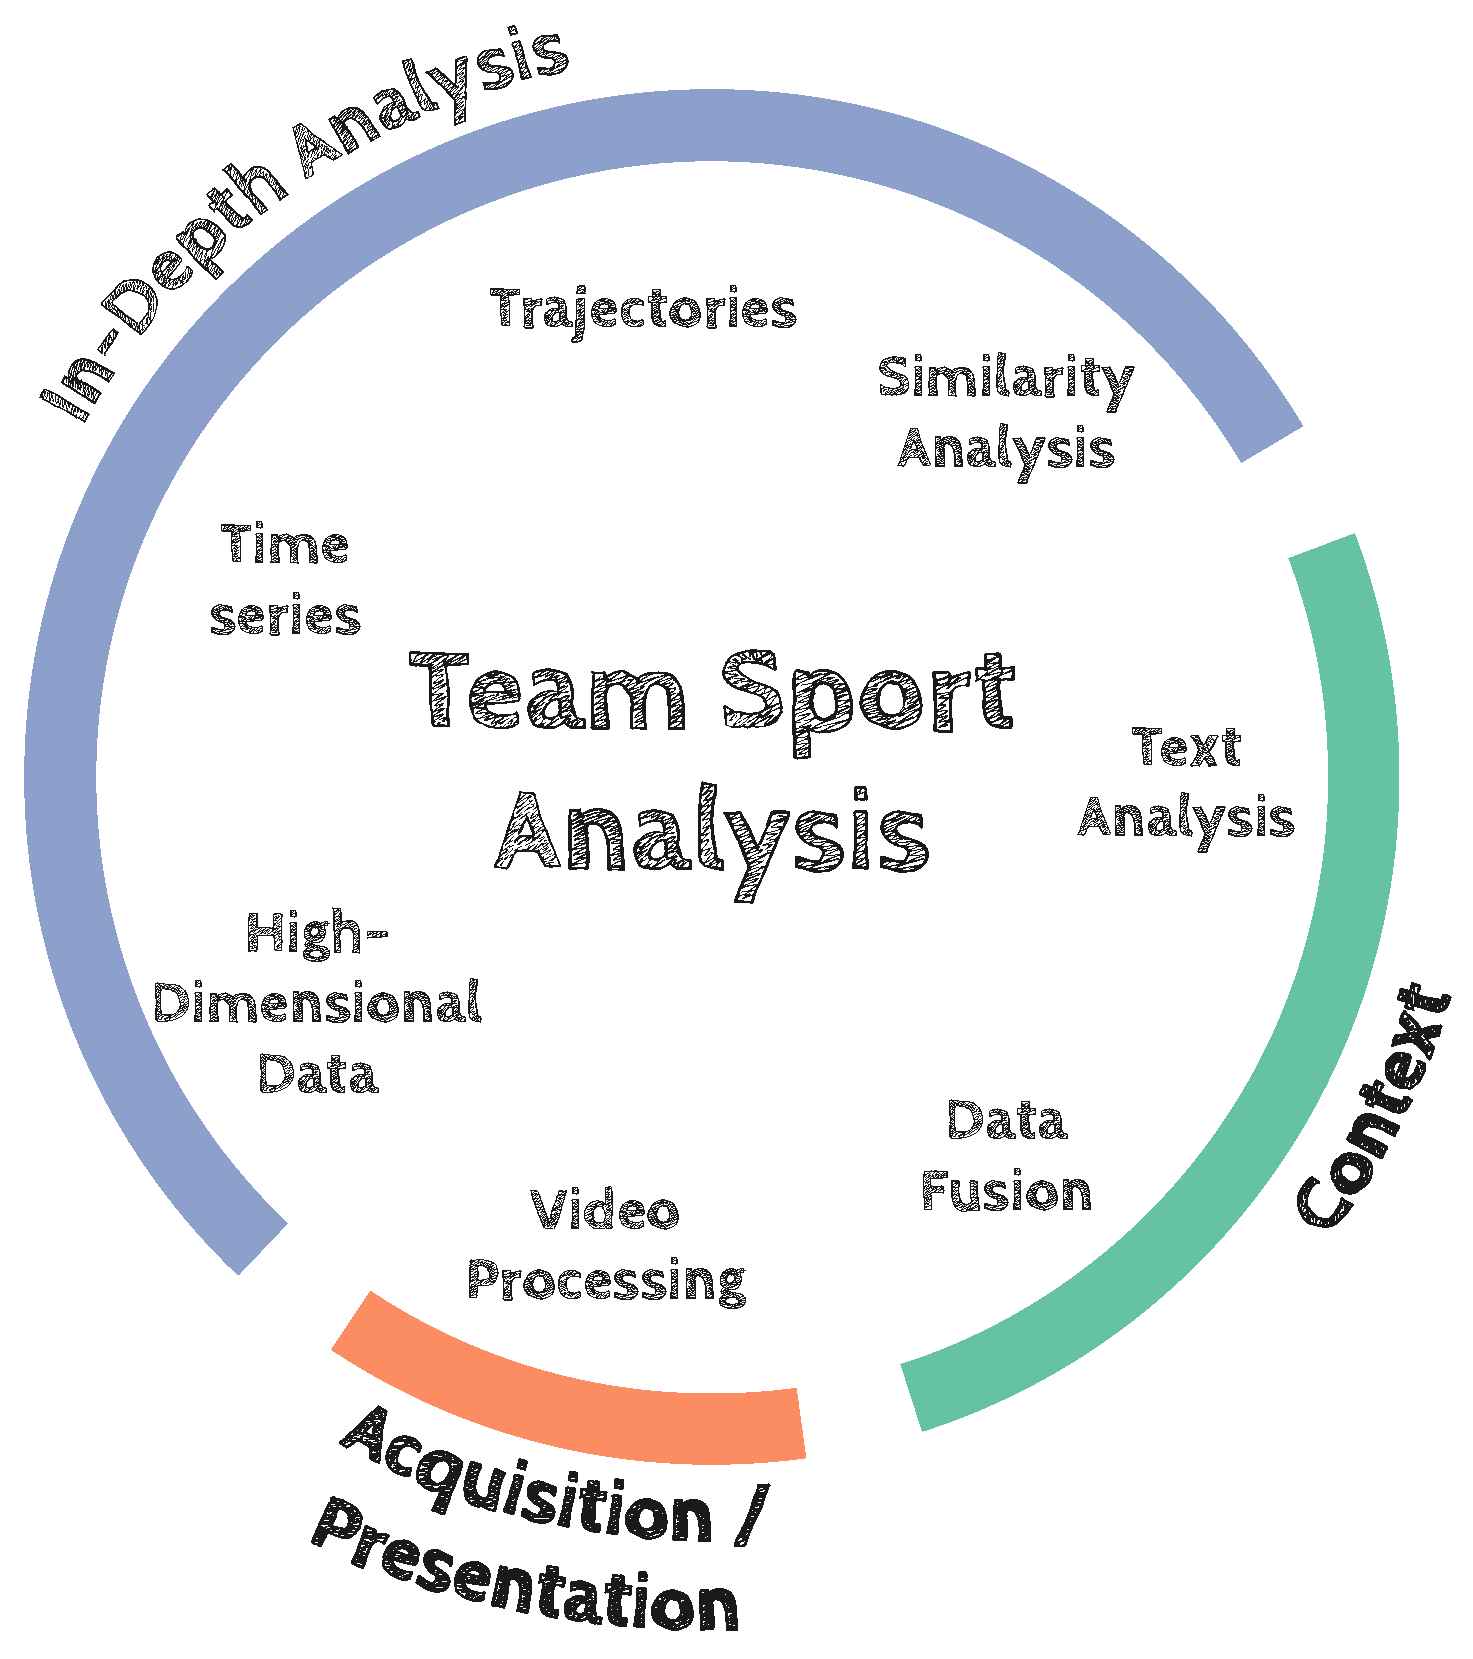
Figure 1 with respect to the set of heterogeneous data.
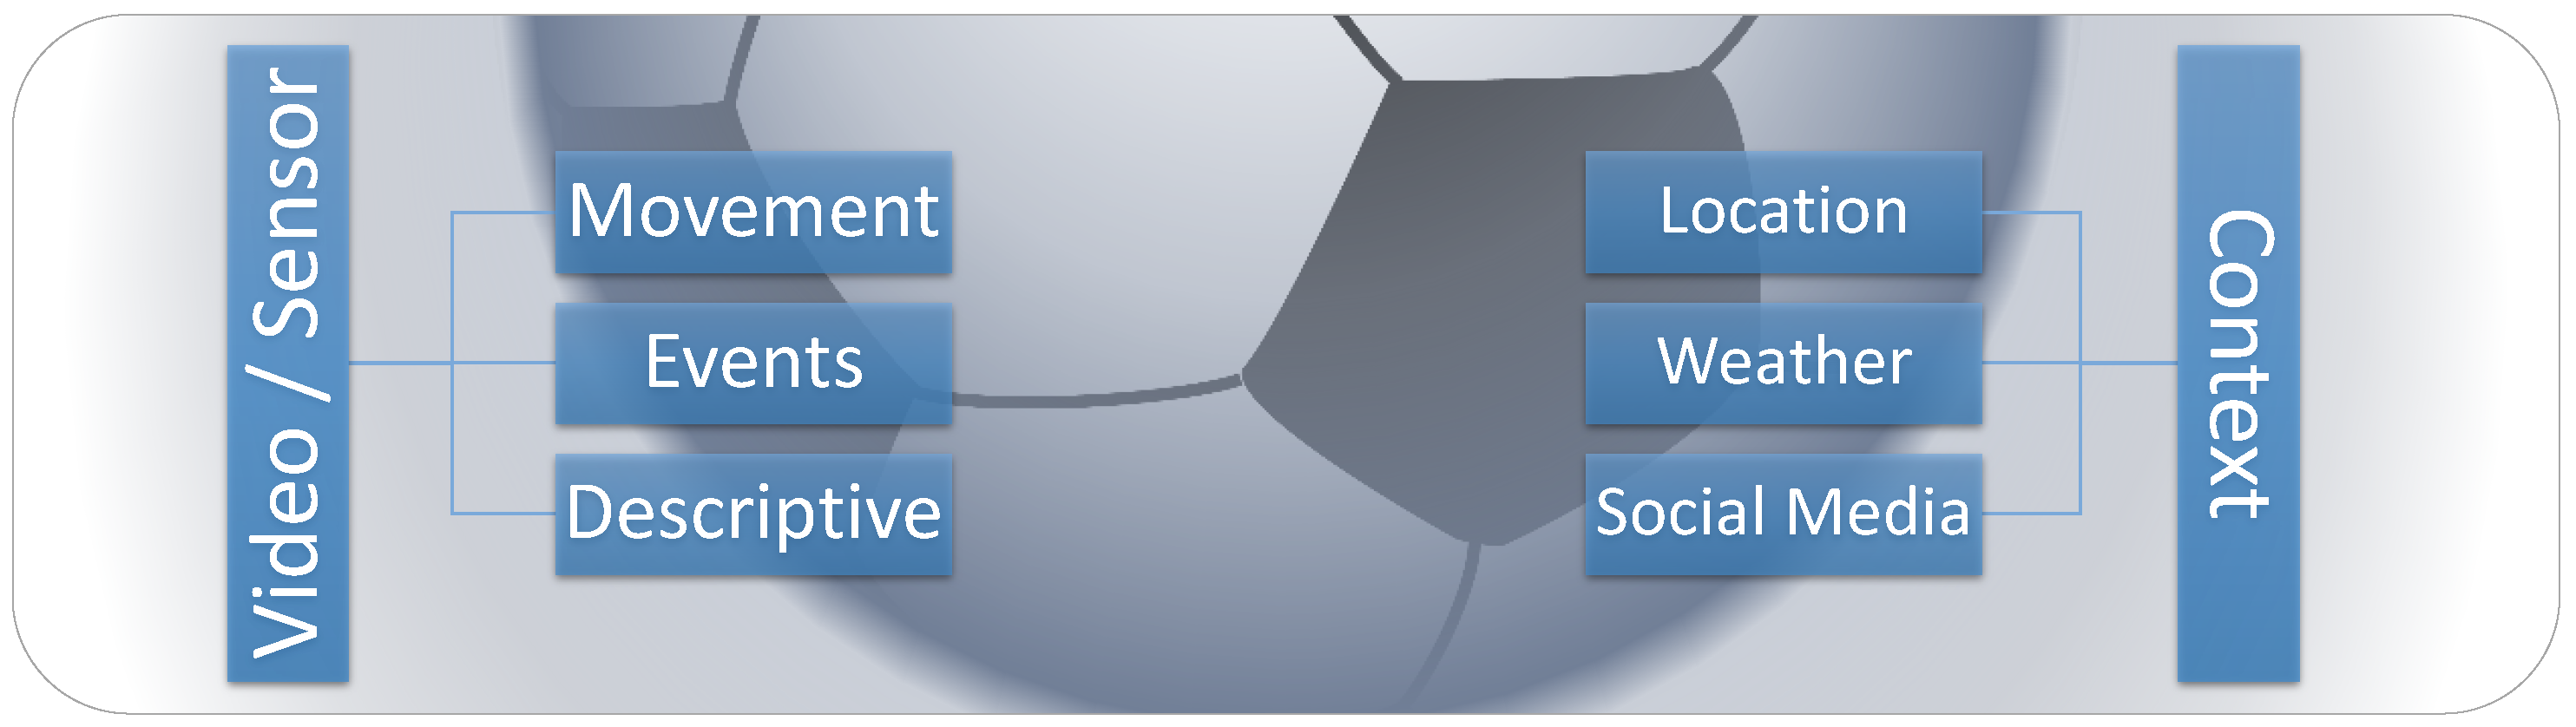
Figure 1 shows that the arising research aspects can be grouped into specific domains. Data acquisition describes what needs to be done at first to get the data, e.g., through video processing. The context domain allows us to enrich the data (e.g., through data fusion) after the acquisition with useful additional information. After data acquisition and enrichment the analysis domain allows us to search for patterns. The resulting team sport analysis is on the basis of high-dimensional data that contains time series as well as trajectory data.
We show which general computer science problems can be addressed while working on team sport data and propose our methodology to handle these challenges. Ultimately, research on team sport analytics not only influences the sport domain but other fields as well. We will describe the impacts on other sciences such as biology with a focus on collective behavior analysis. Throughout this article, we will use soccer as a prime example for our proposed methodology since it is a highly popular team sport. Nevertheless, we present a general overview of data, methods, and tasks that are applicable to all invasive team ball games. We contribute a concise description of the enablers for data-driven sports analysis. We will start with sensing the team sport by relevant sensors and data sources. By abstracting the data space, we can reveal general research aspects being related to data mining and visualization. We will identify Visual Analytics as an important analysis methodology when dealing with such complex and heterogeneous data analysis questions by analyst users in interactive systems.
3. Abstracting the Data Space
We described the multitude of facets and aspects of data in team sports in the sections above and pointed to the heterogeneity of recorded team sport events. However, what we still need to discuss are the abstract ingredients of team sport. We investigate the nested abstraction levels depicted in
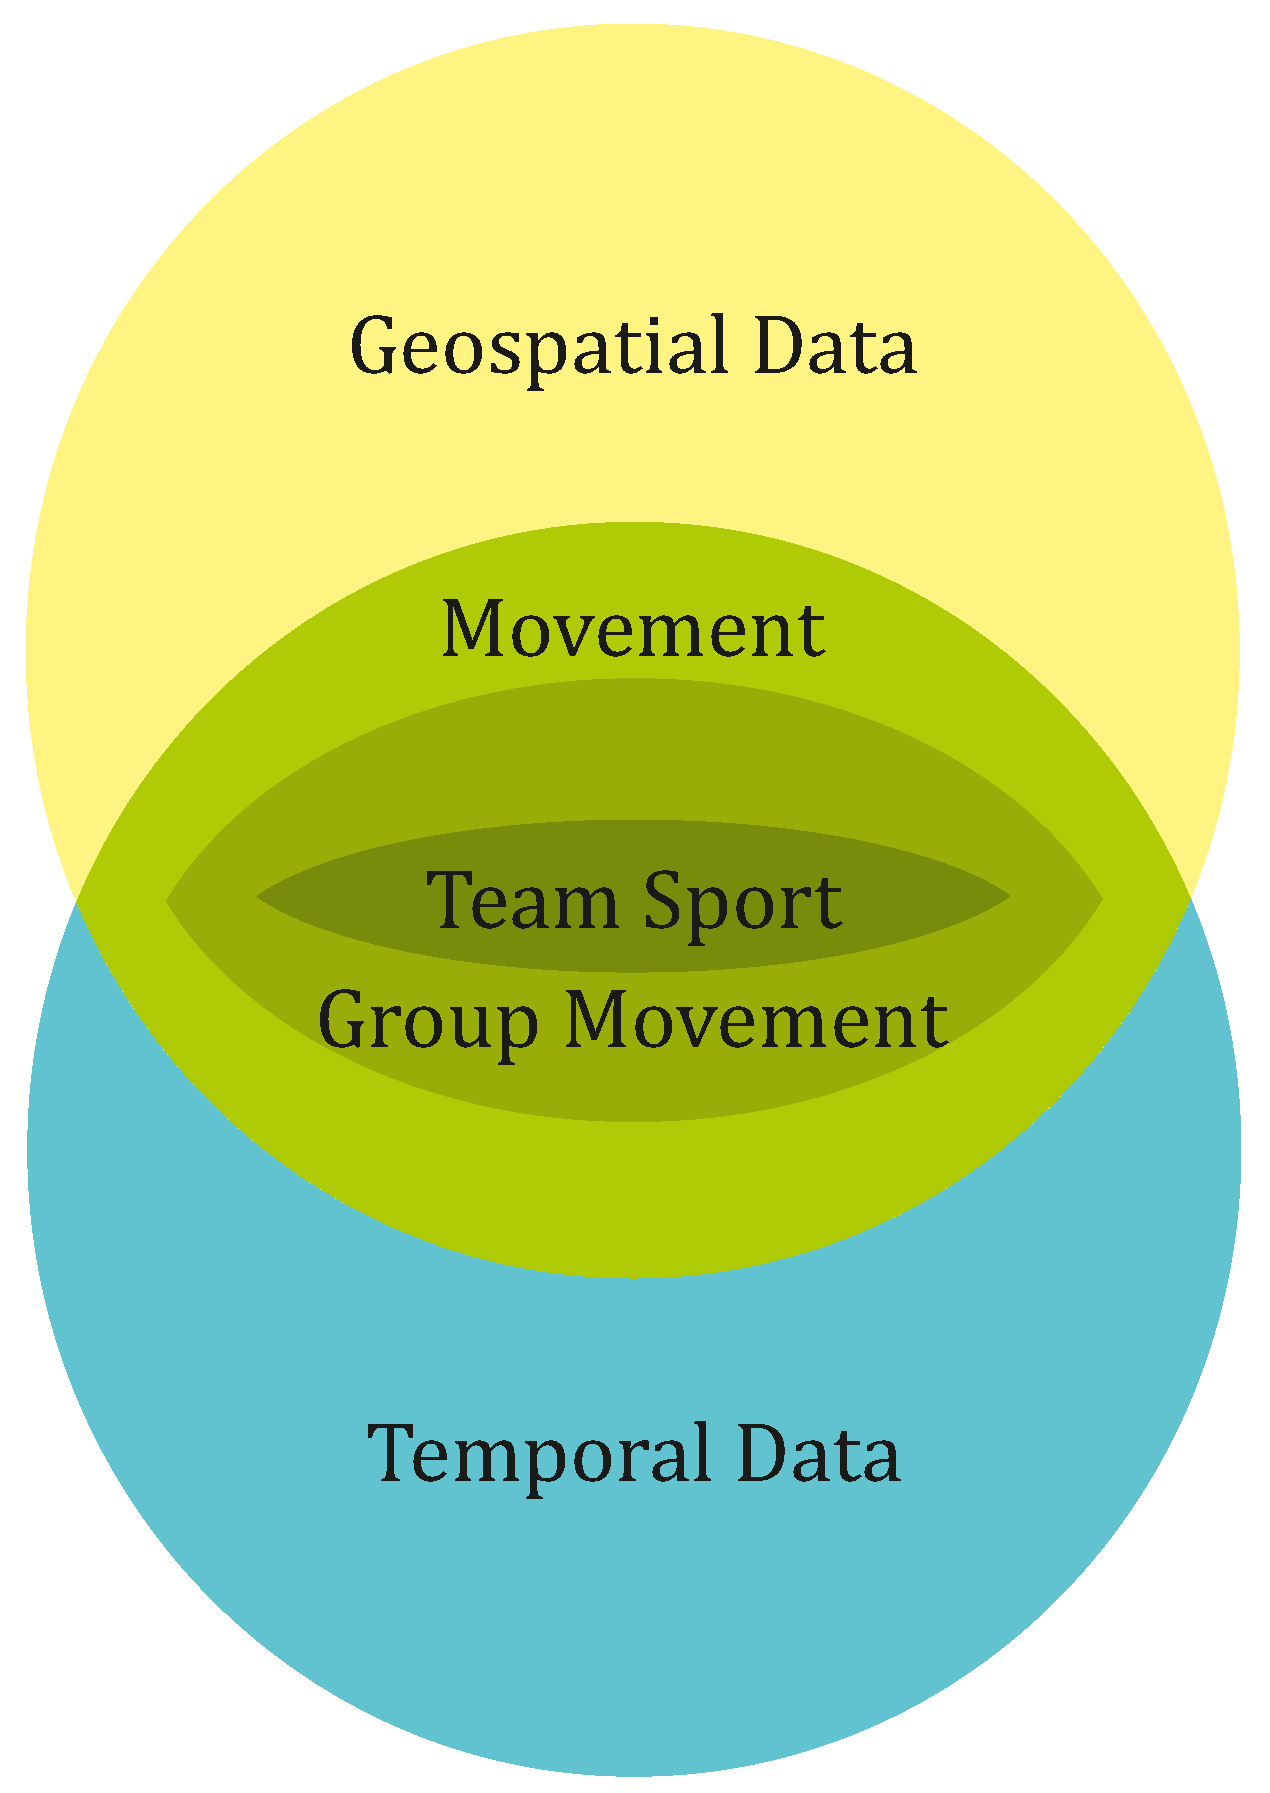
Figure 4 following a bottom-up approach starting with team sport and going all the way to the basic data types, namely geospatial and temporal data.
In team sport data, there are two competing groups that have opposed predefined objectives, meaning that (if the match did not end in a tie) only one of the two groups can achieve their objective and the other group loses the game. The challenge of analyzing team sport data is that movement is restricted by a pitch and rules, driven by the predetermined objective, and influenced by the movement of own and opposing team players. For illustration purpose, we exemplify these properties in American football: the movement of players and teams is limited to the pitch. The movement of the two opposing groups is clearly driven by a predetermined goal. The group possessing the ball wants to cross “the opposition’s goal line with the ball, or catch or collect the ball in the end zone” [
38]. The counter-objective of the opposing team is to prevent this from happening and to gain possession of the ball. American football is a very good example to illustrate how groups and individuals influence their movement mutually. Examples include the defensive line trying to block the running back (group influencing an individual and vice versa), the offensive line pushing against the defensive line (group influencing group) and corner backs covering the receivers (one individual influencing one individual). Rugby is another example for team sport being analyzed nowadays as shown by Cintia et al. [
39]. Gudmundsson et al. [
40] published recently a comprehensive survey covering several aspects in team sports data. Our paper is aimed at both a survey and a concept paper, and our main goal is to widen the scope of considerations for team sports analysis as compared to previous surveys. We build on top of this survey by discussing the possible manifold data sources and their influences on the analysis process, hence widening traditional sensor data-based analysis schemes. As we point out, existing techniques often stem from the machine learning side, and may underweight the importance of visual-interactive interfaces for understanding team sport data and bringing background knowledge to the analysis. Therefore, we show several examples for Visual Analytics interfaces dealing with team sport data, to inspire thinking about possible user-oriented sport data analysis.
Figure 5,
Figure 6 and
Figure 7 exemplify novel visual analytics interfaces which allow interactive analysis for aspects including spatial movement patterns, feature-based analysis and space-time segmentation, and visual comparison of events. Team Sport Analysis requires, in our view, and interdisciplinary approach where Sport Science, Behavioral Science, and Data Science including Data Visualization can all benefit to better using and understanding team sports data. By outlining this big picture, we indicate potential for interdisciplinary advance of research in the area.
One abstraction level higher, team sport can be seen as a specialization of group movement as shown in
Figure 4. Group movement can contain either cooperative or competitive behavior or any combinations of both being exactly what can be observed in team sport. Group movement is also studied in biology and behavioral science. For example, there exists the so-called Movebank Project [
41], a database about animal movement on a global scale. In nature, group movement occurs on very different scales, ranging from two (courtship or mating) to a thousand (social insects) individuals. The technical challenges of tracking individuals in animal groups still exists: even under laboratory conditions only parts of collectives can be marked and tracked. Consequently, the field of behavioral biology focuses on animal movement based on recent advances in data acquisition enabling a high temporal and spatial resolution of animal movement. GPS-tracking devices and classical tracking are used to record animal movements in the wild on a more global scale while video tracking analysis are used for rather locally restricted movements in the wild or under laboratory conditions. The increase in resolution led to an increased data volume to be analyzed. One of our visions is to research similarities and differences of team sport and animal collectives. The question is which patterns occur in both domains and which techniques are suitable in which analysis scenario.
On the highest abstraction level, movement in general is defined according to Andrienko et al. [
42] as the path of moving entities through space and time. Andrienko et al. [
43] suggest analyzing movement at two different granularities, of the individuals and of the group as a whole. Nevertheless, we also have to deal with pure time-series or time-stamped event data and with spatial topology data. There exists many works dealing with pure time series analysis mostly focusing on similarity calculation and pattern analysis. A good overview over state of the art methods in temporal data mining is given by Fu [
44] and visualization methods for time series are discussed for instance by Aigner et al. [
45]. Temporal analyses alone cannot explain all the behavior observed as important spatial aspects are neglected. Nevertheless, temporal visualizations are crucial to convey temporal patterns. From a pure spatial perspective, computational geometry can be the starting point to analyze trajectories in team sports data as described by De Berg et al. in [
46]. However, pure geometric approaches do not cover the temporal aspects of movement. Consequently, spatio-temporal analysis are key for a successful analysis. For instance, Kang et al. [
47] represent the movement of soccer players as trajectories and propose a model which quantitatively expresses the performance of players based on the relationships between the player trajectories and the ball. Another player network based analysis with respect to performance is performed by Cintia et al. [
48,
49]. Football strategies are investigated based on network theory analysis by Pena et al. in [
50]. A different spatial topology based approach would be the use of graph theory in sports. Bourbousson et al. [
51] analyze basketball matches and Clemente et al. [
52] use graph theory to analyze soccer matches.
Working with team sport data, we can apply methods of and contribute to different areas of computer science. One obvious example could be the research field of big data analytics [
53] proposed by Russom. According to Russom
Big Data is defined by the three “
Vs”, namely
Volume,
Velocity and
Variety. Often a fourth “
V” is mentioned, namely the
Veracity, which is the uncertainty in the data, see e.g., Buhl et al. [
54]. These are all attributes which we are facing when working with team sport data. For instance, we have to work with large volumes of data when analyzing video data of several leagues for multiple seasons or we have to consider the veracity of social media data.
4. Research Aspects
In the previous sections, we motivated why it is interesting to spend time on the analysis of team sports data. We gave an overview to the available sources and types in team sport data. By abstracting the data space, we identified connected research fields in computer science. In this section, we envision desired outcomes of team sport analyses and discuss pressing research challenges.
4.1. Definitions
Before we go into detail about the arising research challenges, we here provide required definitions.
4.1.1. Behavior
Behavior is an (re)action of an organism with a desired goal provoked by external stimuli or internal states such as motivation and arousal. For example, hunger provokes the goal “find food” and would be an internal motivational state that elicits foraging behavior. During foraging, external stimuli are used to fine-tune the foraging behavior and adapt behavioral patterns to instantaneous conditions. If a forager encounters an obstacle in its way the movement will be modified to overcome the challenge (temporary goal: pass the obstacle and go on with primary goal) or if any danger occurs, foraging behavior might be replaced by a behavior like fighting or escaping as the goal has changed essentially (goal: “I will survive!”). The definition of movement is highly context specific. In general, movement can be differentiated into movements in space like for migrating animals or movements referring to the movement ability of an individual restricted by anatomical and physiological capabilities. Movement behavior in space often is built up by distinct behavioral patterns. Orientation behavior elicited by the goal to know the position relative to the position that should be reached, walking/flying/crawling behavior etc. that describes the kind of movement an organism is operating with the goal to reach the destination. In Drosophila larvae these two phases of spatial movement are not simultaneously performed and therefore distinguishable by the observer [
59]. In other organisms orientation and moving occur at the same time and orientation behavior is often less visible to the observer. These are only two aspects that are crucial throughout spatial moving and further aspects (arousal, motivation etc.) should be taken into consideration when the causes for a spatial movement are in question.
4.1.2. Movement Pattern
Formalizing movement patterns needs to reflect the variability of real-world movement. Today, we are able to automatically track groups of moving entities and need techniques to describe not only individual movement but also collective movement. In this paper, we extend the definition of movement patterns as “concise description of frequent behaviors, in terms of both space (i.e., the regions of space visited during movements) and time (i.e., the duration of movements)” by Gianotti et al. [
60]. Movement patterns in team sport need to reflect collective group actions or reactions. Consequently, movement patterns are not necessarily frequently observed behaviors but coordinated in order to achieve a certain goal. A certain goal can often be achieved by alternative behavioral patterns and with experience and higher cognitive abilities the alternatives can be anticipated and planned. The ability to plan and estimate different strategies to reach a certain goal will lead to tactical considerations, especially in team sports, but might also be applied to animals with higher cognitive abilities. Formalized movement patterns can help to semantically annotate or interpret relevant intentions of the moving entities.
4.1.3. Group Behavior and Movement
Analysis of movement patterns or, more general, of behavior of individuals can nowadays be combined with simultaneous recordings of diverse parameters. 3D accelerometer data (behavior and energy use), remote sensing data (e.g., weather, habitat) and/or data about interactions with other tagged individuals can be assessed additionally to traditional tracking methods/data (reviewed by Kays et al. [
61]). The increasing amount of data about crucial impacts on individual behavior can then be used to explain or predict behavioral responses of an individual on the different levels of behavior (see the works of Bergner [
62], Hogan [
63] and Sumpter [
64]. The investigation of behavior becomes even more complex when (social) interactions of individuals are added like in, for example, team sports or collective behavior in animals.
The aggregation of individuals often leads to “collective behavior [that] is defined as the behavior of aggregates whose interaction is ’affected by some sense that they constitute a group’ but who do not have procedures for selecting or identifying leaders or members” [
65]. Flocks of birds and shoals of fish are the textbook example for collective behavior in animals. The aggregate of individuals moves as a whole structure based on the individual behavioral patterns that are again influenced by the fact that the individual behavior is affected by the aggregate. This interdependency of individual and group behavior causes that no (obvious) leader can be identified by the observer. Different mathematical models can be applied on collective behavior in animals (e.g., by Sumpter [
64]) and synergies that arise in team sports [
66] might also apply to synergies arising in superorganisms like social insects. Although the ‘final cause’ (consequences of behavior, definitions by Hogan [
63]) are very different between team sports (e.g., winning a match) and animals (e.g., passing genes to the next generation), certain structures of behavior might be shared across team sports and superorganisms [
67]. The integration of different research fields might allow to apply principles revealed in animal superorganisms to team sports performance analysis and vice versa [
67]. The analysis of movement patterns of individuals therefore will benefit from a close collaboration by researchers of different fields in which new movement analysis and visualization methodologies can arise [
68] and help to understand collective behavior in the wild or/and under restricted conditions like team sports or lab experiments.
4.2. Research Challenges
Analysts inspecting team sport data usually pursue various goals such as identifying strengths and weaknesses of their own team and of opposing teams. The insights are used to improve training and raise the team’s awareness when preparing for upcoming matches. To identify strengths and weaknesses, analysts, for example, want to understand why a team won a past match. Widespread statistical approaches, however, typically provide only a basic overview (aggregation) over the characteristics of a match. Therefore, one of the most challenging tasks for statistical analysis is the identification of expressive statistical features that help to gain more insight into factors that could influence the outcome of a match. However, in order to get a better understanding of the outcome of a match, we have to analyze our data on a more fine-grained level (e.g., movement of single players). One example for the inherent complexity is shown in
Table 1 with a real world example. Possession, shots and duel quota, among other statistics, are usually used to statistically compare teams. They indicate that both teams are equally strong. Considering that Germany beat Brazil 7–1 this is quite surprising. A different sight on the game outcome comes with two new statistics called Packing and IMPECT, both developed by the Impect GmbH [
69]. Packing is the number of outplayed players and IMPECT is the number of outplayed defenders. A detailed explanation of both statistics is given by Regenhuber [
70]. These statistics are better suited to explain the outcome of this match, with Germany having outplayed approximately 60% more defenders than Brazil.
However, even improved statistical measures cannot provide more than an indication about why a team won in a match. Features like packing in our example above show that Germany did a better job in outplaying Brazilian players, but we cannot see how these attacks were played in particular. Analysts want to find out why and how something important happened in a match as well as filter out noise obscuring interesting patterns. There are potentially three different ways how analysts identify patterns. The first way is to detect the pattern completely manually supported with appropriate visualizations. The second way are semi-supervised approaches, where analysts—at the beginning of the analysis—define a template of how the pattern should look like. Based on the template the system starts to look for patterns matching the given criteria. Lastly, analysts might have no clue what to look for and therefore the system should identify everything of general interest employing high-dimensional data descriptors.
Explaining movement patterns, however, is very complex, as the movement of a single actor is depending on the movement of all other actors. Because of these interdependencies, almost every action causes a reaction. Adding to the complexity is that typically, there are certain role definition in a sports team that influence movement. Particularly, team captain and goal keeper may steer or influence the movement patterns of team players, e.g., following a tactical decision to defend or press certain players. The role of such leadership effects is prominent not only in soccer analytics, but also a question of leader-follower relationships in domains like expeditions and explorations, military operations etc. This complexity in soccer analytic is added to by the fact that we do not only have to look at the interdependencies within a team but also the interdependencies between two opposing teams.
We can abstract this research challenge by generalizing our moving players to moving entities. This abstracted view allows us to widen our analysis possibilities to other domains, because conflicts of interest about where to go and what to do are a primary challenge of living in a collective. Groups do occur in nature hinting to correlating biological fitness. In the analysis of collective behavior, researchers are interested in detecting the way animals achieve consensus in stable groups with stratified social relationships [
71]. When analyzing collective behavior biologists want to determine factors directing the movement of, for example, birds flocks or fish shoals. In both cases the group formation decreases the risk of predation and thus increases the fitness of a single individual. Consequently, the required analysis possibilities overlap and allow the transfer of developed techniques from one domain to the other helping to solve challenges.
Context-aware analysis is another important aspect when exploring team sport data. Analysts might have identified interesting patterns and want to explore them in-depth enriched with context information. Movement is more than just
x- and
y-coordinates: entities are motivated to move by intrinsic and extrinsic contextual factors. Context-aware analysis means that insights into group dynamic behavior are enabled by incorporating collective movement models in the analysis process. We thereby even incorporate research from the field of collective animal movement [
72,
73,
74,
75,
76,
77].
Finally, experts want to explain why, when and how specific movement behavior is expressed because of tactical behavior. Tactical behavior, in our understanding, represents the overall effort practiced on the field to eliminate the factor of luck as much as possible. Analysts want to retrieve explanations of observed cooperative movement patterns in reaction to competitive movement patterns by enhanced visualizations. Another open issue is tracking external influences as coach advices and the corresponding team reactions.
The challenges arising with team sport data are not only concerning the analysis of movement itself. Technical challenges as efficient data storage, querying, and processing arise as well. Improved tracking techniques and devices led to an increase in data volume gathered from team sports as well for wildlife observations in behavioral biology. Large datasets and in some cases vast amount of individuals tracked require new and efficient handling methods. The need for novel streaming technologies that allow real time analysis enabling analysts and coaches to gain information even, for example, during the halftime break is increasing. Consequently, creating a encompassing view of team sport data, integrating trajectories, time series, similarity search, high dimensional data, text, and video image processing/analysis will be the major challenge promising large synergy effects and real insights.
5. Methodology
Analyzing team sports data requires a toolbox of methods from different domains including sport domain knowledge. From our previous work we consider the following areas non-exclusively important.
Models help in deriving patterns and features describing observed behavior in the domain. Models can stem from various perspectives. For example, in a data-driven way models can be obtained from statistical analysis and mathematical formulations; or from concepts developed in sport science.
Data mining is the corresponding domain in computer science and uses mathematical and statistical approaches. The communication of modeling results is often achieved by methods from the
Information Visualization domain. Information visualization is part of computer science and strongly connected to computer graphics and cognitive psychology. Recent research proposed a synergetic combination of data mining and information visualization by a
Visual Analytics [
78]. The core idea here is to implement steerable data mining methods and immediate visual feedback of the analysis results. Highly interactive analysis systems are the outcome supporting the integration of domain knowledge. We next detail aspects in the main areas of data modeling, data mining, interactive visualization and visual analytics.
5.1. Data Modeling
Generally speaking, modeling is about giving structure to the problem of sport analysis, by prescribing which aspects are of importance to the analysis. Ultimately, this needs to be informed by the task of the analysis. Different examples are, e.g., the short-term performance analysis of a single team member, versus the long-term analysis of the team performance or its evolution over time. The modeling process will eventually identify a set of variables and/or events to observe, and a quantitative scheme to aggregate and/or compare the measures. We distinguish two main approaches to guide the modeling: Domain-specific modeling is based on theories and concepts from
Sport Science [
79,
80], which generalize relationships between actions and outcomes in the respective sport domain. On the other hand,
data-driven or
explorative modeling does typically not assume previous knowledge about the domain, but is guided by dependencies found in the data directly. In practice, both approaches often go hand-in-hand: There are expectation and theoretical models about typical dependencies in the sports events, and the analysis measures are derived to validate and quantify the expected dependencies. On the other hand, patterns that one may observe inconsistently in larger amounts of measurement data may lead to new domain-specific theories and hence guide the modeling approach conceptually.
Team sport is fundamentally about space-time interaction of players—understood as a combination of operation, communication, and strategy—with the most influential interaction being the interference of the opposing team which excludes in many respects absolute scales of measurement. The ongoing lack of reliable key performance indicators for soccer teams points in this direction (see, e.g., the illuminative discussion in [
81,
82]). A deeper understanding of the interaction structure and dynamics between and within teams during a match is meaningful for making progress in team sports analysis. Relative phases [
83,
84], couplings [
85], invasion profiles [
86], or centralities in passing networks [
87] represent exemplary initial concepts.
As the data collected for a match shows only one realization of a contingent situation (“what happened”), the challenge is to determine the (path-dependent) set of
possible actions executable in that situation (“what not happened”). Operationally, the presence of the opposing team first and foremost restricts the space-time regions on the pitch accessible for meaningful action of a focal actor. On the communication level, selecting an action from the set of accessible actions (“decision”) depends furthermore on the intra-team movement patterns, space cognition, and information processing. Here, coming up with realistic and feasible action models is very demanding [
88,
89,
90], but worthwhile for answering to questions like “Which pass is best to execute given a set of possible passes?” Sole ball-oriented data is very limiting in respect thereof, as no information on players without the ball is available; the situation becomes much better with additional positional data of all players (see, e.g., [
90]). Moreover, technology is available (at least in basketball) to track head positions and head orientations of the players providing data for a feasible inference of mental maps [
91], e.g., which players are seen by a player. On the strategic level of interaction, expectations, style of play, tactical orientations, etc. determine a
normal behavior of the teams. Data-based analyses of these aspects are thus required for an unbiased evaluation of action sets. However, corresponding techniques are currently less developed. Methods of game theory could be applied, e.g., building strategic games from multi-parameter interaction models based on tactical action-reaction schemes available from expert’s domain knowledge.
In principle, there are two approaches to analyze the interaction of two teams in competitive dyads (matches). First, characterize matches by the behavioral characteristics shown by the teams, i.e., observed events are directly assigned to individuals, groups, or teams with positive or negative evaluation. This is the standard bottom-up approach. Second, characterize the behavior of the teams by the characteristics of matches, i.e., observed events add up to global information on the match before they are projected onto the teams. This can be classified as top-down. Next to context information (match type/competition, venue, audience, weather, etc.), typical global characteristics are parameters related to match speed. Speed can be hardly assigned to one side only. Though there is no standard definition of match speed, the growing popularity of packing rates (which relate the space occupied by a number of opposing players to time represented by pass duration) can be seen as a need in this global information.
5.2. Data Mining
Data mining is the automatic or semi-automatic discovery of patterns in data sets, which are too large to analyze manually. It is the analysis stage of the knowledge discovery in databases process, which also encompasses
Selection, Pre-Processing, Transformation and Interpretation [
92]. Data mining itself is an umbrella term, which encompasses various methods from different computer science fields. It uses, inter alia, methods from machine learning, artificial intelligence, statistics and database systems [
93]. Fayyad et al. [
92] group data mining techniques into six general categories. In the remainder of this section, we use these categories in order to review existing data mining techniques and their possible application to sports data. Apart from example use cases, we will also survey quantitative findings that have been obtained in previous work from applying data mining techniques to sports data.
5.2.1. Clustering
Clustering is the grouping of similar objects into clusters. The concept of a cluster, however, is not clearly defined, which is why so many different clustering algorithms exist [
94]. Generally speaking, a cluster is a set of objects which are more similar to each other, than to those in other clusters, however similar is defined. One could use one of the clustering algorithm by Lee et al. [
95] to identify common movement patterns of individuals or groups. In American Football this could be used to identify the most often used passing patterns of a team. An example where clustering is used is the work of Janetzko et al. [
21]. Here clustering is used to find common behavioral patterns of individual players. For this the
k-means [
96] algorithm is used on feature vectors consisting of various features like player speed or distance to ball.
5.2.2. Classification
“Classification is learning a function that maps (classifies) a data item into one of several predefined classes” [
92]. These classes can either be defined manually or alternatively generated automatically using clustering, which is described in
Section 5.2.1. This data mining method can, for example, be used—to stay with the American Football example—to automatically identify in which passing pattern a new pass can be classified. We successfully used classification in one of our previous works [
22] to detect dangerous situations. A dangerous situation in our case was a shot on the goal of a team. First we trained classifiers with various features which were collected shortly before the event “shot on goal”. Afterwards the classifiers were applied on the data, to identify periods with similar feature values, but where the event “shot on goal” did not occur. Thus detecting potentially dangerous situations, which were previously unknown. Users then judged these situations on their dangerousness. This information was used to iteratively retrain the classifiers. The effectiveness of this approach was shown in a quantitative evaluation, in which two experts were tasked with finding dangerous situations. There the experts could find dangerous situations with a
-
Score of up to 66%.
5.2.3. Regression
Regression or regression analysis is the process of estimating the relationship between dependent and independent variables of an experiment [
97]. Its goal is the determination of parameters of a function (such as
and
ϵ in
). If a relationship exist and if a good fitting can be archived the resulting function can be used to predict future observations. Regression analysis can be used to expose statistical correlations between and model the behavior of players [
98] and teams in tournaments [
99].
5.2.4. Summarization
“Summarization is a key data mining concept which involves techniques for finding a compact description of a dataset” [
100]. Methods like calculating the mean or standard deviation or dimensionality reduction are often used to analyze and visualize large and complex data sets. Clustering (see
Section 5.2.1) can also be used as a summarization method, with the centroid used as a representative for the whole cluster. This method has beneficial use to display the complex and large datasets, which are common for team sport analysis. For instance, techniques like the well-known PCA [
101] or the recent t-SNE [
102] are used to visualize high-dimensional data in lower-dimensional space, for example a soccer pitch representation. Perin et al. [
56] show this by proposing a visual abstraction and summarization system of, for example, certain attack paths.
5.2.5. Change and Deviation Detection
Change and deviation detection, which is often also called outlier detection, refers to the detection of observations, which do not correspond to the already existing patterns. On method to find such observations is “Grubbs’ test for outliers” [
103]. One possible use case in the research field of team sport analysis could be the detection of players which perform extremely better or worse than all other players.
5.2.6. Dependency Modeling
Dependency modeling or also called association rule learning is defined as the identification of significant relations between variables in the data. To identify interesting rules the measurements of confidence and support are often used [
104]. These rules are often used for market basket analysis, to identify which items are often bought together. They could also be used in the field of team sport analysis, to identify which events frequently occur if, for example, a goal was scored.
5.2.7. Summary
Team sport analysis is a growing research field using complex, high-dimensional data to model the behavior of groups and individuals. There exist already many potential uses of data mining methods in the field of team sport analysis. However, it is necessary to either adapt existing methods from various research fields or to develop new algorithms to allow an effective analysis of team sport data.
5.3. Information Visualization
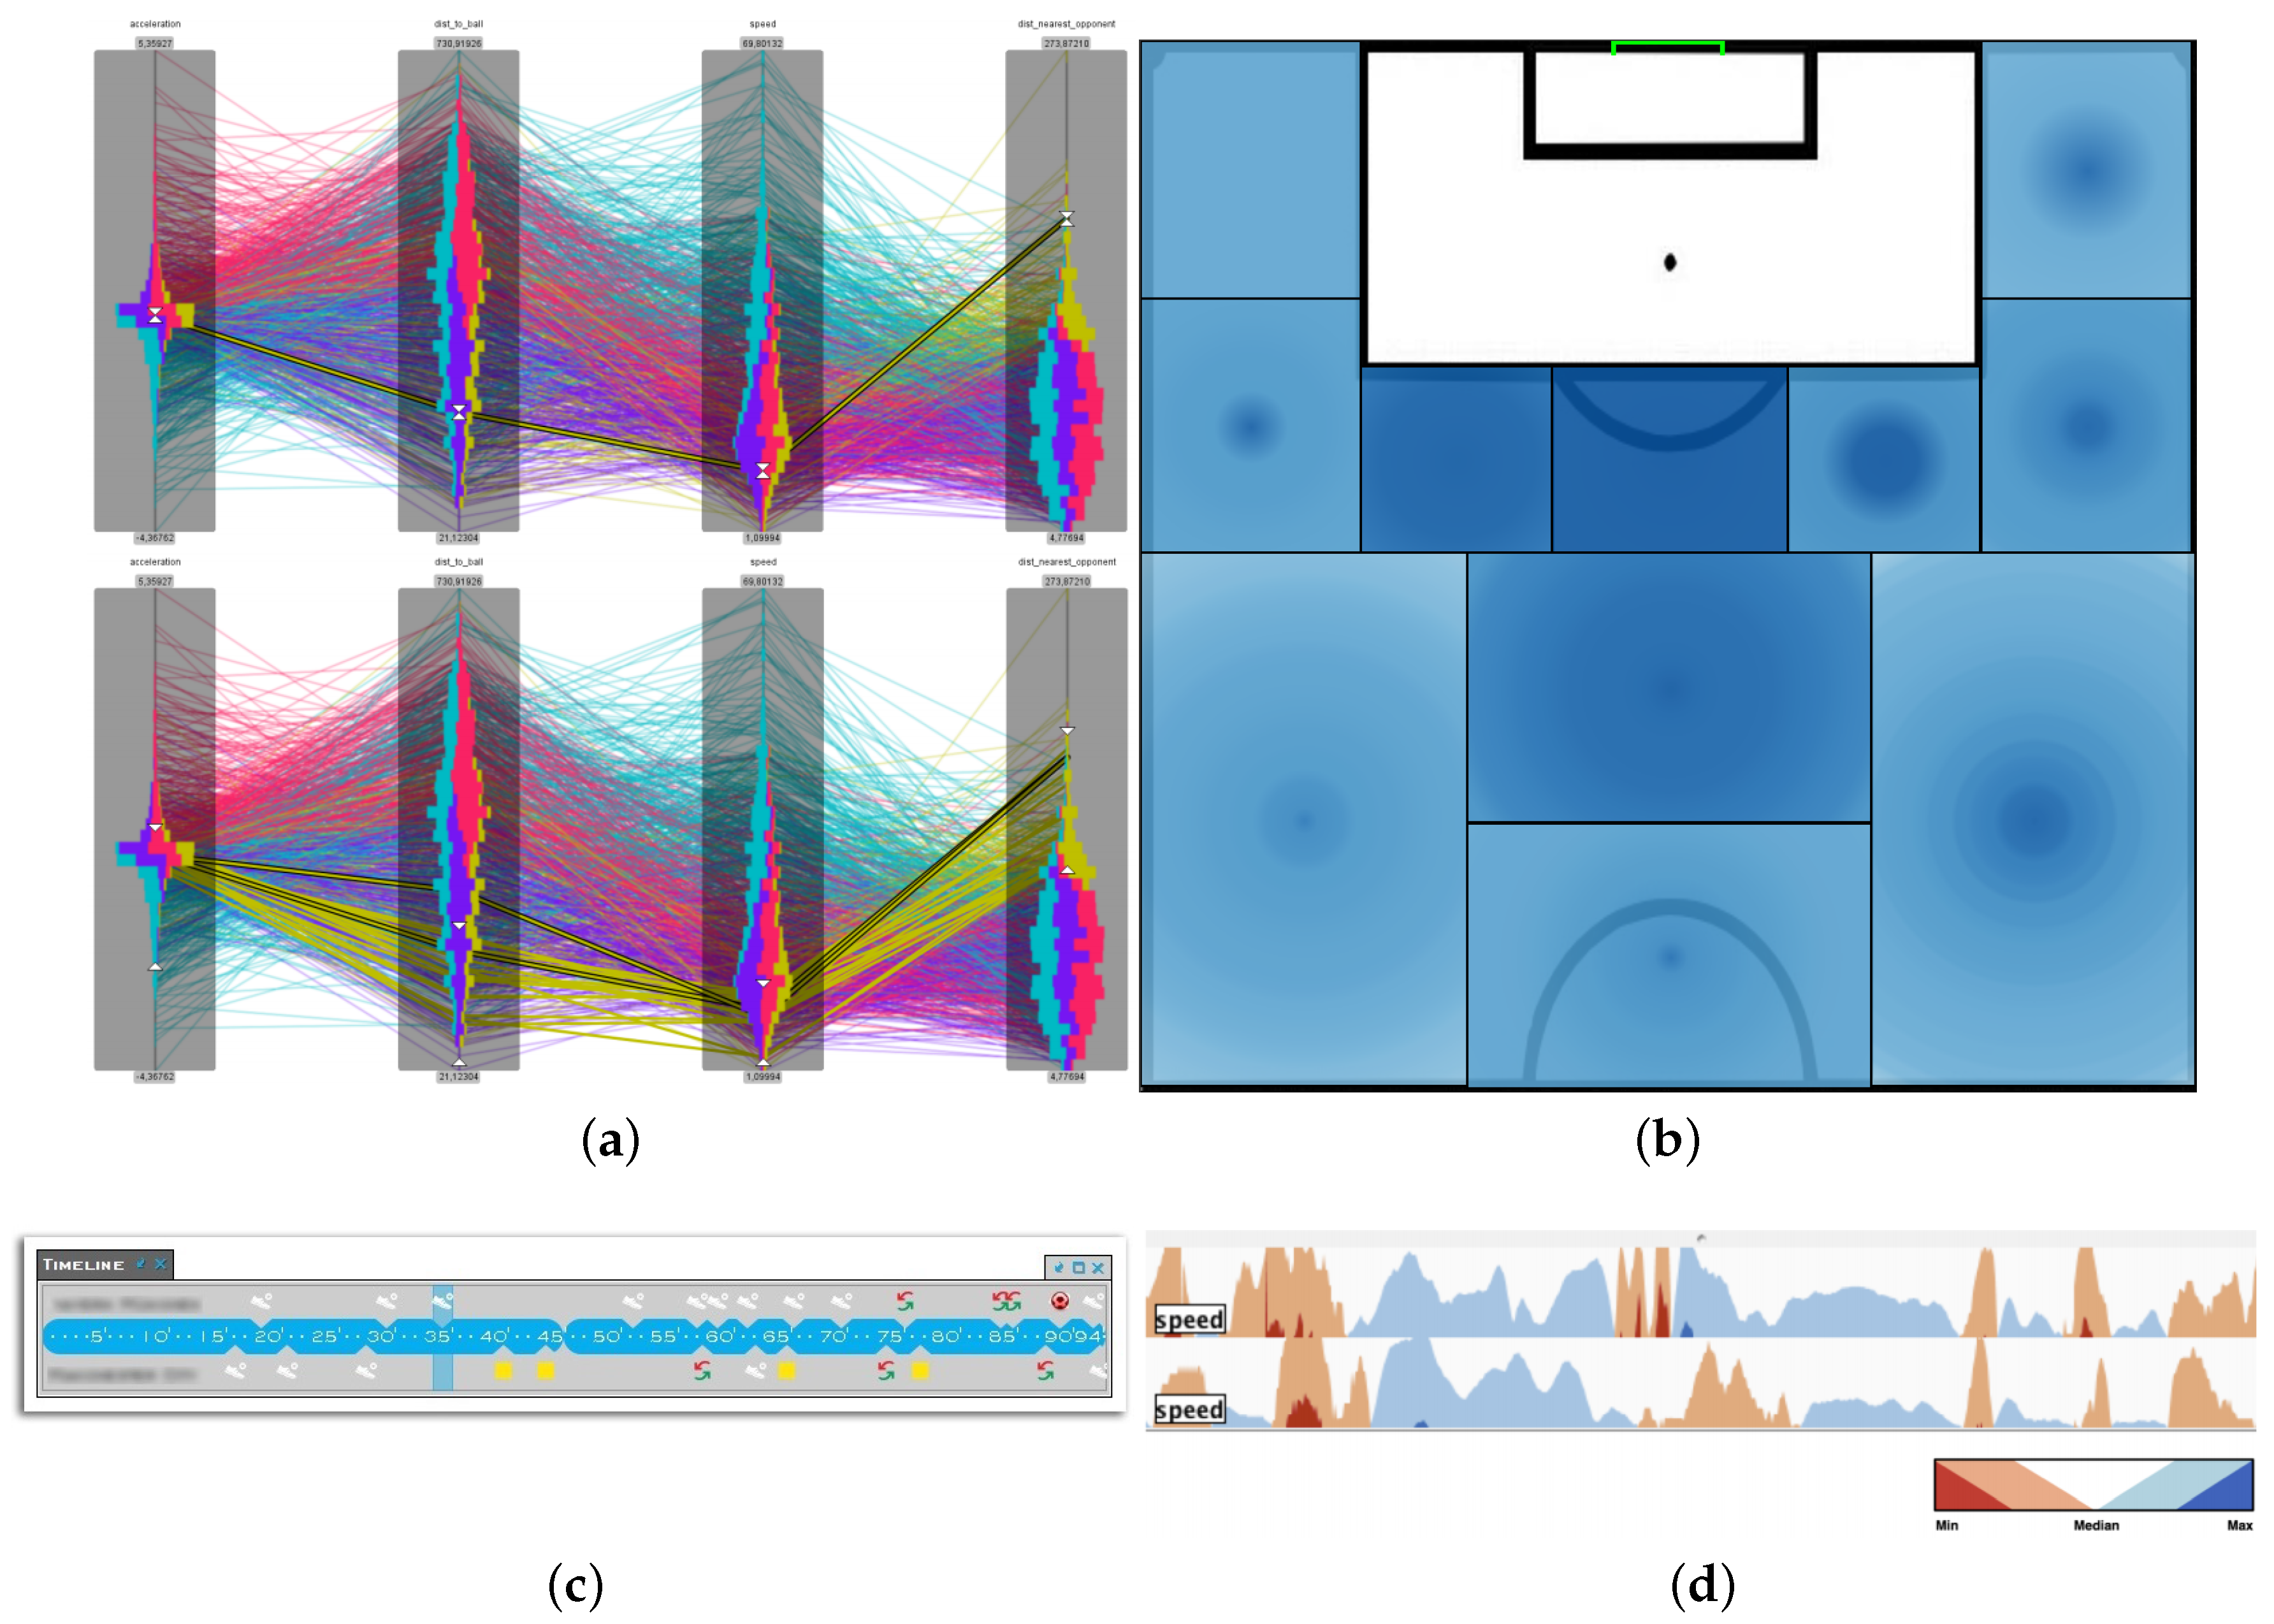
Information visualization is a growing research field and became quite prominent in the 1990’s. There are three main tasks of visualizations being directly transferable to the sports domain: exploration, hypotheses validation, and hypotheses generation. Exploration, here introduced as an example, is usually the first step when dealing with a previously unknown data set. Overview visualizations help to identify the descriptive features or to detect interesting patterns. The most important visualization techniques for sports data are statistical visualizations as scatter plots or parallel coordinate plots [
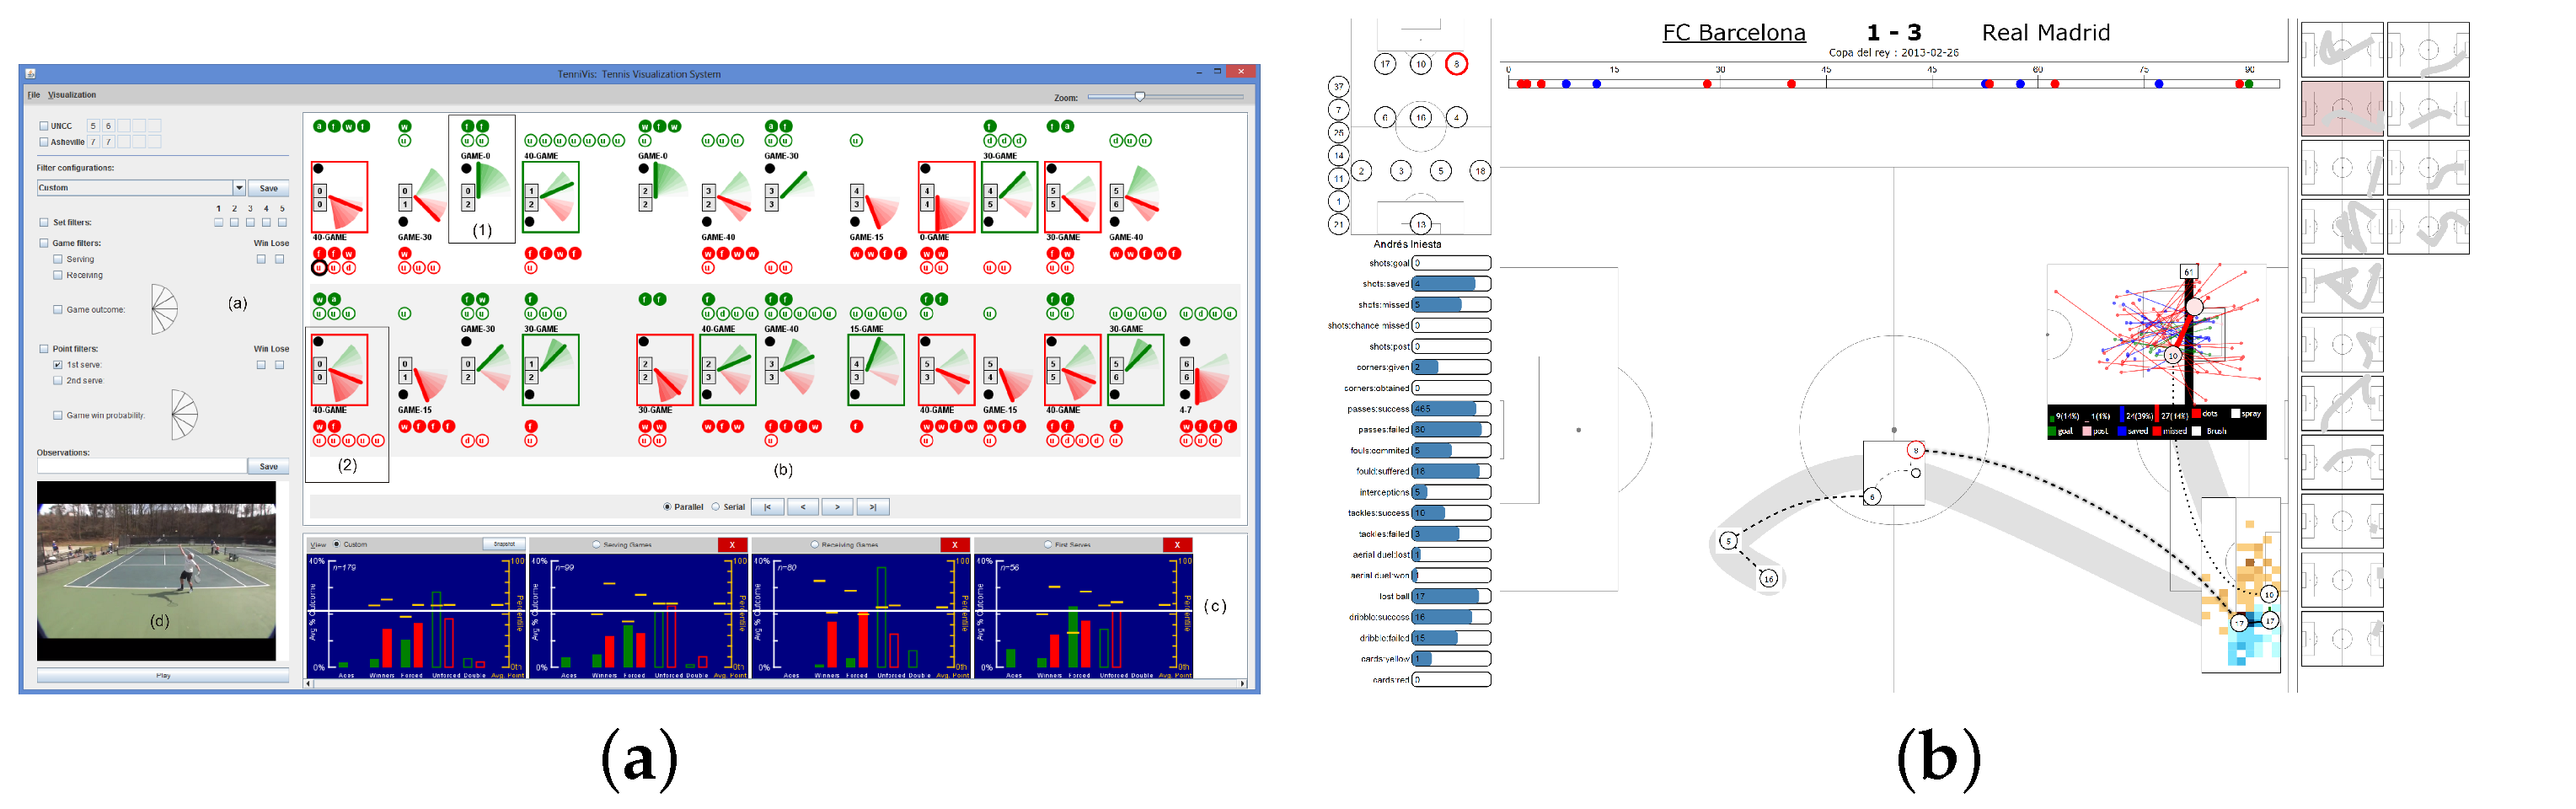
105] as well as more specialized spatial and temporal visualizations (such as displayed in
Figure 5). Spatial visualizations help to investigate distributions and individual or group movement patterns. Temporal visualizations [
45] show how features change over time and effect each other. Horizon graphs [
106] are a good example for a space efficient visualization of time-dependent data. Pixel-based visualizations [
107] are even more space efficient, encoding data values by color-coding single pixels of the display. The challenge in pixel-based visualization is an effective layout of the data items on the screen. For instance, temporal data can be laid out hierarchically with the help of a technique called Recursive Patterns [
108]. However, the high complexity and multi-dimensional aspects in sports data require novel visualization techniques. Abstracting the collected data in a suitable way and pointing experts to interesting aspects is key for a successful analysis. A selection of visualizations techniques used in recent publications can be seen in
Figure 6.
5.4. Visual Analytics
Combining data mining with information visualization is creating synergistic effects of human and machine. This combination is called visual analytics and enables experts to include their domain knowledge during the analysis process by interactive and steerable data mining methods and immediate visual feedback of the results. We believe that visual analytics is a very effective way to cope with the challenging data properties in the team sport domain. The research challenges described in the section above showed that although the desired outcome is clear, we need to deal with ill-defined data analysis problems. For example, detecting movement patterns being of interest to the analyst requires a semi-formal description of interests of the analyst. However, this transfer from the sports domain to the data domain being understandable by machines is very difficult. Visual analytics proposes a transparent analysis process, where the manifold parameter choices of data mining algorithms are as comprehensible as possible. By interactive exploration of the data and parameter space, domain experts should get a feeling for their data. However, there is also translation and communication needed between sport experts and visual analytics experts. One possibility to enable a productive communication between experts of both domains could be the use of a
Liaison as suggested by Simon et al. [
109]. A very first example for a resulting system can be seen in
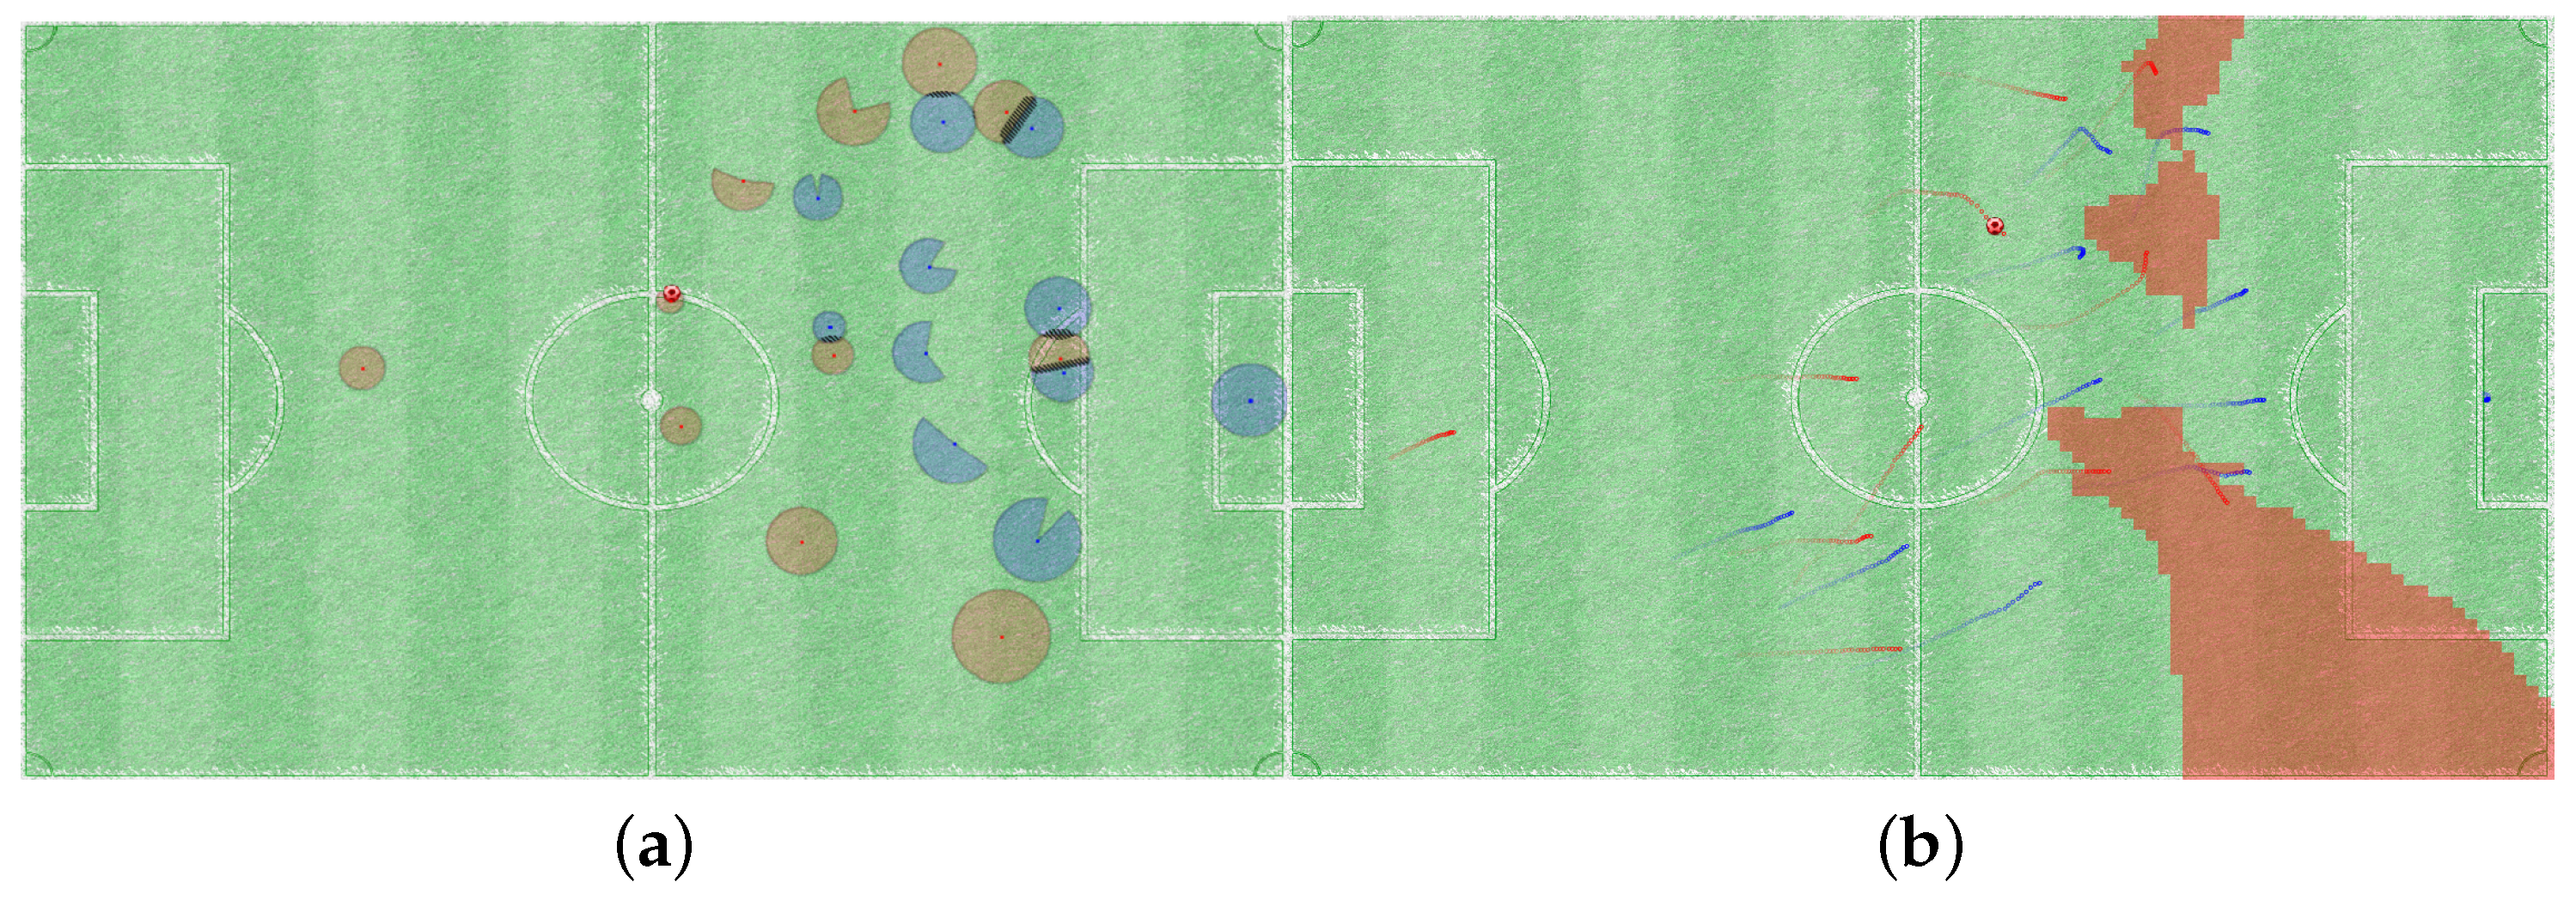
Figure 7, where we provided methods to interactively add context to the given data.
In
Figure 7a we developed so called
interaction spaces to indicate the surrounding area each player aims to control [
23]. Depending on speed and distance to the ball we determined a continuous model based on the conceptualization from the sport scientists around Grehaigne et al. [
110]. We extended our model to show potential duel areas when two interaction spaces overlap. A player’s interaction space is restricted to the area that can be reached before opposing players. In
Figure 7b we visualize the free spaces, which we defined as the regions players from one team can reach before the players of the opposing team can. In order to verify that our definition corresponds with the ideas from domain expert, we conducted a qualitative evaluation. In this evaluation experts were asked to sketch the free spaces for a given game situation. In ~80% of the cases, at least one of the free spaces, drawn by experts, overlapped with one of our computed free spaces. Thus confirming that our method to calculate free spaces is valid and valuable. The selection of proper data analysis methods is strongly dependent on the analysis task and usually done by visual analytics experts. Whereas, the choice of the right parameters is a joint effort, as judging results can be usually only achieved with domain knowledge. Up to now, there exists no extensive visual analytics framework for all possible analysis tasks as each application domain needs its very own approach.
6. Discussion and Conclusions
The analysis of team sport data is a potentially very useful, yet inherently difficult problem. In this paper, we gave a high-level overview to this fields as well as to identify future research aspects to contribute on. Team sport analytics involves many challenges and problems. First, the choice of data acquisition is difficult, as the type and quality of data available determines the potential analysis that can be done. Current acquisition includes video analysis, using position sensors or manual encoding. There is much additional data one can think of to include in a meaningful analysis, e.g., biomedical and physiologic measurements of players could be taken into account. In the wider sense, data acquisition also needs to consider data modeling, integrating, and cleaning, each representing significant work steps.
Being aware of data quality and comparisons of data sources is of critical importance. With regards to this work quality observations are especially needed when it comes to the trajectories of players and balls from video image sources. While we recognize the need for detailed benchmarks, such analysis has not yet been done in related literature and was beyond the scope of this article. In the future we will strive to fill this gap.
For meaningful analysis, domain requirements coming from external experts are important and must be taken into account. Specifically, analysts nowadays are, for example, interested in the analysis, prediction and performance monitoring of their team. Each problem, however, has many sub problems. The problem of data acquisition, for example, translates into video processing, classification and annotation problems. Nevertheless, team sport analysis is a highly interesting research field where experts from many different computer science subjects (computer vision, graph theory, network analysis, visual analytics, ...) can bring in their expert knowledge.
An important problem of doing analysis relates to modeling—what are the aspects in the sports events/matches which are of importance? How can we qualitatively and quantitatively assess individual player performance or the development of tactic and strategic capabilities of a team? Answers to these questions need to consider both data-driven approaches from Data Science, but also, models and concepts developed in Sport Science. Eventually, we see that both can go hand in hand to design appropriate analysis systems. Future work needs to better characterize the role and influence that both fundamental approaches have and how to combine them. In surveying existing analysis techniques, it may be instructive to distinguish these according to the level of detail on which they operate. Single events and situations (e.g., success rate of corner kicks) can be easily statistically computed. However, it is a difficult problem to assess strategic factors than can explain why a specific success rate is observed, or how it could be influenced. In particular, the development of explanatory models for different temporal scales from short- to long term, and considering involved dimensions, is seen an important problem for future work.
We also discussed visualization technology to help analysts interactively explore relevant sports data and help with interpreting patterns. We note that many analysis goals cannot be statically defined once and for all, but depend highly on the context of the analysis. For example, to prepare a team for a match against an upcoming other team, one coach needs to analyze or predict the strength of ones team in context of the other team. To this end, the analyst needs ways to define the context in which to do the analysis, for example, on the offensive of defensive sides. Interactive visualization is a key technology to provide adaptive analysis systems.
In
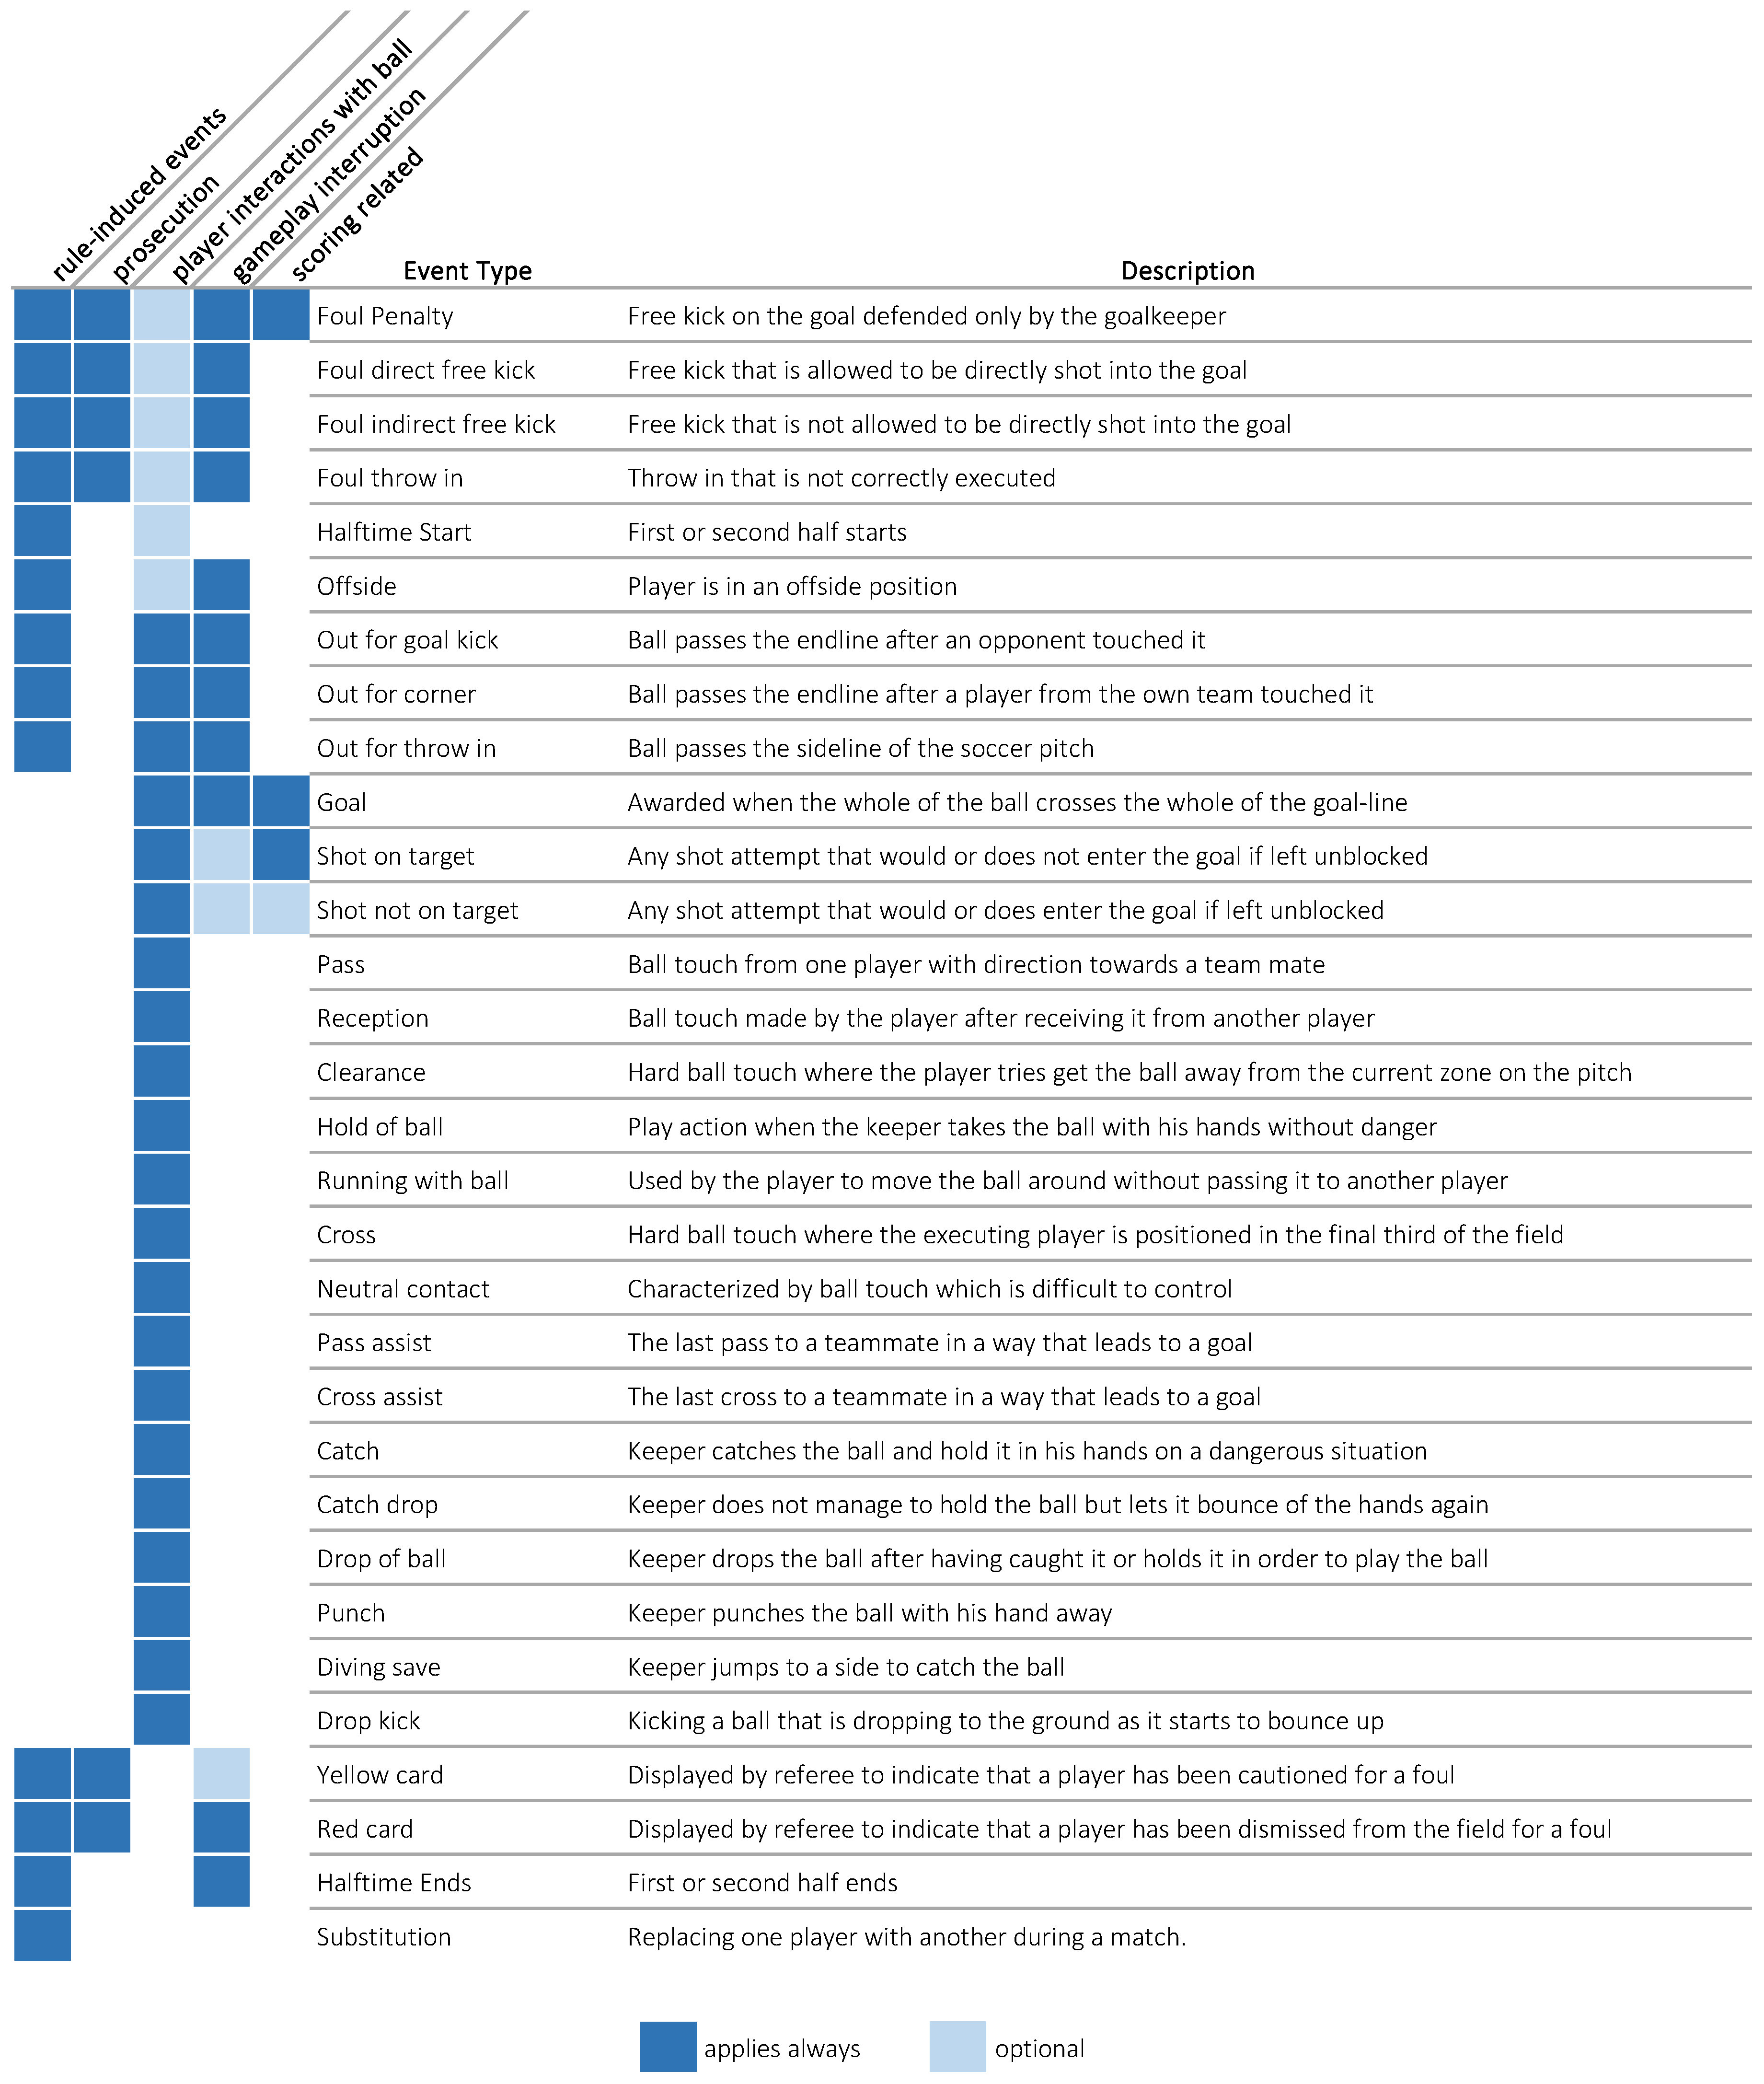
Section 2.1.2 we provided a soccer event taxonomy based on previous data-driven soccer analysis systems we implemented so far. While it may serve as a starting point to guide the definition of event detectors and descriptors, the taxonomy is a starting point and may be extended. Specifically, we may align it with existing taxonomies from Sports Science. Also, while these events are obviously interesting for analysis, not all of them can be detected or quantified with the same prevision, and the latter may also depend on the data acquisition modality at hand. Also, the given taxonomy table considers situations within a game only. For strategic analysis, more high-level or long-term events may be recorded as well, e.g., like when a team moves up a league, acquires new players by transfer, or having the coach change a training system. The latter may be particularly interesting for strategic analysis and correlation of strategic decisions with short-term performance measures.
Also, it would be interesting to assess how representative it is for other sports like basketball or ice hockey. Open questions also pertain to the predictability of behavior in sports. As a first step to this end, we need to define a notion of behavior, and ways to formalize it, and then by experiments one may research if behavior is predictable and to which extent. We note that different kinds of individual and collective movement behaviors can be defined. Collaboration with professional sport analysts in requirement definition and eventually, case studying will be helpful to this end. A German journal recently interviewed [
111] the German Football Association chief analyst, Christofer Clemens. In this interview, Mr. Clemens stressed the importance of data-driven sports analytics. Particularly, he stated that answers need to be found to questions such as what constellations of players are more successful in scoring goals, how important it is to quickly pass between the opponents defenders, and where it is important to outnumber players of the opposite team. Such requirements by domain experts can well serve to guide future research efforts in sports analytics.


