Abstract
Water scarcity severely restricts the sustainable development of water-stressed regions like Hebei Province. A scientific assessment of water resource carrying capacity (WRCC) is essential. However, single-weighting methods often lead to biased results. To address this limitation, we propose a combined weighting model that integrates the Entropy Weight Method (EWM), Projection Pursuit (PP), and CRITIC. To support this model, we developed a multi-dimensional, long-term WRCC evaluation dataset covering 11 prefecture-level cities in Hebei Province over 24 years (2000–2023). This approach simultaneously considers data dispersion, inter-indicator conflict, and structural features. It ensures that a more balanced weighting scheme is obtained. The traditional TOPSIS model was further improved through Grey Relational Analysis (GRA), which enhanced the discriminatory power and stability of WRCC assessment. The findings were as follows: (1) From 2000 to 2023, the WRCC in Hebei Province showed a fluctuating upward trend and a “high-north, low-south” spatial gradient. (2) Obstacle analysis revealed a vicious cycle of “resource scarcity–structural conflict–ecological deficit”. This cycle is caused by excessive exploitation of groundwater and low efficiency of industrial water use. The combined weighting–GRA–TOPSIS model offers a reliable WRCC diagnostic tool. The results indicate the core barriers to water use in Hebei and provide targeted policy ideas for sustainable development.
1. Introduction
Sustainable water resource utilization is not only the basis of social and economic development but also a lifeline for maintaining the health and stability of ecosystems. With the growth of the global population and the economy, human society’s dependence on the Earth’s finite water resources continues to intensify. In this context, Hebei Province, a vital area with respect to the Beijing–Tianjin–Hebei coordinated development strategy, faces a particularly severe and representative water crisis. With a per capita water availability of less than 250 m3—merely one-eighth of the national average—and grappling with a vast groundwater depression cone exceeding 40,000 km2, water scarcity has become a “hard constraint” on the region’s sustainable development [1]. Therefore, a scientific and dynamic quantitative assessment of Hebei’s water resource carrying capacity (WRCC) is vitally important both theoretically and practically for optimizing resource allocation, making policies based on evidence and promoting coordinated regional economic–ecological development.
WRCC is defined as a water resource system’s maximum potential to sustainably support socioeconomic activities and maintain ecosystem health within a specific spatiotemporal scale [2]. It has become a key conceptual and analytical tool for quantifying the coordination between human activities and water resources. So far, WRCC evaluation research has primarily focused on the following two aspects: (1) the construction of indicator systems and (2) innovation in evaluation methods. For the former, most researchers have adopted either a subsystem division approach or utilized conceptual frameworks such as the Driving Force–Pressure–State–Impact–Response (DPSIR) model [3,4,5].
Research on the latter has gradually evolved from being conducted using traditional statistical methods such as Principal Component Analysis (PCA) [6,7,8] and the Entropy Weight Method (EWM) [9,10,11,12] to more sophisticated approaches better suited to high-dimensional and nonlinear data structures. These include Projection Pursuit (PP) [13,14], various forms of TOPSIS (Technique for Order Preference by Similarity to Ideal Solution) [15,16,17], and modified models that enhance interpretability and adaptability. For example, Fu et al. [18] were the first to apply PCA to the comprehensive evaluation of regional water resource carrying capacity, laying the foundation for subsequent research. Lu et al. [19] assessed the WRCC of Huai’an from 2005 to 2014 using the Analytic Hierarchy Process (AHP). Meng et al. [20] applied a fuzzy comprehensive evaluation model to the Tarim River Basin, while Zhao et al. [21] enhanced the PP classification model using maximum information entropy principles for dynamic WRCC assessment in Jining City. Xia et al. [22] adopted a modified TOPSIS approach to evaluate Lianyungang’s WRCC and proposed optimization strategies based on the results. Liu et al. [23] used the EFAST (Extended Fourier Amplitude Sensitivity Test)–cloud model to evaluate the water–ecological carrying capacity in Henan Province. Qi Z et al. [24] used remote sensing data and integrated the EWM with AHP to evaluate ecological carrying capacity in the Ulan Buh Desert’s northeastern edge. Yi Cui et al. [25] combined set pair analysis with an improved EWM to enhance the accuracy of WRCC assessments. Zhang M et al. [26] developed a generalized EWM model for evaluating regional water sustainability, introducing a novel weighting mechanism. Yang et al. [27] proposed a dynamic WRCC evaluation model based on system dynamics. In a broader synthesis, Wang et al. [28] compared system analysis, comprehensive evaluation, and machine learning methods to highlight each approach’s strengths and limitations in WRCC assessment. Finally, Gong et al. [29] developed a three-level index system integrating AHP, TOPSIS, and logistic regression combined with ArcGIS spatial analysis to reveal the current state and temporal trends of WRCC in their study area.
These studies reflect the progressive refinement of WRCC evaluation in terms of both theoretical construction and methodological innovation. However, the following critical bottleneck persists: the reliability of evaluation outcomes is heavily dependent on the scientific rigor of indicator weighting, and single-weighting methods exhibit significant limitations when dealing with complex data. Subjective methods (e.g., AHP) are prone to human bias. While objective methods are widely used, their inherent flaws cannot be overlooked. (1) Inadequate adaptation to data structures: Linear methods, such as the EWM and CRITIC, fail to capture non-linear relationships between variables (e.g., the Environmental Kuznets Curve effect between water use and economic growth), potentially leading to systematic biases when handling multi-modal data distributions [30]. (2) Incomplete information dimension coverage: The EWM solely considers data dispersion (potentially leading to an overestimation of the weights of volatile indicators like ecological water use) while ignoring inter-indicator correlations and trade-offs. Although CRITIC incorporates correlations, it remains insensitive to non-linear structures [31]. (3) Lack of systemic interconnectivity: These methods often neglect synergistic or antagonistic interactions between indicators (e.g., potentially overvaluing the weight of “groundwater supply” without considering its complementarity with surface water and reclaimed water), resulting in systemic misjudgments [32]. This imbalance in capturing the systemic dimensions of data information urgently calls for a solution that integrates multiple weighting approaches.
To address these challenges and fill the research gap, we provide two core contributions. First, at the data level, we pioneer the development and release of the premier multi-source, long-term (2000–2023) panel dataset on water resources for Hebei Province, covering all 11 prefecture-level cities. This dataset provides a solid foundation for revealing the spatiotemporal evolution of WRCC with high resolution. Second, at the methodological level, we propose an innovative combined weighting and comprehensive evaluation framework based on this dataset. In this framework, the EWM, PP, and CRITIC are combined to mine information from multiple dimensions—data dispersion, inter-indicator conflict, and data structure projection—to generate a more robust and equitable weighting system. Specifically, EWM quantifies the uncertainty or information content inherent in the data, PP emphasizes the representativeness and structural characteristics of the dataset through optimal projection directions, and CRITIC accounts for both the contrast intensity between indicators and their conflicting relationships, thereby effectively reducing the impact of redundant information. While both EWM and CRITIC are grounded in data variability, EWM focuses more on quantifying the informational significance of each indicator, whereas CRITIC places greater emphasis on mitigating redundancy by evaluating conflicting relationships among indicators. In contrast, Projection Pursuit analysis enhances the processing of high-dimensional data by identifying representative subsets of indicators through low-dimensional projection, thereby optimizing both structural interpretability and computational efficiency. Leveraging this “new data, new method” paradigm, our aim is to (1) accurately evaluate the spatiotemporal characteristics of WRCC in Hebei Province; (2) diagnose the key bottlenecks constraining WRCC improvement using an obstacle degree model; and (3) provide scientific evidence with clear policy implications for sustainable regional water resource management.
The remainder of this article is structured as follows. Section 2 provides details on the study area, the comprehensive evaluation index system for WRCC, and data sources and processing. Section 3 details the methods and models employed. In Section 4, we comparatively analyze weighting methods and evaluate combined weights, assess the spatiotemporal characteristics of WRCC in Hebei Province, and identify critical obstacles affecting WRCC. In Section 5, we discuss the results, and Section 6 provides our conclusions and outlines future research directions.
2. Study Area and Data
2.1. Study Area
Hebei Province sits in the core area of North China. It borders the Bohai Sea and is encompassed by the Beijing–Tianjin region. It is the only province in China with four tiered landforms, which are plateaus, mountains, plains, and coasts. Its distinctive “mountain–urban–farmland–coast” gradient pattern (Figure 1) provides an ideal natural laboratory for investigating WRCC under the influence of human–environment interactions.
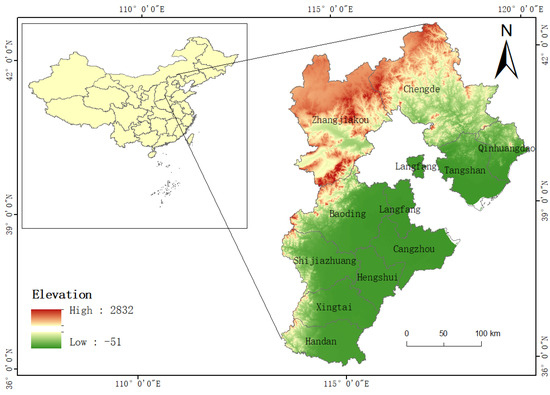
Figure 1.
Study area: Hebei Province, China.
Based on the baseline period (1956–2000), the province’s multi-year average water resources total 19 billion m3. Its per capita water availability is <280 m3, merely 13% of the national average, classifying Hebei as an extremely water-scarce region. Long-term reliance on groundwater over-extraction (historically averaging 5 billion m3/yr) has triggered ecological crises, including land subsidence and wetland shrinkage.
Hebei is a strategic hinterland for the coordinated development of the Beijing–Tianjin–Hebei region. It undertakes national missions such as the Xiong’an New Area construction project and relocation of non-capital functions from Beijing. In 2022, its GDP reached CNY 4.2 trillion. It transfers 10 billion m3 of inter-regional water to Beijing-Tianjin. The widening water supply–demand gap severely hinders its sustainable development.
2.2. Comprehensive Evaluation Index System for WRCC and Data Sources
2.2.1. Construction of the WRCC Evaluation Index System
The WRCC evaluation index system was systematically constructed around two core subsystems, which are the support system and the pressure system [33]. These two components distinctly represent the natural water resource endowment and human socio-economic demands, respectively, providing a comprehensive framework for assessing the balance between water supply potential and anthropogenic pressure in Hebei Province.
We constructed a tailored WRCC evaluation index system (see Table 1). It is based on Hebei Province’s strategic role within the Beijing–Tianjin–Hebei Coordinated Development framework and the planning imperatives of the Xiong’an New Area. The framework is organized around four dimensions, which are water resources, ecological environment, economy, and society. It integrates 18 representative indicators. These indicators were selected based on a comprehensive review of the following five key aspects: water supply, utilization, management, pollution, and regulation.

Table 1.
Evaluation index system for WRCC in Hebei Province.
This multi-dimensional index system is designed to foster a scientific understanding of regional WRCC and offer a new analytical perspective for advancing the sustainable utilization of water resources.
2.2.2. Data Sources and Preprocessing
We developed a comprehensive WRCC evaluation dataset covering the 2000–2023 period based on multi-source time-series data from Hebei Province and its 11 prefecture-level cities. The data sources are categorized as follows:
- Water resources data: Water Resources Bulletins of Hebei Province and its 11 prefecture-level cities;
- Ecological data: Environmental Status Bulletins of Hebei Province and its 11 prefecture-level cities and the China Urban Construction Statistical Yearbook (2000–2023);
- Socioeconomic data: Statistical Yearbooks of Hebei Province and its 11 prefecture-level cities and National Economic and Social Development Statistical Bulletins.
To ensure dataset completeness and temporal consistency, the following imputation strategies were applied:
- Annual-scale missing values: Filling in values using linear interpolation;
- City-scale missing values: Estimating values using the mean of other cities combined with temporal trend fitting, e.g., wastewater discharge data for Handan.
2.2.3. Normalization Process
In order to eliminate the scale differences of each indicator value, the evaluation indicator data must be normalized.
Let y(i,j) represent the raw value of the j-th indicator for the i-th sample. The normalized value is denoted as x(i,j).
For positive indicators,
For negative indicators,
In the formulae above, is the maximum value observed for the j-th indicator across all samples. is the minimum value observed for the j-th indicator across all samples. Consequently, all normalized values x(i,j) fall within the range [0, 1].
3. Methods
3.1. Technical Route
We constructed an integrated “Weighting–Evaluation–Obstacle Diagnosis” analytical framework (Figure 2) to conduct a comprehensive evaluation of WRCC. This framework is designed to capture the dynamic complexity of human–environment interactions across spatial and temporal dimensions.
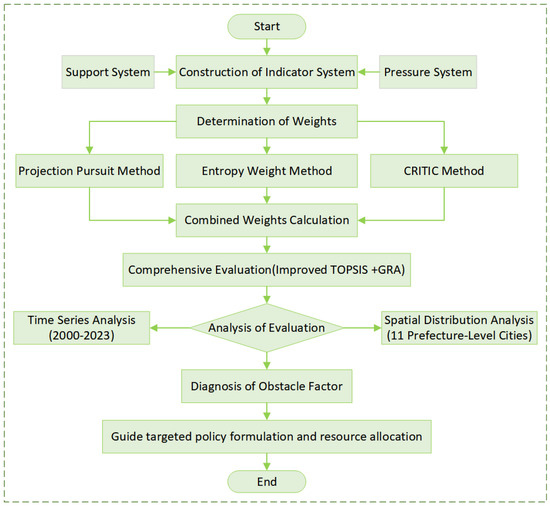
Figure 2.
Flowchart of the methodology employed.
First, a combined weighting model was developed by integrating the EWM, PP, and CRITIC, which together enhance the capture of non-linear relationships between variables, correlation sensitivity, and structural optimization of indicator weights, allowing for a more balanced representation of ecological, economic, and social dimensions within the WRCC system.
Following the weighting phase, a GRA-TOPSIS model was applied to evaluate the WRCC levels across 11 cities over a 24-year time series. This method improves the model’s discriminatory ability by considering both distance and pattern similarity.
Lastly, an obstacle degree model was employed to identify key limiting factors, enabling the targeted diagnosis of constraints affecting WRCC performance.
3.2. A Combined Weighting Model of EWM, PP, and CRITIC
3.2.1. Entropy Weight Method
WRCC assessment involves multiple indices. Traditional subjective weighting methods are susceptible to human bias, causing weight distortion. The EWM, based on information entropy, is a more objective approach. It objectively calculates indicator weights by quantifying data dispersion (the entropy value). A smaller entropy value corresponds to a higher weight [34]. For instance, significant interannual fluctuations in “Per capita water utilization” in Hebei indicate this factor’s substantial contribution to WRCC variation. This method assigns this factor a higher weight. It avoids subjective interference and enhances the objectivity and credibility of evaluations. The weights are determined by each indicator’s information utility value through the following steps:
- a.
- Calculation of the proportion for the j-th indicator in year i as follows:
- b.
- Calculation of the entropy value for the j-th indicator as follows:
- c.
- Determination of the weight of the j-th indicator as follows:
The greater the weight , the more information the indicator reflects, and the more important its position in the comprehensive evaluation.
3.2.2. Projection Pursuit Method
PP modeling [35] is an emerging statistical methodology for analyzing high-dimensional data, particularly non-Gaussian and nonlinear datasets. In this approach, high-dimensional observations are projected onto a low-dimensional subspace to identify structure-preserving projections of the original data. In the context of our weighting system, PP contributes significantly by optimizing the selection of indicators, reducing redundancy, and enhancing both the interpretability and predictive capacity of the model. By uncovering latent structures within the dataset, PP provides a more refined and reliable subset of indicators, thereby enabling decision-makers to identify the most representative criteria within complex multidimensional information. The weights derived from PP reflect the independence and informational contribution of each indicator within the decision-making framework. Consequently, this approach offers deeper insight into the role of individual indicators and helps prevent overreliance on redundant or correlated variables, ultimately supporting a more robust and transparent weighting process. Traditional PP methods rely on iterative optimization to determine optimal projection directions (weight vectors). In contrast, real-coded genetic algorithms (RCGAs)—as global optimization techniques—efficiently locate optimal solutions by applying genetic operators (selection, crossover, and mutation), thereby mitigating the risk of local-optima entrapment. Direct encoding of continuous weight parameters renders RCGAs particularly suitable for continuous optimization problems, enhancing computational efficiency and solution accuracy. The modeling procedure proceeds as follows:
- a.
- Construct the projection function.
First, calculate the projection value z(i) of the sample as follows:
In this formula, is the projection direction vector to be optimized for the -th indicator, and x(i,j) is the normalized value of the j-th indicator for the i-th sample.
Equation (7) defines the projection objective function to be maximized. It balances sample dispersion () and local density () to identify the projection direction that best reveals underlying data structures.
Equation (8) calculates the standard deviation of the projection values z(i), where m is the total number of samples.
Among these, r(i,k) denotes the Euclidean distance between sample i and sample k. R is the density window radius; u(t) is the unit step function.
- b.
- Real-number coding accelerates genetic algorithm optimization.
Using Q(a) as the fitness function, the projection direction vector a is iteratively optimized through selection, crossover, and mutation operations until convergence:
The restrictions are as follows:
- c.
- Calculate indicator weights. Based on the optimal projection direction vector a, the weights of each indicator can be calculated:
The greater the weight , the more information the indicator reflects, and the more important its position in the comprehensive evaluation based on the Projection Pursuit model.
The PP weights were computed using MATLAB R2023b. When implementing the accelerated genetic algorithm, the initial parent population size was set to 400, with a crossover probability Pc = 0.8, a mutation probability Pm = 0.8, and an acceleration factor of 15 (based on prior experimental configurations).
3.2.3. CRITIC Method
The CRITIC (Criteria Importance Through Intercriteria Correlation) method is an entropy-based objective weighting technique for Multi-Criteria Decision Making (MCDM). It derives criterion weights by quantifying (1) conflicts via inter-indicator correlation coefficients and (2) contrast intensity through the standard deviations of indicator data. This dual mechanism objectively avoids subjective bias while capturing both data variability and inter-criterion dependencies, yielding statistically robust weights for MCDM.
- Calculate the comparative strength:
In this formula, is the sample size, and is the mean value of the -th indicator. The larger the standard deviation, the stronger the discriminating ability of the indicator and the greater its weight.
- b.
- Calculate conflict.
Calculate the correlation coefficient matrix between the calculation criteria and quantify the conflict:
Here, n is the total number of indicators, and is the correlation coefficient between indication j and indicator k. If two indicators are highly correlated, then the information they provide overlaps to a high degree, and there is little conflict between them; thus, their weights will be reduced accordingly.
- c.
- Calculate the information-carrying capacity:
- d.
- Calculate the weights:
The greater the weight , the more information the indicator carries, and the more important its role in the comprehensive evaluation.
3.2.4. Combined Weight Calculation
To leverage the complementary advantages of EWM, PP, and CRITIC—while enhancing weight assignment accuracy and reflecting decision-makers’ emphasis on indicator attributes—we integrate weights derived from all three approaches. This integration mitigates the subjectivity inherent in single-method weighting. We compute the composite weight using the arithmetic mean:
where ,, and denote the weights from EWM, PP, and CRITIC, respectively. This empirically grounded approach ensures realistic, scientifically credible decision outcomes [36].
The weights for all criteria were derived based on the complete 24-year dataset (2000–2023), formatted as a 24 × 18 matrix, to ensure robustness and temporal representativeness. This approach captures long-term trends and minimizes year-specific biases.
3.3. An Improved TOPSIS Comprehensive Evaluation Model Based on Grey Relational Analysis (GRA-TOPSIS)
The TOPSIS method is a widely adopted multi-criteria decision analysis technique, also termed the ideal-anti-solution distance method. In this approach, alternatives are ranked by computing the Euclidean distance between candidate solutions and ideal/anti-ideal reference points [37]. It was selected for this study due to its strong capability to handle high-dimensional and conflicting criteria, its computational robustness, and its intuitive geometric interpretation, making it particularly suitable for evaluating regional water resource carrying capacity, where balancing multiple socio-economic and environmental indicators is essential. The method effectively integrates normalized data and objective weights derived from the combined EWM-PP-CRITIC framework, ensuring a comprehensive and rational assessment of each alternative’s relative performance. While TOPSIS objectively quantifies gaps in WRCC between current and ideal states, its reliance on solely Euclidean distance may leave dynamic interdependencies and trend similarities in data sequences overlooked. To address this limitation, Grey Relational Analysis (GRA) [38] can be integrated. GRA measures sequence similarity through relational coefficients, capturing local features and trend dynamics that Euclidean distance fails to reflect due to its global spatial perspective. The proposed GRA-TOPSIS method synthesizes both approaches, as it retains TOPSIS’ geometric interpretability via Euclidean distance and incorporates GRA’s sequence similarity analysis through Grey Relational Grade. This dual mechanism significantly enhances the comprehensiveness and stability of evaluations. The same set of weights, obtained from the full time-series data, was applied consistently to each year’s indicator values during the evaluation step. This ensures comparability of results across the entire period.
- a.
- Construction of a standardized evaluation matrix.
Normalize the raw data and construct a weighted standardized matrix based on the weights.
Here, = 1.
- b.
- Determine the positive and negative ideal solutions.
A positive ideal solution is the optimal solution:
The negative ideal solution is the worst-case scenario:
- c.
- Calculate the Euclidean distance.
The distance to the positive ideal solution is as follows:
The distance to the negative ideal solution is as follows:
- d.
- Calculate the grey correlation degree.
Correlation coefficient (discrimination coefficient):
The coefficient ρ, often termed the distinguishing or resolution coefficient, serves to enhance the discriminative power of the grey relational coefficients. Typically set to 0.5 as a conventional value, ρ ∈ (0,1). A smaller ρ increases inter-class discrimination, amplifying differences between schemes, while a larger ρ reduces contrast, causing coefficients to converge toward 1.
The relevance is reflected below:
- e.
- Calculate the comprehensive proximity score.
Typically, = 0.5 balances distance and correlation, and the comprehensive proximity is sorted from smallest to largest, with larger values indicating greater WRCC.
Determining appropriate evaluation thresholds is a critical step in assessing WRCC, as it directly influences the outcome of the evaluation. Currently, there is no universally accepted standard for these thresholds; instead, they are shaped by a combination of natural, geographical, political, cultural, technological, and economic conditions. The carrying capacity is classified into five levels. Priority was given to national and industry standards, followed by relevant literature [39]. Moreover, the grading criteria were tailored to the specific conditions of Hebei Province, taking into account its water resource characteristics, as well as social, demographic, and economic developments. The resulting classification standards are presented in Table 2.
Table 2.
WRCC evaluation grading standards.
3.4. Obstacle Degree Model (ODM) for Identifying the Limiting Factors of WRCC
The obstacle degree function, a diagnostic mathematical model based on an indicator’s degree of deviation, quantifies obstacle levels by measuring the deviation between observed indicators and their optimal values. This method has the following two distinct advantages: (1) it allows the complete elimination of subjective bias, and (2) it provides computational efficiency. We employed the ODM [40] to quantitatively evaluate the constraining factors that hinder the enhancement of WRCC in Hebei Province. Through obstacle degree analysis, we identified key limiting factors and assessed their relative severity in impeding regional water resource sustainability.
Determine factor contribution.
Calculate the deviation of each indicator each year.
Calculate the degree of impairment.
In the formula above, is the contribution degree, indicating the impact of a single factor on the overall situation; is the deviation degree, indicating the gap between a single factor and the carrying capacity development goal; is the obstacle degree, indicating the impact of a single indicator on the carrying capacity level; is the weight of the indicator layer; is the standard value of indicator j in year i, which has been dimensionless processed to allow for comparison between different indicators; and is the normalized and forward-oriented value of indicator j in year i. It is scaled between 0 and 1, where = 1 represents the optimal or ideal value for that indicator within the dataset (e.g., the maximum value for a benefit-type indicator or the minimum value for a cost-type indicator after normalization).
4. Results
4.1. Comparative Analysis of Indicator Weights and Weighting Methods
A comprehensive WRCC evaluation index system was constructed based on the current water resource conditions in Hebei Province. Indicator weights were calculated using three objective methods, which were EWM, PP, and CRITIC. We then substituted them into Formula (17) to calculate their combined weights. The final combined weights (W), reflecting multidimensional water resource utilization, are summarized in Table 3. Since we applied multiple weighting methods, the first section focuses on the analysis of the indicators’ weights and weighting methods.
Table 3.
Comparison of the weights yielded by the three methods and the combined weighting results.
4.1.1. Comparison of the Characteristics of the Different Weighting Methods
The results obtained using the EWM show that the weights for the ecological environment and population structure indicators, such as S6 (0.1329), S5 (0.1284), and S15 (0.1036), are relatively high. This finding reflects significant differences between regions in Hebei Province in terms of ecological water allocation and population growth. In contrast, the weights for the water resource utilization efficiency indicators, such as S9 (0.0185) and S16 (0.0365), are lower, which may be due to the convergence of water efficiency data within the region, leading to small variations in entropy values.
PP displayed a mediating tendency for most indicators, with weights lying between those obtained from the EWM and CRITIC, reflecting the method’s adaptability to the data distribution characteristics. Particularly, for socio-economic indicators, S10 (0.0994) had the highest weight, possibly because the method revealed the complex coupling relationship between agricultural water use and regional water resource endowment through nonlinear mapping (for example, the nonlinear relationship between irrigation efficiency and topography and climate). This result further reflects the importance of agricultural water use in water resource allocation and highlights the advantage of PP in capturing intrinsic patterns of high-dimensional data.
The CRITIC results indicate that the variability and correlation of indicators significantly affect the weight allocation. Specifically, the weight of S5 (0.0486) is relatively low. This result may be due to the strong correlation between this indicator and others, which weakens its independent influence. Meanwhile, S12 (0.0671) and S2 (0.0680) have higher weights due to their greater variability and weaker correlation with other indicators. The weights for water resource endowment indicators (such as S3 (0.0570) and S4 (0.0569)) are relatively balanced. These results reflect the CRITIC method’s comprehensive measurement advantage in terms of combining variability and correlation.
Compared to the individual methods, the weight assignment of per capita GDP (S12) achieved using the EWM (0.071) is significantly lower than that achieved via CRITIC (0.105), indicating that the EWM did not fully considered the complex nonlinear relationship between economic indicators and the water resource system. This difference essentially reflects the distinction between unidimensional variance analysis and the methodology of quantifying multidimensional information conflicts, further proving that the combined weight method can integrate various sensitivities, such as dispersion and correlation, to improve the accuracy of evaluation results.
4.1.2. Comprehensive Analysis of Combined Weights
Different weighting methods exhibit significant differences in their sensitivity to data characteristics. The EWM mainly relies on the degree of data dispersion, determining weights through the gain in information entropy; PP captures the intrinsic structural features of data via its nonlinear dimensionality reduction ability; and CRITIC quantifies the conflict information between indicators by comprehensively considering the variability and correlation of indicators. Due to the differences in how these methods handle data, combined weighting can lead to complementary gains by integrating sensitivities from different dimensions (such as dispersion, correlation, and nonlinear characteristics), providing a significant advantage in composite system evaluation, as demonstrated by the comparative weights and final scores in Table 4.
Table 4.
Combined weight analysis.
The difference in weight for S18 between EWM and CRITIC (EWM 0.0965 vs. CRITIC 0.0482) was assessed. The discrepancy in the weights assigned to S18 between the EWM (0.0965) and the CRITIC method (0.0482) arose because the EWM only considers the degree of data variation, while CRITIC incorporates the correlation conflicts between indicators, such as the substitution relationship between groundwater and other water sources. The high weight assigned by PP to industrial and agricultural water usage aligns well with its algorithmic characteristic of exploring the nonlinear structure of high-dimensional data through function mapping. This method excels at handling nonlinear data distributions, an ability that is highly relevant to the complex spatial patterns of industrial water use in Hebei Province. The combined weight, obtained through arithmetic averaging (with the weight coefficients α = β = γ= 1/3, this equal weighting scheme was adopted as a robust baseline approach to integrate the three information dimensions without introducing subjective preference), integrates the variation information entropy from the EWM, the conflict information from the CRITIC, and the nonlinear structural information from the PP method. This integration reduces the bias of individual methods. For example, the combined weight for the ecological environment indicators (S6 = 0.127) retains the objective discreteness of the EWM (0.1329) while absorbing the quantified result of CRITIC regarding the “ecological water use–social water use” correlation conflict (0.1156), providing a more comprehensive reflection of its impact on carrying capacity. For socio-economic indicators like “per capita GDP,” the combined weight balances the different judgments of the methods regarding the relationship between the economy and water resources, enhancing the robustness of the evaluation. In conclusion, the combined weight method not only overcomes the limitations of single-weighting methods but also enhances the comprehensiveness and accuracy of WRCC evaluations, making the final assessment more scientific and reliable.
4.2. Temporal Evolution Trend of WRCC in Hebei Province (2000–2023)
Based on the combined weights list in the fifth column in Table 3, we utilized the improved GRA-TOPSIS method to analyze the temporal evolution trend of WRCC in Hebei Province. The results presented in Figure 3 show that the average index of WRCC in Hebei Province is 0.432, situating it at a medium level according to the WRCC evaluation grading standards shown in Table 2. The trend of changes in WRCC from 2000 to 2023 and the corresponding carrying capacity levels are shown in Figure 3. The WRCC in Hebei Province during this period exhibited a fluctuating upward trend, as reflected in the changes at several time points and the analysis of their causes.
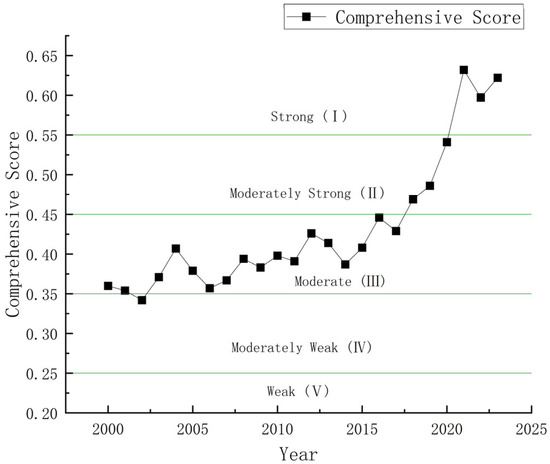
Figure 3.
Temporal trend of WRCC evaluation results in Hebei Province (2000–2023).
From 2000 to 2023, the overall trend of WRCC in Hebei Province fluctuated upward. Specifically, from 2000 to 2001 and during the period from 2003 to 2017, the carrying capacity remained at a moderate level. From 2017 to 2021, a linear upward trend was observed, particularly from 2018 to 2020, when the carrying capacity reached a moderately strong level, and from 2021 to 2023, it further rose to the level of strong carrying capacity. This fluctuating upward trend reflects improvements in the supply, demand, and utilization efficiency of water resources in the province.
In 2002, the comprehensive score of WRCC in Hebei Province was 0.342, indicating a moderately weak carrying capacity. This was the lowest point, reflecting the severe water shortage issues in the region. Human activities, especially in agriculture, industry, and urbanization, had a significant impact on water resources, leading to an inadequate water supply, low utilization efficiency, and moderately severe water pollution. During this period, water resources did not meet the requirements of socio-economic development, and the situation considerably constrained the ecological environment, especially in terms of water-use efficiency and pollution control challenges.
In 2021, the comprehensive score for WRCC in Hebei Province reached 0.632, which indicates a strong carrying capacity. During this period, the carrying capacity was at its highest level, signaling that the impact of human activities on water resources had decreased. The supply, demand, and utilization efficiency of water resources improved significantly. Through rational water resource management and policy adjustments, Hebei Province achieved a balance between water resource use and ecological protection, allowing water resources to fully meet the needs of socio-economic development and ecological preservation. After 2021, the distribution and carrying potential of water resources in Hebei Province were further enhanced, promoting regional sustainable development.
Over the past 14 years, 2014 marked the year with the lowest WRCC in Hebei Province. In that year, the province’s precipitation was 408.2 mm, a decrease of 123 mm from the previous year and 123.5 mm less than the multi-year average, making it a dry year. The high proportion of agricultural water use, the large industrial water demand, and serious over-extraction of groundwater led to increased pressure on the supply of water resources. These factors combined caused a significant decline in the province’s WRCC. The pressures from agriculture, industry, and groundwater further exacerbated the water supply–demand conflict, impacting the sustainable development of the economy and ecological environment.
4.3. Spatial Differentiation Pattern of WRCC in Municipal-Level Cities of Hebei Province (2023)
Following the temporal analysis of WRCC from 2000 to 2023, this section focuses on the spatial differentiation of WRCC across Hebei Province’s prefecture-level cities in 2023. The year 2023 was selected as it provides the most recent and comprehensive dataset, suitable for capturing the current spatial disparities. The WRCC of all 11 cities was evaluated using the combined weighting–GRA–TOPSIS method. Figure 4 illustrates the spatial distribution of the comprehensive WRCC scores and highlights the inter-city differences.
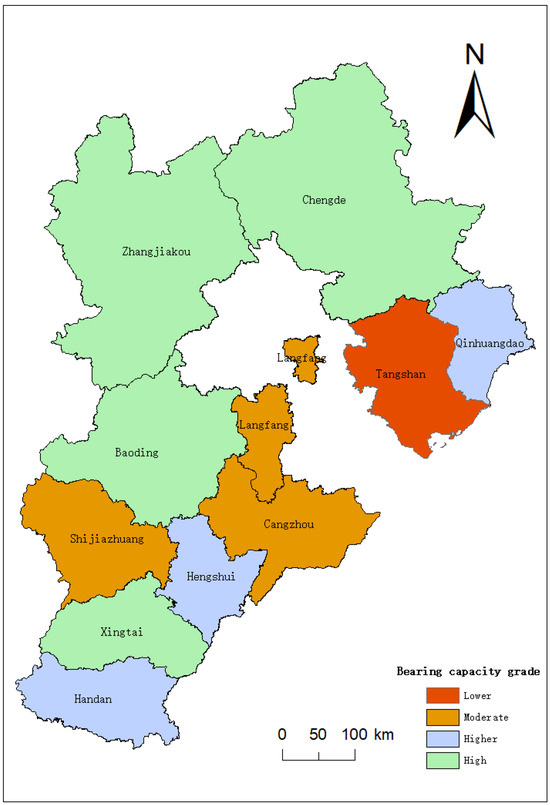
Figure 4.
Spatial distribution of WRCC across prefecture-level cities in Hebei Province (2023).
As shown in Table 5, in terms of spatial distribution, Baoding, Zhangjiakou, Chengde, and Xingtai had comprehensive scores for WRCC greater than 0.55, and their evaluation levels were classified as strong. Qinhuangdao, Hengshui, and Handan had moderately strong evaluation levels. The evaluation levels for Shijiazhuang, Cangzhou, and Langfang were rated moderate. Tangshan had the lowest score, 0.3436, with its evaluation level categorized as moderately weak. The differences in WRCC among cities are primarily influenced by factors such as the water resource base, environmental conditions, the economic base, and the development direction. The WRCC in the municipal cities of Hebei Province varies due to differences in water resource foundations, ecological environments, economic conditions, and development directions. Baoding had the highest comprehensive score (0.5819), benefitting from its superior ecological environment, especially regarding the presence of Baiyangdian Lake, which significantly supports its WRCC. In addition, the planning and policy support for the Xiong’an New Area have further enhanced Baoding’s water resource capacity. Zhangjiakou, Chengde, and Xingtai also scored relatively high, mainly because these cities are crucial water source conservation areas. These cities play a key role in regional water resource allocation and ecological environment protection, contributing to a stronger WRCC that supports higher levels of socio-economic development and ecological preservation. Tangshan received a lower score, primarily due to its industrial structure being heavily weighted towards industry, with large industrial water demands and relatively low water utilization efficiency. The city suffers from water waste issues, particularly in the industrial sector, leading to water resource shortages and inefficiency. Therefore, improving industrial water use efficiency and adjusting the industrial structure will be key to enhancing Tangshan’s WRCC.
Table 5.
Comprehensive scores of prefecture-level cities in Hebei Province (2023).
Overall, the WRCC in Hebei Province has shown the following positive trends (see Figure 5a,b): agricultural water use has decreased year by year, ecological water use has gradually increased, and water use per CNY 10,000 of GDP has consistently declined. These findings indicate an improvement in the province’s water resource allocation, management, and protection capabilities. As an agricultural powerhouse, Hebei has long relied on groundwater irrigation, resulting in a decline in groundwater resources. However, with the advancement of technology and improvements in agricultural water use efficiency, agricultural water use has decreased year by year. In addition, the provincial government has actively adopted the “lucid waters and lush mountains are invaluable assets” approach while promoting economic growth and strengthening ecological protection. Relevant policies have been formulated to reinforce investments in the ecological environment. These measures have effectively promoted industrial structure adjustments and the development of emerging industries, thereby further reducing the economy’s dependence on water resources, thus decreasing water use per CNY 10,000 of GDP.
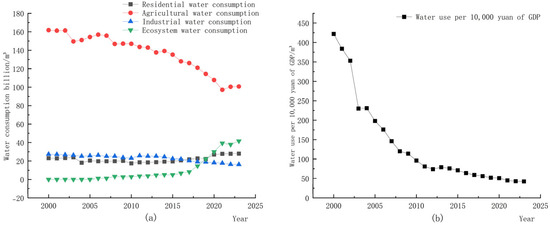
Figure 5.
(a) Changes in water use structure in Hebei Province. (b) Changes in water use per CNY 10,000 of GDP in Hebei Province.
4.4. Analysis of Obstacles Affecting WRCC
A diagnostic analysis of the degrees of intensity of the obstacles during the 2000–2023 period was conducted to identify the key constraints limiting the improvement of WRCC in Hebei Province. Based on Formula (27), the obstacle intensity degree of each evaluation indicator was systematically calculated, providing a quantitative foundation for identifying dominant inhibitory factors and guiding targeted policy interventions. Table 6 lists the top six obstacles, along with their respective obstacle intensity degrees, highlighting the most persistent bottlenecks in the WRCC system. In addition, Figure 6 presents the frequency distribution of these factors across the 24-year period, offering insight into their temporal stability and dominance. These findings help uncover the internal mechanism of the “resource–structure–ecology” constraint cycle and provide a direction for targeted water governance. Overall, the most significant obstacles are highly concentrated in the following three domains: population pressure from the social system (corresponding to the natural population growth rate, S15, with this factor being the most frequent obstacle), supply–demand imbalance in the ecosystem (corresponding to the ecological water use ratio, S6, and per capita ecological water use, S5, with this obstacle appearing a total of 39 times), and over-exploitation of the resource system (corresponding to the groundwater supply ratio, S18, with this obstacle appearing 18 times). As illustrated in Figure 7, the social subsystem consistently exhibited the highest degree of obstacle intensity, clearly indicating that Hebei’s water crisis is fundamentally driven by high-intensity human socioeconomic activities.
Table 6.
Major obstacle factors (OFs) and obstacle degrees (ODs) for WRCC in Hebei (2000–2023).
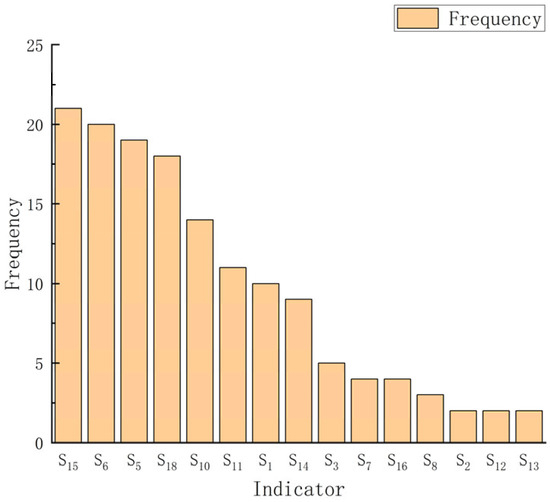
Figure 6.
Frequency statistics on major obstacle factors for WRCC during the 2000–2023 period.
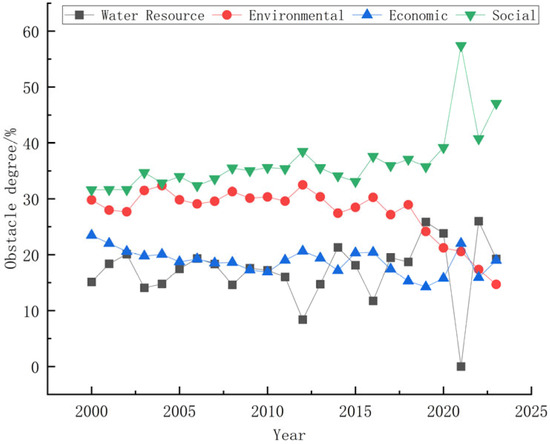
Figure 7.
Obstacle degrees for WRCC subsystems in Hebei Province (2000–2023).
A deeper analysis of the dynamic evolution of these factors uncovers a profound vicious cycle. In the early phase of the study (c. 2000–2010), population pressure (S15) acted as the primary direct driver, leading to an over-reliance on groundwater (S18) and squeezing out vital ecological water use (S5, S6), creating a resource-based dilemma consisting of “too many people, not enough water.” As time progressed, especially after 2010, structural problems within the economic subsystem became increasingly prominent. An industrial structure dominated by heavy industry and extensive agriculture led to extremely high consumption of industrial water (S11) and agricultural water (S10). This phenomenon formed a self-reinforcing vicious cycle: The rigid demand for water from socioeconomic development (→) led to the over-extraction of groundwater (with S18 being a frequent obstacle) (→), leading to declining water tables and ecological degradation (with S5 and S6 serving as frequent obstacles) (→); this limited water availability, in turn constraining the green transformation of the industrial structure, making it difficult to escape the water-intensive economic model.
This mechanism is further substantiated by the analysis at the criterion layer (Figure 8). Throughout the entire study period, the obstacle degree for the “Pressure layer,” composed of socioeconomic indicators like population, urbanization, and industrial/agricultural water use, was systematically and consistently higher than that for the “Support layer,” which includes factors like precipitation and water treatment capacity. This finding provides compelling evidence that the fundamental constraint on Hebei’s WRCC is not an absolute deficit in natural endowment but rather a structural imbalance where the load from pressure far exceeds the carrying capacity. The mitigating trend in the pressure degree observed after 2021 is highly consistent in terms of timing with the implementation of the South-to-North Water Diversion Project, industrial restructuring, and the strictest water resource management policies, indicating that comprehensive policy interventions are the only effective pathway to breaking the aforementioned vicious cycle.
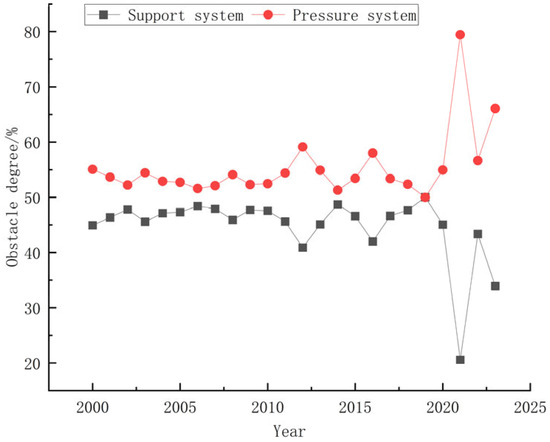
Figure 8.
Obstacle degrees of WRCC system layers in Hebei Province (2000–2023).
5. Discussion
5.1. Scientific Validity and Superiority of the Combined Weighting–GRA-TOPSIS Model
In the evaluation of WRCC, the determination of indicator weights is the key factor influencing the reliability of the results. The primary methodological contribution of this study is the construction of a combined weighting model, which effectively addresses the limitations of traditional single-method approaches. The widely used EWM, though objective in terms of capturing data variability, has been shown in previous studies (e.g., those by Zhang et al. [41] and Liu et al. [42]) to overemphasize certain indicators, especially when inter-indicator correlations are neglected. In this study, the EWM assigned a disproportionately high weight to S6 (ecological water use ratio = 0.1329), introducing bias in the evaluation of ecological factors. To mitigate this issue, we integrated the CRITIC method, which accounts for both contrast intensity and conflict among indicators, thereby correcting weight imbalances. Additionally, PP was employed to further refine the structure of the weight vector, particularly via enhancing sensitivity to economic dimensions. Unlike previous studies, wherein the authors relied on a single method, our combined weighting strategy synthesizes information from the following three perspectives: data dispersion, inter-variable conflict, and structural optimization. This integration enhances the comprehensiveness and credibility of the weighting process. The effectiveness of this method was verified through its application to a 24-year time series and a multi-city spatial dataset covering 11 cities in Hebei Province. Our method successfully captured subtle temporal and regional WRCC variations that were overlooked by single-weighting approaches.
Although this study did not employ additional methods (e.g., DEMATEL) to explicitly analyze interactions between criteria, the weighting methods used inherently reflect certain aspects of criterion relationships. Specifically, EWM incorporates data variability through information entropy, while CRITIC directly accounts for inter-criteria correlations to reduce redundancy. Therefore, even without dedicated dependency modeling, the combined approach still captures key elements of criterion interdependence.
Furthermore, we adopted a GRA-TOPSIS method to overcome the limitations of traditional TOPSIS methods, which often suffer from unstable rankings when alternatives have similar distances to the ideal solution [43]. By incorporating GRA, our model evaluates both the geometric proximity to the ideal solution and the pattern similarity among alternatives, thus improving its discriminatory power. This improvement allowed us to distinguish between cities with nearly identical WRCC scores—such as Chengde and Qinhuangdao—and reveal nuanced differences in their internal driving mechanisms. These findings support the methodological enhancement proposed by Zhang et al. (2023) [44], while our application extends this approach through a robust spatiotemporal dataset and a focus on sustainable resource planning.
5.2. Driving Mechanisms and Governance Strategies
The spatiotemporal evolution patterns of WRCC revealed in this study are the result of a synergistic interplay among policy interventions, industrial structure, and resource endowments. In the temporal dimension, the fluctuating growth in WRCC is highly coupled with key policy nodes, with a significant increase observed after the full implementation of the “Beijing–Tianjin–Hebei Coordinated Development” strategy in 2018 [45]. In the spatial dimension, a distinct north–south gradient reflects differences in regional functional positioning. Northern cities like Zhangjiakou and Chengde, serving as “Capital Water Source Conservation Areas,” exhibit higher WRCC, whereas southern and eastern cities like Handan, Xingtai, and Tangshan have suppressed WRCC because they host water-intensive industries [46]. The most critical finding of this study is the identification of a “chained positive feedback effect” among obstacle factors; during the extensive development phase, population pressure drove groundwater over-reliance. In the subsequent governance phase, industrial water inefficiency became the main bottleneck, forming a self-reinforcing vicious cycle with groundwater over-extraction, which is the deep-seated reason for the persistent regional water crisis.
Based on our mechanistic analysis of WRCC’s distinct north–south divergence in Hebei Province (with better performance in northern regions), we propose the following three targeted governance strategies: (1) spatially differentiated management—implementing mandatory industrial water quotas (with specific targets) and recycling retrofits in vulnerable areas (e.g., Tangshan’s heavy industry zone) while also establishing ecological compensation mechanisms incorporating per capita ecological water use into performance evaluations for high-capacity regions (e.g., Chengde); (2) smart water infrastructure development—constructing a Xiong’an-style intelligent water network utilizing blockchain for water rights management, coupled with rainwater harvesting and wastewater recycling technologies to achieve ≥25% unconventional water utilization by 2030 [47]; and (3) regional coordination—establishing a Beijing–Tianjin–Hebei water–carbon–energy nexus platform that integrates groundwater extraction control progress into cross-regional ecological compensation mechanisms, thereby supporting the Capital Water Source Conservation Functional Zone initiative.
5.3. Comparison with Existing Research
The findings of this study exhibit both alignment with the existing literature and substantive methodological and theoretical advancements. On the one hand, our identification of population growth as a major obstacle factor is consistent with the conclusions of Chen et al. (2022) [48] in their study on the Yellow River Basin, confirming that demographic pressure is a common critical factor constraining water security across North China. On the other hand, this study has made two key breakthroughs. The first concerns the weighting of ecological indicators. This study emphasizes the importance of regional heterogeneity in the weighting process. Unlike conventional studies in which uniform weight schemes are applied, we highlight the need for context-specific calibration, particularly for ecological indicators whose significance varies significantly across hydrological zones.
The second is a key theoretical revelation. Our core theoretical contribution is the identification of a “groundwater dependence–industrial inefficiency” feedback loop, which links resource depletion and economic structure in a mutually reinforcing cycle. Previous studies typically analyzed obstacle factors in isolation. In contrast, our findings expose a dynamic, chained interaction, offering a new micro-level lens through which the water-related “resource curse” manifests in industrializing regions. Furthermore, the theoretical framework of this feedback loop, while grounded in the Hebei context, offers a transferable analytical lens for other water-stressed industrializing regions worldwide. The preconditions for this vicious cycle likely include (a) an economic structure heavily reliant on water-intensive industries, (b) increasing water scarcity against a backdrop of growing demand, and (c) institutional or market failures that prevent efficient water allocation and technological innovation. Regions exhibiting these characteristics, such as other provinces along the Yellow River Basin in China (e.g., Shanxi, Henan, Inner Mongolia) that share similar challenges of over-exploitation and industrial transition, could be susceptible to the same dynamics identified here. Internationally, parallels can be drawn to arid industrial zones in India, Iran, or parts of the southwestern United States, where groundwater depletion threatens economic stability. Thus, our model provides a new diagnostic tool for analyzing the internal constraints on water resource carrying capacity beyond this specific case study. These breakthroughs not only enhance methodological rigor but also deepen our theoretical understanding of the internal constraints on regional WRCC improvement.
6. Conclusions
In this study, we established a WRCC evaluation system comprising 18 indicators across four subsystems (social, economic, water resources, and environmental), integrating support and pressure frameworks. Using combined weighting methods (EWM, PP, and CRITIC) and GRA-TOPSIS, we assessed Hebei Province’s WRCC from 2000 to 2023, with ODM identifying key annual influencing factors. The key findings are as follows: (1) the temporal evolution shows a “dual-phase” pattern, with medium-level fluctuations from 2000 to 2017 followed by an upward trend (2018–2023) due to ecological water replenishment policies and conservation projects, demonstrating effective water governance; (2) spatial differentiation highlighted stronger WRCC in northern (Zhangjiakou, Chengde) and central (Baoding) regions with superior ecological function and water endowments, contrasting with industrial zones (Tangshan) affected by water-intensive industries; and (3) obstacle analysis identified a three-dimensional constraint system, constituting social pressure (population growth rate), economic structure (agricultural/industrial water intensity), and water environment (groundwater dependency and ecological water deficit), where population growth rigidity and groundwater overexploitation form core constraints, exacerbated by inefficient agricultural/industrial water use.
Despite its valuable findings, this study has limitations. First, while the indicator system was designed to be comprehensive, it may not have included all potential influencing factors, such as institutional elements like water rights systems or inter-regional water markets. Second, data availability constrained a deeper consideration of environmental issues like groundwater quality evolution. Future research could be extended by (1) coupling water quality and quantity to develop a more integrated “water resource health carrying capacity” model and (2) using scenario simulations to predict the future trajectory of WRCC under different policy interventions, thereby providing more dynamic scientific support for forward-looking decision-making.
Author Contributions
Conceptualization, N.W. and Q.Z.; methodology, L.Y.; software, N.W. and Y.C. directed by Q.Z.; formal analysis, N.W.; investigation, N.W., Q.Z. and Y.C. directed by L.Y.; data curation, Y.H. and S.C. directed by L.Y.; writing—original draft preparation, N.W.; writing—review and editing, N.W., Q.Z. and L.Y.; visualization, N.W., L.Y. and Y.H.; funding acquisition, Q.Z. and L.Y. All authors have read and agreed to the published version of the manuscript.
Funding
This research was supported by North China Institute of Aerospace Engineering (NCIAE) Doctoral Research Start-up Fund (Project No. BKY-2025-03).
Data Availability Statement
A comprehensive WRCC evaluation dataset can be accessed at repository name: the Hebei Provincial Water Resources Department, the Hebei Provincial Bureau of Statistics, and the National Bureau of Statistics; direct URL to data: http://slt.hebei.gov.cn/ (accessed on 12 January 2025), http://tjj.hebei.gov.cn/ (accessed on 6 October 2024), and https://www.stats.gov.cn/ (accessed on 20 December 2024).
Conflicts of Interest
The authors declare no conflicts of interest.
References
- Zhang, Z.; Zhang, B.; Zhou, P. Issues and Recommendations on the Development and Utilization of Water Resources in Hebei Province. Water Resour. Dev. Manag. 2022, 11, 12–17. [Google Scholar] [CrossRef]
- Duan, C.; Liu, C.; Chen, X. Preliminary research on regional water resources carrying capacity conception and method. Acta Geogr. Sin. 2010, 65, 82–90. [Google Scholar]
- Zhu, Y.; Drake, S.; Lü, H. Analysis of Temporal and Spatial Differences in Eco-environmental Carrying Capacity Related to Water in the Haihe River Basins, China. Water Resour. Manag. 2010, 24, 1089–1105. [Google Scholar] [CrossRef]
- Zhang, Y.; Yue, Q.; Wang, T.; Zhu, Y.; Li, Y. Evaluation and early warning of water environment carrying capacity in Liaoning province based on control unit: A case study in Zhaosutai river Tieling city control unit. Ecol. Indic. 2021, 124, 107–112. [Google Scholar] [CrossRef]
- Long, X.; Wu, S.; Wang, J.; Wu, P.; Wang, Z. Urban water environment carrying capacity based on VPOSR-coefficient of variation-grey correlation model: A case of Beijing, China. Ecol. Indic. 2022, 138, 108–114. [Google Scholar] [CrossRef]
- Chen, Z.; Zhao, Y.; Li, X.; Liu, G.; Zhang, J.; Li, R. Evaluation of coal mine resources carrying capacity in Weixin County, Yunnan Province. Geol. China 2023, 50, 442–458. [Google Scholar] [CrossRef]
- Zhang, C.; Zheng, S.; Wu, Y. Theoretical Method and Application of Assessment on Water Resources Carrying Capacity: A Case Study of Binzhou, Shandong. In Proceedings of the 25th International Symposium on Advancement of Construction Management and Real Estate CRIOCM 2020, Wuhan, Chian, 28–30 Novermber 2020; Lu, X., Zhang, Z., Lu, W., Peng, Y., Eds.; Springer: Singapore, 2021. [Google Scholar] [CrossRef]
- Li, M.; Zuo, R.; Wang, J.-S.; Yang, J.; Teng, Y.-G.; Shi, R.-T.; Zhai, Y.-Z. Apportionment and evolution process of pollution sources using PCA-APCS-MLR model in a typical riverside groundwater resource area. J. Contam. Hydrol. 2018, 218, 70–82. [Google Scholar] [CrossRef]
- Qin, J.; Wu, Z.-W.; Feng, J.; Niu, W.-L. Comparative analysis on the applicability of evaluation method for water resources carrying capacity. J. Water Resour. Water Environ. 2018, 13, 123–130. [Google Scholar] [CrossRef]
- Wang, Y.; Meng, L. Risk evaluation on water resources carrying capacity based on entropy weighting ideal point method. Yangtze River 2019, 50, 142–146+207. [Google Scholar] [CrossRef]
- Yang, M. Comprehensive evaluation of water resource allocation and rationality of water cycle distribution based on AHP and improved entropy weight method. Water Resour. Dev. Manag. 2023, 9, 22–27. [Google Scholar] [CrossRef]
- Li, Z.; Jing, A.; Huang, J.; Hou, Y. Analysis of water resources carrying capacity in Jincheng City based on entropy weight TOPSIS model. Agric. Technol. 2022, 42, 94–97. [Google Scholar] [CrossRef]
- Zhou, R.; Chen, M.; Jin, J.; Cui, Y.; Zhou, Y.; Ning, S. Research progress of projection pursuit method in water issues based on bibliometric analysis. J. Irrig. Drain. 2021, 40, 137–146. [Google Scholar] [CrossRef]
- Li, W.; Liu, S.; Chang, W.; Zhang, X.; Li, C.; Qin, T. Research Progress on the Evaluation of Water Resources Carrying Capacity. Pol. J. Environ. Stud. 2023, 32, 1975–1986. [Google Scholar] [CrossRef] [PubMed]
- Wang, Y.; Li, D.Y. Research on regional water environmental carrying capacity based on GIS and TOPSIS comprehensive evaluation model. Environ. Sci. Pollut. Res. 2023, 30, 57728–57745. [Google Scholar] [CrossRef] [PubMed]
- Chen, L.; Zhang, A.A. Evaluation and influencing factors of water resources and social economy in the Yellow River Basin. Water Resour. Prot. 2022, 39, 1–8. [Google Scholar] [CrossRef]
- Jiang, D.J.; Yu, H.Z.; Li, L.J. Dynamic evaluation of water resources carrying capacity in Shandong Province based on the comprehensive weight and TOPSIS model. Resour. Sci. 2024, 46, 538–548. [Google Scholar] [CrossRef]
- Xiang, F.; Chang, M.J. A comprehensive evaluation of the regional water resource carrying capacity—Application of main component analysis method. Resour. Environ. Yangtze Basin 1999, 8, 168–173. [Google Scholar]
- Lu, Y.; Xu, H.; Wang, Y.; Yang, Y. Evaluation of water environmental carrying capacity of city in Huaihe River Basin based on the AHP method: A case in Huai’an City. Water Resour. Ind. 2017, 18, 71–76. [Google Scholar] [CrossRef]
- Meng, L.; Chen, Y.; Li, W.; Zhao, R. Fuzzy comprehensive evaluation model for water resources carrying capacity in Tarim River Basin, Xinjiang, China. Chin. Geogr. Sci. 2009, 19, 89–95. [Google Scholar] [CrossRef]
- Zhao, X.Y.; Yu, J.; Liu, Y.Y.; Liu, H.L.; Pang, G.B. Dynamic evaluation of water resource carrying capacity in Jiangsu Province based on an improved PPC model. China Rural. Water Hydropower 2024, 17, 1–9. [Google Scholar] [CrossRef]
- Xia, H.; Chen, C.; Xu, Y.; Zhang, X.; Shi, Z. Improved TOPSIS Method for Water Resources Carrying Capacity Evaluation in Lianyungang City. Water-Sav. Irrig. 2019, 86–90. [Google Scholar] [CrossRef]
- Liu, P.; Lue, S.; Han, Y.; Wang, F.; Tang, L. Comprehensive Evaluation on Water Resources Carrying Capacity Based on Water-Economy-Ecology Concept Framework and EFAST-Cloud Model: A Case Study of Henan Province. China Ecol. Indic. 2022, 143, 109392. [Google Scholar] [CrossRef]
- Qi, Z.; Tan, B.X.; Cao, X.M.; Yu, H.; Shen, M. Spatial-temporal dynamics of ecological carrying capacity of the northeastern margin of the Ulan Buh Desert. Remote Sens. Nat. Resour. 2023, 35, 222–230. [Google Scholar] [CrossRef]
- Cui, Y.; Feng, P.; Jin, J.L.; Liu, L. Water resources carrying capacity evaluation and diagnosis based on set pair analysis and improved the entropy weight method. Entropy 2018, 20, 359. [Google Scholar] [CrossRef]
- Zhang, M.; Zhou, J.; Zhou, R. Evaluating sustainability of regional water resources based on improved generalized entropy method. Entropy 2018, 20, 715. [Google Scholar] [CrossRef]
- Yang, J.; Lei, K.; Khu, S.; Meng, W. Assessment of Water Resources Carrying Capacity for Sustainable Development Based on a System Dynamics Model: A Case Study of Tieling City, China. Water Resour. Manag. 2015, 29, 885–899. [Google Scholar] [CrossRef]
- Wang, Y.; Deng, X.; Fan, H.; Han, J.; Li, Z. Research advances and arid zone applications of coupled models for water resources carrying capacity. Arid. Zone Res. 2025, 42, 1004–1020. [Google Scholar] [CrossRef]
- Gong, L.; Jin, C. Fuzzy Comprehensive Evaluation for Carrying Capacity of Regional Water Resources. Water Resour. Manag. 2009, 23, 2505–2513. [Google Scholar] [CrossRef]
- Liu, H.Y.; Liu, Y.C.; Meng, L.H.; Jiao, K.Q.; Zhu, M.Y.; Chen, Y.K.; Zhang, P. Research progress of entropy weight method in water resources and water environment. J. Glaciol. Geocryol. 2022, 44, 299–306. [Google Scholar] [CrossRef]
- Lin, L.Z.; Li, D.; Lin, Z. Evaluation of water resource carrying capacity in the Kubuqi Desert based on the entropy weight-TOPSIS model. J. Cent. China Norm. Univ. Nat. Sci. 2020, 54, 640–646. [Google Scholar] [CrossRef]
- Ma, T.; Han, S.B.; Li, F.C.; Li, W.L.; Zhao, M.M.; Li, H.X. Analysis and coordinated development of water resource carrying capacity in Yulin City. China Water Conserv. Bull. 2022, 43, 248–255. [Google Scholar] [CrossRef]
- Wang, Y. Evaluation of Regional Water Resources Carrying Capacity: A Support-Pressure Coupling Mechanism Approach. Stat. Obs. Decis. 2024, 48, 68–72. [Google Scholar] [CrossRef]
- Zhu, Y.; Tian, D.; Yan, F. Effectiveness of entropy weight method in decision-making. Math. Probl. Eng. 2020, 2020, 3564835. [Google Scholar] [CrossRef]
- Jee, J.R. Projection pursuit. Wiley Interdiscip. Rev. Comput. Stat. 2009, 1, 208–215. [Google Scholar] [CrossRef]
- Wu, W.; Wu, X.; Xia, D. A Simplified Analysis of Calculation Methods for Area Rainfall in the Dongjiang River Basin. J. Water Resour. 2010, 16, 123–126. [Google Scholar] [CrossRef]
- Han, F.; Alkhawaji, R.N.; Shafieezadeh, M.M. Evaluating sustainable water management strategies using TOPSIS and fuzzy TOPSIS methods. Appl. Water Sci. 2025, 15, 4. [Google Scholar] [CrossRef]
- Fan, J.; Huang, J.; Yuan, M.; Zhang, X.; Tan, C. The Application of Grey Correlation—Entropy Model in Water Resources Carrying Capacity Evaluation to Pearl river Delta. China Rural. Water Hydropower 2019, 35–39. [Google Scholar] [CrossRef]
- Wu, M.Y.; Zeng, X.C.; Liu, X.D.; Jin, W.Q. Evaluation of water resource carrying capacity in the five provinces of Northwest China based on the entropy weight-TOPSIS model. China Rural. Water Hydropower 2022, 91, 78–85. [Google Scholar] [CrossRef]
- Tian, F.J.; Li, S.Y.; Xie, J.H. The coupling coordination relationship and obstacle factors of green production and agricultural product quality safety. Chin. J. Agric. Sci. 2024, 1–10. [Google Scholar] [CrossRef]
- Herrera-Vidal, G.; Coronado-Hernández, J.R.; Derpich-Contreras, I.; Paredes, B.P.M.; Gatica, G. Measuring Complexity in Manufacturing: Integrating Entropic Methods, Programming and Simulation. Entropy 2025, 27, 50. [Google Scholar] [CrossRef]
- Liu, J.; Jin, X.; Xu, W.; Gu, Z.; Yang, X.; Ren, J.; Fan, Y.; Zhou, Y. A new framework of land use efficiency for the coordination among food, economy and ecology in regional development. Sci. Total Environ. 2020, 710, 135670. [Google Scholar] [CrossRef]
- Kuo, T. A modified TOPSIS with a different ranking index. Eur. J. Oper. Res. 2017, 260, 152–160. [Google Scholar] [CrossRef]
- Yin, Y.; Zhang, R.; Su, Q. Threat assessment of aerial targets based on improved GRA-TOPSIS method and three-way decisions. Math. Biosci. Eng. 2023, 20, 13250–13265. [Google Scholar] [CrossRef] [PubMed]
- Shang, H. Policy effect and spatial differentiation of Beijing-Tianjin-Hebei coordinated development. Geogr. Res. 2024, 43, 6763–6776. [Google Scholar] [CrossRef]
- Qiao, Y.; Li, Y.M.; Chen, Y.Z.; Wang, T.Y.; Hao, C. Evolution and matching characteristics of urbanization and sustainable water resource utilization in the Beijing-Tianjin-Hebei region. China Environ. Sci. 2023, 43, 6763–6776. [Google Scholar] [CrossRef]
- Zhang, N.; Li, H.Y.; Zhang, J.B.; Wang, Z.; Jiang, M. The spatiotemporal evolution features and influencing factors of water environment co-governance in China: Thinking based on the closed-loop and synergy mechanism of water control process. China Environ. Sci. 2023, 43, 6763–6777. [Google Scholar] [CrossRef]
- Chen, Y.P.; Fu, B.J.; Zhao, Y.; Wang, K.B.; Zhao, M.M.; Ma, J.F.; Wang, H. Sustainable development in the Yellow River Basin: Issues and strategies. J. Clean. Prod. 2020, 263, 121223. [Google Scholar] [CrossRef]
Disclaimer/Publisher’s Note: The statements, opinions and data contained in all publications are solely those of the individual author(s) and contributor(s) and not of MDPI and/or the editor(s). MDPI and/or the editor(s) disclaim responsibility for any injury to people or property resulting from any ideas, methods, instructions or products referred to in the content. |
© 2025 by the authors. Licensee MDPI, Basel, Switzerland. This article is an open access article distributed under the terms and conditions of the Creative Commons Attribution (CC BY) license (https://creativecommons.org/licenses/by/4.0/).