Abstract
The dataset presented in this manuscript consists of three distinct sets of data collected during a laboratory experiment aimed at quantifying the emissions of greenhouse gases (GHGs), specifically methane (CH4), carbon dioxide (CO2), and nitrous oxide (N2O). The experiment was conducted in three phases, each initiated at different times. The first phase began on 6 June 2022, using a biocover composed of 60% fine-fraction waste, 20% clay soil, and 20% stabilized compost. The second phase commenced on 26 August 2022, with two biocover variants: one composed of 50% fine-fraction waste and 50% clay soil, and the other consisting of 40% fine-fraction waste, 40% clay soil, and 20% shredded paper. The final phase started on 27 October 2022, introducing two biocovers: one containing 25% dried algae, 25% fine-fraction waste, 25% gravel (0–20 mm), and 25% ash, and the other composed of 40% fine-fraction waste, 40% dried algae, and 20% chernozem. Emission assessments were conducted three weeks after the biocover installation to allow for settling and stabilization, followed by weekly measurements two to three days before irrigation with 250 mL of water to simulate field conditions. GHG emission quantification was carried out using the Cavity Ring-Down Spectroscopy gas measurement device, Picarro G2508. This dataset offers substantial scientific value for advancing biocover technologies aimed at reducing GHG emissions in landfill environments, particularly for mitigating methane emissions. In addition to initial experimental use, the dataset offers a wide range of possibilities for reuse, including modeling landfill gas emissions, validating gas flow measurement methods, developing machine learning models, and performing meta-analyses. Its detailed structure facilitates multi-faceted environmental research and supports optimization of landfill management.
Dataset License: CC BY 4.0
1. Summary
Landfills are significant sources of greenhouse gas (GHG) emissions, primarily methane (CH4), carbon dioxide (CO2), and nitrous oxide (N2O), which contribute to global warming and climate change. Waste disposal in landfills has been identified as a major contributor to GHG emissions in the waste sector [1,2]. Landfills containing large quantities of biodegradable waste are particularly prone to higher methane emissions due to anaerobic decomposition processes [3]. Biocover technology has emerged as an effective and relatively low-cost approach for mitigating methane emissions from landfills [4,5]. Long-term field-scale investigations have confirmed its potential to significantly reduce fugitive methane emissions under a variety of climatic and operational conditions [6]. In practical applications, biocovers are used both in active and in closed landfill cells, functioning as engineered cover layers that promote methane oxidation by methanotrophic bacteria. These microorganisms convert CH4 into CO2, which has a substantially lower global warming potential.
The performance of biocovers depends largely on their material composition, thickness, and physical properties. Organic matter-rich substrates such as compost or cellulose have been shown to enhance microbial activity and improve methane oxidation efficiency [7,8]. Mineral components, including clay and gravel, can improve structural stability and moisture regulation, while certain amendments such as ash or algae may provide nutrients and improve porosity [8].
In the present study, the biocover components—fine-fraction waste, clay soil, stabilized compost, shredded paper, dried algae, gravel, ash, and chernozem—were selected based on prior findings regarding their suitability for enhancing methane oxidation and maintaining structural stability under landfill conditions [4,5,6,7,8]. The controlled laboratory experiment was designed to systematically evaluate different material combinations for their effect on CH4, CO2, and N2O emissions, generating data that can inform the optimization of landfill biocover design for climate change mitigation.
2. Data Description
The data obtained from the greenhouse gas measurements were collected using a Cavity Ring-Down Spectroscopy (CRDS) device, the Picarro G2508 (Picarro Inc., Santa Clara, CA, USA), which provides high-precision quantification of greenhouse gas (GHG) emissions. These data were collected in real time from the biocover system and subsequently processed by the Soil Flux Processor 1.2.05. Fluxes were processed by ordinary least squares on concentration–time records acquired with the Picarro G2508 and processed in the Soil Flux Processor (v1.2.05). For accepted measurements, the linear fit achieved R2 ≥ 0.95, and the standard deviation/standard error of the fitted slope remained below the instrument detection limits for the corresponding gases as specified by the manufacturer. The Picarro G2508 uses laser-based spectroscopy to measure gas concentrations with high sensitivity, while the Soil Flux Processor 1.2.05 integrates these raw measurements, applying flux calculations to derive gas emission rates from the soil.
This dataset includes emissions data for methane (CH4), carbon dioxide (CO2), and nitrous oxide (N2O) from a biocover experiment. Methane and nitrous oxide emissions are provided in nmol m−2 s−1, while carbon dioxide emissions are given in μmol m−2 s−1. The dataset records the start dates for each experimental phase (6 June, 26 August, and 27 October 2022).
The dataset is provided in an Excel file, which consists of three experimental data sheets: “1 exp.” (123 measurements), “2 exp.” (108 measurements), and “3 exp.” (90 measurements), totaling 321 measurements. Each sheet includes eight columns. The first column in the dataset table represents the year of measurement, followed by the date, measurement chamber serial number, and experimental composition. The subsequent columns provide the emissions data for each of the GHGs (First—N2O, Second—CH4, and Third—CO2). The last column of data also shows NH3 emissions, as the measuring device also recorded this gas.
2.1. Data Quality
Potential sources of error or noise in this experiment included environmental variability, instrumental baseline drift, chamber leakage, and background signals, each of which were carefully mitigated. Even under laboratory conditions, variations in temperature and moisture can affect gas production and measurement; therefore, these parameters in the biocover were continuously monitored throughout the study to control their impact on emissions. Over time, gradual sensor baseline shifts could also introduce errors, but the Picarro analyzer is known for negligible long-term variation and inherent stability; according to the manufacturer’s recommendations, the instrument requires calibration approximately every 100 h of operation [9]. In this study, calibration was performed prior to the start of the experiment, and since the total duration did not exceed 100 h, no repeated calibration was necessary during the experimental period. This procedure reset the instrument’s baseline and preserved its sensitivity, maintaining high precision throughout the study. In addition, built-in corrections—such as automatic water vapor correction for CO2, CH4, and N2O—helped minimize interference from ambient humidity, further enhancing signal clarity. A properly sealed chamber was likewise crucial: leaks would allow outside air to dilute the sample, so airtight lids with dedicated inlet/outlet ports and a vacuum pump were used to circulate sample air. Real-time concentration monitoring served as an immediate check for system integrity, where a stable rise in CO2 indicated an effective seal. Finally, background atmospheric GHG levels or electronic noise could add variability to the readings, but measuring in a closed-loop system minimized ambient influence, and the inclusion of control columns without a biocover in each experimental phase provided baseline readings for comparison, helping to distinguish true biocover effects from background emissions.
2.2. Potential for Data Reuse
The dataset contains greenhouse gas measurements of methane (CH4), carbon dioxide (CO2), and nitrous oxide (N2O) emissions from different biocover formulations under laboratory conditions. This information offers a wide range of possibilities for data reuse, including landfill emissions modeling, comparative analysis of biocover performance under varying environmental conditions, and the development and training of machine learning algorithms to predict emissions while accounting for biocover properties and environmental variability.
Using these data, it is possible to perform a meta-analysis, pooling the results of several studies to draw broader conclusions on the effectiveness of biocovers. They can also serve as baseline data for the validation of gas flow measurement methods. They can help in the evaluation of new biocovers, comparing the performance of existing materials, and looking for new biocover combinations or improving existing ones. The dataset is suitable for building regression models for emission prediction and analysis.
These measurements were obtained under controlled laboratory conditions in 160 mm diameter columns with fixed layer configurations. Therefore, direct extrapolation to full-scale landfill covers should be made with caution, taking into account scale-dependent gas transport processes, precipitation and evaporation cycles, seasonal temperature variations, and material aging effects. The dataset is intended primarily for method development, model calibration and validation, and comparative analyses, rather than for deriving site-specific emission factors.
3. Methods
3.1. Materials and Preparation Process for Biocover Development
The experiment began with the preparation of various materials essential for the development of the biocover. These materials were selected to ensure the biocover’s functionality, sustainability, and environmental compatibility. The materials prepared for this purpose include fine-fraction waste, stabilized compost, clay soil, shredded paper, dried algae, gravel (0–20 mm), ash, and chernozem (see Figure 1). For the study, cylindrical columns (160 mm diameter, 1200 mm length) were prepared to simulate biocover systems.
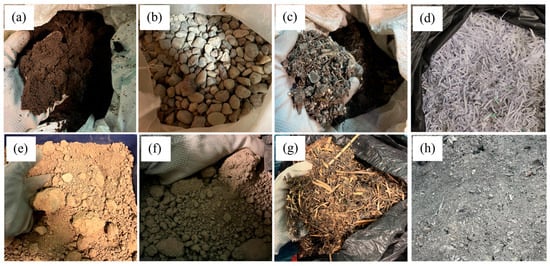
Figure 1.
Materials used for the development of biocovers. (a) Stabilized compost; (b) gravel (0–20 mm); (c) fine-fraction waste; (d) shredded paper; (e) clay soil; (f) chernozem; (g) dried algae; (h) ash.
3.2. Experimental Design
The tube columns were installed under controlled laboratory conditions to ensure consistency across all experimental setups. Water-saturated compost mixed with fine-fraction waste was selected as the emission source for all tube columns, as this composition was deemed suitable for laboratory investigations. This emission source was placed at the base of each column with a thickness of 500 mm. A 300 mm layer of sand was then applied to separate the emission source from the biocover layer, ensuring a controlled gas diffusion process. The topmost layer consisted of a 400 mm thick biocover, with material compositions varying depending on the experimental conditions. The selection of a 400 mm biocover thickness in this study was guided by evidence from previous research. Studies have reported the use of similar thicknesses to provide a sufficient reactive layer depth for methane oxidation while maintaining stable moisture and temperature regimes within the cover material [10,11]. The materials used for these layers were homogenized by mechanical mixing. No sieving was performed prior to placement in the experimental columns.
In this study, the raw materials for each biocover composition were manually mixed, with each composition prepared separately to ensure uniform distribution of components within the layer. The mixing process was performed without mechanical sieving, as all materials were used in the form in which they were obtained. This approach reflects practical handling conditions and allows the preservation of the original particle size distribution of the materials.
The experiment was structured into three phases, each initiated at a different starting date. Within each experimental phase, different biocover mixtures were tested, and in each section, one column was left without a biocover to serve as a control (one for each phase; three in total). This experimental design enabled assessment of the efficiency of various biocover compositions in reducing GHG emissions, by comparing covered columns against an uncovered control.
3.2.1. First Phase of the Experiment
The first phase began on 6 June 2022, with three columns. The biocover composition was 60% fine-fraction waste, 20% clay soil, and 20% stabilized compost. Two columns included biocovers, while one served as a control without a biocover. A total of 41 measurements per column, 123 measurements in total, were taken between 27 June 2022 and 1 September 2023. A graphical representation of the tube columns produced in the experiment can be seen in Figure 2.
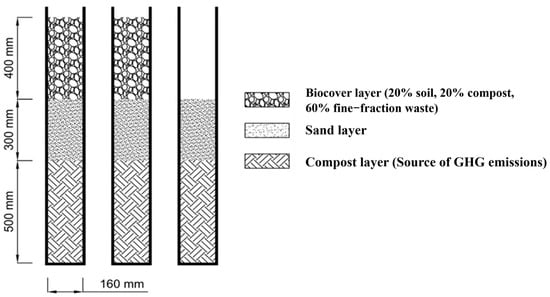
Figure 2.
Schematic of the experimental tube column setup for the first part of the experiment.
3.2.2. Second Phase of the Experiment
The second phase started on 26 August 2022, using three columns. The first biocover consisted of 50% fine-fraction waste and 50% clay soil, while the second included 40% fine-fraction waste, 40% clay soil, and 20% shredded paper. A total of 36 measurements per column, 108 measurements in total, were taken between 16 September 2022 and 1 September 2023. Figure 3 presents a schematic illustration of the tube columns used in the experiment.
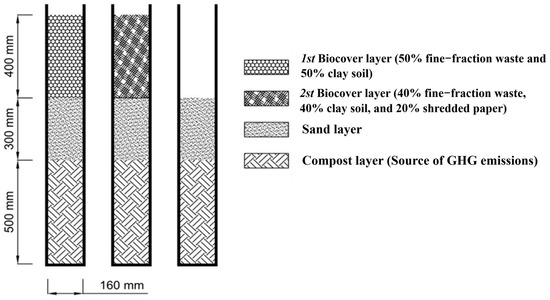
Figure 3.
Schematic of the experimental tube column setup for the second part of the experiment.
3.2.3. Third Phase of the Experiment
The third phase started on 27 October 2022, also with three columns. The first biocover contained 25% dried algae, 25% fine-fraction waste, 25% gravel (0–20 mm), and 25% ash, while the second included 40% fine-fraction waste, 40% dried algae, and 20% chernozem. A total of 30 measurements per column, 90 measurements in total, were conducted between 17 November 2022 and 1 September 2023. Figure 4 depicts a visual schematic of the tube columns constructed for the experiment.
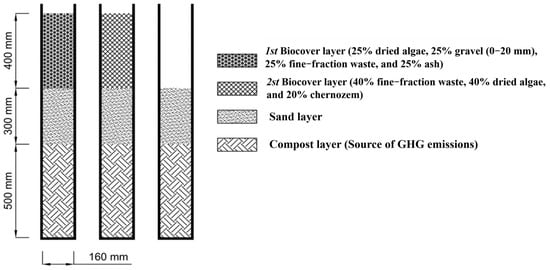
Figure 4.
Schematic of the experimental tube column setup for the third part of the experiment.
3.3. Biocover Moisture and Temperature Conditions
Biocover moisture and temperature were monitored weekly throughout the experiment, two to three days before irrigation, to assess their effect on gas emissions and to simulate field conditions with moisture fluctuations driven by precipitation and evaporation. Each irrigation applied 250 mL of water to the biocover layer to maintain realistic moisture dynamics. This volume, for a column with a diameter of 160 mm, corresponds to approximately 12.4 mm of precipitation and was chosen to simulate a typical rainfall episode under Latvian climatic conditions, as daily precipitation of ≥10 mm occurs on average 15–20 times per year in the country [12]. The selected intensity level therefore reflects realistic meteorological conditions without causing excessive water saturation that could impede gas diffusion and methane oxidation.
Soil moisture and temperature were recorded immediately before each gas sampling using a moisture probe and a temperature sensor inserted into the biocover layer at consistent depths. The measurements confirmed that both parameters remained uniform across all biocover compositions, ensuring comparability between experimental setups (Figure 5). This controlled approach allowed for an accurate evaluation of biocover performance in mitigating GHG emissions without significant variability in environmental conditions.

Figure 5.
Biocover moisture and temperature data (date format: DD–YYYY–MMM).
3.4. GHG Measurement
Emission assessments were conducted three weeks after the biocover installation to allow for settling and stabilization. GHG emissions were measured using the Picarro G2508 [13] (see Figure 6). Emissions were measured both from biocover systems and from control columns without biocovers to assess the reduction in emissions attributable to the biocovers. For each experimental phase, the three columns were measured on the same day with a 1 min interval between columns. Measurements for all phases were carried out weekly starting from the beginning of the measurement period.

Figure 6.
The Picarro G2508 with a vacuum pump and two pipes—one for air intake and one for air discharge. This combination enables the measurement process.
During the measurements, a closed environment was ensured by covering the experimental columns with an insulated lid equipped with two pipes—one for air intake and one for air discharge (see Figure 6). The Picarro G2508 measured GHG concentrations from the columns at an airflow rate of 5 mL s−1. Each experimental column was measured for 250 s, and data were analyzed using the Soil Flux Processor 1.2.05, which displayed the GHG emissions at the end of each measurement [13]. The selected measurement duration was based on previous studies [14,15], where similar time intervals were found to provide stable concentration–time trends and reliable flux calculations.
During the measurements, we used the device’s real-time monitoring feature (Soil Flux Processor 1.2.05) to continuously track gas concentrations and verify that the measurement chamber remained properly sealed—an essential condition for high-quality data. Figure 7 illustrates the real-time CO2 concentration at around the 81st second of measurement.
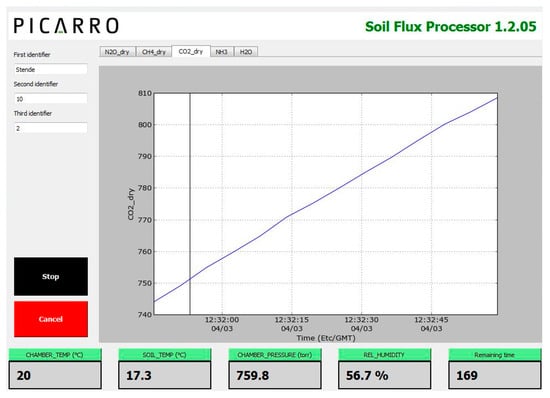
Figure 7.
Real-time CO2 concentration at 81 s.
Author Contributions
Conceptualization, K.S. and I.G.; methodology, K.S., I.G. and J.B.; software, K.S.; validation, K.S. and I.G.; formal analysis, K.S.; investigation, K.S.; resources, K.S., I.G. and J.B.; data curation, K.S.; writing—original draft preparation, K.S.; writing—review and editing, I.G.; visualization, K.S.; supervision, K.S. All authors have read and agreed to the published version of the manuscript.
Funding
This research received no funding.
Institutional Review Board Statement
Not applicable.
Informed Consent Statement
Not applicable.
Data Availability Statement
The original data presented in this data descriptor are openly available in the secure cloud-based communal repository: https://data.mendeley.com/datasets/7wdmxtz846/2 (accessed on 19 August 2025).
Conflicts of Interest
The authors declare no conflicts of interest.
References
- Guo, H.; Xu, H.; Liu, J.; Nie, X.; Li, X.; Shu, T.; Bai, B.; Ma, X.; Yao, Y. Greenhouse Gas Emissions in the Process of Landfill Disposal in China. Energies 2022, 15, 6711. [Google Scholar] [CrossRef]
- Mohammadi, K. Evaluation of some greenhouse gases emissions from landfill models of municipal solid waste. Sci. Future Lith. 2022, 14, 5–10. [Google Scholar] [CrossRef]
- Gupta, J.; Ghosh, P.; Kumari, M.; Thakur, I.S. Chapter 14—Solid waste landfill sites for the mitigation of greenhouse gases. Biomass Biofuels Biochem. 2022, 315–340. [Google Scholar] [CrossRef]
- Pecorini, I.; Iannelli, R. Landfill GHG Reduction through Different Microbial Methane Oxidation Biocovers. Processes 2020, 8, 591. [Google Scholar] [CrossRef]
- da Silva Van Tienen, Y.M.; de Lima, G.M.; Mazur, D.L.; Martins, K.G.; Stroparo, E.C.; Schirmer, W.N. Schirmer, Methane Oxidation Biosystem in Landfill Fugitive Emissions Using Conventional Cover Soil and Compost as Alternative Substrate—A Field Study. Clean Technol. Environ. Policy 2021, 23, 2627–2637. [Google Scholar] [CrossRef]
- Kriipsalu, M.; Somani, M.; Pehme, K.; Tamm, O.; Truu, J.; Truu, M.; Orupold, K. Performance of biocover in controlling methane emissions from landfill: A decade of full-scale investigation. Process Saf. Environ. Prot. 2023, 172, 486–495. [Google Scholar] [CrossRef]
- Aljbour, J.Y. Understanding CH4 Emissions from Compostables: An Exploration of Local CH4 Emissions from Landfilled Compostables and the Efficacy of Emission Mitigation via Anaerobic Biogas Digestion. Bachelor’s Thesis, Portland State University, Portland, OR, USA, 2022. Volume 1247. [Google Scholar] [CrossRef]
- Campbell, I.; Robinson, N. Landfill Methane Oxidation Techniques; Environment Agency: Bristol, UK, 2017. Available online: https://www.gov.uk/government/publications/landfill-methane-oxidation-techniques (accessed on 20 March 2024).
- Machado, L.A.; Kesselmeier, J.; Botia, S.; Van Asperen, H.; de Araújo, A.C.; Artaxo, P.; Edtbauer, A.; Ferreira, R.; Harder, H.; Jones, S.; et al. How Rainfall Events Modify Trace Gas Concentrations in Central Amazonia. EGUsphere 2024, 2024, 1–28. Available online: https://egusphere.copernicus.org/preprints/2024/egusphere-2023-2901/ (accessed on 19 August 2025). [CrossRef]
- Zhao, L.; Cheng, X.G.; Suo, J.C.; Yin, P.H. Optimization of Conditions of Digested Sludge Using Landfill Biocover Material for Enhance Methane Oxidation. Adv. Mater. Res. 2014, 838, 2797–2801. [Google Scholar] [CrossRef]
- Siltumens, K.; Grinfelde, I.; Burlakovs, J.; Liepa, S.; Grinberga, L. Impacts of biocover composition on greenhouse gas emission. Res. Rural. Dev. 2023, 38, 235–241. [Google Scholar] [CrossRef]
- Ministry of Environmental Protection and Regional Development of the Republic of Latvia. Climate Change Scenarios for Latvia. 2018. Available online: https://www.varam.gov.lv/en/media/32915/download?attachment (accessed on 12 August 2025).
- Fleck, D.; He, Y.; Alexander, C.; Jacobson, G.; Cunningham, K. Cunningham, Simultaneous soil flux measurements of five gases—N2O, CH4, CO2, NH3, and H2O—With the Picarro G2508. Picarro Inc. 2013, 2013, 10. Available online: https://www.picarro.com/environmental/an034_simultaneous_soil_flux_measurements_of_five_gases_n2o_ch4_co2_nh3_and_h2o_g2508 (accessed on 20 March 2024).
- Grinfelde, I.; Valujeva, K.; Zaharane, K.; Berzina, L. Automated cavity ring down spectroscopy usage for nitrous oxide emission measurements from soil using recirculation system. Eng. Rural. Dev. 2017, 16, 111–116. [Google Scholar] [CrossRef]
- PICARRO Inc. Soil Flux Processor, 3105 Patrick Henry Drive, Santa Clara, CA 95054, USA. 2022. Available online: https://www.picarro.com/sites/default/files/product_documents/Picarro%20Soil%20Flux%20Datasheet.pdf (accessed on 20 March 2024).
Disclaimer/Publisher’s Note: The statements, opinions and data contained in all publications are solely those of the individual author(s) and contributor(s) and not of MDPI and/or the editor(s). MDPI and/or the editor(s) disclaim responsibility for any injury to people or property resulting from any ideas, methods, instructions or products referred to in the content. |
© 2025 by the authors. Licensee MDPI, Basel, Switzerland. This article is an open access article distributed under the terms and conditions of the Creative Commons Attribution (CC BY) license (https://creativecommons.org/licenses/by/4.0/).