Abstract
This data descriptor presents a unique high-resolution rainfall dataset derived from 14 pluviograph stations across central Chile’s Mediterranean region, covering variable periods starting from between 1969 and 1992, up to 2009. The dataset provides continuous precipitation records at a 5 min temporal resolution, obtained through the digitization and processing of pluviograph strip charts using specialized software. This high temporal resolution is unprecedented for the region and enables detailed analysis of rainfall intensity, duration, and frequency patterns critical for hydrological research, climate studies, and water resource management in general. Each station’s data was subjected to quality control procedures, including manual validation and correction of digitization errors to ensure data integrity. The dataset reveals the significant temporal variability of rainfall in central Chile, capturing both short-duration high-intensity events and longer precipitation patterns. By making this dataset publicly available, we provide researchers with a valuable resource for studying rainfall behavior in a Mediterranean climate zone subject to significant climate variability and change. The dataset supports various applications, including the development of intensity–duration–frequency curves, analysis of rainfall erosivity, calibration of hydrological models, and investigation of precipitation trends in the context of climate change.
Dataset License: CC-BY 4.0
1. Introduction
Rainfall data at high temporal resolutions is critical for a wide range of hydrological applications, including understanding watershed responses, designing hydraulic infrastructure, and assessing the impacts of climate change on precipitation patterns [1,2]. In regions with complex topography and high spatial variability in rainfall, such as the Mediterranean climate zone of central Chile, fine-scale precipitation records are particularly valuable for water resource management and hazard prediction [3,4].
Historically, rainfall data in Chile has been collected using mechanical pluviographs that document continuous precipitation intensity on paper strip charts [5]. When digitized and properly processed, these analog records can provide rainfall intensity data at temporal resolutions as fine as 5 min [3]. This high-resolution data enables the development of intensity–duration–frequency (IDF) curves, which are essential tools for designing hydraulic structures, urban drainage systems, and assessing flood risks [6,7].
High-resolution rainfall datasets are rare in many parts of the world, including Chile, due to the challenges in maintaining and processing pluviograph records [8]. The labor-intensive nature of manual chart digitization has limited the availability of sub-hourly precipitation data [9,10]. Additionally, the transition from analog to digital pluviographic systems in recent decades has created potential discontinuities in long-term precipitation records, complicating the analysis of historical climate trends [11].
The preservation of high-resolution rainfall data directly supports several United Nations Sustainable Development Goals (SDGs). Most notably, this work contributes to SDG 6 (Clean Water and Sanitation) through improved water resources management and integrated watershed planning [12]. The dataset also supports SDG 13 (Climate Action) by providing climate data for adaptation planning [13]. Additionally, applications in the design of urban drainage and the assessment of flood risk contribute to SDG 11 (Sustainable Cities and Communities), and finally, erosion control applications support SDG 15 (Life on Land) through sustainable land management practices [14].
Applications of high-resolution rainfall data to agriculture are particularly critical in Mediterranean climates, where precise precipitation monitoring supports optimized irrigation scheduling, disease prediction models for crop pathogens that frequently depend on moisture conditions, and adaptation strategies for changing precipitation patterns under climate change scenarios [15,16].
To address these challenges, various methodologies to automate the digitization and processing of pluviograph strip charts have been developed by researchers. For example, Deidda et al. [17] proposed an image processing approach that utilizes adaptive thresholding, edge detection, and curve fitting techniques to extract rainfall traces from digital scans of pluviograph records. Similarly, Van Piggelen et al. [18] developed software that uses computer vision algorithms to automatically trace precipitation curves and convert them into high-resolution time series. These approaches demonstrate the potential for efficiently converting large volumes of analog rainfall records into digital formats suitable for modern hydrological analyses.
These methods involve image processing techniques such as segmentation [19,20], curve extraction [21], and signal recognition [22,23]. Recent advances in computer vision and machine learning have led to the improved accuracy and efficiency of rainfall data extraction from analog records [24].
For central Chile’s Mediterranean climate zone, understanding detailed rainfall patterns is crucial for effective water resource management and climate change adaptation. Pizarro et al. [25] examined the latitudinal gradient in annual precipitation throughout Chile, highlighting the strong north–south variation in rainfall totals and seasonality. Further work highlighted the influence of large bodies of water on rainfall intensity behaviours in central Chile, demonstrating the important role of topography and coastal proximity in driving local precipitation patterns [26]. Later, a simplified method for constructing IDF curves in ungauged areas of central Chile was proposed, emphasizing the need for high-resolution rainfall data to support hydrological design and planning [27].
While these studies have provided valuable insights into the characteristics of precipitation in central Chile, they have often been limited by the lack of long-term, high-temporal resolution rainfall records. Even though previous studies have examined various aspects of precipitation in this region, including latitudinal gradients [25], the influence of water bodies on rainfall intensity [26], and methods for extrapolating IDF curves to ungauged areas [27], these analyses have often been constrained by the lack of high-resolution rainfall data.
The availability of this dataset fills a significant gap in the hydrometeorological information for central Chile and provides an important resource for researchers, engineers, and decision makers. By making these data publicly accessible, this work aims to contribute to broader efforts in the rescue of climate data, which itself aims to preserve and utilize historical meteorological records for modern scientific analyses [28,29,30].
The remainder of this paper is organized as follows. Section 2 describes the data sources. Section 3 presents the methodology employed for digitizing and processing the pluviograph strip charts. Section 4 outlines the data format and structure to facilitate user access and analysis. Section 5 discusses potential applications, analytical opportunities, and important limitations of this dataset for hydrological research and water resource management.
2. Data Description
This dataset consists of high-temporal resolution rainfall records from 14 pluviograph stations distributed across central Chile’s Mediterranean climate region. The data covers variable time periods, with the earliest records beginning in 1969 and all records extending to 2009, providing approximately three to four decades of precipitation observations at 5 min resolution (see Table 1 for specific station periods). Figure 1 shows the geographical distribution of the monitoring stations.

Table 1.
Dataset geographical and availability information for the 14 pluviograph stations in central Chile.
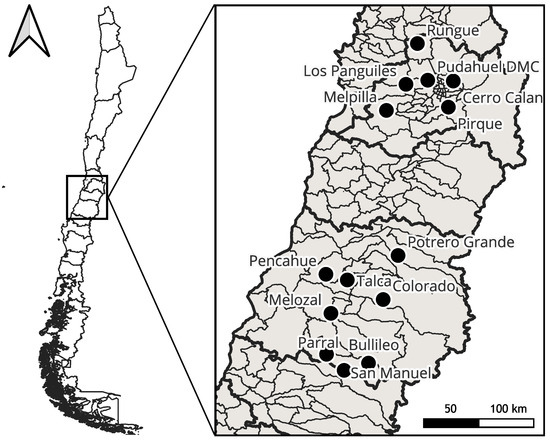
Figure 1.
Map of pluviograph station locations in central Chile, showing the spatial distribution across the Mediterranean climate zone. Stations are concentrated along the central valley, with elevations ranging from 55 to 848 m above sea level.
The stations span a north-to-south extent of approximately 350 km, from a 33° S to 36° S latitude, and are distributed across diverse topographical settings within central Chile’s Mediterranean climate zone. Elevation ranges from 55 m above sea level (masl) at Pencahue to 848 masl at Cerro Calán (Table 1). This geographical spread captures important climatic gradients, including coastal influences, inland valley conditions, and foothill environments, though high-elevation mountain areas remain underrepresented, and therefore, the presence of snow or solid precipitation is scarce in the study area.
2.1. Data Source and Instrumentation
The dataset was derived from mechanical recording pluviographs operated by the Chilean Meteorological Directorate (DMC, Spanish acronym) and the General Water Directorate (DGA, Spanish acronym). These instruments utilized a float-and-siphon system (Figure 2) that translated water level changes in a collection cylinder to vertical movements of an ink pen on a paper strip chart (Figure 3). The charts rotated on a drum at a constant rate (typically completing one revolution per week), producing continuous traces of accumulated rainfall over time. When the collection cylinder filled to capacity (typically representing 10 mm of precipitation), a siphoning mechanism emptied the cylinder, and the pen returned to the baseline position, creating a characteristic sawtooth pattern during precipitation events [2].
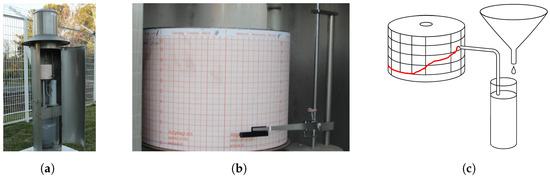
Figure 2.
Pluviograph stripchart mechanism. (a) Pluviograph rain gauge, with stripchart visible on drum, (b) close-up of stripchart and pen mechanism, and (c) schematic of mechanism. Source: Patricio González Colville, CITRA, Universidad de Talca.
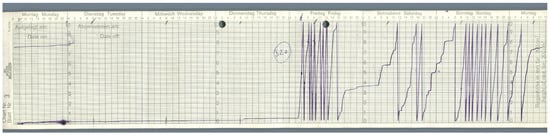
Figure 3.
Example of a pluviograph strip chart from central Chile showing rainfall records. The horizontal axis represents time while the vertical axis shows accumulated precipitation. The sawtooth pattern indicates siphoning events when the collection cylinder reached capacity and emptied. The trace is made from left-to-right, with the day and 24 h clock indicated along the upper horizontal axis.
The strip charts were changed weekly by technical personnel at each station and archived in physical storage facilities. These analog records constituted the primary source material for the development of the high-resolution digital dataset through a systematic digitization process detailed in Section 3.
2.2. Dataset Characteristics
The digitized dataset provides continuous precipitation records at 5 min temporal resolution, capturing rainfall intensity variations at a much finer scale than conventional daily observations. This high-resolution data reveals detailed characteristics of precipitation events, including the following:
- Temporal patterns: storm onset, peak intensity timing, and recession characteristics;
- Short-duration intensities: precipitation rates over durations from 5 min to several hours;
- Event structure: the internal structure of rainfall events, including multiple intensity peaks and dry periods within storms;
- Seasonal variations: detailed precipitation dynamics across Chile’s Mediterranean climate seasons.
The dataset encompasses the complete precipitation record for each station throughout its period of operation, recording at 5 min intervals. This temporal coverage captures significant climatic variation, including multiple El Niño–Southern Oscillation (ENSO) cycles and their effects on regional precipitation patterns.
Each data point provides the accumulated precipitation (in millimeters) during the preceding 5 min interval, with a precision of 0.01 mm. All timestamps are standardized to local Chilean time (CLT, UTC-4) without adjustments for historical changes in daylight saving time, ensuring temporal consistency across the entire record.
3. Methodology for Digitizing Pluviograph Strip Charts
3.1. Strip Chart Digitization Process
The conversion from analog charts to machine-readable digital data followed a systematic protocol developed specifically for this project, building upon methodologies described by Jaklič et al. [9] and Van Piggelen et al. [18] with adaptations for the specific characteristics of Chilean pluviographs.
The digitization process of the strip charts involved the following stages: high-resolution scanning of the original strip charts, automated trace extraction using image processing algorithms, comprehensive quality control verification, and compilation into standardized digital time series. Figure 4 illustrates the overall workflow from analog charts to the final high-resolution rainfall dataset.
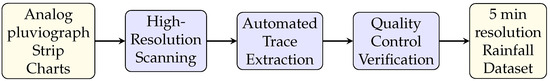
Figure 4.
High-level workflow for converting analog pluviograph strip charts into the high-temporal resolution rainfall dataset.
3.1.1. Preprocessing and Scanning
Each strip chart was visually inspected to assess quality and identify potential issues such as ink bleeds, paper damage, or recording anomalies. Then, acceptable charts were digitized using a high-resolution (600 dpi) flatbed color scanner. The scanning process ensured consistent orientation and positioning to minimize geometric distortions. Calibration marks on each chart were preserved to enable accurate temporal and magnitude scaling during subsequent processing.
The scanning parameters were chosen so as to enhance the contrast between the ink trace and background while preserving fine details. The resulting digital images were stored in an uncompressed TIFF file at 24-bit color depth to maintain maximum fidelity to the original charts. Each image file was named according to a standardized convention incorporating station identifier and chart date range information to ensure traceability.
3.1.2. Automated Trace Extraction
Image processing techniques were used to detect and then extract the rainfall intensity trace from the scanned charts. The methodology used an algorithm adapted from the Pluviograph Strip Charts Reader (PSCR) described by Pizarro-Tapia et al. [3]. The following steps describe this multi-stage process:
- Image preprocessing: Noise reduction, contrast enhancement, and binarization to isolate the ink trace from background elements and grid lines.
- Coordinate system calibration: Identification of reference time marks (horizontal axis) and precipitation quantity trace marks (vertical axis) to establish precise scaling factors in both dimensions.
- Trace identification and extraction: Implementation of edge detection and line-tracing algorithms to identify and extract the continuous pen trajectory representing accumulated precipitation.
- Siphon event detection: Automated recognition of the characteristic vertical drops in the trace that represent siphoning events, necessary for calculating total accumulated precipitation.
- Conversion to time series: Transformation of the extracted geometric trace into a continuous time series of accumulated precipitation at 5 min intervals.
- Derivation of intensity values: Calculation of 5 min precipitation intensity values through temporal aggregation and differentiation of the accumulated series.
Table 2 presents statistics comparing precipitation measurements obtained through manual digitization versus automated extraction algorithms across the six list stations (two from each region). The metrics include the following: N = number of observations; R2 = coefficient of determination; RMSE = root mean square error (mm); and NSE = Nash–Sutcliffe efficiency.
Table 2.
Statistics comparing automated and manual rainfall digitization across 1 h, 6 h and 24 h durations.
The validation demonstrates consistent performance with R2 values exceeding 0.8 for all station–duration combinations and NSE values mostly above 0.8, indicating excellent agreement between automated and manual methods. As expected, validation performance improves with increasing temporal aggregation due to reduced influence of errors. The automated extraction algorithm achieved temporal positioning accuracy within ±5 min [3]. More significantly, the automated method eliminates subjective interpretation and human error inherent in manual digitization, potentially providing more consistent and objective measurements than traditional manual approaches. These results demonstrates that the automated digitization methodology produces reliable or potentially superior rainfall time series to manual methods while enabling the processing of substantially larger datasets with consistent quality standards.
3.1.3. Quality Control and Manual Verification
Following automated extraction, a comprehensive quality control protocol was implemented to ensure data integrity. This multi-stage process included the following:
- Automated consistency checks: Application of logical tests to identify physically implausible values, discontinuities, and other anomalies requiring further examination.
- Visual verification: Manual inspection of extracted traces superimposed on the original chart images for a subset of charts, with emphasis on high-intensity events and problematic sections identified during automated checks.
- Comparison with daily records: Validation of 24-hour accumulated totals against independent daily precipitation measurements from co-located standard rain gauges where available.
- Cross-station comparison: Evaluation of spatial consistency through comparison of simultaneous records from proximate stations during significant precipitation events.
- Expert review: Final examination of questionable records by experienced hydrometeorological analysts, with manual corrections applied where necessary.
3.2. Temporal Aggregation and Dataset Compilation
For each station, continuous 5 min time series were constructed, with explicit handling of missing periods and partial records. Time stamps were standardized to represent the end of each 5 min accumulation period and stored in a consistent ISO 8601 format [31]. This end-of-interval convention was adopted because the pluviograph strip charts record cumulative precipitation, making it natural to associate each measurement with the completion of the accumulation period. All temporal references were maintained in local Chilean time (CLT, UTC-4) without adjustments for historical changes in daylight saving time to ensure consistency across the entire record.
These datasets were compiled into CSV files with accompanying metadata documentation describing station characteristics, record periods, and corresponding data filenames as shown in Table 1. Also, a netCDF file is included that integrates all station data into a multidimensional array structure with CF-compliant metadata and spatial coordinates. The CSV files maximize accessibility across diverse research applications, while the netCDF format facilitates integration with geospatial analysis tools and climate modeling workflows, both maintaining the essential information required for rigorous scientific analysis. The complete dataset repository includes a comprehensive README.md file with detailed metadata, usage examples in R and Python, data quality information, file format specifications, and analytical guidance to facilitate an efficient utilization of the dataset across various hydrological and climatological research applications.
4. Data Format
The data for each station is stored in a separate comma-separated values (CSV) file, with a consistent structure across the entire dataset. The CSV format was chosen for its simplicity and universal compatibility with statistical software, programming languages, and database systems. Each data file contains two columns:
- datetime: timestamp in ISO 8601 format (YYYY-MM-DD HH:MM:SS);
- rainfall: precipitation amount in millimeters (2 decimal places) accumulated over the preceding 5 min interval.
and an example segment of the data is shown in Listing 1.
| Listing 1. Sample of the 5 min rainfall data format from the dataset showing precipitation records from 25 March 1985. |
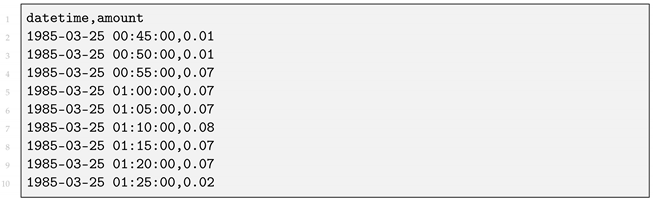 |
The first column represents the timestamp in ISO 8601 format (YYYY-MM-DD HH:MM:SS), with precipitation measurements recorded at 5 min intervals. All timestamps are provided in local Chilean time (CLT, UTC-4), with no adjustments for daylight saving time to maintain consistency throughout the historical record. This high temporal resolution is particularly valuable for capturing the dynamics of short-duration, high-intensity rainfall events that are critical for flash flood analysis and urban drainage design [32,33].
The second column contains the precipitation amount in millimeters (mm) accumulated during the preceding 5 min interval. For example, the value of 0.07 mm recorded at 1985-03-25 01:00:00 represents the rainfall that occurred between 00:55:00 and 01:00:00 on 25 March 1985. The precision of these measurements is 0.01 mm, which is consistent with the sensitivity of the original recording pluviographs [2].
For periods with no precipitation, no data is included in the file. This continuous time series structure facilitates statistical analysis and modeling without the need for additional data preprocessing. Rainfall in central Chile is largely limited to winter months, so not including dry data records reduces the storage overhead.
The complete dataset includes the full period of records for each station, during the period as noted in Table 1. Each file begins with a header line that labels the columns as datetime,amount, as shown in Listing 1.
This CSV format allows researchers to directly import the data into analysis software such as R, Python, MATLAB, or specialized hydrological modeling packages without extensive reformatting, supporting efficient data manipulation and the analysis of temporal rainfall patterns at multiple scales [34].
5. User Notes
The high-temporal resolution pluviograph dataset for central Chile is provided to support hydrological research, climate analysis, and water resource management applications. The following sections outline important information for users regarding data format, recommended applications, assumptions, analytical methods, and limitations.
5.1. Recommended Applications
The high-temporal resolution pluviograph dataset facilitates multiple hydrological and climatological applications that benefit from fine-scale precipitation data. The 5 min resolution enables accurate intensity–duration–frequency (IDF) curve development through the precise quantification of rainfall intensities across multiple durations [7,35]. These IDF relationships provide essential design parameters for hydraulic infrastructure including urban drainage systems, culverts, and flood control structures [4].
The dataset’s temporal resolution effectively captures short-duration, high-intensity precipitation events that trigger flash floods in central Chile’s steep watersheds [8]. This temporal detail permits improved modeling of rapid hydrological responses in small catchments with short concentration times, enhancing flood risk assessment capabilities.
Detailed rainfall pattern characterization represents another significant application. The dataset enables the comprehensive statistical analysis of precipitation temporal distributions, including the quantification of storm onset characteristics, peak intensity timing, and recession properties [34]. These analyses reveal fundamental precipitation behavior in central Chile’s Mediterranean climate system.
Climate change studies benefit from this historical record of sub-daily precipitation extremes. The dataset provides a robust baseline for evaluating potential alterations in rainfall intensity distributions by facilitating comparisons with current observations and climate model projections [36,37], thereby supporting adaptation planning.
Erosivity calculations for soil conservation applications are significantly enhanced by high-resolution rainfall data. The dataset enables the accurate computation of rainfall erosivity factors (EI30) through the precise quantification of storm energy and maximum 30 min intensities [38,39], which are critical parameters for erosion risk assessment.
Urban hydrological modeling constitutes a final key application. The fine temporal resolution supports detailed simulation of rainfall-runoff processes in urbanized environments characterized by short response times and substantial impervious surface coverage [32,33], improving urban flood forecasting capabilities.
A fundamental advantage of this dataset is that it provides real, observed precipitation data suitable for correlation analysis with other factors that may influence the hydrological cycle in both urban and rural basins. Unlike synthetic or modeled rainfall data, these high-resolution observations enable researchers to investigate authentic relationships between precipitation patterns and various environmental, geographical, and anthropogenic variables. Such correlations are essential for understanding the complex dynamics of watersheds under changing land-use conditions, climate variability, and human interventions. The dataset therefore serves as a valuable foundation for integrated studies examining how multiple factors interact to shape hydrological processes in central Chile’s diverse landscapes.
5.2. Machine Learning Applications
The combination of high temporal resolution and extensive historical coverage in this dataset provides the depth and volume of data necessary for training sophisticated algorithms and validating their performance across varied climatological conditions.
Precipitation nowcasting—the short-term prediction of rainfall—stands as perhaps the most immediate and high-impact application for this dataset. The 5 min resolution captures the rapid evolution of rainfall systems, providing the granular temporal data needed to train advanced deep learning architectures. Recurrent neural networks and Long Short-Term Memory (LSTM) models can leverage this sequential data to identify complex temporal patterns and dependencies. The pioneering convolutional LSTM network developed by Shi et al. [40] demonstrated the power of combining spatial and temporal learning for precipitation nowcasting, and this dataset offers an opportunity to adapt such approaches to Mediterranean climate regimes. More recently, Ravuri et al. [41] introduced deep generative models for radar-based nowcasting that achieved unprecedented skill in rainfall prediction; this Chile dataset could enable similar innovations focused on gauge-based prediction models with direct applications for flood warning systems and water resource management.
Pattern recognition through unsupervised learning represents another valuable application domain. The dataset’s extended temporal coverage captures thousands of rainfall events with diverse characteristics, providing rich material for clustering algorithms to identify recurring patterns and classify storm types based on their temporal signatures. The clustering methods explored by Crochemore et al. [42] for grouping rainfall time series based on intensity–duration–frequency metrics could be refined using this high-resolution dataset. Kramer et al. [43] highlighted the importance of identifying consistent patterns in climate data for understanding modern climate challenges, and machine learning techniques applied to this dataset could reveal characteristic precipitation patterns specific to central Chile’s Mediterranean climate system.
Automated quality control systems can be substantially enhanced through machine learning approaches applied to this dataset. The development of anomaly detection algorithms trained on the consistent 5 min measurements could significantly improve the identification of potential errors in rainfall time series, streamlining data validation processes. The systematic quality control framework established by Estévez and Marcos [44] using satellite information and geographic information systems could be augmented with machine learning components trained on this high-quality dataset. Similarly, Chen and Liu [45]’s work on rain gauge network design using combined kriging and entropy could be extended to develop intelligent systems for identifying inconsistencies and errors in precipitation data networks.
Gap filling in rainfall records represents a persistent challenge in hydroclimatology, and this dataset provides an excellent testbed for evaluating machine learning approaches to reconstructing missing data. The spatial and temporal characteristics of rainfall in central Chile described by Boisier et al. [13] could inform the development of targeted gap-filling algorithms. The methodologies employed in creating the SPREAD high-resolution daily gridded precipitation dataset for Spain [46] could be adapted and refined for sub-daily timescales using machine learning techniques trained on this 5 min resolution dataset, potentially leading to more robust approaches for handling missing data in operational hydrological forecasting.
Rainfall-runoff modeling stands to benefit significantly from deep learning applications trained on this dataset. The complex, non-linear relationship between rainfall inputs and streamflow outputs in central Chilean watersheds could be captured more effectively through deep neural networks that leverage the detailed precipitation dynamics revealed in the 5 min data. Zhang et al. [47] and Kratzert et al. [48] demonstrated the potential of LSTM-based recurrent neural networks for rainfall-runoff modeling, while Kratzert et al. [49] showed how such approaches could improve predictions in ungauged basins. This high-resolution dataset provides an unprecedented opportunity to train similar models specifically calibrated to the Mediterranean climate conditions of central Chile, potentially revolutionizing flood forecasting and water resource management in the region.
Transfer learning applications represent perhaps the most far-reaching potential of this dataset for addressing broader hydrological challenges. Models trained on the data-rich environments represented by these 14 stations could potentially be applied to data-scarce regions with similar climatic characteristics throughout Latin America and other Mediterranean climate zones globally. The computational challenges of processing such high-resolution rainfall data across larger spatial domains could be addressed using tools specifically designed for large heterogeneous datasets. For instance, a sequential Gaussian processes approach has been used previously, providing an efficient implementation for interpolating large datasets with heterogeneous noise characteristics—a common challenge when combining this high-resolution pluviograph data with other precipitation measurements from different sources or instruments [50]. Reichstein et al. [51] outlined the transformative potential of deep learning and process understanding for Earth system science, while George et al. [52] demonstrated how transfer learning could effectively model climate change impacts across different regions.
5.3. Assumptions and Considerations
This dataset incorporates several methodological assumptions and limitations that warrant consideration during application and analysis.
Temporal consistency requires critical assessment despite rigorous quality control protocols. The digitization process from analog pluviograph strip charts inherently introduced interpretive elements, particularly where trace ambiguities exist. As Jaklič et al. [9] demonstrated, overlapping or degraded pen traces during high-intensity events present particular challenges. Researchers should evaluate quality flags and incorporate appropriate uncertainty quantification when examining extreme rainfall intensities.
Instrument-specific constraints affect the recording of high-intensity precipitation. The float-type pluviographs employed exhibit documented response limitations during intense rainfall episodes, with mechanical lag potentially introducing a systematic underestimation of peak intensities by 5–15% [53,54]. This becomes particularly relevant for sub-hourly extreme intensity analyses.
Time synchronization uncertainties arise from manual chart replacement procedures and gradual clock drift in the mechanical recording instruments. While individually minor, these temporal inconsistencies may significantly impact comparative analyses across multiple stations [30], particularly when examining simultaneous precipitation events. Unfortunately, the comprehensive documentation of specific timing errors or calibration inconsistencies was not systematically recorded during the original data collection period, making it impossible to quantify or correct these uncertainties retrospectively. Users should be aware that potential time shifts may exist as an inherent limitation of analog pluviograph datasets.
Finally, while the observation period for the given stations captures substantial natural variability including multiple ENSO cycles, potential non-stationarity associated with climate change may limit the applicability of historical statistics to future scenarios [55,56]. Statistical inferences should incorporate non-stationarity tests when applied to current or projected conditions.
5.4. Analytical Method Development
One of the most promising applications is the comparative assessment of intensity–duration–frequency (IDF) methodologies. The 5 min resolution data allows researchers to test and compare different statistical approaches for deriving IDF relationships, including the annual maximum series, partial duration series, and various probability distribution functions. Koutsoyiannis [57] has questioned the widespread use of the Gumbel distribution for modeling extreme rainfall, and this dataset provides an excellent opportunity to evaluate alternative distribution models in the Mediterranean climate context of central Chile. Similarly, the work of Overeem et al. [58] on quantifying uncertainties in IDF curves can be extended using this dataset to improve risk assessment for hydraulic infrastructure design.
The dataset also enables significant advances in temporal disaggregation modeling. In many regions of Chile and South America, only daily rainfall records are available, limiting the application of models requiring sub-daily inputs. Researchers can use this high-resolution dataset to develop and validate models for disaggregating daily rainfall into sub-daily increments. The approaches explored by Debele et al. [59] for evaluating weather data disaggregation methods could be applied and refined using this dataset as ground truth. Similarly, the cascade-based stochastic models proposed by Hingray and Haha [60] could be calibrated and validated for Mediterranean climate conditions using these records.
Spatial interpolation techniques for sub-daily rainfall can be substantially improved using this dataset. The network of 14 stations distributed across central Chile provides a robust foundation for evaluating various interpolation methods, including geostatistical approaches like kriging, simpler methods such as inverse distance weighting, and emerging machine learning techniques. When dealing with spatial interpolation across the complex topography of central Chile, computational efficiency becomes a significant concern. Fast mapping algorithms with space- or time-limited covariance functions could be particularly valuable for generating high-resolution precipitation maps from this dataset while maintaining reasonable computation times, especially when incorporating topographic covariates [61]. The comparative framework established by Wagner et al. [62] for evaluating precipitation products could be adapted to test the performance of different interpolation methods for generating spatially continuous fields of sub-daily rainfall.
The three-decade span of the dataset creates unique opportunities for trend analysis method development. Researchers can investigate and refine techniques for detecting trends in extreme rainfall events across multiple durations, while properly accounting for natural variability and statistical significance. The approaches developed by Guerreiro et al. [63] for detecting changes in precipitation extremes and by Barbero et al. [64] specifically for Chilean mountain basins can be extended and refined using the finer temporal resolution of this dataset, potentially revealing trends not detectable in daily records.
Storm pattern classification methodologies can be substantially advanced using this dataset. The 5 min resolution captures the detailed temporal evolution of rainfall events, enabling the development of objective classification methods based on temporal structure, intensity profiles, and synoptic origins. The smoothing parameter optimization approaches proposed by Molina-Sanchis et al. [65] could be applied to identify characteristic patterns in rainfall events, while the storm type classification framework of Gaál et al. [66] could be extended to Mediterranean climate systems using this dataset.
Finally, the dataset enables cutting-edge research in the multifractal analysis of precipitation [67,68]. The scale-invariant properties of rainfall can be explored across temporal scales ranging from minutes to days, providing insights into the underlying physical processes driving precipitation patterns in central Chile. The methodologies developed by Veneziano et al. [69] linking multifractality to IDF scaling and by Gires et al. [70] examining small-scale rainfall variability could be applied to characterize the scale-dependent behavior of rainfall in this region, potentially improving precipitation modeling and forecasting capabilities.
5.5. Limitations
Despite its considerable value for hydrological research and applications, the pluviograph dataset includes several important limitations that researchers should carefully consider when using in their analysis.
The spatial coverage of the dataset represents a significant constraint for certain applications. While the 14 stations provide an adequate representation of populated areas and agricultural zones in central Chile, mountainous regions and remote areas remain underrepresented [3]. This spatial distribution bias limits the dataset’s utility for comprehensive regional analysis, particularly in the Andean highlands where orographic effects strongly influence precipitation patterns. Researchers should exercise caution when extrapolating findings to these underrepresented zones, as the complex topography of central Chile creates substantial spatial variability in rainfall characteristics that may not be fully captured by the existing station network.
The temporal extent of the dataset introduces another important limitation. With records ending in 2009, the dataset precedes several significant recent climate events and potential shifts in rainfall patterns associated with anthropogenic climate change [13]. The megadrought affecting central Chile since 2010 represents a major hydroclimatic phenomenon not captured in this dataset. Consequently, the statistical properties and extreme event characteristics derived from this historical period may not adequately represent current or future rainfall regimes. Researchers using this dataset for long-term planning or infrastructure design should consider supplementing it with more recent observations where/when available and account for potential non-stationarity in precipitation patterns.
The measurement of solid precipitation represents a particular challenge with the original pluviograph instruments used to collect this data. These mechanical recording gauges were not designed to accurately measure snow, hail, or mixed precipitation [2,71]. This limitation may cause a systematic underestimation of precipitation totals during cold events, particularly at the higher elevation stations in the dataset. The most affected stations would be those located above 600 m in elevation during winter months, when solid precipitation is more common. Researchers should consider this potential bias when analyzing winter precipitation patterns or conducting water balance studies in watersheds with significant high-elevation contributions.
Finally, the dataset lacks explicit accounting for or the correction of urban heat island effects that may influence precipitation characteristics at stations located in or near urban areas [72]. Urban environments can modify local precipitation through thermal effects, increased aerosols, and altered surface roughness, potentially affecting both the timing and intensity of rainfall events. Without complementary temperature, humidity, or land-use change data, it becomes difficult to isolate or correct for these urban influences. This limitation is particularly relevant for stations located in rapidly urbanizing areas of central Chile and also the capital Santiago, where anthropogenic modifications to the local environment may have evolved significantly over the three-decade observation period.
Author Contributions
Conceptualization, R.P. (Roberto Pizarro) and C.S.; methodology, R.P. (Roberto Pizarro) and P.G.-C.; software, B.I., C.V.-S. and R.P. (Rodrigo Paredes); validation, A.I., C.S., J.P., C.T., R.M. and P.G.-C.; formal analysis, R.P. (Roberto Pizarro), P.G.-C., C.S. and B.I.; investigation, C.S., A.I., R.P. (Roberto Pizarro), C.V.-S., P.G.-C., R.M., C.T., J.P., R.P. (Rodrigo Paredes) and B.I.; resources, R.P. (Roberto Pizarro) and P.G.-C.; data curation, C.V.-S., B.I. and R.P. (Rodrigo Paredes); writing—original draft preparation, C.S., A.I., R.P. (Roberto Pizarro), C.V.-S., P.G.-C., R.M., C.T., J.P., R.P. (Rodrigo Paredes) and B.I.; writing—review and editing, B.I., P.G.-C., A.I. and C.S.; visualization, C.S., A.I. and B.I.; supervision, R.P. (Roberto Pizarro); project administration, R.P. (Roberto Pizarro) and C.S.; funding acquisition, R.P. (Roberto Pizarro). All authors have read and agreed to the published version of the manuscript.
Funding
The authors gratefully acknowledge the support provided by the ANID BASAL Center FB210015 (CENAMAD) and by ANID FONDECYT Regular grant 1251441.
Institutional Review Board Statement
Not applicable.
Informed Consent Statement
Not applicable.
Data Availability Statement
Data available at https://doi.org/10.6084/m9.figshare.29345474 (accessed on 28 May 2025).
Conflicts of Interest
The authors declare no conflicts of interest.
References
- Brunet, M.; Jones, P. Data Rescue Initiatives: Bringing Historical Climate Data into the 21st Century. Clim. Res. 2011, 47, 29–40. [Google Scholar] [CrossRef]
- World Meteorological Organization. Guide to Instruments and Methods of Observation: Volume I—Measurement of Meteorological Variables; Number WMO No 8 in Technical Reports; WMO: Geneva, Switzerland, 2018. [Google Scholar]
- Pizarro-Tapia, R.; González-Leiva, F.; Valdés-Pineda, R.; Ingram, B.; Sangüesa, C.; Vallejos, C. A Rainfall Intensity Data Rescue Initiative for Central Chile Utilizing a Pluviograph Strip Charts Reader (PSCR). Water 2020, 12, 1887. [Google Scholar] [CrossRef]
- Sangüesa, C.; Pizarro, R.; Ingram, B.; Balocchi, F.; García-Chevesich, P.; Pino, J.; Ibáñez, A.; Vallejos, C.; Mendoza, R.; Bernal, A.; et al. Streamflow Trends in Central Chile. Hydrology 2023, 10, 144. [Google Scholar] [CrossRef]
- Dirección General de Aguas. Manual Básico Para Instrucción de Hidromensores; Technical report, DGA; Departamento de Hidrología, Ministerio de Obras Públicas de Chile (MOP): Santiago, Chile, 1991. [Google Scholar]
- Lanciotti, S.; Ridolfi, E.; Russo, F.; Napolitano, F. Intensity–duration–frequency curves in a data-rich era: A review. Water 2022, 14, 3705. [Google Scholar] [CrossRef]
- Pizarro, R.; Ingram, B.; Gonzalez-Leiva, F.; Valdés-Pineda, R.; Sangüesa, C.; Delgado, N.; García-Chevesich, P.; Valdés, J.B. WEBSEIDF: A Web-Based System for the Estimation of IDF Curves in Central Chile. Hydrology 2018, 5, 40. [Google Scholar] [CrossRef]
- Dirks, K.; Hay, J.; Stow, C.; Harris, D. High-resolution studies of rainfall on Norfolk Island: Part II: Interpolation of rainfall data. J. Hydrol. 1998, 208, 187–193. [Google Scholar] [CrossRef]
- Jaklič, A.; Šajn, L.; Derganc, G.; Peer, P. Automatic Digitization of Pluviograph Strip Charts. Meteorol. Appl. 2016, 23, 57–64. [Google Scholar] [CrossRef]
- Sušin, N.; Peer, P. Open-Source Tool for Interactive Digitisation of Pluviograph Strip Charts. Weather 2018, 73, 222–226. [Google Scholar] [CrossRef]
- Brönnimann, S.; Brugnara, Y.; Allan, R.J.; Brunet, M.; Compo, G.P.; Crouthamel, R.I.; Jones, P.D.; Jourdain, S.; Luterbacher, J.; Siegmund, P.; et al. A Roadmap to Climate Data Rescue Services. Geosci. Data J. 2018, 5, 28–39. [Google Scholar] [CrossRef]
- Rahimifard, S.; Trollman, H. UN Sustainable Development Goals: An engineering perspective. Int. J. Sustain. Eng. 2018, 11, 1–3. [Google Scholar] [CrossRef]
- Boisier, J.P.; Rondanelli, R.; Garreaud, R.D.; Muñoz, F. Anthropogenic and natural contributions to the Southeast Pacific precipitation decline and recent megadrought in central Chile. Geophys. Res. Lett. 2016, 43, 413–421. [Google Scholar] [CrossRef]
- Hák, T.; Janoušková, S.; Moldan, B. Sustainable Development Goals: A need for relevant indicators. Ecol. Indic. 2016, 60, 565–573. [Google Scholar] [CrossRef]
- Shortridge, J. Observed trends in daily rainfall variability result in more severe climate change impacts to agriculture. Clim. Change 2019, 157, 429–444. [Google Scholar] [CrossRef]
- Kerry, R.; Ingram, B.; Garcia-Cela, E.; Magan, N.; Ortiz, B.V.; Scully, B. Determining future aflatoxin contamination risk scenarios for corn in Southern Georgia, USA using spatio-temporal modelling and future climate simulations. Sci. Rep. 2021, 11, 13522. [Google Scholar] [CrossRef]
- Deidda, R.; Mascaro, G.; Piga, E.; Querzoli, G. An Automatic System for Rainfall Signal Recognition from Tipping Bucket Gage Strip Charts. J. Hydrol. 2007, 333, 400–412. [Google Scholar] [CrossRef]
- Van Piggelen, H.E.; Brandsma, T.; Manders, H.; Lichtenauer, J.F. Automatic Curve Extraction for Digitizing Rainfall Strip Charts. J. Atmos. Ocean. Technol. 2011, 28, 891–906. [Google Scholar] [CrossRef]
- Haralick, R.M.; Shapiro, L.G. Image Segmentation Techniques. Comput. Vision Graph. Image Process. 1985, 29, 100–132. [Google Scholar] [CrossRef]
- Roy, P.; Goswami, S.; Chakraborty, S.; Azar, A.T.; Dey, N. Image Segmentation Using Rough Set Theory: A Review. Int. J. Rough Sets Data Anal. 2014, 1, 62–74. [Google Scholar] [CrossRef]
- Marchewka, A.; Pasela, R. Extraction of Data from Limnigraf Chart Images. In Image Processing and Communications Challenges 5. Advances in Intelligent Systems and Computing; Choraś, R.S., Ed.; Springer: Berlin/Heidelberg, Germany, 2014; Volume 233, pp. 263–269. [Google Scholar] [CrossRef]
- Gonzalez, R.C.; Woods, R.E. Digital Image Processing, 3rd ed.; Prentice-Hall, Inc.: Upper Saddle River, NJ, USA, 2008. [Google Scholar]
- Sonka, M.; Hlavac, V.; Boyle, R. Image Pre-Processing. In Image Processing, Analysis and Machine Vision; Springer: Boston, MA, USA, 1993; pp. 56–111. [Google Scholar] [CrossRef]
- Krig, S. Computer Vision Metrics: Survey, Taxonomy, and Analysis; Apress Media LLC: New York, NY, USA, 2014. [Google Scholar]
- Pizarro, R.; Valdés, R.; García-Chevesich, P.; Vallejos, C.; Sangüesa, C.; Morales, C.; Balocchi, F.; Abarza, A.; Fuentes, R. Latitudinal Analysis of Rainfall Intensity and Mean Annual Precipitation in Chile. Chil. J. Agric. Res. 2007, 72, 252–261. [Google Scholar] [CrossRef]
- Pizarro, R.; Garcia-Chevesich, P.; Valdes, R.; Dominguez, F.; Hossain, F.; Ffolliott, P.; Olivares, C.; Morales, C.; Balocchi, F.; Bro, P. Inland Water Bodies in Chile Can Locally Increase Rainfall Intensity. J. Hydrol. 2013, 481, 56–63. [Google Scholar] [CrossRef]
- Pizarro, R.; Valdés, R.; Abarza, A.; Garcia-Chevesich, P. A Simplified Storm Index Method to Extrapolate Intensity-Duration-Frequency (IDF) Curves for Ungauged Stations in Central Chile. Hydrol. Process. 2015, 29, 641–652. [Google Scholar] [CrossRef]
- Munang, R.; Nkem, J.N.; Han, Z. Using Data Digitalization to Inform Climate Change Adaptation Policy: Informing the Future Using the Present. Weather Clim. Extrem. 2013, 1, 17–18. [Google Scholar] [CrossRef]
- Ashcroft, L.; Allan, R.; Bridgman, H.; Gergis, J.; Pudmenzky, C.; Thornton, K. Current Climate Data Rescue Activities in Australia. Adv. Atmos. Sci. 2016, 33, 1323–1324. [Google Scholar] [CrossRef]
- Wilkinson, C.; Brönnimann, S.; Jourdain, S.; Roucaute, E.; Crouthamel, R.; IEDRO Team; Brohan, P.; Valente, A.; Brugnara, Y.; Brunet, M.; et al. Best Practice Guidelines for Climate Data Rescue v1, of the Copernicus Climate Change Service Data Rescue Service. Technical Report C3S_DC3S311a_Lot1.3.4.1_2019_v1-contract: 2019/C3S_311a_Lot1_Met Office/SC2, Copernicus Climate Change Service. 2019; Available online: http://www.c3.urv.cat/docs/publicacions/2019/Deliverable_BestPracticeGuidelines_Part1.pdf (accessed on 28 May 2025).
- ISO 8601; ISO. Available online: https://www.iso.org/iso-8601-date-and-time-format.html (accessed on 28 May 2025).
- Fletcher, T.D.; Andrieu, H.; Hamel, P. Understanding, management and modelling of urban hydrology and its consequences for receiving waters: A state of the art. Adv. Water Resour. 2013, 51, 261–279. [Google Scholar] [CrossRef]
- Ochoa-Rodriguez, S.; Wang, L.P.; Gires, A.; Pina, R.D.; Reinoso-Rondinel, R.; Bruni, G.; Ichiba, A.; Gaitan, S.; Cristiano, E.; van Assel, J.; et al. Impact of spatial and temporal resolution of rainfall inputs on urban hydrodynamic modelling outputs: A multi-catchment investigation. J. Hydrol. 2015, 531, 389–407. [Google Scholar] [CrossRef]
- Dunkerley, D. Identifying individual rain events from pluviograph records: A review with analysis of data from an Australian dryland site. Hydrol. Process. Int. J. 2008, 22, 5024–5036. [Google Scholar] [CrossRef]
- Nhat, L.M.; Tachikawa, Y.; Sayama, T.; Takara, K. A Simple Scaling Charateristics of Rainfall in Time and Space to Derive Intensity Duration Frequency Relationships. Annu. J. Hydraul. Eng. JSCE 2007, 51, 73–78. [Google Scholar] [CrossRef]
- Westra, S.; Fowler, H.J.; Evans, J.P.; Alexander, L.V.; Berg, P.; Johnson, F.; Kendon, E.J.; Lenderink, G.; Roberts, N. Future changes to the intensity and frequency of short-duration extreme rainfall. Rev. Geophys. 2014, 52, 522–555. [Google Scholar] [CrossRef]
- Sun, Q.; Zhang, X.; Zwiers, F.; Westra, S.; Alexander, L.V. A global, continental, and regional analysis of changes in extreme precipitation. J. Clim. 2021, 34, 243–258. [Google Scholar] [CrossRef]
- Bonilla, C.A.; Johnson, O.I. Soil erodibility mapping and its correlation with soil properties in Central Chile. Geoderma 2012, 189, 116–123. [Google Scholar] [CrossRef]
- Angulo-Martínez, M.; López-Vicente, M.; Vicente-Serrano, S.M.; Beguería, S. Mapping rainfall erosivity at a regional scale: A comparison of interpolation methods in the Ebro Basin (NE Spain). Hydrol. Earth Syst. Sci. 2009, 13, 1907–1920. [Google Scholar] [CrossRef]
- Shi, X.; Chen, Z.; Wang, H.; Yeung, D.Y.; Wong, W.K.; Woo, W.c. Convolutional LSTM network: A machine learning approach for precipitation nowcasting. Adv. Neural Inf. Process. Syst. 2015, 28, 802–810. [Google Scholar]
- Ravuri, S.; Lenc, K.; Willson, M.; Kangin, D.; Lam, R.; Mirowski, P.; Fitzsimons, M.; Athanassiadou, M.; Kashem, S.; Madge, S.; et al. Skilful precipitation nowcasting using deep generative models of radar. Nature 2021, 597, 672–677. [Google Scholar] [CrossRef]
- Crochemore, L.; Ramos, M.H.; Pappenberger, F. Bias correcting precipitation forecasts to improve the skill of seasonal streamflow forecasts. Hydrol. Earth Syst. Sci. 2016, 20, 3601–3618. [Google Scholar] [CrossRef]
- Kramer, R.J.; Soden, B.J.; Pendergrass, A.G. Evaluating Climate Model Simulations of the Radiative Forcing and Radiative Response at Earth’s Surface. J. Clim. 2019, 32, 4089–4102. [Google Scholar] [CrossRef]
- Estévez, E.; Marcos, M. Model-based validation of industrial control systems. IEEE Trans. Ind. Inform. 2011, 8, 302–310. [Google Scholar] [CrossRef]
- Chen, B.; Liu, C. Warm organized rain systems over the tropical eastern Pacific. J. Clim. 2016, 29, 3403–3422. [Google Scholar] [CrossRef]
- Serrano-Notivoli, R.; Beguería, S.; Saz, M.Á.; Longares, L.A.; de Luis, M. SPREAD: A high-resolution daily gridded precipitation dataset for Spain–an extreme events frequency and intensity overview. Earth Syst. Sci. Data 2017, 9, 721–738. [Google Scholar] [CrossRef]
- Zhang, C.J.; Zeng, J.; Wang, H.Y.; Ma, L.M.; Chu, H. Correction model for rainfall forecasts using the LSTM with multiple meteorological factors. Meteorol. Appl. 2020, 27, e1852. [Google Scholar] [CrossRef]
- Kratzert, F.; Klotz, D.; Brenner, C.; Schulz, K.; Herrnegger, M. Rainfall–runoff modelling using long short-term memory (LSTM) networks. Hydrol. Earth Syst. Sci. 2018, 22, 6005–6022. [Google Scholar] [CrossRef]
- Kratzert, F.; Klotz, D.; Herrnegger, M.; Sampson, A.K.; Hochreiter, S.; Nearing, G.S. Toward improved predictions in ungauged basins: Exploiting the power of machine learning. Water Resour. Res. 2019, 55, 11344–11354. [Google Scholar] [CrossRef]
- Lanza, L.G.; Cauteruccio, A. Accuracy assessment and intercomparison of precipitation measurement instruments. In Precipitation Science; Elsevier: Amsterdam, The Netherlands, 2022; pp. 3–35. [Google Scholar]
- Reichstein, M.; Camps-Valls, G.; Stevens, B.; Jung, M.; Denzler, J.; Carvalhais, N.; Prabhat, F. Deep learning and process understanding for data-driven Earth system science. Nature 2019, 566, 195–204. [Google Scholar] [CrossRef]
- George, D.; Shen, H.; Huerta, E. Classification and unsupervised clustering of LIGO data with Deep Transfer Learning. Phys. Rev. D 2018, 97, 101501. [Google Scholar] [CrossRef]
- Joe, P.; Baklanov, A.; Grimmond, S.; Bouchet, V.; Molina, L.T.; Schluenzen, K.H.; Mills, G.; Tan, J.; Golding, B.; Masson, V.; et al. Guidance on integrated urban hydro-meteorological, climate and environmental services: Challenges and the way forward. In Urban Climate Science for Planning Healthy Cities; Springer: Berlin/Heidelberg, Germany, 2021; pp. 311–338. [Google Scholar] [CrossRef]
- Lanza, L.G.; Vuerich, E. The WMO field intercomparison of rain intensity gauges. Atmos. Res. 2009, 94, 534–543. [Google Scholar] [CrossRef]
- Garreaud, R.D.; Vuille, M.; Compagnucci, R.; Marengo, J. Present-day south american climate. Palaeogeogr. Palaeoclimatol. Palaeoecol. 2009, 281, 180–195. [Google Scholar] [CrossRef]
- Vicuña, S.; Garreaud, R.D.; McPhee, J. Climate change impacts on the hydrology of a snowmelt driven basin in semiarid Chile. Clim. Change 2011, 105, 469–488. [Google Scholar] [CrossRef]
- Koutsoyiannis, D. On the appropriateness of the Gumbel distribution for modelling extreme rainfall. In Hydrological Risk: Recent Advances in Peak River Flow Modelling, Prediction and Real-Time Forecasting. Assessment of the Impacts of Land-Use and Climate Changes; Editoriale Bios: Castrolibero, Italy, 2003; pp. 24–25. [Google Scholar]
- Overeem, A.; Buishand, A.; Holleman, I. Rainfall depth-duration-frequency curves and their uncertainties. J. Hydrol. 2008, 348, 124–134. [Google Scholar] [CrossRef]
- Debele, B.; Srinivasan, R.; Parlange, J.Y. Accuracy evaluation of weather data generation and disaggregation methods at finer timescales. Adv. Water Resour. 2007, 30, 1286–1300. [Google Scholar] [CrossRef]
- Hingray, B.; Haha, M.B. Statistical performances of various deterministic and stochastic models for rainfall series disaggregation. Atmos. Res. 2005, 77, 152–175. [Google Scholar] [CrossRef]
- Ingram, B.; Cornford, D.; Evans, D. Fast algorithms for automatic mapping with space-limited covariance functions. Stoch. Environ. Res. Risk Assess. 2008, 22, 661–670. [Google Scholar] [CrossRef]
- Wagner, P.D.; Fiener, P.; Wilken, F.; Kumar, S.; Schneider, K. Comparison and evaluation of spatial interpolation schemes for daily rainfall in data scarce regions. J. Hydrol. 2012, 464, 388–400. [Google Scholar] [CrossRef]
- Guerreiro, S.B.; Fowler, H.J.; Barbero, R.; Westra, S.; Lenderink, G.; Blenkinsop, S.; Lewis, E.; Li, X.F. Detection of continental-scale intensification of hourly rainfall extremes. Nat. Clim. Change 2018, 8, 803–807. [Google Scholar] [CrossRef]
- Barbero, R.; Fowler, H.; Lenderink, G.; Blenkinsop, S. Is the intensification of precipitation extremes with global warming better detected at hourly than daily resolutions? Geophys. Res. Lett. 2017, 44, 974–983. [Google Scholar] [CrossRef]
- Molina-Sanchis, I.; Lázaro, R.; Arnau-Rosalén, E.; Calvo-Cases, A. Rainfall timing and runoff: The influence of the criterion for rain event separation. J. Hydrol. Hydromechanics 2016, 64, 226. [Google Scholar] [CrossRef]
- Gaál, L.; Molnar, P.; Szolgay, J. Selection of intense rainfall events based on intensity thresholds and lightning data in Switzerland. Hydrol. Earth Syst. Sci. 2014, 18, 1561–1573. [Google Scholar] [CrossRef]
- García-Marín, A.P.; Jiménez-Hornero, F.; Ayuso-Muñoz, J. Multifractal analysis as a tool for validating a rainfall model. Hydrol. Process. Int. J. 2008, 22, 2672–2688. [Google Scholar] [CrossRef]
- He, F.; Mohamadzadeh, N.; Sadeghnejad, M.; Ingram, B.; Ostovari, Y. Fractal Features of Soil Particles as an Index of Land Degradation under Different Land-Use Patterns and Slope-Aspects. Land 2023, 12, 615. [Google Scholar] [CrossRef]
- Veneziano, D.; Langousis, A.; Furcolo, P. Multifractality and rainfall extremes: A review. Water Resour. Res. 2006, 42. [Google Scholar] [CrossRef]
- Gires, A.; Tchiguirinskaia, I.; Schertzer, D.; Schellart, A.; Berne, A.; Lovejoy, S. Influence of small scale rainfall variability on standard comparison tools between radar and rain gauge data. Atmos. Res. 2014, 138, 125–138. [Google Scholar] [CrossRef]
- Rasmussen, R.; Baker, B.; Kochendorfer, J.; Meyers, T.; Landolt, S.; Fischer, A.P.; Black, J.; Thériault, J.M.; Kucera, P.; Gochis, D.; et al. How well are we measuring snow: The NOAA/FAA/NCAR winter precipitation test bed. Bull. Am. Meteorol. Soc. 2012, 93, 811–829. [Google Scholar] [CrossRef]
- Shepherd, J.M.; Pierce, H.; Negri, A.J. Rainfall modification by major urban areas: Observations from spaceborne rain radar on the TRMM satellite. J. Appl. Meteorol. 2002, 41, 689–701. [Google Scholar] [CrossRef]
Disclaimer/Publisher’s Note: The statements, opinions and data contained in all publications are solely those of the individual author(s) and contributor(s) and not of MDPI and/or the editor(s). MDPI and/or the editor(s) disclaim responsibility for any injury to people or property resulting from any ideas, methods, instructions or products referred to in the content. |
© 2025 by the authors. Licensee MDPI, Basel, Switzerland. This article is an open access article distributed under the terms and conditions of the Creative Commons Attribution (CC BY) license (https://creativecommons.org/licenses/by/4.0/).