Abstract
Coherent spatial data are crucial for informed land use and regional planning decisions, particularly in the context of securing a crisis-proof food supply and adapting to climate change. This dataset provides spatial information on climate-robust and high-yield agricultural arable land in Brandenburg, Germany, based on the results of a classification using bio-economic climate simulations. The dataset is intended to support regional planning and policy makers in zoning decisions (e.g., photovoltaic power plants) by identifying climate-robust arable land with high current and stable future production potential that should be reserved for agricultural use. The classification method used to generate the dataset includes a wide range of indicators, including established approaches, such as a soil quality index, drought, water, and wind erosion risk, as well as a dynamic approach, using bio-economic simulations, which determine the production potential under future climate scenarios. The dataset is a valuable resource for spatial planning and climate change adaptation, contributing to long-term food security especially in dry areas such as the state of Brandenburg facing increased production risk under future climatic conditions, thereby serving globally as an example for land use planning challenges related to climate change.
Dataset: https://doi.org/10.4228/ZALF-29GF-SJ02.
Dataset License: CC-BY 4.0
1. Summary
Datasets with single indicators such as soil quality, annual precipitation, mean temperature, erosion risk, and other factors relevant for agricultural production are widely accessible. However, increasing uncertainty due to climate change, e.g., flooding and drought risks, and increasing land competition due to, e.g., peat land conservation [1] and policy measures related to renewable energy [2], increase the relevance of more complex spatial data on agricultural land (for more examples on innovative approaches of combining different datasets, see [3,4,5]). The motivation for combining different datasets comes from the specific need articulated by a regional public planning agency that is confronted with the need for sound decision criteria for determining areas that show a high production potential even under future climatic conditions. Commonly used criteria, such as the soil quality index, are considered not sufficiently reflective of future trends. Therefore, this dataset was computed by combining existing datasets on soil erosion risk and soil quality with the spatially explicit estimations of future crop yields under climate risk based on an established crop yield model. As described in Czettritz et al. [6], the procedure and its results underwent a validation process by relevant stakeholders from agriculture and regional administration. The need to integrate climate change adaptation into land use planning is reflected in several strategies and studies in various countries [7,8,9], showing the relevance of this dataset in this context.
The spatial data included in this dataset consider a multicriteria classification methodology determining arable land with a high production potential under current and future climatic conditions. A more detailed description of the methodology can be found in von Czettritz et al. (2024)’s “Classification of agricultural priority and reserved areas in Brandenburg under consideration of bio-economic climate simulations” [6] and the Methods section (Section 3).
The dataset provides spatial information on climate-robust and high-yield agricultural arable land in Brandenburg, Germany, derived from bio-economic climate simulations. The term robustness typically denotes a system’s capacity to endure both anticipated and unexpected shocks, along with various stresses [10]. Climate robustness, in particular, pertains to the shocks and stresses resulting from climate change. Arable land that exhibits low risks of drought, water erosion, and wind erosion is deemed to be climate robust.
The dataset is designed to support regional planning and policy decision-makers in zoning by identifying land with high current and stable future production potential for agricultural use. Additionally, it serves as a foundation for spatial planning, on-farm investment decisions, and the renewable energy sector. By facilitating differentiated decision-making under climate change, the dataset aims to reduce land use conflicts.
2. Data Description
The dataset consists of three shapefiles: climate-robust.shp, high-yield_dynamic.shp and high-yield_static_and_dynamic.shp. The file names are derived from the classification detailed in the aforementioned paper of von Czettritz et al. [6]. In the same paper, an elaborate description of the input data and a more elaborate description of the methodology can be found. An application of the dataset for suggesting priority areas for agricultural use is shown in Figure 1.
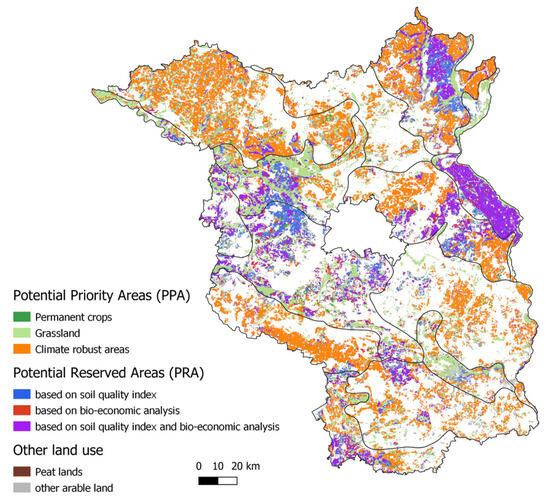
Figure 1.
Visualization of the application of the dataset, as presented in Czettritz et al. [6].
The shapefile climate-robust.shp includes spatial data covering arable land in Brandenburg that can be classified as climate-robust, based on the current drought, water, and wind erosion risk. In addition to the geometry data, the file consists of three columns. The column “landuse” shows the current land use of the area with AL for arable land. In the column “REGION”, all regions in the state of Brandenburg can be found, making it easier to filter when looking at a local context. Finally, the column “area_ha” contains the area of each polygon in hectare. The size of the shapefile is 36.8 KB (comprising climate-robust.dbf—4.7 KB, climate-robust.prj—1 KB, climate-robust.shp—31.9 KB, and climate-robust.shx—203 B).
The shapefile high-yield_dynamic.shp contains the results of a bio-economic simulation. The spatial data cover all arable land in Brandenburg, which, under future climate conditions (years), generates the highest economic gross margins (defined as revenue minus variable costs of each of the crops produced), even in the years with the lowest yields (see the Methods section below for more information). The file contains the same columns as the file climate-robust.shp. The size of the shapefile is 34.7 MB (comprising high-yield_dynamic.dbf—7.9 MB, high-yield_dynamic.prj—1 KB, high-yield_dynamic.shp—26.5 MB, and high-yield_dynamic.shx—343 KB).
The final dataset high-yield_static_and_dynamic.shp includes all areas that are classified in the high-yield_dynamic file and additionally have the highest soil quality index compared to the surrounding areas [11]. The column structure is identical with the two previous shapefiles, while an additional column (soil_quali) shows the soil_quality index [12], in German known as “Ackerzahl”. The size of the shapefile is 99.3 MB (comprising high-yield_static_and_dynamic.dbf—38.8 KB, high-yield_static_and_dynamic.prj—1 KB, high-yield_static_and_dynamic.shp—59.5 MB, and high-yield_static_and_dynamic.shx—1.5 MB).
All three shapefiles have the Coordinate Reference System (CRS) EPSG:25833—ETRS89/UTM zone 33N assigned. The total dataset size is 134.04 MB.
3. Methods
The dataset is produced by merging existing publicly available datasets on current land use, soil types, and wind/water erosion risk and combining it with the calculations by the authors presented in [6]. It contains arable land in the state of Brandenburg, Germany, based on the Digital Field Block Cadaster (DFBK) [13]. This dataset is the official base for all area-based payments of the European Union’s agricultural policy. Field boundaries are controlled by remote sensing to avoid any fraudulent activities. The dataset was initially generated in order to support the classification of agricultural priority and reserved areas [6], in the context of a project aiming to exclude agricultural land from other land uses (e.g., solar panels, settlements, etc.). Due to the carbon sequestration potential of peatlands [1], areas with a peatland thickness greater than zero have been excluded based on data by the Brandenburg State Office for Mining, Geology and Raw Materials [14], leaving more flexibility for peat land conservation measures.
3.1. Climate Robustness (Static)
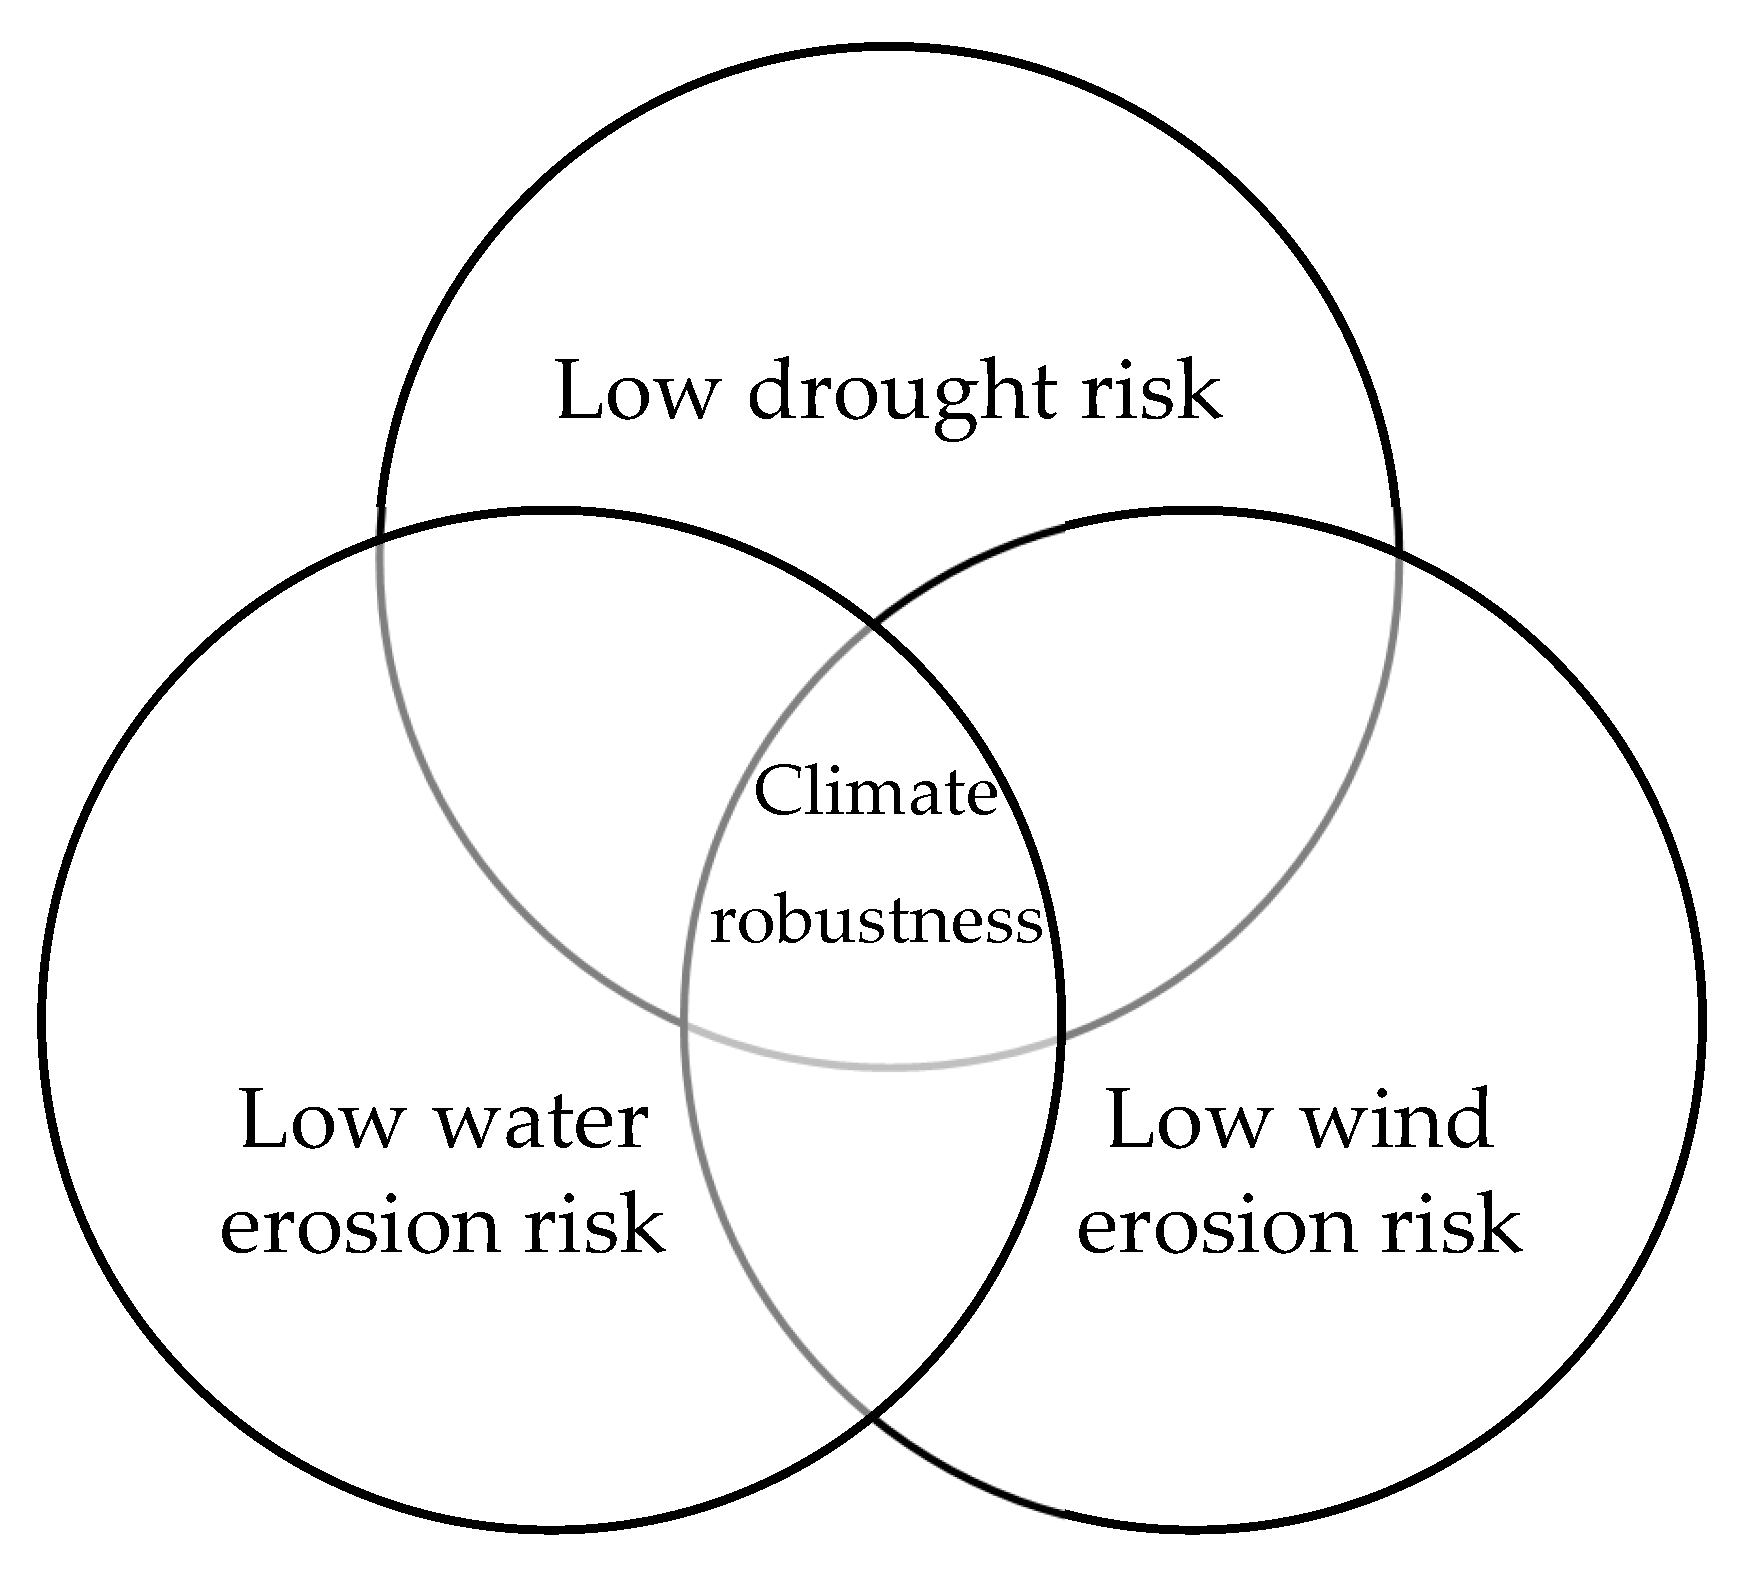
The climate-robust arable land has been determined through the combination of three key figures: drought, water erosion, and wind erosion risk (Figure 2). The drought risk has been defined through the annual mean of the de Martonne drought index (dMI) based on data from the German Meteorological Service (DWD) [15]. The drought risk is classified as low, with a dMi of 26 mm/°C to 20 mm/°C (cut-off criteria). To determine areas with a low wind erosion risk, a classification from Federal Institute for Geosciences and Natural Resources (BGR) has been used (BGR PEGWind1000 V1.0) [16]. The risk was assessed by analyzing the soil organic matter content, soil type, and mean annual wind speed, utilizing a wind erosion risk classification system. This methodology is thoroughly detailed in DIN 19706:2013, resulting in a classification scale from 0 to 5. Classes 0 to 3, which represent “none”, “very low”, “low”, and “medium sensitivity”, are considered to be beneficial for overall climate robustness [17]. The low water erosion risk was identified based on the German adaptation of the Universal Soil Loss Equation and data from the BGR (BGR PEGWASSER1000 V1.0) [18]. The risk of water erosion was determined using the German adaptation of the Universal Soil Loss Equation (ger. Allgemeine Bodenabtragsgleichung, ABAG). This equation considers various factors, including soil (K-factor), land use differentiation, and morphological (S-factor), geographic, and climatic data (R-factor). According to the threshold set by the German Federal Institute for Geosciences and Natural Resources, soils with an erosion risk of less than 10 t/ha per year were classified as having a low erosion risk. All arable land that shows a low drought, water erosion, and wind erosion risk has been classified as climate-robust and is shown in the shapefile climate-robust.shp.

Figure 2.
Graphical representation of the criteria for determining climate-robust arable land.
3.2. Economic Climate Robustness (Dynamic)
Economic climate robustness (high-yield_dynamic) has been classified using a bio-economic simulation based on two climate projections and two climate models from the CMIP5 ensemble [19]. For all arable land, the variation in gross margins per hectare over a 30-year period (2040–2070) has been determined using the crop growth model HERMES [20]. HERMES considers 276 detailed soil types, regional weather conditions, two global climate models (GCM) and two climate scenarios (Hadley Institute and Max Planck Institute, RCP 4.5 and 8.5). The models were chosen since they reflect the variability of GCMs regarding the climate projections for the region, and the scenarios also depict two contrasting pathways. For the bio-economic analysis, typical crop rotations for specialized arable farms (e.g., winter wheat, barley, canola, and rye) and for forage production (e.g., winter rye, silage corn, and fodder grass) were simulated. Each rotation is simulated multiple times with shifting starting crops to ensure that all crops face the weather conditions in all years, i.e., a crop rotation with three crops was calculated three times. For the following economic assessment, microeconomic data from the Brandenburg data collection of the Brandenburg Ministry for the Environment and Climate Protection [21] and national agricultural management data [22] were used.
Economic robust refers, in this case, to the fields with the 85% highest gross margins in the years with the lowest yields (25% quantile) for each of the 14 natural areas in Brandenburg [11]. The yield levels differ between the different climate projections. In order to reduce uncertainty, the shapefile only includes areas which are robust in all four projections.
3.3. High Current and Future Yield Potential
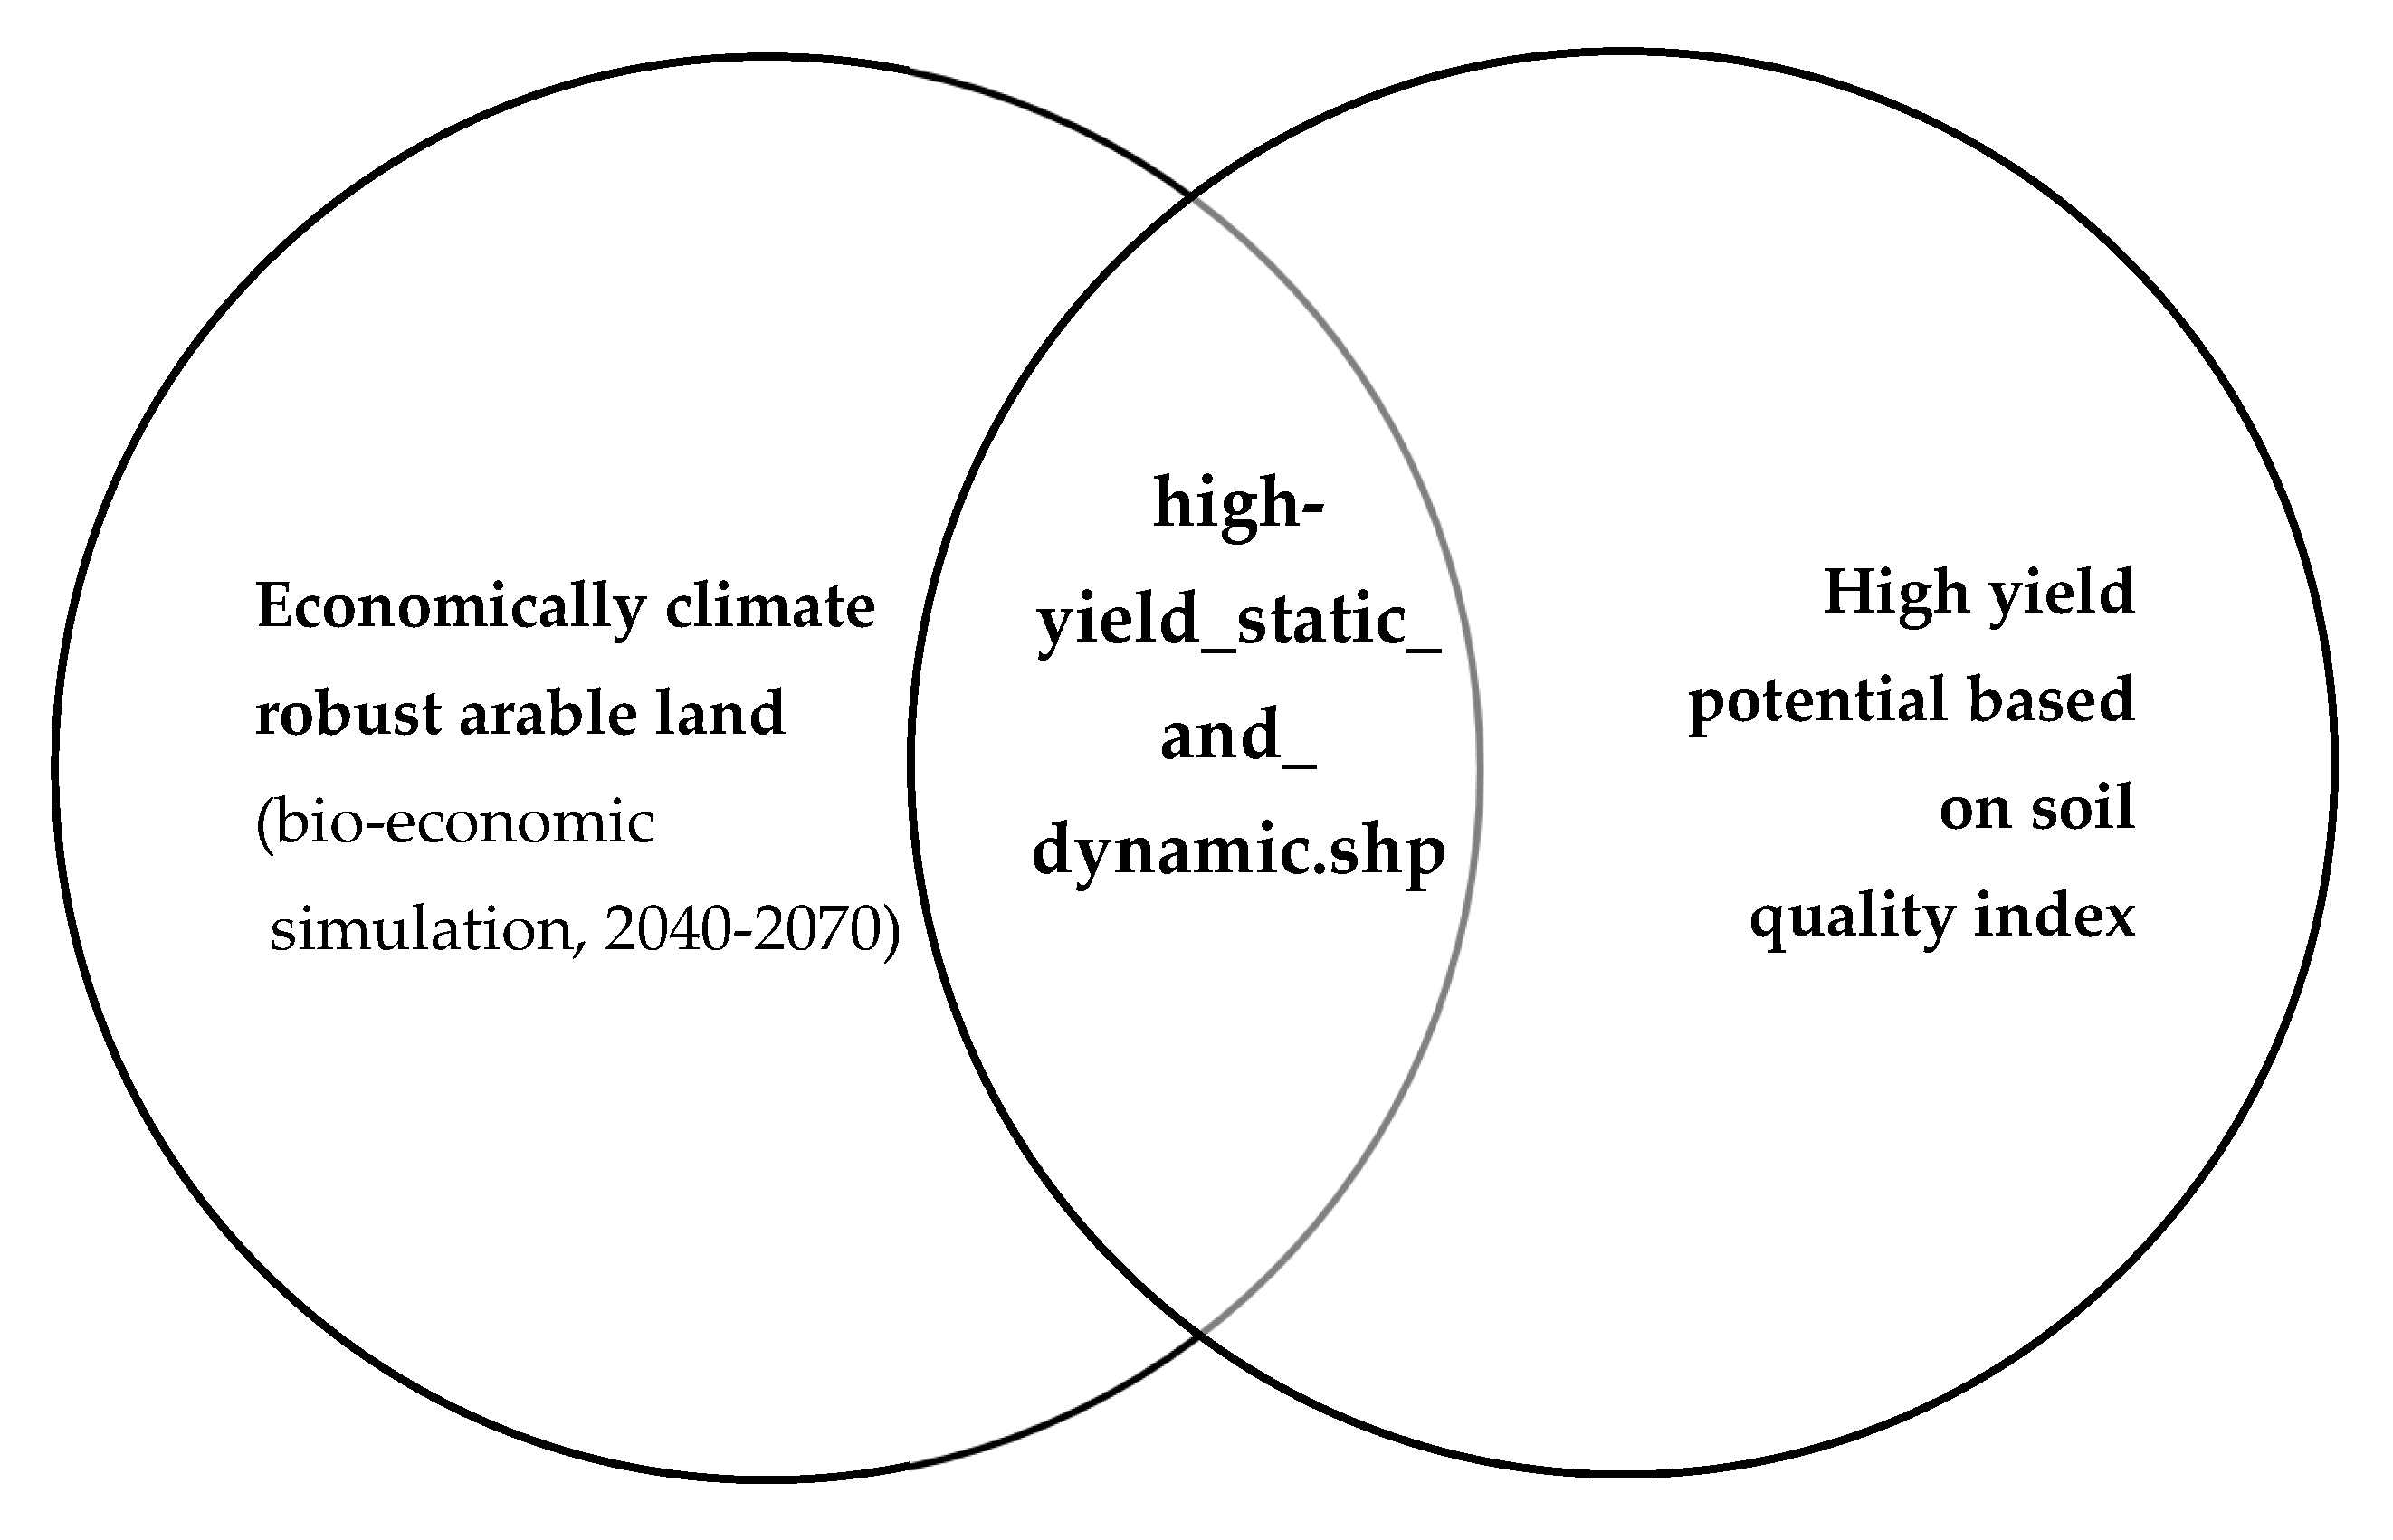
In the final shapefile (high-yield_static_and_dynamic), the assessment of the future yield potential in the previous shapefile (high-yield_dynamic) was complemented with an assessment of the current yield potential (see Figure 3). Arable land with a soil quality index [12] equal to or below 23 were excluded due to its low production potential. From the remaining land, the areas with the 85% highest arable indexes were determined. To combine the two approaches, the shapefile includes all areas that are climate-robust based on the bio-economic simulation and, at the same time, have a high yield potential based on the soil quality index.
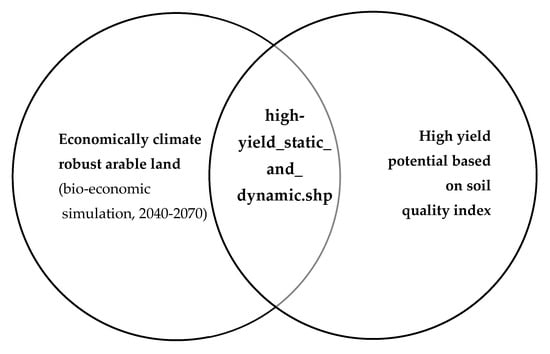
Figure 3.
Graphical representation of the criteria for determining arable land with high current and future yield potential.
4. Limitations
The dataset focuses solely on arable land; however, to provide a more comprehensive understanding of land use, von Czettritz et al. (2024) [6] incorporated additional indicators. These complementary indicators enable the inclusion of various land use types, such as grassland and permanent crops. This broader approach enhances the dataset’s applicability for diverse agricultural practices and land management strategies, allowing for a more holistic assessment of potential land uses.
To allow for more flexible use cases and to reduce the number of units, this dataset was not disaggregated back to the field block level, which would allow for addressing individual land owners. For policy and spatial planning data, it might be necessary to disaggregate the data to the field level based on, e.g., area shares. Should further questions arise, users are encouraged to reach out to the corresponding author.
Author Contributions
H.J.v.C.: conceptualization, software, formal analysis, methodology, writing—original draft; S.U.: writing—review and editing; J.S.: methodology, writing—review and editing; K.-C.K.: software, data curation; P.Z.: methodology, funding acquisition, project administration. All authors have read and agreed to the published version of the manuscript.
Funding
The research work is partly based on a project funded by the Regionale Planungsgemeinschaft Oderland-Spree. Furthermore, the study was also funded by ZALF internal research budget. The main author Hannah Jona v. Czettritz is funded through the Integrated Priority Project (IPP) “Cropping system diversification to increase the resilience of farming systems (divCROP)”, a program for PhD students working at ZALF to foster interdisciplinary research and cooperation. Kurt-Christian Kersebaum was supported by the SustEs project (CZ.02.1.01/0.0/0.0/16_019/000797).
Institutional Review Board Statement
Not applicable.
Informed Consent Statement
Not applicable.
Data Availability Statement
The full dataset can be found at: https://doi.org/10.4228/ZALF-29GF-SJ02, accessed on 24 January 2025.
Acknowledgments
The authors would like to extend their special thanks to the Regionale Planungsgemeinschaft Oderland-Spree and our former colleague Sebastian de la Serna for their excellent cooperation. The authors would also like to thank two anonymous reviewers for their helpful comments.
Conflicts of Interest
The authors declare no competing interests.
References
- BMUV. Nationale Moorschutzstrategie; (In German, National Peat Protection Strategy); Federal Ministry for the Environment, Nature Conservation, Nuclear Safety and Consumer Protection: Berlin, Germany, 2021. [Google Scholar]
- German Federal Government. Expanding Wind Energy for Germany. Available online: https://www.bundesregierung.de/breg-en/issues/sustainability/onshore-wind-energy-act-2060954 (accessed on 24 January 2025).
- Copenhaver, K.L. Combining Tabular and Satellite-Based Datasets to Better Understand Cropland Change. Land 2022, 11, 714. [Google Scholar] [CrossRef]
- Mak, H.W.L.; Laughner, J.L.; Fung, J.C.H.; Zhu, Q.; Cohen, R.C. Improved Satellite Retrieval of Tropospheric NO2 Column Density via Updating of Air Mass Factor (AMF): Case Study of Southern China. Remote Sens. 2018, 10, 1789. [Google Scholar] [CrossRef]
- Munier, S.; Aires, F. A new global method of satellite dataset merging and quality characterization constrained by the terrestrial water budget. Remote Sens. Environ. 2018, 205, 119–130. [Google Scholar] [CrossRef]
- Czettritz, H.J.V.; Hosseini-Yekani, S.-A.; Schuler, J.; Kersebaum, K.-C.; Zander, P. Adapting Cropping Patterns to Climate Change: Risk Management Effectiveness of Diversification and Irrigation in Brandenburg (Germany). Agriculture 2023, 13, 1740. [Google Scholar] [CrossRef]
- ClimateADAPT; European Union. Integration of Climat Change Adaptation in Land Use Planning. Available online: https://climate-adapt.eea.europa.eu/en/metadata/adaptation-options/adaptation-of-integrated-land-use-planning (accessed on 19 February 2025).
- Stevens, M.R.; Senbel, M. Are municipal land use plans keeping pace with global climate change? Land Use Policy 2017, 68, 1–14. [Google Scholar] [CrossRef]
- Zucaro, F.; Morosini, R. Sustainable land use and climate adaptation: A review of European local plans. TeMA-J. Land Use Mobil. Environ. 2018, 11, 7–26. [Google Scholar]
- Meuwissen, M.P.M.; Feindt, P.H.; Spiegel, A.; Termeer, C.J.A.M.; Mathijs, E.; Mey, Y.D.; Finger, R.; Balmann, A.; Wauters, E.; Urquhart, J.; et al. A framework to assess the resilience of farming systems. Agric. Syst. 2019, 176, 102656. [Google Scholar] [CrossRef]
- Scholz, E. Die Naturräumliche Gliederung Brandenburgs; Pädagogisches Bezirkskabinett: Potsdam, Germany, 1962. [Google Scholar]
- Schmitz, T. Soil Values from the Agricultural Soil Valuation for Brandenburg; BonaRes Data Centre: Müncheberg, Germany, 2020. [Google Scholar] [CrossRef]
- MLUK LGB Dezernat 33. DFBK GIS-InVeKoS—Version 2.0. Available online: https://data.geobasis-bb.de/geofachdaten/Landwirtschaft/dfbk.zip (accessed on 24 January 2025).
- LBGR. Moorbodenkarte des Landes Brandenburg. Available online: https://mluk.brandenburg.de/mluk/de/umwelt/boden/vorsorgender-bodenschutz/moorbodenkarte/# (accessed on 24 January 2025).
- Deutscher Wetterdienst. Annual Drought Index. Available online: https://opendata.dwd.de/climate_environment/CDC/grids_germany/annual/drought_index/ (accessed on 30 August 2024).
- BGR. Karte der Potentiellen Winderosionsgefährdung—PEGWind1000 V1.0. Available online: https://www.bgr.bund.de/DE/Themen/Boden/Ressourcenbewertung/Bodenerosion/Wind/PEG_wind_node.html (accessed on 24 January 2025).
- Martinsen, M.; Knothe, S.; Thur, P. Abschlussdokumentation vom INKA BB-Teilprojekt 4: Klimaadaptierte Regionalplanung in den Regionen Uckermark-Barnim und Lausitz-Spreewald. Available online: https://www.region-lausitz-spreewald.de/de/projekte/projekte-in-der-region2.html (accessed on 19 June 2024).
- BGR. Potentielle Erosionsgefährdung Durch Wasser PEGWASSER1000 V1.0. Available online: https://www.bgr.bund.de/DE/Themen/Boden/Ressourcenbewertung/Bodenerosion/Wasser/Karte_Erosionsgefahr_node.html (accessed on 24 January 2025).
- Andrews, T.; Gregory, J.M.; Webb, M.J.; Taylor, K.E. Forcing, feedbacks and climate sensitivity in CMIP5 coupled atmosphere-ocean climate models. Geophys. Res. Lett. 2012, 39, 1–7. [Google Scholar] [CrossRef]
- Kersebaum, K. Special features of the HERMES model and additional procedures for parameterization, calibration, validation, and applications. Methods Introd. Syst. Models Agric. Res. 2011, 2, 65–94. [Google Scholar]
- Landesamt für Verbraucherschutz. Datensammlung für die Betriebsplanung und die betriebswirtschaftliche Bewertung landwirtschaftlicher Produktionsverfahren im Land Brandenburg, 6th ed.; Landesamt für Verbraucherschutz: Frankfurt/Oder, Germany, 2016; Volume 1. [Google Scholar]
- KTBL. Betriebsplanung Landwirtschaft 2022/23. Daten für die Betriebsplanung in der Landwirtschaft; Kuratorium für Technik und Bauwesen in der Landwirtschaft e.V.: Darmstadt, Germany, 2022. [Google Scholar]

Disclaimer/Publisher’s Note: The statements, opinions and data contained in all publications are solely those of the individual author(s) and contributor(s) and not of MDPI and/or the editor(s). MDPI and/or the editor(s) disclaim responsibility for any injury to people or property resulting from any ideas, methods, instructions or products referred to in the content. |
© 2025 by the authors. Licensee MDPI, Basel, Switzerland. This article is an open access article distributed under the terms and conditions of the Creative Commons Attribution (CC BY) license (https://creativecommons.org/licenses/by/4.0/).