Abstract
Food spoilage and the associated organisms are a continuing concern for the food industry. The microorganisms involved with food spoilage in pasteurized milk can be introduced in a variety of ways, which include those that survive pasteurization and/or are introduced post-pasteurization. The use of bacteriophages for therapeutic regimens and as a method for the biocontrol of food-borne pathogens has been widely studied and applied; however, their use in the biocontrol against spoilage organisms is in its nascency. Bioluminescent bacteria offer the ability to act as cell-death reporters. In the case of using bacteriophage against spoilage-associated bacteria, cell death results in the loss of bioluminescence. In this study, a bioluminescent Pseudomonas species, Pseudomonas fluorescens M3A, was used to monitor the efficacy of the bacteriophage-associated biocontrol system within laboratory bacterial growth broth and fluid milk using bacteriophage ΦS1. Utilizing a bioluminescence kinetic assay with ten-fold serially diluted P. fluorescens M3A and bacteriophage ΦS1, data demonstrated rapid inactivation of bacterial growth, and at low bacteriophage titers. Cell death was indicated by the loss of bacterial bioluminescence. These data help to support the application of bacteriophage-based technologies against spoilage-associated bacteria to prolong shelf life in the event of microbial growth.
Dataset: DOI: 10.6084/m9.figshare.26764747.
Dataset License: CC BY 4.0
1. Summary
Research on bacteriophages holds paramount importance due to their pervasive presence in diverse environments, where they exert control over bacterial cells and biofilms [1]. In aquatic ecosystems, phages play a pivotal role by disrupting energy and carbon flow through bacterial cell lysis, which can have profound ecological implications [2]. Their significance has further escalated in industrial, academic, and food research arenas owing to the emergence of biocide-resistant bacteria. With the growing challenges posed by bacterial resistance to antibiotics and their adaptation to xenobiotics, phage therapy has garnered increasing attention [3]. Additionally, research has explored the utility of reporter bacteriophages for the precise detection of target bacterial cells [4]. Notably, bacteriophages serve as formidable predators of bacteria and substantially influence bacterial growth and lifecycles. Virulent phages, in particular, exhibit remarkable efficiency as predators, with the capacity to produce around 100 copies of themselves within a single bacterial generation during an infection, an ecological dynamic rarely observed in natural ecosystems [5].
The bacteriophage ΦS1 harbors a double-stranded DNA genome spanning 40,192 base pairs and exhibits a specific affinity for infecting Pseudomonas fluorescens [6]. Taxonomically, this phage belongs to the family Podoviridae and the subfamily Autographivirinae. Genomic analysis of phage ΦS1 has unveiled a broad host range, as documented by Sillankorva et al. in 2012 [6]. Notably, ΦS1 demonstrates remarkable efficacy in eliminating planktonic cultures, adherent cells, and mature biofilms [7].
To study such phage–host dynamics in real time, researchers have routinely turned to bioluminescent reporter systems. By introducing the lux operon into bacteria, cells are developed to bioluminesce, providing a non-invasive means of monitoring viability and metabolic activity. Bacterial bioluminescence arises from the luciferase-catalyzed oxidation of reduced flavin mononucleotides and aldehydes, encoded by the luxAB genes [8,9]. Operons vary in their composition: luxAB requires an external aldehyde source, whereas complete operons such as luxCDABE enable autonomous light production [8,9,10]. These systems provide powerful tools to track bacterial responses, including those to phage infection, under diverse conditions.
Whole-cell bioluminescent bioreporters are extensively employed for various bioassays, encompassing the monitoring of cellular toxicity, assessment of pollutant bioavailability, and detection of nucleic acid-damaging agents [11,12,13,14]. These bioluminescent reporters are highly appealing due to their non-invasive nature, heightened sensitivity, real-time gene expression quantification capabilities, and the ability to measure enzyme activity. Notably, the bioluminescent bacterial bioreporter Pseudomonas fluorescens M3A has been constructed from the Pseudomonas fluorescens strain Migula [15].
Bacterial bioluminescence serves as a valuable tool for real-time monitoring and examination of cell death resulting from lytic bacteriophage infection and subsequent cell lysis. Nevertheless, extending such observations to other matrices may introduce confounding variables due to the inherent differences among matrix environments. When evaluating host-bacteriophage kinetics in a complex food model like fluid milk, it is imperative that bioluminescence remains both detectable and quantifiable [15]. This ensures that it continues to serve as a reliable indicator of cell viability through the measurement of metabolic and enzymatic activity.
Monitoring bioluminescence in both conventional laboratory liquid media and complex food matrices such as milk is critical to determine the infection kinetics of the bacterial bioluminescent reporter Pseudomonas fluorescens M3A with its bacteriophage ΦS1. Therefore, the objective of this study was to determine the kinetics of Pseudomonas fluorescens M3A in response to the phage ΦS1 infection using a bioluminescence kinetic assay. The outcomes of these data are important to further enhance food safety and prolong shelf life, thus helping to mitigate the risk of contamination in the food supply chain over extended periods.
2. Data Description
To determine the kinetics of the host–phage interactions, evaluation of bioluminescence detection over time was assessed. Classical plating methods can be used, but they are time-consuming, costly, and cumbersome, and sampling frequency may be a limiting factor. Using a microplate spectrophotometer and luminometer, sampling and detecting P. fluorescens-ΦS1 kinetics can be performed efficiently and at a reduced cost. It also adds the ability to accumulate data quickly, among many treatment matrices, and en masse.
For the bioluminescence kinetic analysis, we used P. fluorescens M3A (5.2 × 10⁶ CFU/mL) with ten-fold serial dilutions in the range of 10−5 in both LB and whole milk. The reported concentrations were calculated from the 1:1 ratio in the microtiter plate wells. Figure 1, Figure 2, Figure 3, Figure 4, Figure 5, Figure 6, Figure 7 and Figure 8 depict the results of each bacteriophage ΦS1 treatment based on differing bacteriophage titers, where P. fluorescens M3A was exposed to ΦS1 at decreasing titers via ten-fold serial dilutions in the range of 10−1 to 10−6 in both LB and whole milk from an initial titer of 1.93 × 10¹¹ PFU/mL. The reported concentrations were calculated from the 1:1 ratio in the microtiter plate wells.
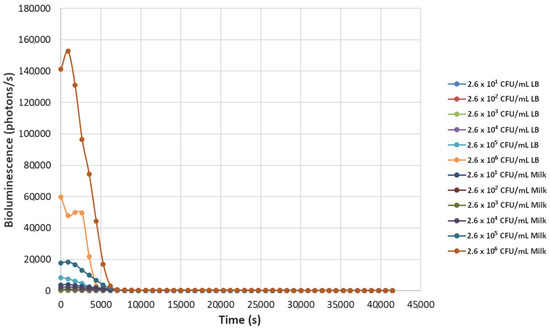
Figure 1.
The effect of bacteriophage ΦS1 (9.7 × 10⁹ PFU/mL) on bioluminescence intensities of P. fluorescens M3A concentrations serially diluted from 2.6 × 10⁶ CFU/mL in LB media and milk. Bioluminescence (490 nm) as a function of phage infection and lysis. Dilutions were made in Luria broth (LB) or whole milk and supplemented with salicylate (50 mg/L). Each sample was measured approximately every 900 s (15 min).
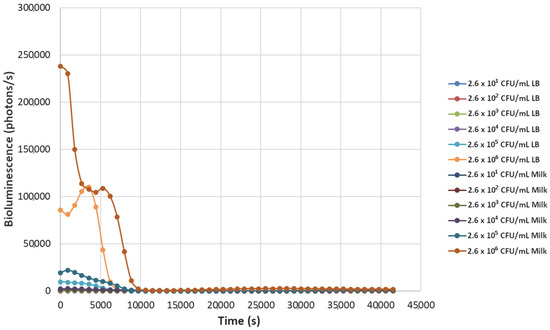
Figure 2.
The effect of bacteriophage ΦS1 (9.7 × 10⁸ PFU/mL) on bioluminescence intensities of P. fluorescens M3A concentrations serially diluted from 2.6 × 10⁶ CFU/mL in LB media and milk. Bioluminescence (490 nm) as a function of phage infection and lysis. Dilutions were made in Luria broth (LB) or whole milk and supplemented with salicylate (50 mg/L). Each sample was measured approximately every 900 s (15 min).
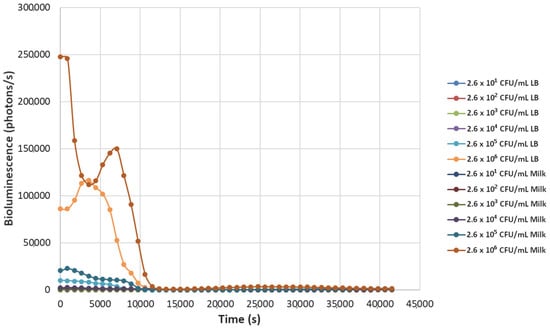
Figure 3.
The effect of bacteriophage ΦS1 (9.7 × 10⁷ PFU/mL) on bioluminescence intensities of P. fluorescens M3A concentrations serially diluted from 2.6 × 10⁶ CFU/mL in LB media and milk. Bioluminescence (490 nm) as a function of phage infection and lysis. Dilutions were made in Luria broth (LB) or whole milk and supplemented with salicylate (50 mg/L). Each sample was measured approximately every 900 s (15 min).
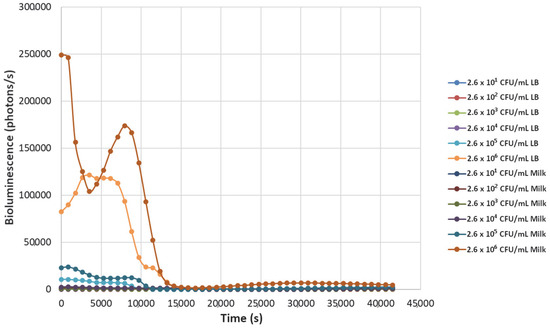
Figure 4.
The effect of bacteriophage ΦS1 (9.7 × 10⁶ PFU/mL) on bioluminescence intensities of P. fluorescens M3A concentrations serially diluted from 2.6 × 10⁶ CFU/mL in LB media and milk. Bioluminescence (490 nm) as a function of phage infection and lysis. Dilutions were made in Luria broth (LB) or whole milk and supplemented with salicylate (50 mg/L). Each sample was measured approximately every 900 s (15 min).
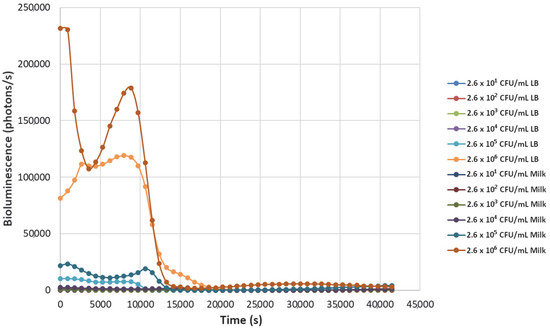
Figure 5.
The effect of bacteriophage ΦS1 (9.7 × 10⁵ PFU/mL) on bioluminescence intensities of P. fluorescens M3A concentrations serially diluted from 2.6 × 10⁶ CFU/mL in LB media and milk. Bioluminescence (490 nm) as a function of phage infection and lysis. Dilutions were made in Luria broth (LB) or whole milk and supplemented with salicylate (50 mg/L). Each sample was measured approximately every 900 s (15 min).
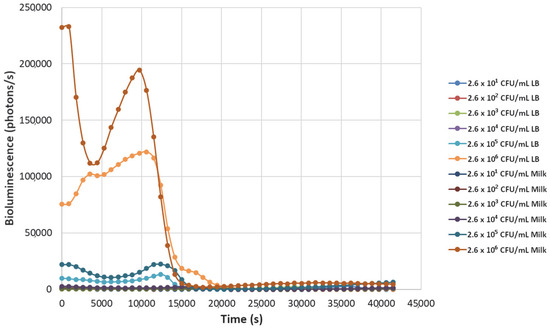
Figure 6.
The effect of bacteriophage ΦS1 (9.7 × 10⁴ PFU/mL) on bioluminescence intensities of P. fluorescens M3A concentrations serially diluted from 2.6 × 10⁶ CFU/mL in LB media and milk. Bioluminescence (490 nm) as a function of phage infection and lysis. Dilutions were made in Luria broth (LB) or whole milk and supplemented with salicylate (50 mg/L). Each sample was measured approximately every 900 s (15 min).
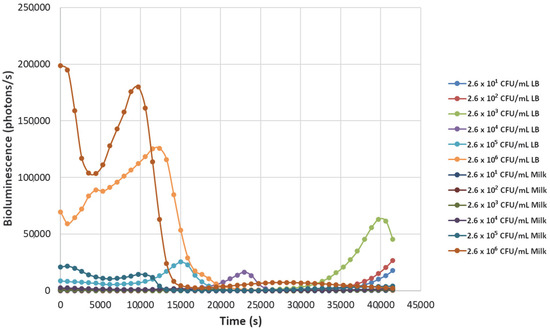
Figure 7.
The effect of bacteriophage ΦS1 (9.7 × 10³ PFU/mL) on bioluminescence intensities of P. fluorescens M3A concentrations serially diluted from 2.6 × 10⁶ CFU/mL in LB media and milk. Bioluminescence (490 nm) as a function of phage infection and lysis. Dilutions were made in Luria broth (LB) or whole milk and supplemented with salicylate (50 mg/L). Each sample was measured approximately every 900 s (15 min).
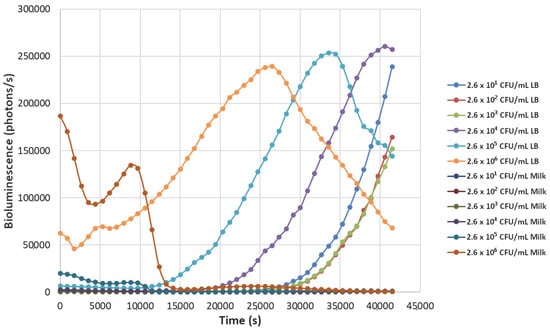
Figure 8.
The effect of bacteriophage ΦS1 (9.7 × 10² PFU/mL) on bioluminescence intensities of P. fluorescens M3A concentrations serially diluted from 2.6 × 10⁶ CFU/mL in LB media and milk. Bioluminescence (490 nm) as a function of phage infection and lysis. Dilutions were made in Luria broth (LB) or whole milk and supplemented with salicylate (50 mg/L). Each sample was measured approximately every 900 s (15 min).
Significant bioluminescence was observed with the greater concentrations of bacteria in both milk and LB. Interestingly, a greater level of bioluminescence was recorded in milk at the 2.6 × 10⁶ CFU/mL P. fluorescens M3A compared to LB. Specifically, in milk, the bioluminescence for the P. fluorescens M3A was 141,180 photons per second, while in LB, it was approximately 59,921 photons per second (Figure 1). Additionally, the P. fluorescens M3A dilution of 2.6 × 10⁵ CFU/mL in milk displayed 17,754 photons per second, whereas in LB, it displayed 8373 photons per second. The bacteriophage ΦS1 effectively eliminated P. fluorescens M3A cells in all other dilutions, resulting in the absence of bioluminescence in these respective treatments. This underscores the ability of P. fluorescens M3A to potentially contaminate milk even in the presence of high titers of ΦS1; however, thorough inactivation occurs rapidly, as depicted in Figure 1.
Decreasing the titers of the bacteriophage ΦS1 from 9.7 × 10⁹ PFU/mL to 9.7 × 10² PFU/mL via ten-fold serial dilutions demonstrated greater resilience towards inactivation of the bacterial load, as demonstrated by increased time to inactivation via loss of bioluminescence (Figure 2, Figure 3, Figure 4, Figure 5, Figure 6, Figure 7 and Figure 8). As expected, greater abundances of P. fluorescens M3A displayed a greater time to loss of bioluminescence, indicating cell death, which was most pronounced in the two greater bacterial loads: 2.6 × 10⁶ CFU/mL and 2.6 × 10⁵ CFU/mL throughout all kinetic assays (Figure 1, Figure 2, Figure 3, Figure 4, Figure 5, Figure 6, Figure 7 and Figure 8). Interestingly, the lowest titer of ΦS1 (9.7 × 10² PFU/mL) resulted in bacterial limited inactivation, delayed culture growth, or resistance (Figure 8), but only in the LB treatments. Almost all milk bacterial loads were inactivated, indicating that even in the presence of low titers of ΦS1 in milk, thorough inactivation occurred rapidly with lasting effect.
Milk consistently had initial greater bioluminescence at the greater bacterial loads (2.6 × 10⁶ CFU/mL and 2.6 × 10⁵ CFU/mL) in all bioluminescence kinetic assays. This is likely due to the increased lipid and fatty acid content of the whole milk compared to the LB media. Luciferase, as encoded by the luxAB genes, serves as the catalyst for the bioluminescence reaction [8]. This enzymatic process requires molecular oxygen, reduced flavin mononucleotides, and a substrate aldehyde, which undergoes oxidation to yield the respective fatty acid [16]. The byproducts of this reaction are light and water [16]. It has been documented that exposure to various solvents can lead to significant alterations in the fatty acid composition of bacterial membranes [17]. Consequently, the bioavailability of fatty acids for the bioluminescent reaction is likely influenced, explaining the observed increases in bioluminescence following exposure to solvents, or in this study, whole milk.
This dataset focused on fluid milk as a representative food matrix because of the direct relevance of Pseudomonas fluorescens to dairy spoilage. Pseudomonas fluorescens M3A exhibited bioluminescence under various conditions in both LB and whole milk, determining the kinetics of bioluminescence in P. fluorescens M3A within these growth media. Furthermore, the impact of bacteriophage ΦS1 on bioluminescence, and therefore P. fluorescens M3A viability, was assessed, revealing its capacity to constrain the proliferation of P. fluorescens M3A, even at low bacteriophage titers. This suggests that exploring mechanisms to inhibit the growth of spoilage organisms like Pseudomonas after pasteurization could be valuable for food preservation. Future work could build upon these data to explore broader applicability across additional food matrices.
It should be noted that the expression of bioluminescence in the M3A strain, or bioluminescent reporters, may alter bacterial physiology. Prior studies have suggested that light emission in bacteria could influence their metabolic state or interactions with other microbes [18]. While M3A has been widely used as a reporter organism, and no direct evidence indicates that lux-mediated bioluminescence alters phage infectivity in this strain [15], the potential for bioluminescence to affect host–phage dynamics cannot be excluded and should be considered when interpreting results. Importantly, these data add to the growing body of work exploring P. fluorescens M3A and other host–phage interactions. By providing data from a complex food matrix model, our findings help extend this conversation to practical applications in food safety and preservation. Further investigation into the molecular mechanisms underlying such bacteriophage-based interactions would provide valuable insights into bioluminescence dynamics in diverse growth environments.
3. Methods
3.1. Culturing of Pseudomonas fluorescens M3A
Pseudomonas fluorescens M3A was grown in 100 mL of overnight (24 h) LB (10% tryptone, 5% yeast extract, 10% NaCl) media to an OD600 of 0.5 (2 × 10⁹ CFU/mL) and washed and resuspended in PBS. A 50 μL aliquot of the resulting bacterial culture suspension was then inoculated into 100 mL whole milk (Kroger Co., Cincinnati, OH, USA) or LB media. Both media were supplemented with 100 μL kanamycin (50 μg/mL) for use with the selectable marker [15], 100 μL salicylate (50 μg/mL), and shaken at room temperature (26 °C) at 100 RPM until OD600 of 0.2.
3.2. Preparation of ΦS1 Bacteriophage
A 100 mL culture of Pseudomonas fluorescens M3A was inoculated with ΦS1 bacteriophages at a multiplicity of infection (MOI) of 0.1 and incubated overnight at 37 °C in LB supplemented with 50 μg/mL of Kanamycin (Km). The culture was then divided into two 50 mL centrifuge tubes and subjected to centrifugation at 10,800× g for 10 min. Subsequently, ΦS1 bacteriophage were precipitated by adding 7.5 mL of 20% polyethylene glycol (PEG)-8000 to 30 mL of the supernatant. This mixture was placed on ice for 30 min and then centrifuged at 11,000× g for 20 min. The resulting pellet was reconstituted in 1 mL of STE buffer (pH 7.5; containing 20 mM Tris–HCl, 0.1 M NaCl, and 10 mM EDTA).
Using a top agar, pour plate method, a standard plaque assay was performed using P. fluorescens M3A and bacteriophage ΦS1, similar to Myer, 2013 [15]. A total of 3 mL LB top agar tubes (0.7% agar) were melted and tempered in a water bath to 42–45 °C in a water bath. In LB media, serial dilutions of ΦS1were performed, and 0.1mL of each dilution was mixed in the top agar with 0.2 mL P. fluorescens M3A (8.8 × 10⁷ CFU/mL). To produce a uniform top layer, the top agar was vortexed gently for 2–3 s and spread onto the base LB agar (1.7% agar) plate. After the top agar solidified for 1 h, plates were incubated at 26 °C overnight, and plaque formation was enumerated after overnight incubation.
3.3. Bioluminescence Kinetic Assay
The assay was conducted on 96-well micro-titer plates (PerkinElmer OptiPlate, Shelton, CT, USA), consisting of rows A-H and columns 1–12. Each experiment was completed in triplicate, similar to Kim et al., 2009 [19], and conducted simultaneously on the same microtiter plate, thereby minimizing environmental variation and reducing the likelihood that observed signal loss was due to spontaneous luminescence decline rather than phage infection. Each plate was loaded with 50 μL of LB media or whole milk (Kroger Co., Cincinnati, OH, USA), depending upon the treatment, which contained an exponentially growing culture of P. fluorescens M3A (OD600 = 0.2, 5.2 × 10⁶ CFU/mL). The culture of P. fluorescens M3A at 5.2 × 10⁶ CFU/mL was loaded in the first row of wells. The remaining eleven subsequent rows of P. fluorescens M3A were then each serially diluted ten-fold with respective media to obtain diluted P. fluorescens M3A concentrations. A total of 50 μL of these dilutions was added to the wells, corresponding to rows 1–12. Bacteriophage ΦS1 (ATCC Number: 27663-B1), in appropriate media + salicylate (50 μg/mL), was added to the first column at 50 μL aliquots and at a titer of 1.93 × 10¹¹ PFU/mL. The remaining seven subsequent columns of ΦS1 were then each serially diluted ten-fold with respective media to obtain diluted bacteriophage concentrations. A total of 50 μL of these dilutions was added to the wells, corresponding to columns A-H. The total volume was 100 μL. Reported concentrations were calculated from the 1:1 ratio. The plate was run and read on a luminometer (Victor 1420, Perkin Elmer, Waltham, MA, USA). The program was set up to measure bioluminescence intensity (490 nm) for 2 s per well by automatic manipulation, at 15 °C, at approximately 900 s (15 min) intervals for approximately 11.5 h. Data were recorded as photons second-1 and analyzed. Within run, replicates were averaged to obtain a mean value for each biological replicate, and the complete raw data (including all replicates) were provided in the dataset.
Author Contributions
Conceptualization, P.R.M. and B.M.A.; methodology, P.R.M., P.B. and H.S.; formal analysis, P.R.M., P.B. and H.S.; investigation, P.R.M., P.B., H.S. and B.M.A.; data curation, P.R.M., P.B. and H.S.; writing—original draft preparation, P.R.M.; writing—review and editing, P.R.M., P.B., H.S. and B.M.A.; supervision, B.M.A.; project administration, P.R.M. and B.M.A.; funding acquisition, B.M.A. All authors have read and agreed to the published version of the manuscript.
Funding
This work was supported by the USDA National Institute of Food and Agriculture, Hatch project number 1004830, and by USDA ARS Project No. 8072-42000-077.
Institutional Review Board Statement
Not applicable.
Informed Consent Statement
Not applicable.
Data Availability Statement
The original data presented in the study are openly available in FigShare at DOI: 10.6084/m9.figshare.26764747.
Conflicts of Interest
The authors declare no conflicts of interest.
References
- Chang, C.; Yu, X.; Guo, W.; Guo, C.; Guo, X.; Li, Q.; Zhu, Y. Bacteriophage-mediated control of biofilm: A promising new dawn for the future. Front. Microbiol. 2022, 13, 825828. [Google Scholar] [CrossRef] [PubMed]
- Sillankorva, S.; Oliveira, R.; Vieira, M.J.; Sutherland, I.; Azeredo, J. Bacteriophage Φ S1 infection of Pseudomonas fluorescens planktonic cells versus biofilms. Biofouling 2004, 20, 133–138. [Google Scholar] [CrossRef] [PubMed]
- Zelcbuch, L.; Yitzhaki, E.; Nissan, O.; Gidron, E.; Buchshtab, N.; Kario, E.; Kredo-Russo, S.; Zak, N.B.; Bassan, M. Luminescent phage-based detection of Klebsiella pneumoniae: From engineering to diagnostics. Pharmaceuticals 2021, 14, 347. [Google Scholar] [CrossRef] [PubMed]
- Meile, S.; Sarbach, A.; Du, J.; Schuppler, M.; Saez, C.; Loessner, M.J.; Kilcher, S. Engineered reporter phages for rapid bioluminescence-based detection and differentiation of viable Listeria cells. Appl. Environ. Microbiol. 2020, 86, e00442-20. [Google Scholar] [CrossRef] [PubMed]
- Heilmann, S.; Sneppen, K.; Krishna, S. Coexistence of phage and bacteria on the boundary of self-organized refuges. Proc. Natl. Acad. Sci. USA 2012, 109, 12828–12833. [Google Scholar] [CrossRef] [PubMed]
- Sillankorva, S.; Kropinski, A.M.; Azeredo, J. Genome sequence of the broad-host-range Pseudomonas phage Φ-S1. J. Virol. 2012, 86, e01605-12. [Google Scholar] [CrossRef] [PubMed]
- Sillankorva, S.; Neubauer, P.; Azeredo, J. Isolation and characterization of a T7-like lytic phage for Pseudomonas fluorescens. BMC Biotechnol. 2008, 8, 80. [Google Scholar] [CrossRef] [PubMed]
- Applegate, B.; Kehrmeyer, S.; Sayler, G. A chromosomally based tod-luxCDABE whole-cell reporter for benzene, toluene, ethybenzene, and xylene (BTEX) sensing. Appl. Environ. Microbiol. 1998, 64, 2730–2735. [Google Scholar] [CrossRef] [PubMed]
- Brodl, E.; Winkler, A.; Macheroux, P. Molecular mechanisms of bacterial bioluminescence. Comput. Struct. Biotechnol. J. 2018, 16, 551–564. [Google Scholar] [CrossRef] [PubMed]
- Vannier, T.; Hingamp, P.; Turrel, F.; Tanet, L.; Lescot, M.; Timsit, Y. Diversity and evolution of bacterial bioluminescence genes in the global ocean. NAR Genom. Bioinform. 2020, 2, lqaa018. [Google Scholar] [CrossRef] [PubMed]
- Al-Hindi, R.R.; Teklemariam, A.D.; Alharbi, M.G.; Alotibi, I.; Azhari, S.A.; Qadri, I.; Alamri, T.; Harakeh, S.; Applegate, B.M.; Bhunia, A.K. Bacteriophage-based biosensors: A platform for detection of foodborne bacterial pathogens from food and environment. Biosensors 2022, 12, 905. [Google Scholar] [CrossRef] [PubMed]
- Ripp, S.; Daumer, K.A.; McKnight, T.; Levine, L.H.; Garland, J.L.; Simpson, M.L.; Sayler, G.S. Bioluminescent bioreporter integrated-circuit sensing of microbial volatile organic compounds. J. Ind. Microbiol. Biotechnol. 2003, 30, 636–642. [Google Scholar] [CrossRef] [PubMed]
- Xu, T.; Close, D.M.; Sayler, G.S.; Ripp, S. Genetically modified whole-cell bioreporters for environmental assessment. Ecol. Indic. 2013, 28, 125–141. [Google Scholar] [CrossRef] [PubMed]
- Song, Y.; Li, G.; Thornton, S.F.; Thompson, I.P.; Banwart, S.A.; Lerner, D.N.; Huang, W.E. Optimization of bacterial whole cell bioreporters for toxicity assay of environmental samples. Environ. Sci. Technol. 2009, 43, 7931–7938. [Google Scholar] [CrossRef] [PubMed]
- Myer, P.R. Construction, Characterization, and Application of the Bioluminescent Bioreporter Pseudomonas fluorescens M3A. Ph.D. Dissertation, Purdue University, West Lafayette, IN, USA, 2013. [Google Scholar]
- Heitzer, A.; Applegate, B.; Kehrmeyer, S.; Pinkart, H.; Webb, O.F.; Phelps, T.J.; White, D.C.; Sayler, G.S. Physiological considerations of environmental applications of lux reporter fusions. J. Microbiol. Methods 1998, 33, 45–57. [Google Scholar] [CrossRef]
- Sikkema, J.; de Bont, J.A.; Poolman, B. Mechanisms of membrane toxicity of hydrocarbons. Microbiol. Rev. 1995, 59, 201–222. [Google Scholar] [CrossRef] [PubMed]
- Timsit, Y.; Lescot, M.; Valiadi, M.; Not, F. Bioluminescence and photoreception in unicellular organisms: Light-signalling in a bio-communication perspective. Int. J. Mol. Sci. 2021, 22, 11311. [Google Scholar] [CrossRef] [PubMed]
- Kim, S.; Schuler, B.; Terekhov, A.; Auer, J.; Mauer, L.; Perry, L.; Applegate, B. A bioluminescence-based assay for enumeration of lytic bacteriophage. J. Microbiol. Methods 2009, 79, 18–22. [Google Scholar] [CrossRef] [PubMed]
Disclaimer/Publisher’s Note: The statements, opinions and data contained in all publications are solely those of the individual author(s) and contributor(s) and not of MDPI and/or the editor(s). MDPI and/or the editor(s) disclaim responsibility for any injury to people or property resulting from any ideas, methods, instructions or products referred to in the content. |
© 2025 by the authors. Licensee MDPI, Basel, Switzerland. This article is an open access article distributed under the terms and conditions of the Creative Commons Attribution (CC BY) license (https://creativecommons.org/licenses/by/4.0/).