Article

An Exploratory Research Regarding Greek Consumers’ Behavior on Wine and Wineries’ Character

by
Dionysia Sykalia
1,
Yvonni Chrisostomidou
2 and
Ioannis K. Karabagias
3,*
1
Department of Chemistry, University of Ioannina, 45110 Ioannina, Greece
2
Department of Materials and Environmental Chemistry, University of Stockholm, SE-10691 Stockholm, Sweden
3
Department of Food Science & Technology, School of Agricultural Sciences, University of Patras, G. Seferi 2, 30100 Agrinio, Greece
*
Author to whom correspondence should be addressed.
Beverages 2023, 9(2), 43; https://doi.org/10.3390/beverages9020043
Submission received: 4 March 2023 / Revised: 14 April 2023 / Accepted: 4 May 2023 / Published: 12 May 2023

Abstract

:
Given the lack of data regarding the preferences, behavior and habits of wine consumers in Greece, the purpose of the present study was to investigate consumer trends and explore the factors that affect the purchase and consumption of wine in comparison with other alcoholic beverages. For this purpose, a self-response questionnaire survey was designed through the Google platform on a sample of 994 participants. In order to analyze the collected data, statistical analysis was done. A second online questionnaire was introduced to Greek winery companies. The purpose was to examine if the wine producers follow the wine consumption trends according to the desires of the Greek wine consumers or are addressed to a more international audience. As for the wine companies’ perspectives, we wanted to collect data regarding the amount of their production and the type of wine they produce and to know about their profile (international, exports, strategies, etc.). We collected 71 responses from wineries located in different parts of Greece. For the first time in the last 10 years, there is a profile of Greek consumers’ behavior toward wine in comparison with other alcoholic beverages and knowledge of specific operational data of Greek wineries using an online questionnaire survey (e-survey).

Graphical Abstract

1. Introduction

For several reasons, the wine market sector is of interest to many people around the world. As a result of the competitiveness in the food sector, information about consumer behavior or patterns that may display their purchase decision regarding alcoholic beverages consumption has created the need to acquire an insight into their desires. Wine has been produced for thousands of years and has played an important role in the culture and religion of many civilizations [1]. Wine is one of the most extensively traded products in the world and the most traded alcoholic beverage in terms of value [2]. Wine production in Greece plays an important role in the economic establishment. Greece has a millenary wine tradition, which has always been an integral part of its culture. With its geographical uniqueness, hundreds of wines with different flavors and characteristics are produced every year.
Since the wine sector has always been a concerning issue, more and more are those who want to predict consumers’ behavior and preferences. Several studies have focused on analyzing consumer behavior to create the best wine product, thus ideal for consumers. Consumers’ preferences and appreciation of wines are linked to both intrinsic [3] and extrinsic elements [4,5]. To understand wine consumption, it is necessary to understand the individual behavior relating to wine consumption [6]. The study of consumer behavior is very important because it is an element that could contribute significantly to the establishment of an effective strategy, the implementation of which the company will be able to achieve its objectives finally.
A full understanding of wine consumers’ needs, preferences, attitudes, and buying behavior is needed to identify market segments and try to maintain present and future business profitability [7]. Consumers’ wine choice is complex since it is one of the most differentiated products on the food market [8]. Consumer behavior can be influenced by many factors. One of them is gender. In Australia, for example, it has been reported that females are more likely to drink white and sparkling wine than males [7]. Bruwer et al. [9] revealed a higher frequency of consumption of sparkling and rosé wine in females, while males were shown to prefer red wine. Jennings and Wood [10] stated that 70% of wines sold in the UK are purchased by women in supermarkets as part of their regular grocery shopping routine. Women are significantly more likely to pay a higher price for fair trade or organic wines, while men are less so [11].
Moreover, the sensory characteristics of the wine [12], the variety of grapes [13], the region of origin [14], the branding [15], the packaging, and the label [16,17,18] seem to affect consumers to a different degree. Well-known brands are more likely to be trusted when consumers have no experience with the product [19]. A strong brand reputation instills confidence in consumers, and confident consumers exhibit lower risk perceptions [20,21]. The literature about wine consumers’ perceptions pointed out the high consideration that drinkers have towards the geographical indication (GI) of wines [22]. Many studies argued that a product’s country of origin may have a strong influence on the acceptance and success of particular wines [14,23,24].
Another important factor seems to be the price of wine, especially when no other information is available about the product [19]. The price is more important for a consumer with low involvement and scarce knowledge of the attributes of a quality wine [25]. If the consumers perceive a high price relationship with wine, then they will probably buy a more expensive one, in the belief that it will have better quality or sensory characteristics [26]. Traditionally, consumers who have knowledge of wines of good quality always spend a significant amount of money generously to buy these products [27].
There is an interest in eco-friendly, sustainable wine [28], organic wines with no added sulfites [29] and wine produced with hand-harvested grapes without interconnection with organic wines [30]. Innovative wine attributes such as “canned wine”, “alcohol—free wine” and “vegan wine” are still the least important to consumers [31].
There is a lack of the literature about bulk wine consumption. Bottled wine is the most consumed wine, both in producing and importing wine countries, but the consumption of bulk wine persists and takes place in traditional producer countries [32]. Wine consumers have shown a high appreciation for bulk wine [33,34]. The demand for bulk wines and the consumers’ preferences for these products are not examined indepth. In parallel, there are very few studies on consumers’ preferences for Greek wines, such as preferences for cask wine [35], quality wines [36], organic ones [37], and for origin labels [22], but there are no studies on Greek wine consumers’ characteristics.
Greece is a micro-producer on the scale of vineyards as the extent of Greece’s vineyards is about 106 thousand ha producing 2.2 million hl wine [38]. Greek wineries can be divided into four main categories: large wineries with a production capacity greater than 100,000 hl per year, medium with a production capacity of 30,000 up to 100,000 hl per year, in small, usually family wineries with limited production capacity (less than 30,000 tons) and cooperatives that produce and distribute wine, mainly locally. In Greece, there are about 700 active wine producers. (Wine producers with more than one winery are registered once, where their headquarters are settled). Active refers to those producers who already produce bottled wine. This number includes wine producers who have vineyards, but they might not yet own a complete winery and are supported by other wineries [39]. In the wine sector, the organizational form of a family business is common. Such firms are often family businesses with long-term, outstanding traditions. The wine they produce embodies values, symbols, and traditions, which together convey the family’s mindset. In most cases, these families have a good market reputation [40].
The Greek wine industry, after the financial crisis in 2008, turned to the foreign and international market to survive and became more extroverted. A grand percentage of the production was exported, realizing that a global market is also an option. The Greek winemakers became ‘’more international’’ showing their unique products. Greek wine also participates in the tourism activity of the country. Wineries from all around the country offer tasting tours and are open to the public. Charters and Fountain [41] reported that while older people emphasize the product itself, for younger wine tourists, the overall experience and the received services are more important than the quality of the wine.
Greek wine is exported to almost all countries of the world. In all, the European Union absorbs 85.2% of total wine export by main suppliers Germany and France. However, exports to third countries cannot touch on the whole the same proportion as in the EU but also absorb large quantities of wine [42]. The U.S. and Canada absorb larger amounts of wine compared with other third countries, at rates reaching 42.8% and 14.2%, respectively, of the total [43]. The use of social media tools by wineries has been increasing over the years. Wine is an experiential product [44], and as wine brands compete to attract and retain consumers, many are embracing social media to reach their consumers and communicate their brand experience, quality and personality [45].
Considering the above, the aim of the present study was to investigate consumer trends regarding the consumption of alcoholic beverages and explore more deeply the factors that affect the purchase and consumption of wine, along with some data concerning some wineries located in different regions of Greece. To the best of our knowledge, this is the first time in the literature of the last 10 years to characterize the profile of Greek consumers’ behavior on wine combined with specific operational data of Greek wineries using an e-survey.

2. Materials and Methods

2.1. Sample Size

A survey was designed to gather information on Greek wine consumers’ interest. Regarding the sample size, 994 fully answered questionnaires were collected. In general, there was a great response and interest from the participants to answer the questionnaire, and thus reliable results were obtained. The sample of the respondents consists of families, friends, colleagues and acquaintances from our region and different parts of the country since a snowball sampling recruitment was adopted in order to reach a large number of participants [46,47].

2.2. Data Collection

The tool chosen for the data collection in the present study was an online survey using the Google Forms platform due to convenience, zero cost and the ability to directly export the results to an Excel sheet for further processing. This involves an electronic questionnaire since the latter it is considered the most basic means of communication between the interviewer and the respondent in the market research. The research was carried out between 23 November 2018 and 3 January 2019 (approximately one month to have the best possible correspondence and participation). The distribution of the questionnaires was done by sending an electronic message (e-mail), as similarly performed in other papers investigating consumer behaviors [48,49,50], and through the online social network Facebook [31,46] to people of different ages from different regions in Greece. The aim of the research was explained to the participants at the beginning of the questionnaire while obtaining access through the attached link (https://docs.google.com/forms/d/1NHc9zmCYqRBK5rvek4GR_SCniNrdQZuraP-YUs861Xk/edit?ts=6310fae2 and https://docs.google.com/forms/d/1xvT39rvSeO0D8yJ-K1CGk0yGMevgJCHGUq6qyUhlgKg/edit?ts=6310fb66). Responses were anonymous, and no personal information was collected or inquired. The identity of the participants remained secret to guarantee anonymity, and all the information collected was used only for the purpose of the study.

2.3. Design of the Questionnaires

The questionnaire for consumers that participated in the study was formulated in Greek. No difficulties or misunderstandings were reported. The participants had to respond to some questions. The questions were multiple choice, and statements were introduced to the participants and scored on a 5 points scale: 1 = strongly disagree, 2 = disagree, 3 = not agree/nor disagree, 4 = agree, and 5 = strongly agree). The questionnaire takes approximately 5 min to be filled. We tried to make the questionnaire as short as possible. The aim of questionnaire was designed in three parts: social-demographic characteristics, wine consumer preferences and habits such as the kind of wine, the frequency, the place of purchase, etc., and other information about wine consumption and perception.
Regarding the structure of the questionnaire associated with the wineries’ participation, the questionnaire was brief, and the format of the questions did not cause any difficulty for the participants. The questions were clear and formulated in plain language. The questions were multiple choices and on a scale of 5-point to reduce the time of the e-survey completion. The respondents were asked to indicate the frequency of means of promotion that they use (from 1 = never to 5 = always), to what extent sales were affected after the economic crisis (from 1 = not at all to 5 = extremely) and the importance of specific objectives to the firm’s foreign pricing strategy (from 1 = not at all important to 5 = very important). The distribution of the questionnaires was performed by sending an electronic message (e-mail) to the email address posted on the company’s official website (anonymity was guaranteed).
The questionnaire was divided into two sections:
(a)
The first part included questions about the profile and general information about the company.
(b)
The second part consisted of questions related to the export activity of the company, competitiveness, and advertising.

2.4. Statistical Analysis

The statistical analysis of the data was performed through the Excel spreadsheets (since the online questionnaire was designed through the Google platform), and the results could be taken immediately. One-way analysis of variance (ANOVA) was performed to the overall numerical data of the research questionnaires (%percentage) (independent variable) to indicate whether statistical differences could exist between the studied groups/questions (factor variable) at the confidence level p < 0.05. Tukey’s multiple comparison tests were carried out to test the statistical differences (p < 0.05) between pairs of the studied variables. Error bars represented differences at the confidence level p < 0.05. Statistical analysis was performed using the SPSS software (v.28, 2021, IBM, Armonk, NY, USA).

3. Results

3.1. Consumers’ Data

The first part of the study consisted of consumers’ data. Table 1 shows some basic characteristics of the participants, including gender and age. In total, 994 participants responded to the e-survey.
The sample consisted of more females (68.6%) than males (31.3%), indicating significant differences (p < 0.001). Most of the participants belonged to the age group of 18–25 (63.9%), followed by the age group of 26–35 (13%), 36–45 (13.1%), 46–55 (6.4%), and 55+ (3.6%). In most cases, significant differences were observed between the age group of the participants (p < 0.001) except the group age of 26–35 and 36–45 (p = 0.976).
Most of the participants stated that they prefer wine more than other alcoholic beverages (p < 0.001)(Table 2). Beer consumption is situated in the 2nd place, and in the 3rd place is situated tsipouro. Finally, a considerable number of participants (18.9%) prefer other alcoholic beverages. The vast majority of the participants reported consuming 1–2 times a week (41.2%) (p < 0.001). A grand percentage (33.9%) also consumes 1–2 times a month (p < 0.001. Regarding the color of the wine, red wine is in the first place of preference, followed by white wine and then the rosé/blush (p < 0.001). Regarding sweetness, semi-sweet stands out in consumer preferences with a percentage of 57.8%, followed by dry at 33.5%, sparkling at 16.1%, sweet at 11.8% and finally semi-dry at 11.2% (p < 0.001 to p < 0.004, respectively). The Greek wine consumers who participated in the e-survey buy particularly bottled wine (p < 0.001). Table 3 lists some other preference information of the participants conveyed in this survey.
Most of the participants started consuming wine under the age of 18 (55.3%) or at the age of 18–25 (39.2%) (p < 0.001). Most of them are willing to spend under 10 Euro (49.5%) and between 10–20 Euro (43.3%) for bottled wine (p < 0.001). The supermarkets are preferred most (59.8%) for purchasing wine and the liquor stores (46.4%) rather than other alternatives. What is worth mentioning is that 24.2% of the participants buy wine from a friend-known winemaker (p < 0.001). Although the sample consisted of many young people, and we are in the generation of e-commerce, the internet as a tool for purchasing wine is not mainly used.
Generally, people may sometimes buy wine for a special occasion, such as a dinner with friends or a celebration. Moreover, 77.4% of the participants also choose a bottle of wine as a gift (p < 0.001). Most of the participants are loyal to Greek wines (p < 0.001).
Figure 1 shows which of the following characteristics of bottled wine are important for consumers (decisive factors) when they want to make a purchase decision regarding bottled wine.
Consumers make their purchasing decisions based on several factors when they are in a marketplace. For the participants, what is more important was the taste of the wine (79.1%), the price (56.6%), the color (34.1%) and the odor (31.6%). The least significant for the participants was the shape of the bottle (6.2%), the label (8.9%), and the alcoholic degree (12.2%).
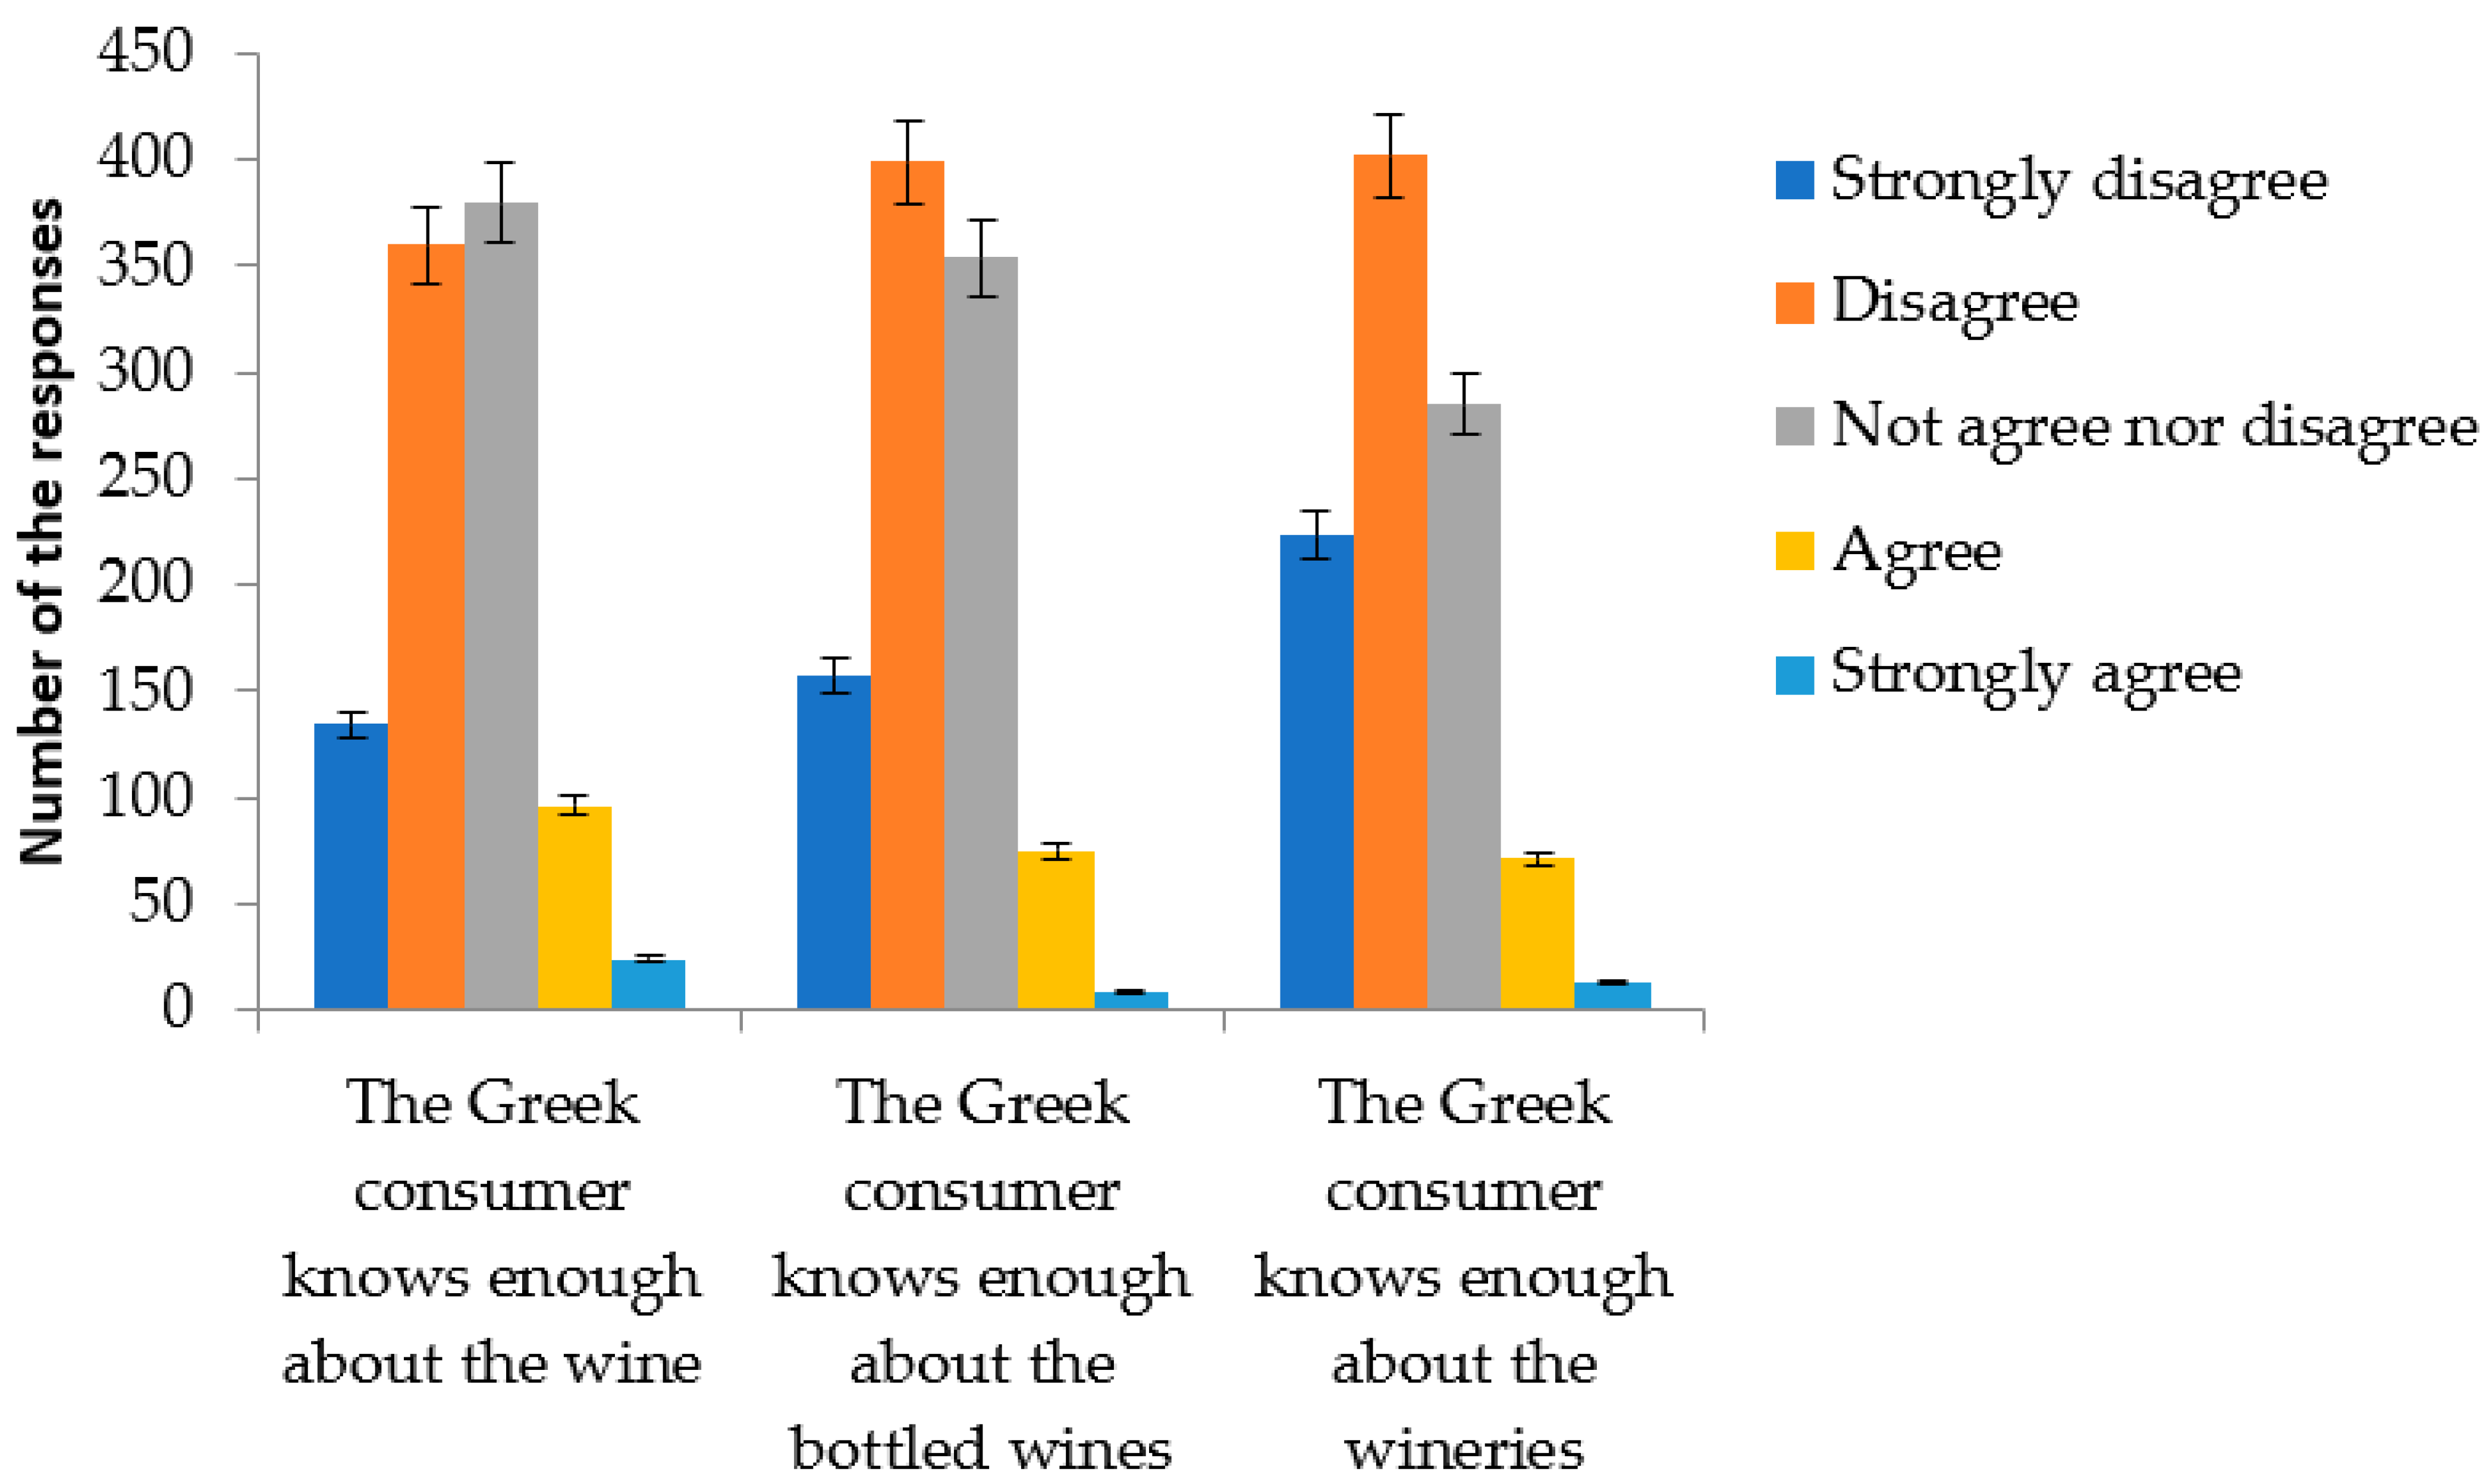
During the e-survey, the participants were also asked to agree or disagree with some statements regarding the knowledge of wine, bottled wine or wineries in Greece (Figure 2).
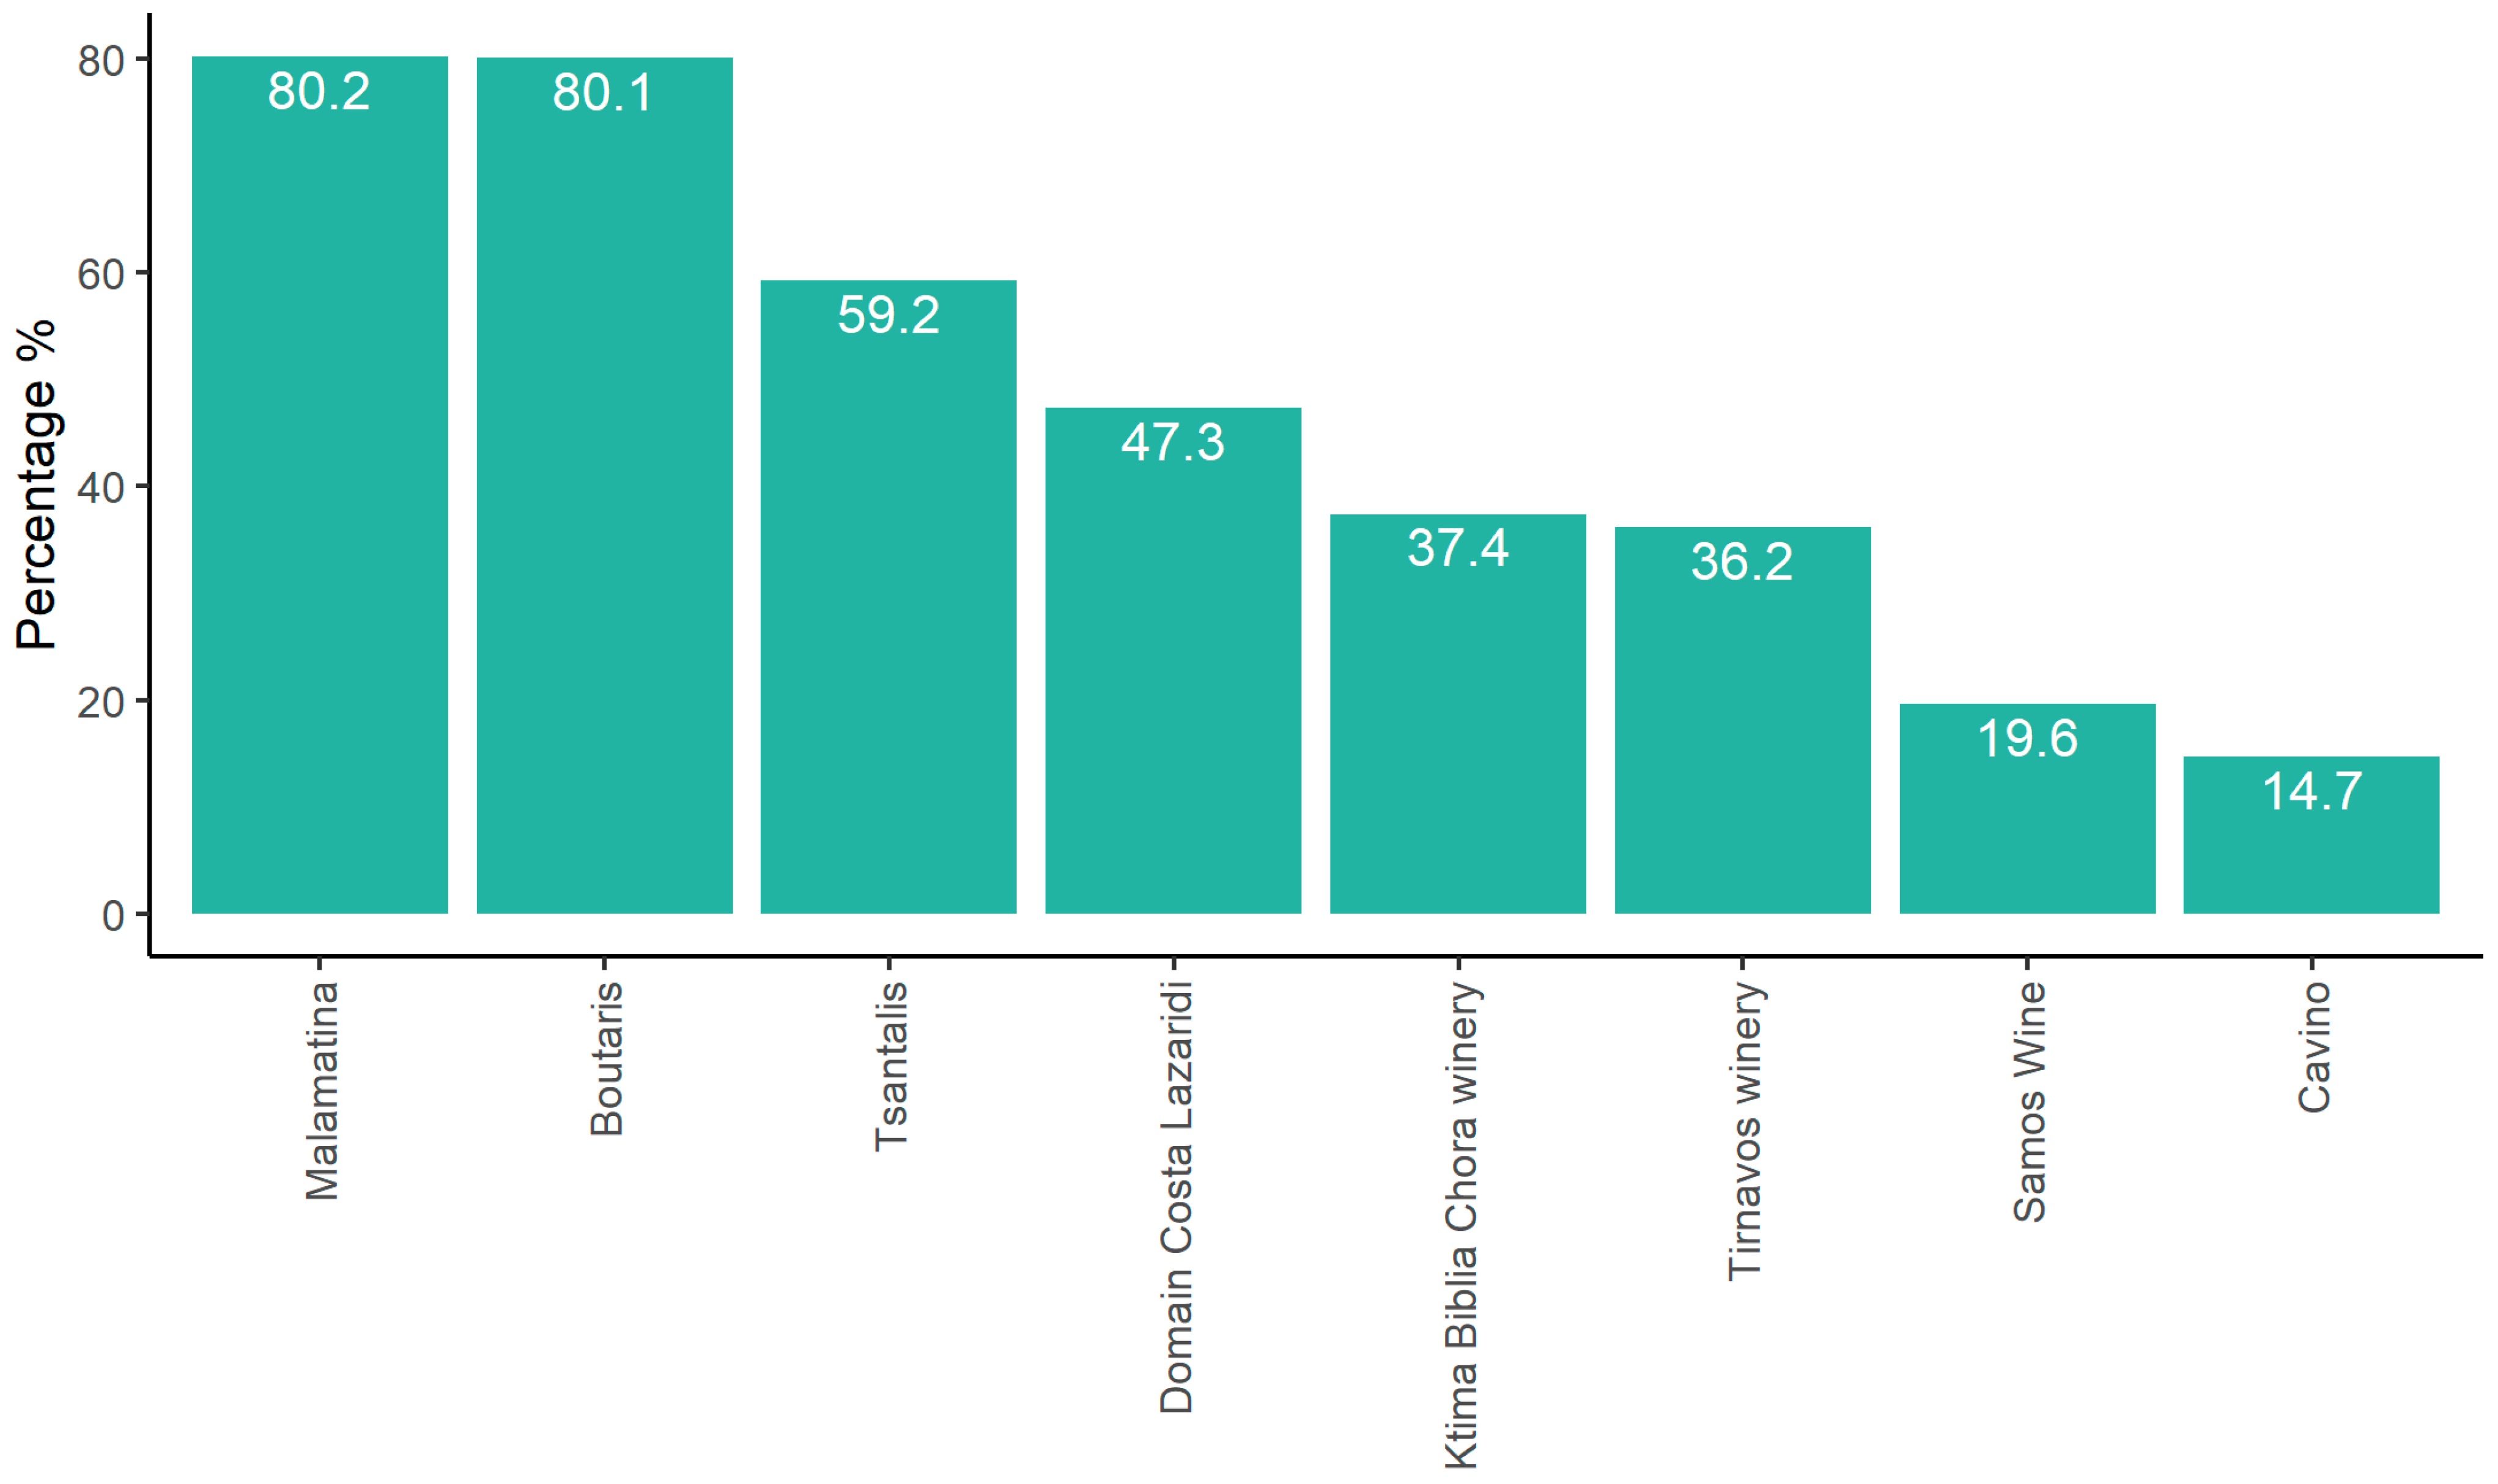
Results showed that most of the participants disagreed with the statement that Greek consumers know enough about wineries and bottled wines. The participants did not agree or disagree with the statement that Greek consumers know enough about wine in general. Then, the participants were asked to respond to which wineries they know between some established Greek wine producers (Figure 3).

3.2. Wineries Data

The second part of the study consisted of a second questionnaire that was built to take a deep look at Greek wine companies. The purpose was to investigate not only the profile of the wineries but also to study their international extroversion. A questionnaire was designed to take all the necessary information about their export activity. A total of 71 wineries participated in the current study. The sample consisted of large, medium and small (local) firms/wineries and associations of agricultural cooperatives. The profile and general information about the wineries (location/geographic area) are represented in Table 4.
The majority of the wineries companies are located in South Macedonia (23.94%), Peloponnese (22.53%) and the Islands of the Aegean Sea (15.49%) (p < 0.001). Almost entirely, wineries were small-scale industries (local-family businesses) since the number of employees was within the range of 1–20 employees (80.2%) and 21–40 (9.9%) (p < 0.001). The number of large-scale companies was very few, with a long-standing presence in the wine sector. Almost all the wineries produce three types of wine (red, white and rosé/blush) [Table 4]. Regarding dryness, dry wine is produced by almost all Greek wine producers (98.59%), followed by semi-sweet (39.43%) and sweet wine (36.61%). The sparkling one is not widely produced (9.85%) (p < 0.001). The larger part of the wineries produces either only bottled or bottled bulk wine. As for the distribution of their wines, the companies, except from their production area (winery, 81.69%), answered that the liquor stores (97.18%) and the supermarkets (56.33%) comprise an alternative option (p < 0.001). The Internet (as e-commerce exists at a very high level) is not very frequently used (28.16%) (p < 0.001).
Regarding wine tourism and cultural knowledge, 81.69% of the wineries are open to the public, and an individual or group of people can visit them. A percentage of 57.74% of the wineries produce only bottled wines, and 42.25% of them produce both bottled and bulk wine (p < 0.001). Regarding the amount of annual production, many of the wineries produce more than 100.000 bottles of wine (46.47%) and between 10.000–50.000 bottles (32.39%) (p < 0.001).
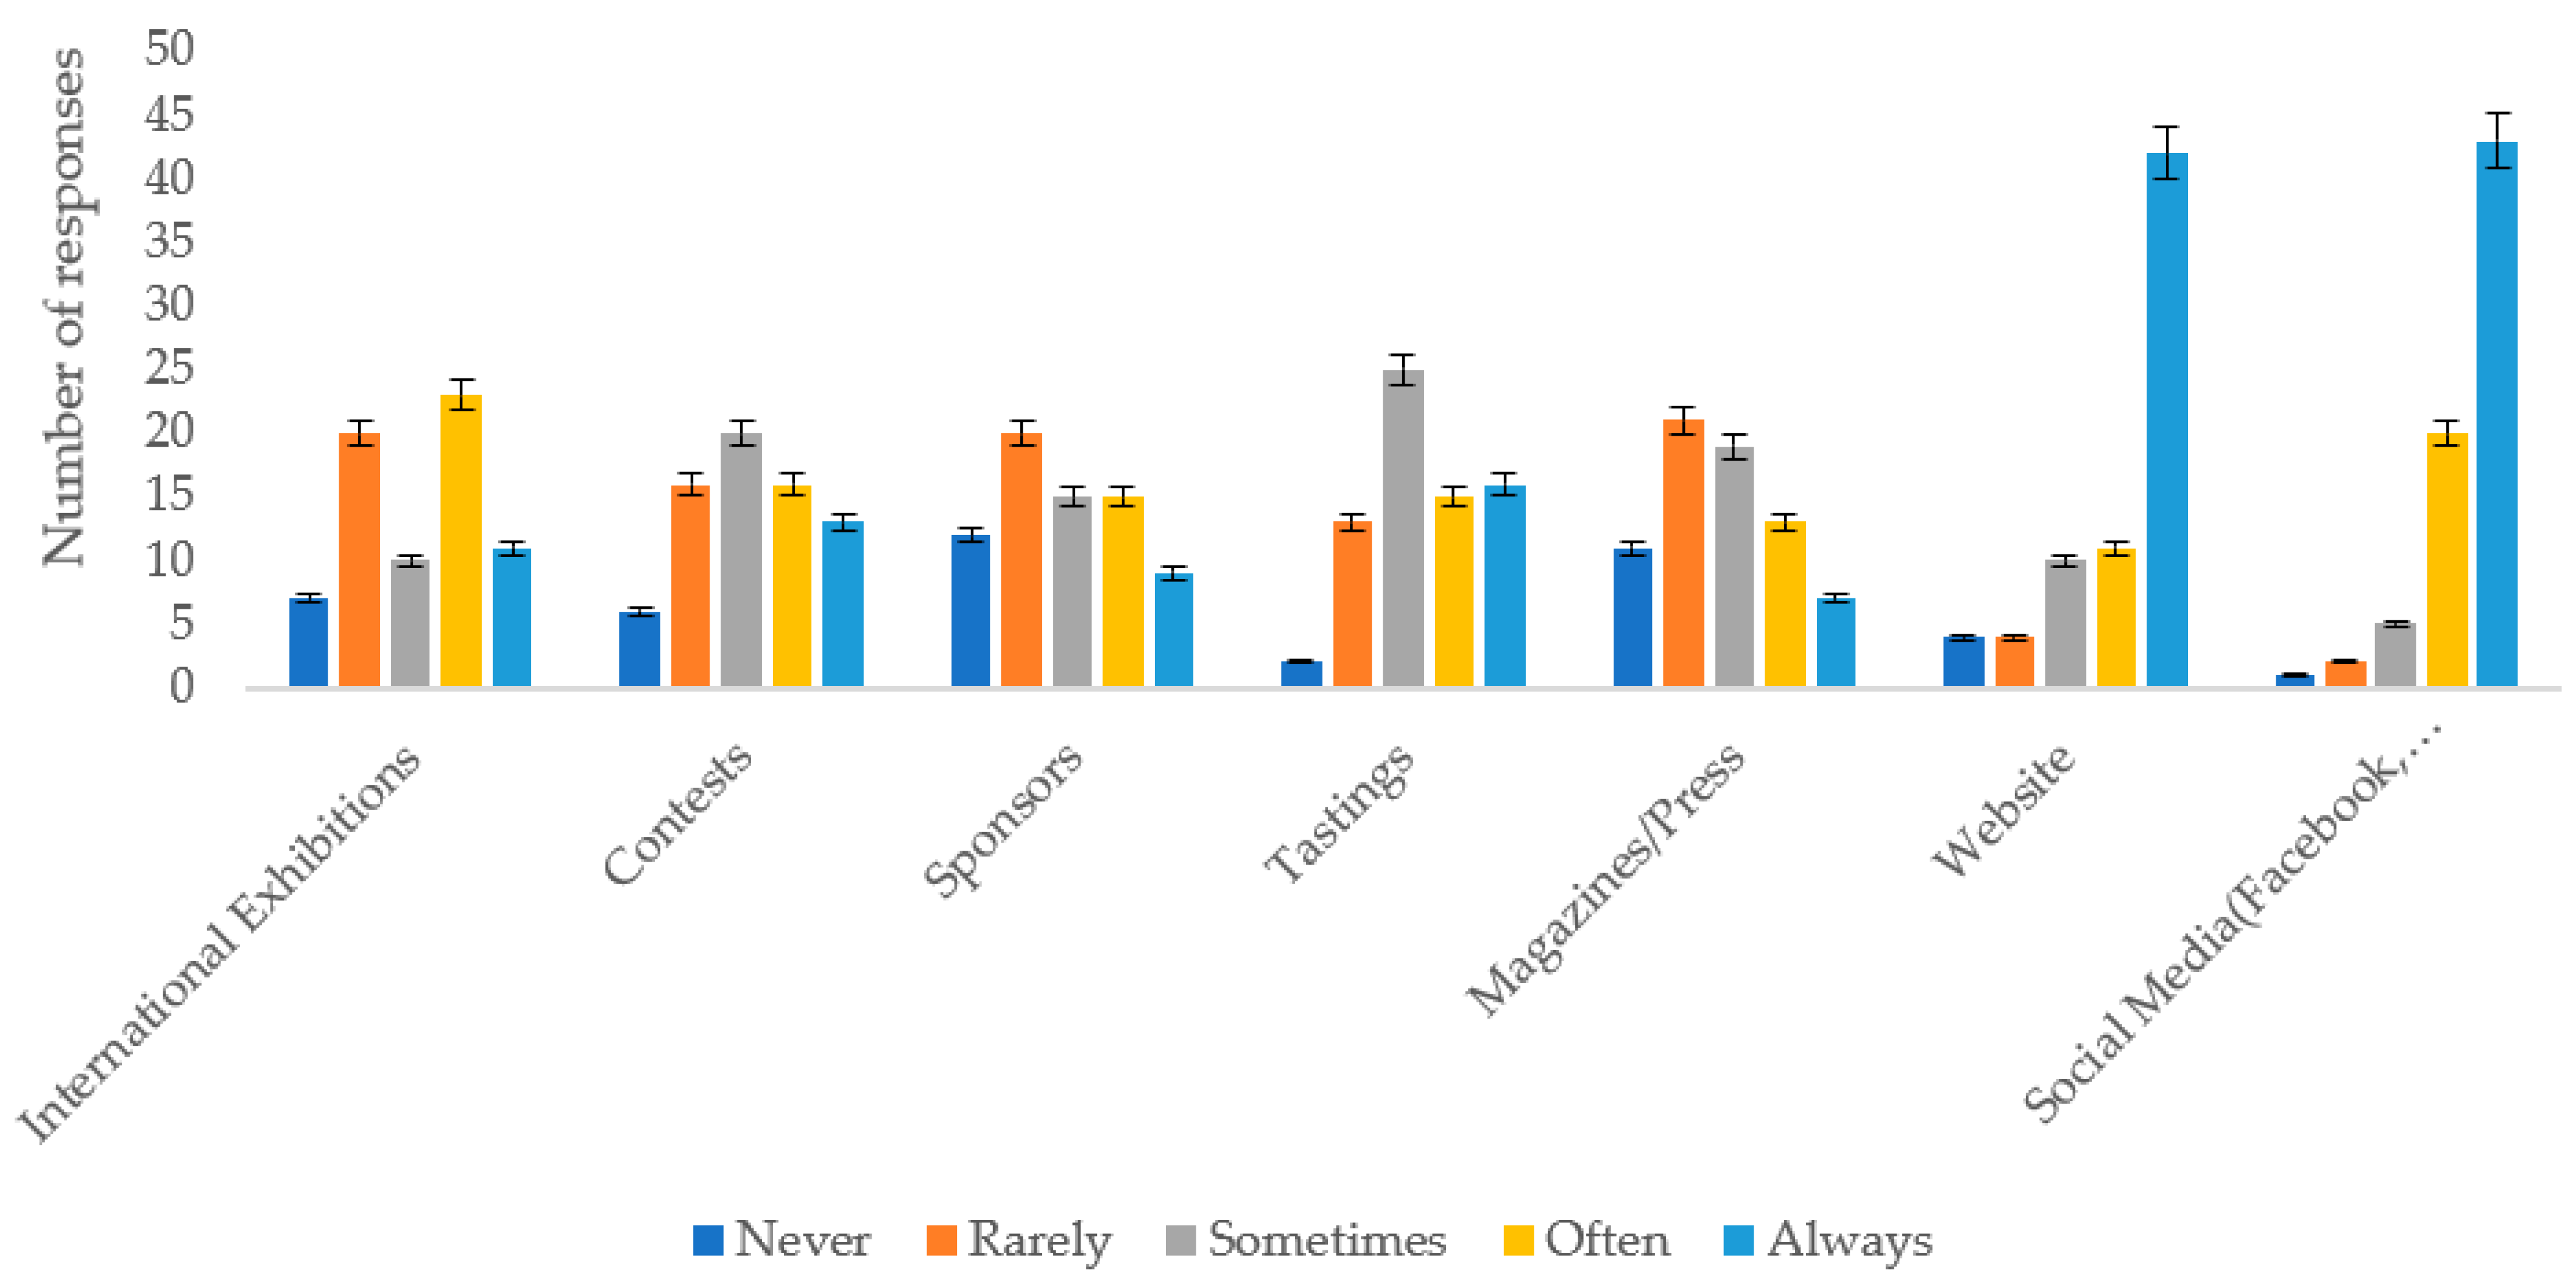
Another important question that was set was the tool of wine promotion. Figure 4 shows significant differences in the tools used considering international exhibitions, contests, sponsors, tastings, magazines, press, websites and social media networks. As for the frequency of the means of promotion that are used, most of the wineries use sponsors and the magazines/press rarely, the contests and the tastings sometimes, the international exhibitions more often and the website on the internet and social media almost always (Figure 4).
The wine companies were asked to answer how much the sales were influenced after the economic crisis in Greece on a 5 points scale: 1 = not at all, 2 = slightly, 3 = moderate, 4 = very, 5 = extremely). Most of the participants stated that their sales declined from not at all to moderately (Table 5).
As we can see, 60 of the 71 wineries export their products (p < 0.001) (Table 6). So, 84.5% of the wineries in Greece export their products. The proportion of the annual production destined each year for exports was between 1–20% and 21–40% for most of the wine companies. The duration of their export activities was between 0–5 years and 6–10 years. Concerning the number of different countries that the wine companies export to, most of the participants stated that they export between 1–5 (45%) and 6–10 (35%). The main countries that the Greek wine companies export are Germany (65%), the USA (63.3%), Canada (36.66%), the UK (16.66%), and Belgium (15%). Another relevant question that the wineries should reply to was the importance of specific objectives (increasing market share, value for money, market penetration with an attractive value, and the display of high-value products) to the firm’s foreign pricing strategy.
As we can see in Figure 5, the value for money and the display of high value are important, the increasing market share is moderately important to important, and the market penetration is hardly important for the Greek wineries concerning the firm’s foreign pricing strategy.

4. Discussion

A higher rate for female participants was observed at 68.6% (p < 0.001), similar to the reports of other studies [55,56,57,58,59], leading to the conclusion that women respond more willingly to food-related surveys as they are primarily involved in household organization. Moreover, most of the participants were young, at the age of 18–25 (p < 0.001), which gives a better perspective and value to the results obtained since the participation in questionnaires of the new generation shows probably more clear the trends of the future.
A percentage of 70.5% of the participants reported that their first choice of alcoholic beverages is wine. Even though the participants had the possibility to choose more than one of their favorite beverages, the predominant choice was the wine. According to the type of wine, most responders preferred red wine, followed by white and rose/blush.
More than half of the participants answered that semi-sweet wines are their first preference, followed by dry. Previous studies with also a higher number of female participants than men reported similar results, leading to the conclusion that the higher rate of semi-sweet wines is probably correlated with women’s preferences [59]. Furthermore, participants had to choose between bottled and bulk wine, where bottled wine was most preferable (p < 0.001) because the bulk packaging is probably considered as a low-quality wine.
The largest percentage of those who responded to the survey were familiar with the consumption of wine from an early age, since 55.3% of them started consuming wine before the age of 18. Even though the consumption of alcoholic beverages is generally forbidden under the age of 18 in Greece, the younger people who participated in the survey have consumed wine at least once before the age of 18.
Most of the participants answered that it was more likely to purchase wine from a supermarket, in agreement with a previous study [60], because supermarkets are accessible, easy to find and give the possibility to combine food with wine. Previous studies reported that many people accompany wine with meat, fish or nuts, while none of them preferred to consume it plain [59]. It is worth mentioning that 24.2% of Greek consumers purchase wine from winemaker friends who produce a limited production of wine. That means that consumers have a close relationship with the producer as a chance for a better price and a guarantee for the quality of the product. Regarding the question of whether they would offer wine as a gift, 77.4% responded positively (p < 0.001). This finding shows that wine is not only an alcoholic beverage but also a means of socialization and involvement. Previous studies have also reported that many people drink wine for socializing motivation [61]. From the current survey, Greek consumers prefer traditional and local wines rather than imported and foreign ones. Wine is a food product inextricably linked with the territory and the place of origin.
Finally, participants had to choose among many different factors and properties that determine the purchasing decision. Most of the respondents (79%) declared that the taste of wine is the most important factor, followed by price (56.1%) and color (34.1%) (p < 0.001). Previous studies obtained very similar results, with the taste holding 94.5% and the price at 53.1% of the overall percentage [59]. This means that apart from the cost of the wine, which is an important factor, the physicochemical and qualitative characteristics play a crucial role. According to these results, the sensory properties of wine comprise a major parameter that will determine its success among consumers, in agreement with previous studies in the literature [59].
Regarding the second questionnaire, the majority of the wineries that participated were small companies with a workforce of approximately 10 people. The wineries produced mainly dry, red or white bottled wine. The distribution of their product was carried out in liquor stores and in the wineries, not that much in supermarkets, which are preferable to the consumers. E-commerce is not in high regard either for the producers or for the consumers. The majority of Greek wine companies, as a part of the engagement with the territory, are open to visitors giving the possibility to consumers to reach the place of production. In order to expand their public market, the usage of websites and social media is frequent. Despite the general economic downturn, the wine industry is not that much affected and continues to thrive.
As for the export profile of the wineries, the majority of them are active not only at the domestic but also at international level. In fact, most of them export an important amount of their annual production (about 1–40%) to 1–10 countries, such as Germany, the USA, and Canada, which are countries with dynamic market growth. For the Greek wine industry, the exhibition of high-value products is the most important strategic objective for their foreign presentation.

5. Limitations and Strengths

Although this method of sampling was chosen for convenience, the findings apply to the characteristics of the sample, whereas generalization to the overall population is highly speculative. Additionally, the wine market in Greece has been improving gradually; therefore, the results of this research will not be valid for a long time but may represent a solid basis for future research. Another limitation is the type of surveying technique, which creates a self-selection bias limiting the representativeness of respondents’ behavior and preferences. Even though the number of responses obtained in the study is considered adequate, more women and young people between the ages of 18–25 participated in the survey. Furthermore, job, income, marital status, hometown, education and other information were not included. In addition, the number of wineries participating is considered somehow limited.
Apart from the limitations mentioned above, we should stress that there is no other report in the recent literature with the material presented herein, constituting, thus, the novelty of the current work. The importance of this study is also linked to society and to the formation of policies on this topic. In addition, the present study may provide an opportunity for further research on the extrovert performance of the green wine industry and the factors that led to this and might be of interest to the wine sector or research at a domestic or international level. Indeed, the wine industry is a sector with a bright future. Even though the wine industry in the last years has been going through a serious economic crisis, it continues to be active not only domestically but also globally.

6. Conclusions and Future Directions

The present study aimed to (a) monitor the Greek consumers’ behavior, preferences and habits regarding wine in comparison with other alcoholic beverages; (b) provide knowledge for some wineries located in different areas of Greece by taking into account some basic demographic information, preferences and operational data using an electronic survey (e-survey) conducted by 994 participants and 71 wineries.
Summarizing the results of the study, wine is consumed more than other alcoholic beverages on a weekly frequency. Red and semi-sweet bottled wine is preferred most. The quality of wine, the cost, the color, the odor and the origin are the most important factors for Greek wine consumers.
The constant change in the wine sector demands a continuous effort and willingness to follow the trades and preferences of consumers/traders. The wineries produce mainly dry, red and white bottled wine. Wine exports continue to be carried out in large percentages. Most wineries participate in wine tourism activities with dynamic prospects for improvement. Internet and social media lately are important tools for the attraction of new consumers with aiming at value for money and good quality product.
Despite the contribution of our findings in the literature, further studies are essential. Future research should thus target a fully representative sample including other characteristics such as income, education level, level of experience/involvement, and a higher number of wineries’ participation.

Author Contributions

Conceptualization, D.S., Y.C. and I.K.K.; methodology, D.S. and Y.C.; software, D.S. and Y.C.; validation, I.K.K.; formal analysis, D.S. and Y.C.; investigation, D.S., Y.C. and I.K.K.; resources, I.K.K.; data curation, D.S., Y.C. and I.K.K.; writing—original draft preparation, D.S.; writing—review and editing, I.K.K.; visualization, D.S., Y.C. and I.K.K.; supervision, I.K.K.; project administration, I.K.K.; funding acquisition, I.K.K. All authors have read and agreed to the published version of the manuscript.

Funding

This research received no external funding. This work has been partially financed by the funding programme “MEDICUS”-F.K. 81908 of the University of Patras MODY ELKE, https://research.upatras.gr (accessed on 14 April 2023).

Data Availability Statement

Data from this study will be available upon request.

Acknowledgments

The authors would like to thank the unknown consumers and the wineries that participated in the e-survey. All individuals included in this section have consented to the acknowledgement.

Conflicts of Interest

The authors declare no conflict of interest.

Notes

1
Greek alcoholic beverage produced by distillation of the residual from winemaking, mostly the marc. Tsipouro is bottled after dilution with water to obtain a product of alcohol content between 37.5% and 50% vol. [51].
2
Greek anise-flavored alcoholic beverage produced by distillation of grapes containing with 40–50% alcohol by volume [52].
3
Resinated wine with the use of resin as additive mainly from Aleppo pine resin. Retsina follows the same winemaking technique of white or rose [53].
4
Spirit produced by double distillation of suma or suma mixed with agricultural-based ethanol and flavored with aniseed (Pimpinella anisum). Suma is produced mainly from raisins, molasses and/or grape must and is a distillate with a maximum 94.5% ethanol content [54].

References

  1. McGovern, P.E.; Fleming, S.J.; Katz, S.H. (Eds.) The Origins and Ancient History of Wine (Food and Nutrition in History and Anthropology Series No. 11); Routledge: London, UK; New York, NY, USA, 2003. [Google Scholar]
  2. Ridley, W.; Luckstead, J.; Devadoss, S. Wine: The Punching Bag in Trade Retaliation. Food Policy 2022, 109, 102250. [Google Scholar] [CrossRef]
  3. Sáenz-Navajas, M.P.; Avizcuri, J.M.; Ballester, J.; Fernández-Zurbano, P.; Ferreira, V.; Peyron, D.; Valentin, D. Sensory-Active Compounds Influencing Wine Experts’ and Consumers’ Perception of Red Wine Intrinsic Quality. LWT 2015, 60, 400–411. [Google Scholar] [CrossRef]
  4. Sáenz-Navajas, M.P.; Campo, E.; Sutan, A.; Ballester, J.; Valentin, D. Perception of Wine Quality According to Extrinsic Cues: The Case of Burgundy Wine Consumers. Food Qual. Prefer. 2013, 27, 44–53. [Google Scholar] [CrossRef]
  5. Schäufele, I.; Hamm, U. Organic wine purchase behaviour in Germany: Exploring the attitude-behaviour-gap with data from a household panel. Food Qual. Prefer. 2017, 63, 1–11. [Google Scholar] [CrossRef]
  6. Gil, J.M.; Sánchez, M. Consumer Preferences for Wine Attributes: A Conjoint Approach. Br. Food J. 1997, 99, 3–11. [Google Scholar] [CrossRef]
  7. Hoffmann, C.A. When Consumers Buy Wine, What Factors Decide the Final Purchase? Aust. N. Z. Wine Ind. J. 2004, 19, 82–91. [Google Scholar]
  8. Maicas, S.; Mateo, J.J. Sustainability of Wine Production. Sustainability 2020, 12, 559. [Google Scholar] [CrossRef]
  9. Bruwer, J.; Saliba, A.; Miller, B. Consumer behaviour and sensory preference differences: Implications for wine product marketing. J. Consum. Mark. 2011, 28, 5–18. [Google Scholar] [CrossRef]
  10. Jennings, D.; Wood, C. Wine: Achieving Competitive Advantage Through Design. Int. J. Wine Mark. 1994, 6, 49–61. [Google Scholar] [CrossRef]
  11. Moscovici, D.; Rezwanul, R.; Mihailescu, R.; Gow, J.; Ugaglia, A.A.; Valenzuela, L.; Rinaldi, A. Preferences for eco certified wines in the United States. Int. J. Wine Bus. Res. 2020, 33, 153–175. [Google Scholar] [CrossRef]
  12. Mueller, S.; Szolnoki, G. The relative influence of packaging, labelling, branding and sensory attributes on liking and purchase intent: Consumers differ in their responsiveness. Food Qual. Prefer. 2010, 21, 774–783. [Google Scholar] [CrossRef]
  13. Zamzami, L.; Andrini, A.; Budiyati, E. Consumer preferences for a new variety of grapes (Vitis vinifera) paras 61. Ann. Biol. 2020, 36, 159–162. [Google Scholar]
  14. Famularo, B.; Bruwer, J.; Li, E. Region of origin as choice factor: Wine knowledge and wine tourism involvement influence. Int. J. Wine Bus Res. 2010, 22, 362–385. [Google Scholar] [CrossRef]
  15. Galli, F.; Boger, C.A.; Taylor, D.C. Rethinking luxury for segmentation and brand strategy: The semiotic square and identity prism model for fine wines. Beverages 2019, 5, 26. [Google Scholar] [CrossRef]
  16. Orth, U.R.; Malkewitz, K. Holistic package design and consumer brand impressions. J. Mark. 2008, 72, 64–81. [Google Scholar] [CrossRef]
  17. Boudreaux, C.A.; Palmer, S. A charming little cabernet: Effects of wine label design on purchase intent and brand personality. Int. J. Wine Bus. Res. 2007, 19, 170–186. [Google Scholar] [CrossRef]
  18. Barber, N.; Almanza, B.A. Influence of wine packaging on consumers’ decision to purchase. J. Foodserv. Bus. Res. 2006, 9, 83–98. [Google Scholar] [CrossRef]
  19. Mitchell, V.W.; Greatorex, M. Risk reducing strategies used in the purchase of wine in the UK. Eur. J. Mark. 1989, 23, 31–46. [Google Scholar] [CrossRef]
  20. Taylor, R.L.; Rao, C.P. The Combined Effects of Brand and Store Reputation on Consumer Perceived Risk and Confidence. In Proceedings of the 1983 Academy of Marketing Science (AMS) Annual Conference; Springer International Publishing: New York City, NY, USA, 2015; pp. 117–121. [Google Scholar] [CrossRef]
  21. Dash, J.F.; Schiffman, L.G.; Berenson, C. Risk- and Personality-Related Dimensions of Store Choice. J. Mark. 1976, 40, 32. [Google Scholar] [CrossRef]
  22. Skuras, D.; Vakrou, A. Consumers’ willingness to pay for origin labelled wine: A Greek case study. Br. Food J. 2002, 104, 898–912. [Google Scholar] [CrossRef]
  23. Caracciolo, F.; Di Vita, G.; Lanfranchi, M.; D’Amico, M. Determinants of sicilian wine consumption: Evidence from a binary response model. Am. J. Appl. Sci. 2015, 12, 794–801. [Google Scholar] [CrossRef]
  24. Martinez, L.M.-C.; Molla-Bauza, M.M.-B.; Gomis, F.J.D.C.; Poveda, A.M. Influence of purchase place and consumption frequency over quality wine preferences. Food Qual. Prefer. 2006, 17, 315–327. [Google Scholar] [CrossRef]
  25. Lockshin, L.; Jarvis, W.; d’Hauteville, F.; Perrouty, J.P. Using simulations from discrete choice experiments to measure consumer sensitivity to brand, region, price, and awards in wine choice. Food Qual. Prefer. 2006, 17, 166–178. [Google Scholar] [CrossRef]
  26. Gluckman, R.L. A Consumer Approach to Branded Wines. Eur. J. Mark. 1986, 20, 21–35. [Google Scholar] [CrossRef]
  27. Bruwer, J.; Li, E.; Reid, M. Segmentation of the Australian Wine Market Using a Wine-Related Lifestyle Approach. J. Wine Res. 2002, 13, 217–242. [Google Scholar] [CrossRef]
  28. Capitello, R.; Sirieix, L. Consumers’ perceptions of sustainable wine: An exploratory study in France and Italy. Economies 2019, 7, 33. [Google Scholar] [CrossRef]
  29. D’Amico, M.; Di Vita, G.; Monaco, L. Exploring environmental consciousness and consumer preferences for organic wines without sulfites. J. Clean Prod. 2016, 120, 64–71. [Google Scholar] [CrossRef]
  30. Dominici, A.; Boncinelli, F.; Gerini, F.; Marone, E. Consumer preference for wine from hand-harvested grapes. Br. Food J. 2020, 122, 2551–2567. [Google Scholar] [CrossRef]
  31. Stanco, M.; Lerro, M.; Marotta, G. Consumers’ preferences for wine attributes: A best-worst scaling analysis. Sustainability 2020, 12, 2819. [Google Scholar] [CrossRef]
  32. Brunner, T.A.; Siegrist, M. A consumer-oriented segmentation study in the Swiss wine market. Br. Food J. 2011, 113, 353–373. [Google Scholar] [CrossRef]
  33. D’Amico, M.; Di Vita, G.; Chinnici, G.; Pappalardo, G.; Pecorino, B. Short food supply chain and locally produced wines: Factors affecting consumer behavior. Ital. J. Food Sci. 2014, 26, 329–334. Available online: https://hdl.handle.net/2318/1691587 (accessed on 25 March 2019).
  34. D’Amico, M.; Di Vita, G.; Bracco, S. Direct sale of agro-food product: The case of wine in Italy. Qual.-Access Success. 2014, 15, 247–253. [Google Scholar]
  35. Chrysochou, P.; Corsi, A.M.; Krystallis, A. What drives Greek consumer preferences for cask wine? Br. Food J. 2012, 114, 1072–1084. [Google Scholar] [CrossRef]
  36. Botonaki, A.; Tsakiridou, E. Consumer response evaluation of a greek quality wine. Food Econ. Acta Agric. Scand. Sect. C 2004, 1, 91–98. [Google Scholar] [CrossRef]
  37. Fotopoulos, C.; Krystallis, A.; Ness, M. Wine produced by organic grapes in Greece: Using means—End chains analysis to reveal organic buyers’ purchasing motives in comparison to the non-buyers. Food Qual Prefer. 2003, 14, 549–566. [Google Scholar] [CrossRef]
  38. International Organisation of Vine and Wine (OIV). Statistical Report on World Vitiviniculture. Available online: http://www.oiv.int/public/medias/6371/oiv-statistical-report-on-world-vitiviniculture-2018.pdf (accessed on 7 February 2023).
  39. Tsiakis, T.; Anagnostou, E.; Granata, G.; Manakou, V. Communicating Terroir through Wine Label Toponymy Greek Wineries Practice. Sustainability 2022, 14, 6067. [Google Scholar] [CrossRef]
  40. Georgiou, T.; Vrontis, D. Wine Sector Development: A Conceptual Framework Toward Succession Effectiveness in Family Wineries. J. Transnatl. Manag. 2013, 18, 246–272. [Google Scholar] [CrossRef]
  41. Charters, S.; Fountain, J. Younger Wine Tourists: A Study of Generational Differences in the Cellar Door Experience. In Global Wine Tourism: Research, Management and Marketing; Cabi: Wallingford UK, 2006; pp. 153–160. [Google Scholar] [CrossRef]
  42. Koutroupi, E.; Natos, D.; Karelakis, C. Assessing Exports Market Dynamics: The Case of Greek Wine Exports. Procedia Econ Financ. 2015, 19, 184–192. [Google Scholar] [CrossRef]
  43. Global Agricultual Information Network. Wine Annual Report and Statistics; USDA Foreign Agricultural Service: Washington, DC, USA, 2012.
  44. Bruwer, J.; Alant, K. The Hedonic Nature of Wine Tourism Consumption: An Experiential View. Int. J. Wine Bus. Res. 2009, 21, 235–257. [Google Scholar] [CrossRef]
  45. Vinography. Social Media and the Wine Industry: A New Era. Available online: https://www.vinography.com/2012/02/social_media_and_the_wine_indu (accessed on 7 February 2023).
  46. Palmieri, N.; Perito, M.A. Consumers’ willingness to consume sustainable and local wine in Italy. Ital. J. Food Sci. 2020, 32, 222–233. [Google Scholar] [CrossRef]
  47. Nunes, F.; Madureira, T.; Oliveira, J.V.; Madureira, H. The consumer trail: Applying best-worst scaling to classical wine attributes. Wine Econ Policy 2016, 5, 78–86. [Google Scholar] [CrossRef]
  48. Palmieri, N.; Perito, M.A.; Macrì, M.C.; Lupi, C. Exploring consumers’ willingness to eat insects in Italy. Br. Food J. 2019, 121, 2937–2950. [Google Scholar] [CrossRef]
  49. Palmieri, N.; Suardi, A.; Pari, L. Italian Consumers’ Willingness to Pay for Eucalyptus Firewood. Sustainability 2020, 12, 2629. [Google Scholar] [CrossRef]
  50. Palmieri, N.; Perito, M.A.; Lupi, C. Consumer acceptance of cultured meat: Some hints from Italy. Br. Food J. 2020, 123, 109–123. [Google Scholar] [CrossRef]
  51. Apostolopoulou, A.A.; Flouros, A.I.; Demertzis, P.G.; Akrida-Demertzi, K. Differences in Concentration of Principal Volatile Constituents in Traditional Greek Distillates. Food Control 2005, 16, 157–164. [Google Scholar] [CrossRef]
  52. Tsarouhas, P.; Papachristos, I. Environmental Assessment of Ouzo Production in Greece: A Life Cycle Assessment Approach. Clean. Environ. Syst. 2021, 3, 100044. [Google Scholar] [CrossRef]
  53. Fujii, H.; Krausz, S.; Olmer, F.; Mathe, C.; Vieillescazes, C. Analysis of Organic Residues from the Châteaumeillant Oppidum (Cher, France) Using GC–MS. J. Cult. Herit. 2021, 51, 50–58. [Google Scholar] [CrossRef]
  54. Yucesoy, D.; Ozen, B. Authentication of a Turkish Traditional Aniseed Flavoured Distilled Spirit, Raki. Food Chem. 2013, 141, 1461–1465. [Google Scholar] [CrossRef]
  55. de Leeuw, A.; Valois, P.; Ajzen, I.; Schmidt, P. Using the theory of planned behavior to identify key beliefs underlying pro-environmental behavior in high-school students: Implications for educational interventions. J. Environ. Psychol. 2015, 42, 128–138. [Google Scholar] [CrossRef]
  56. Pappalardo, G.; Lusk, J.L. The role of beliefs in purchasing process of functional foods. Food Qual. Prefer. 2016, 53, 151–158. [Google Scholar] [CrossRef]
  57. Chinnici, G.; d’Amico, M.; Pecorino, B. A multivariate statistical analysis on the consumers of organic products. Br. Food J. 2002, 104, 187–199. [Google Scholar] [CrossRef]
  58. Giampietri, E.; Verneau, F.; del Giudice, T.; Carfora, V.; Finco, A. A Theory of Planned behaviour perspective for investigating the role of trust in consumer purchasing decision related to short food supply chains. Food Qual. Prefer. 2018, 64, 160–166. [Google Scholar] [CrossRef]
  59. Skalkos, D.; Roumeliotis, N.; Kosma, I.S.; Yiakoumettis, C.; Karantonis, H.C. The Impact of COVID-19 on Consumers’ Motives in Purchasing and Consuming Quality Greek Wine. Sustainability 2022, 14, 7769. [Google Scholar] [CrossRef]
  60. Němcová, J.; Staňková, P. Factors influencing consumer behaviour of Generation Y on the Czech wine market. E+M Èkon. A Manag. 2019, 22, 145–161. [Google Scholar] [CrossRef]
  61. Seyedimany, A.; Koksal, M.H. Segmentation of Turkish Wine Consumers Based on Generational Cohorts: An Exploratory Study. Sustainability 2022, 14, 3031. [Google Scholar] [CrossRef]
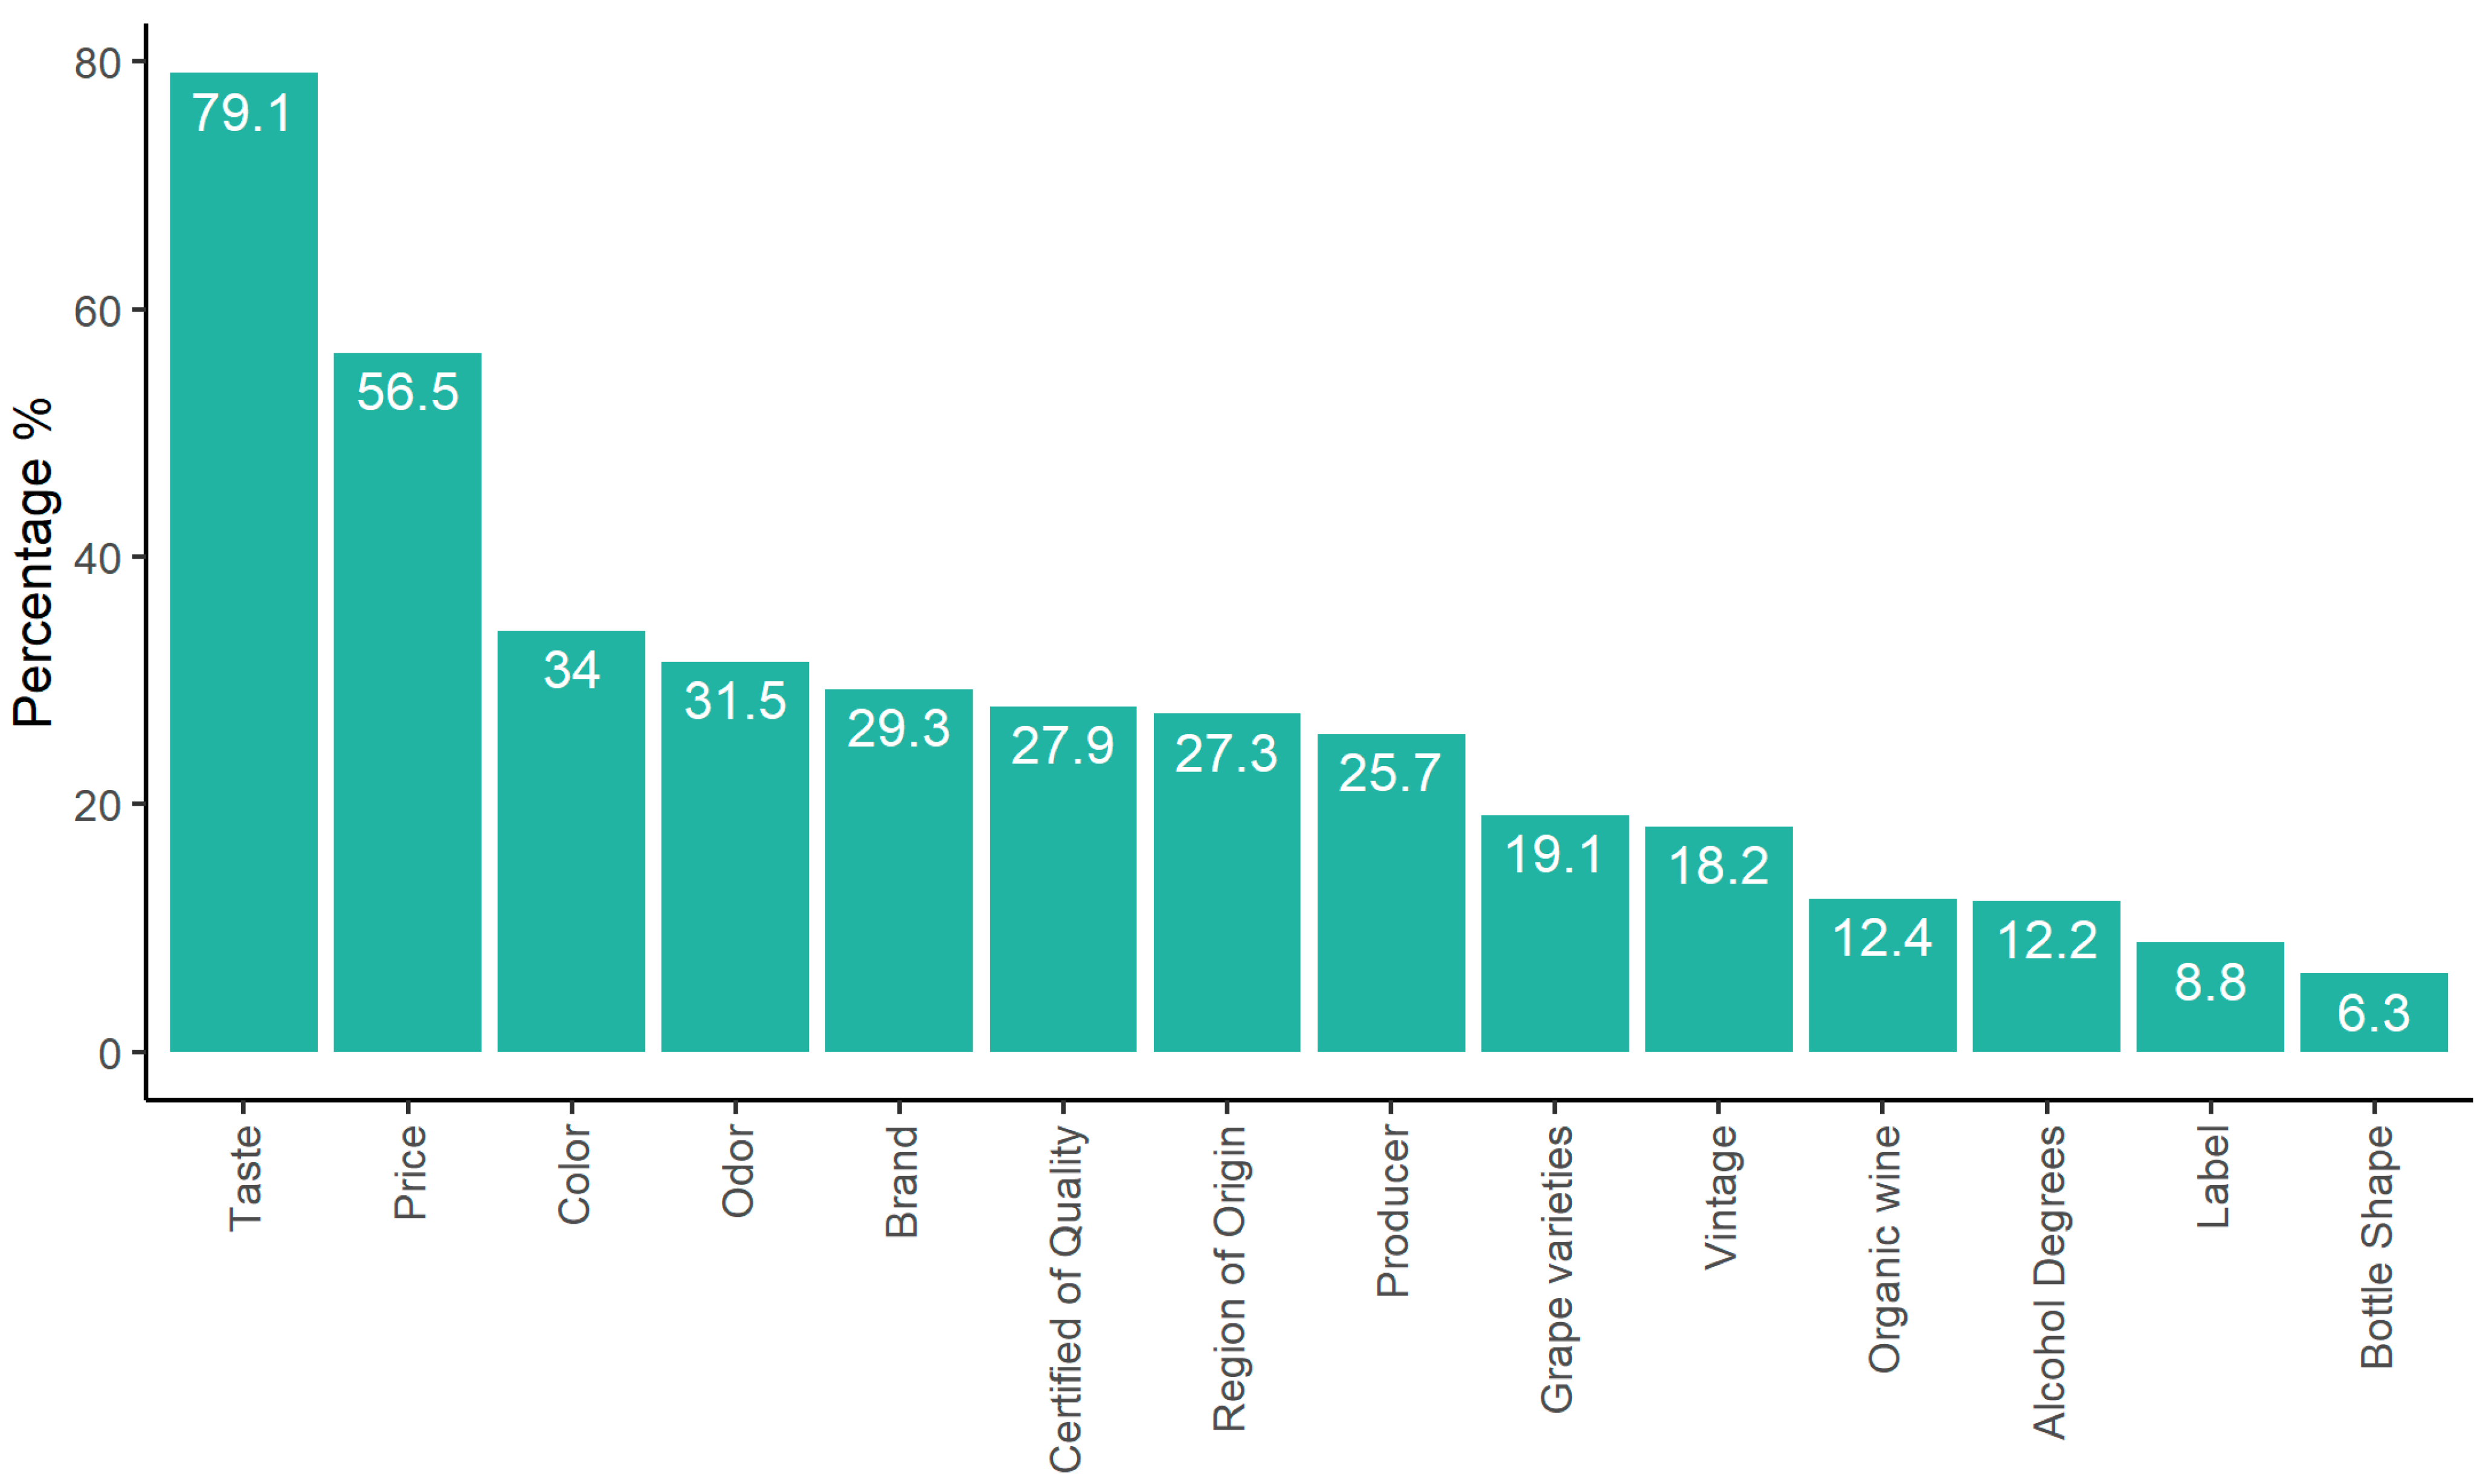
Figure 1. Decisive factors affecting the purchase of bottled wine.
Beverages 09 00043 g001
Figure 2. Knowledge of Greek consumers regarding wine, bottled wine or wineries located in Greece. Error bars represent statistically significant differences at the confidence level of p < 0.05.
Beverages 09 00043 g002
Figure 3. Knowledge of Greek consumers regarding some established wineries in different regions of Greece. Macedonia: South Macedonia.
Beverages 09 00043 g003
Figure 4. Means of promotion used for Greek wines. Error bars represent statistically significant differences at the confidence level of p < 0.05.
Beverages 09 00043 g004
Figure 5. Importance of specific objectives to the firm’s foreign pricing strategy. Error bars represent statistically significant differences at the confidence level of p < 0.05.
Beverages 09 00043 g005
Table 1. Demographic data of the participants (Ntotal = 994).
GroupsSample Size (N)Percentage (%)
GenderFemale68268.6
Male31231.3
Age18–2563563.9
26–3512913
36–4513013.1
46–55646.4
55+363.6
Table 2. Wine consumption behavior.
Sample Size (N)Percentage (%)
Which of the alcohol beverages do you prefer?
Wine70170.5
Beer42042.3
Tsipouro 119519.6
Other18818.9
Ouzo 212913
Retsina 311611.7
Raki 4676.7
How often do you consume wine?
1–2 times a week
1–2 times a month
410
338
41.3
33.9
Rarely22522.6
Daily202
Which type of wine do you prefer?
Red61361.7
White34034.2
Rose/Blush20020.1
Which type of wine do you prefer? (Including sweetness)
Semi-sweet57457.8
Dry33333.5
Sparkling16016.1
Sweet11711.8
Semi-dry11111.2
Do you prefer to buy bottled wine or not?
Bottled65966.3
Bulk33533.7
Table 3. Other preference information.
Sample Size (N)Percentage (%)
At what age did you start drinking wine?
Age
<1855055.3
18–2539039.2
>26545.5
How much do you spend for a bottled wine?
<10 Euro49249.5
11–20 Euro43043.3
21–30 Euro525.2
>30 Euro101.9
Where do you usually buy your wine?
Supermarket59459.8
Liquor stores46146.4
Known-friend winemaker24024.2
Winery949.5
Internet90.9
Do you choose bottled wine as a gift?
Yes76977.4
No22522.6
Do you prefer Greek or foreign wines?
Greek94294.8
Foreign626.2
Table 4. General information for the wineries that participated in the e-survey (Ntotal = 71).
Sample Size (N) Percentage (%)
Geographic region of the winery in Greece:
Macedonia (South Macedonia) 17 23.94
Peloponnese 16 22.51
Aegean islands 11 15.49
Central Greece 8 11.26
Crete 7 9.85
Thessaly 6 8.45
Ionian islands 3 4.22
Epirus 2 2.81
Thrace 1 1.4
How many employees do you employ?
1–10 57 80.28
11–40 7 9.85
41–60 4 5.63
61–80 2 2.8
81–100 0 0
>100 1 1.4
What type of wine do you produce?
White 70 98.59
Dry 70 98.59
Red 68 95.77
Rosé/Blush 66 92.95
Semi-sweet 28 39.43
Sweet 26 36.61
Semi-dry 20 28.16
Sparkling 7 9.85
Where do you sell your products in Greece?
Liquor stores 69 97.18
Winery 58 81.69
Supermarkets 40 56.33
Internet 20 28.16
Cooperatives 8 11.26
Other (Horeca, delegations) 1 1.4
Is your winery open to visitors?
Yes 58 81.69
No 13 18.3
How do you package your wine?
In bottles 41 57.74
Both 30 42.25
Bulk 0 0
What is the annual production in bottles?
>100,000 33 46.47
10,000–50,000 23 32.39
50,000–100,000 10 14.08
5000–10,000 4 5.63
0–2000
2000–5000
1
0
1.4
0
Table 5. The impact of the economic crisis on wine sales in Greece.
Scale1 = Not at all2 = Slightly3 = Moderately4 = Very5 = Extremely
Sample size (N)25152641
Percentage (%)35.21% a21.12% b36.61% c5.63% d1.4% e
Different lowercase letters indicate statistically significant differences (p < 0.05).
Table 6. Data regarding the exports and the annual production from Greek wine industries.
Sample Size (N)Percentage (%)
Do you export your wine?
Yes6084.5
No1115.49
What percentage of the annual production is exported?
1–20%2338.3
21–40%2236.7
41–60%1016.7
61–80%58.3
81–100%00
How many years your company have been exporting?
6–101728.3
1–51626.7
>25915
11–15813.3
16–20813.3
21–2523.3
In how many countries do you export?
1–52745
6–102135
11–1535
16–2035
21–2535
>2535
In which countries your products are mainly exported to? *
Germany3965
United States of America3863.3
Canada2236.66
Italy216.66
Austria515
Cyprus610
Australia610
Netherlands46.66
Sweden35
Serbia23.33
Russia23.33
Switzerland11.66
Luxembourg11.66
Japan11.66
* Only 60 of the 71 wine companies export. So only 60 of them continued the questionnaire.
Disclaimer/Publisher’s Note: The statements, opinions and data contained in all publications are solely those of the individual author(s) and contributor(s) and not of MDPI and/or the editor(s). MDPI and/or the editor(s) disclaim responsibility for any injury to people or property resulting from any ideas, methods, instructions or products referred to in the content.