Article

Classification of Pummelo (Citrus grandis) Extracts through UV-VIS-Based Chemical Fingerprint

by
Giacomo Luigi Petretto
1,
Maria Enrica Di Pietro
2,
Marzia Piroddi
1,
Giorgio Pintore
1 and
Alberto Mannu
1,*
1
Dipartimento di Scienze Mediche, Chirurgiche e Sperimentali Università di Sassari, Viale San Pietro, 07100 Sassari, Italy
2
Department of Chemistry, Materials and Chemical Engineering “Giulio Natta”, Politecnico di Milano, Piazza Leonardo da Vinci 32, 20133 Milan, Italy
*
Author to whom correspondence should be addressed.
Beverages 2022, 8(2), 34; https://doi.org/10.3390/beverages8020034
Submission received: 24 April 2022 / Revised: 30 May 2022 / Accepted: 11 June 2022 / Published: 13 June 2022
(This article belongs to the Special Issue Application of Statistics for Beverages)

Abstract

:
Cold extraction methods with ethanol applied to the flavedo of Citrus fruits have been commonly applied for the preparation of several liquors. In order to obtain the extraction optimization and then the best ratio of functional ingredients in the extract, the flavedo of Citrus grandis Osbeck (pummelo) was subjected to a maceration with absolute ethanol at room temperature as well as at 40 °C. The kinetics of the extraction methods were monitored by UV–VIS spectroscopy, and a chemical fingerprint characteristic of each extract was determined by statistical multivariate analysis of the UV–VIS raw data. Additionally, the extracts were qualitatively characterized by NMR spectroscopy as well as by solid phase micro extraction followed by gas chromatography/mass spectrometry (GC/MS). NMR analysis confirmed the presence of the typical flavanones of Citrus such as naringin and naringenin, while the GC/MS analysis showed that the headspace of the liquor is characterized by two main compounds represented by β-myrcene and limonene. At the end, the temperature seems to not affect the time of extraction, which is complete after 25 h; however, UV–VIS-based multivariate analysis revealed that a different overall chemical composition is obtained depending on the temperature, probably due to the extraction of minor chemicals as well as due to different levels of the same compounds in the two extracts.

Graphical Abstract

1. Introduction

According to the FAO Statistical bulletin, in 2020 the entire production of Citrus fruits over the world exceeded 70,000 tons [1] Although the main utilization of these fruits to date is juice production, great importance has been given also to other transformed products such as its utilization for jam preparation [2], as a food supplement ingredient [3], or its utilization for liquors obtained by cold extraction [4]. Among the Citrus liquors, maybe the most famous Citrus liquor is obtained from lemons, which is commonly known as “limoncello” in Italy, but other liquors obtained from mandarin and from bergamot have been registered as Protected Designation of Origin (PDO). The liquor sensory characteristics are strictly related to the essential oil contained in the flavedo of the fruits that act as a flavoring material for the final product. The European regulation (nr. 110/2008) on spirit drinks reports on the rules for the geographical indications or sales denominations and reports on the additives such as synthetic substances but does not give any information about the experimental procedure.
The chemical composition of the final liquor is a complex mixture of compounds with polar and non-polar characteristics that are strictly related to the starting raw material. The quali–quantitative determination of the chemical composition requires the utilization of sensitive and selective analytical apparatus, but obviously quantitative data are also linked to the extraction method, whose parameters could affect the final concentration of a single compound.
Pummelo (Citrus grandis Osbeck) is the largest fruit of the Citrus genera. It can reach about 30 cm in diameter and 2 kg in weight [5]. Like the other fruits from Citrus, it is a good source of several functional ingredients, such as polyphenols, vitamins, or dietary fiber [6]. It is native to Southeast Asia and nowadays it is mainly cultivated in eastern countries including California and Florida. From the flavedo of the fruit it is possible to extract the essential oil, which is characterized, like many other Citrus fruits [7] by limonene that in pummelo has been found to represent about 90% of the whole essential oil [8]. Previous papers on pummelo have been mainly focused on chemical characterization [6,7,8], while a less studied topic is the optimization of extraction parameters for the liquor preparation.
As above reported, the extraction method plays a key role and strongly affects the chemical composition of the final liquor product.
In this context, the effect of the temperature of the extraction process on the corresponding pummelo extracts was assessed by a combination of UV–VIS spectroscopy and multivariate analysis, which allowed a classification of the product. Additional fixed-wavelength UV–VIS monitoring and 1H NMR measurements were used for the characterization of the extracts. Finally, the volatile fraction was characterized by HS-SPME chromatography.

2. Materials and Methods

2.1. Materials

Commercial Citrus grandis fruits were purchased from local market. Ethanol was purchased by Sigma Aldrich (Merck KGaA, Darmstadt, Germany). Deuterated methanol was purchased by Sigma Aldrich (Merck Europe).

2.2. Extraction Procedure

60 g of chopped flavedo was obtained after the peeled fruits were macerated in 200 mL of absolute ethanol at room temperature (Samples A) and at 40 °C ± 1 (Samples B). Sampling (about 5 mL of extracting solution) was carried out at different times according to the timetable reported in Table 1 in both experiments.

2.3. UV–VIS Acquisition Spectra

UV–VIS spectra were recorded by measuring the absorbance of the extraction solution at 400 nm for the determination of the extraction kinetic and in a range between 200–600 nm for the full spectra determination, using a 1 cm quartz cuvette on an Ultrospec 4300 pro UV–VIS spectrophotometer, equipped with a temperature controller that was set to 25 °C. The analyses have been carried out in triplicate and the values used for multivariate analysis are the average values between the replicas.

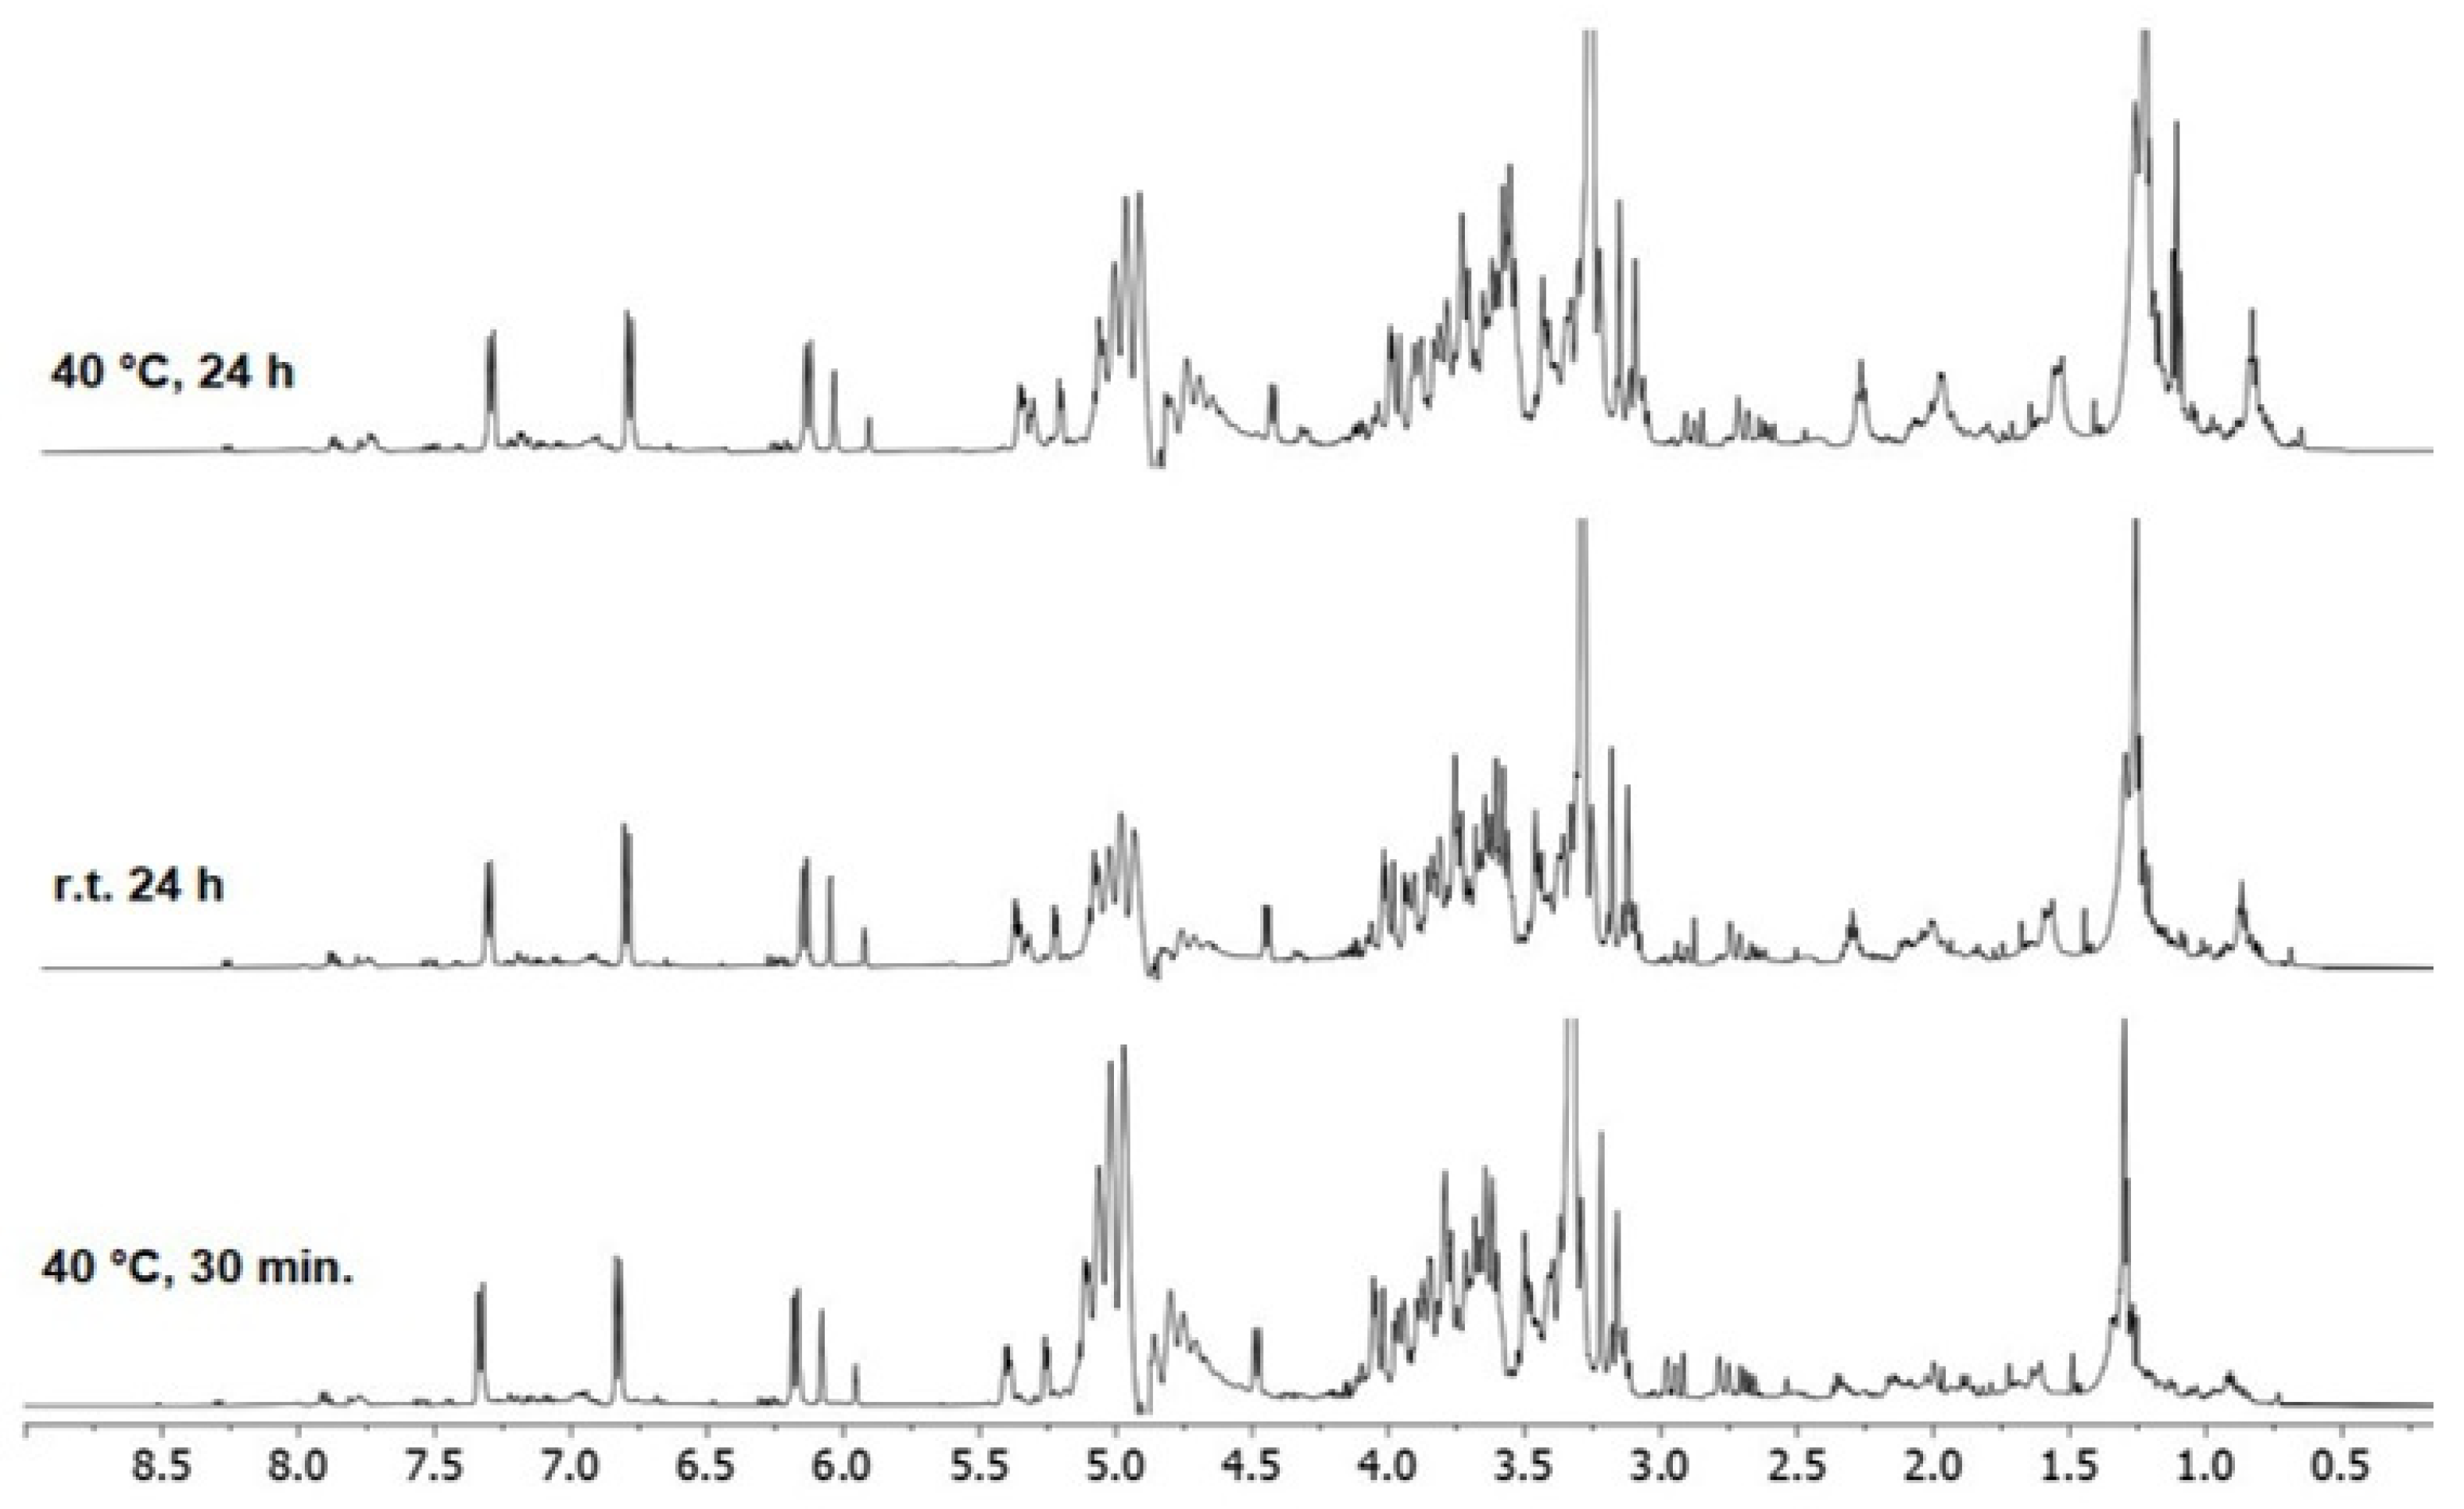
2.4. NMR Measurements

Each extract sample was subjected to a high vacuum treatment in order to evaporate any trace of ethanol and water. The corresponding residue was dissolved in methanol-d3 and the resulting solution placed in 5 mm NMR tubes. 1D NOESY experiments with pre-saturation on the water resonance during relaxation delay and mixing time (noesypr1d pulse sequence in Bruker library) were performed without sample spinning with a Bruker NEO 500 console (11.74 T) equipped with a direct observe BBFO (broadband including fluorine) iProbe and a variable temperature unit (1H resonance frequency of 500.13 MHz). 1D 1H spectra were recorded at 298 K with 256 scans using 32,768 points, 4 dummy scans, a mixing time of 50 ms, and a relaxation delay of 2 s, over a spectral width of 15 ppm (acquisition time of 2.2 s).

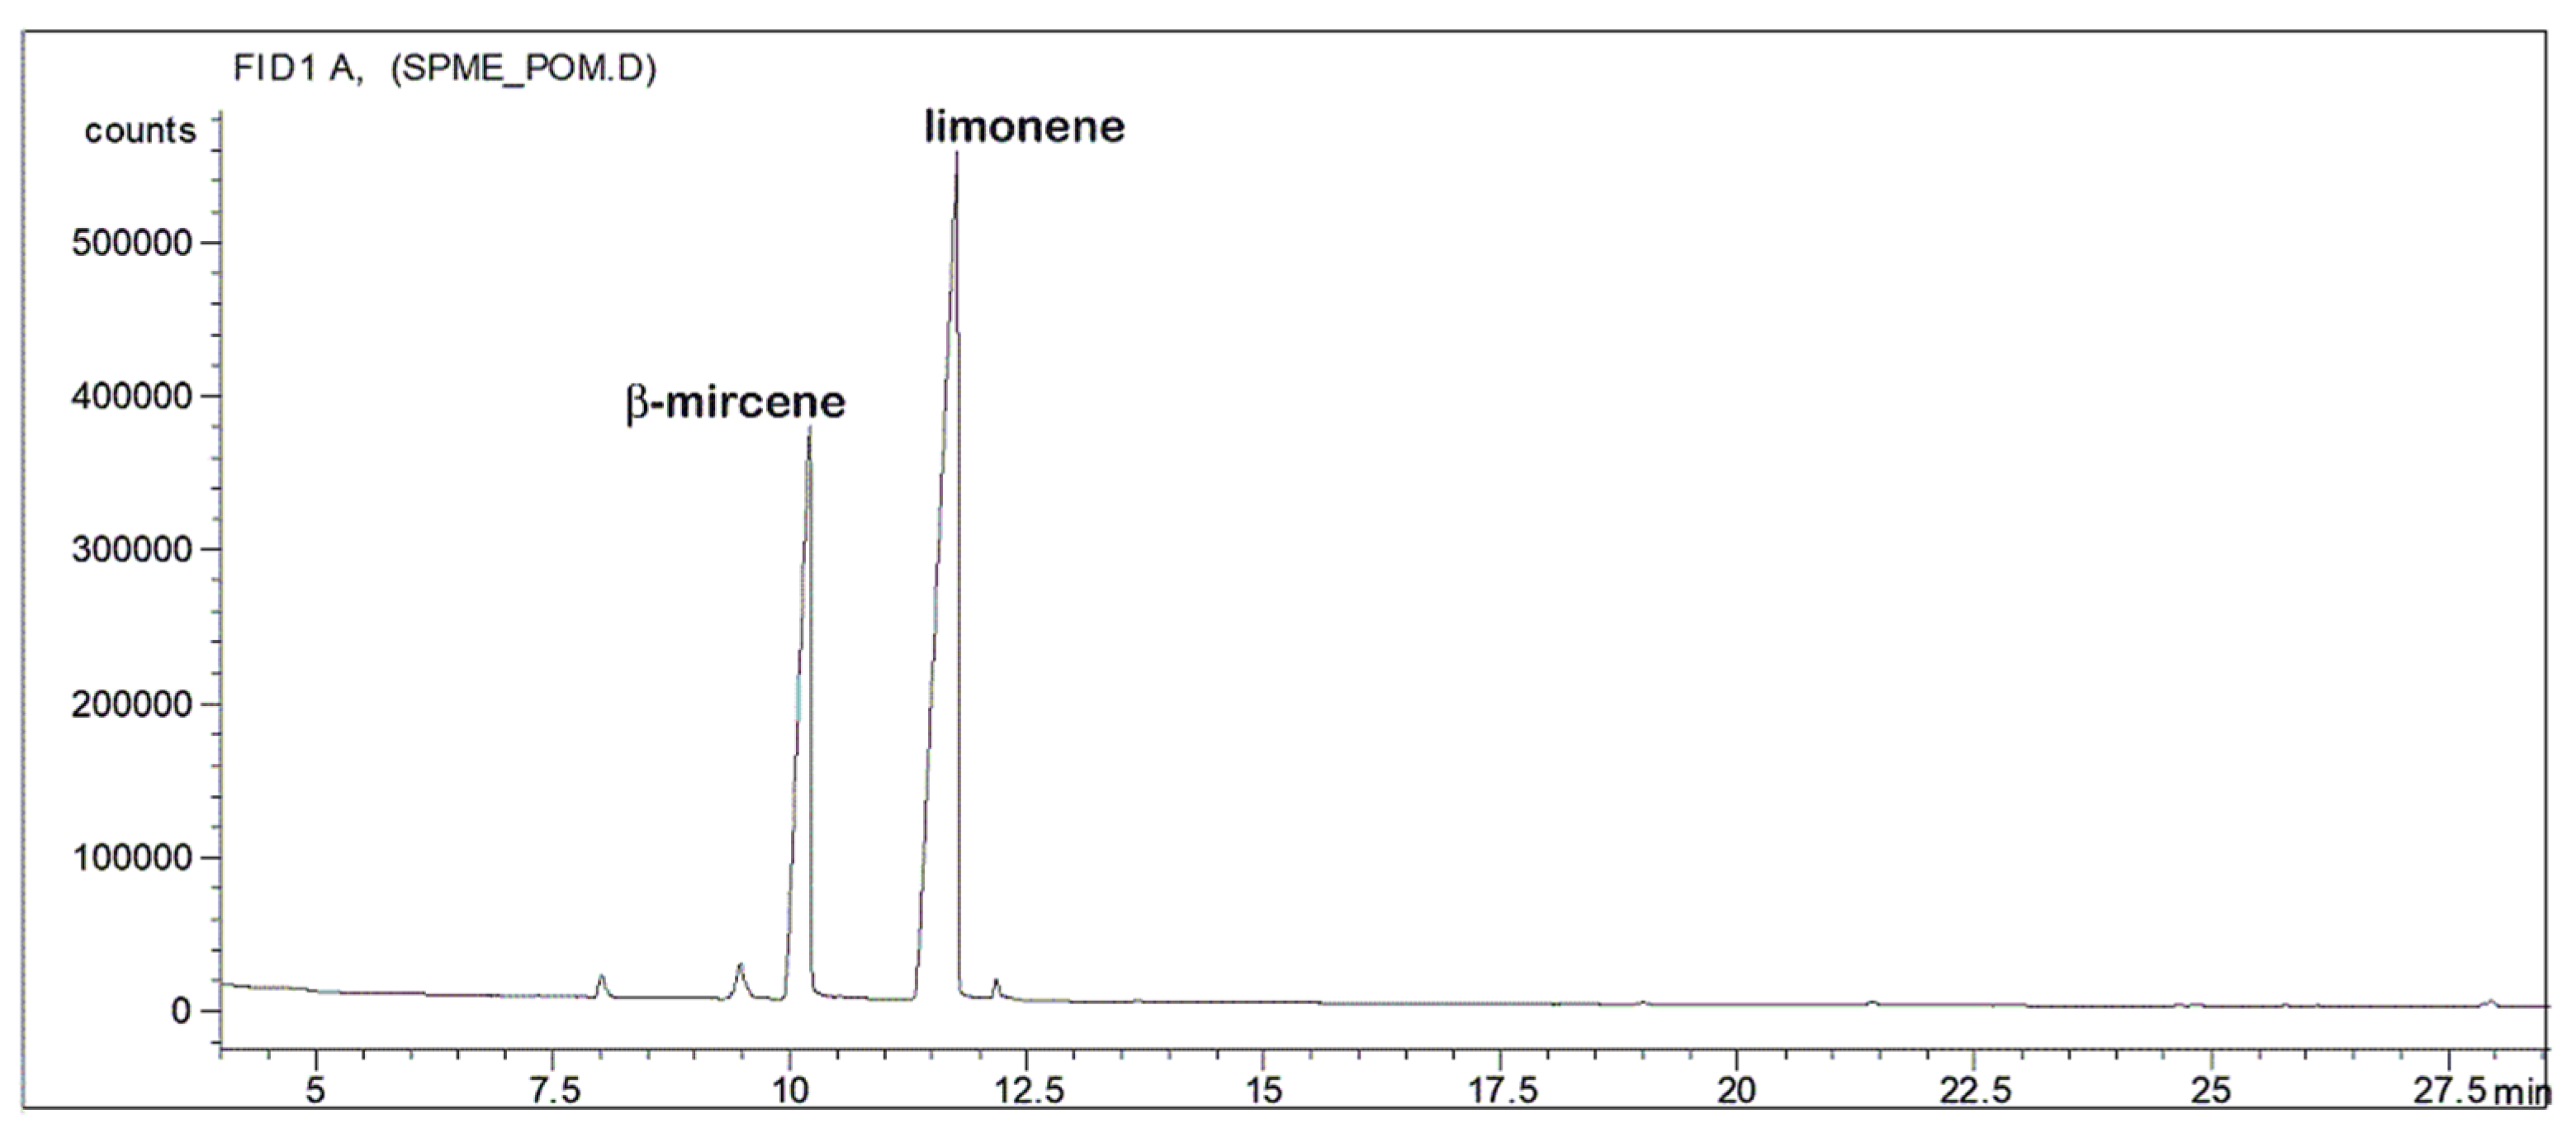
2.5. Volatile Organic Compounds Determination

The isolation of headspace volatile compounds was carried out using a 100 μm PDMS (Polydimethylsiloxane) coated fiber (Supelco, Sigma Aldrich, St. Louis, MO, USA) that was preconditioned according to the manufacturer’s instruction. A 10 mL ethanolic extract was placed into a 20 mL SPME vial that was tightly closed using a septum. After 5 min of equilibration at 30 °C, the conditioned fiber was injected through the septum and suspended in the headspace.
The fiber was exposed to the volatiles for 30 min; it was then retracted, removed from the vial, and placed immediately into the injector of the GC. Thermal desorption was performed in the injector at a temperature of 250 °C for 5 min in split-less injection mode. Prior to, and after, each analysis, the fiber underwent a further bake-out step for 5 min at 250 °C.
The volatile organic compounds absorbed by the fiber were subsequently analyzed in an Agilent 6850 GC coupled with an Agilent 5973 MSD detector as well as in an Agilent 4890 GC coupled with a flame ionization detector (FID). The following temperature program was used: 40 °C hold for 4 min, then increased to 150 °C at a rate of 5.0 °C/min, held for 3 min then increased to 240 °C at a rate of 10 °C/min, and finally held for 12 min. A hydrocarbon mixture from C8–C23 was injected under the same HS-SPME/GC-MS/FID conditions to obtain the linear retention indexes.

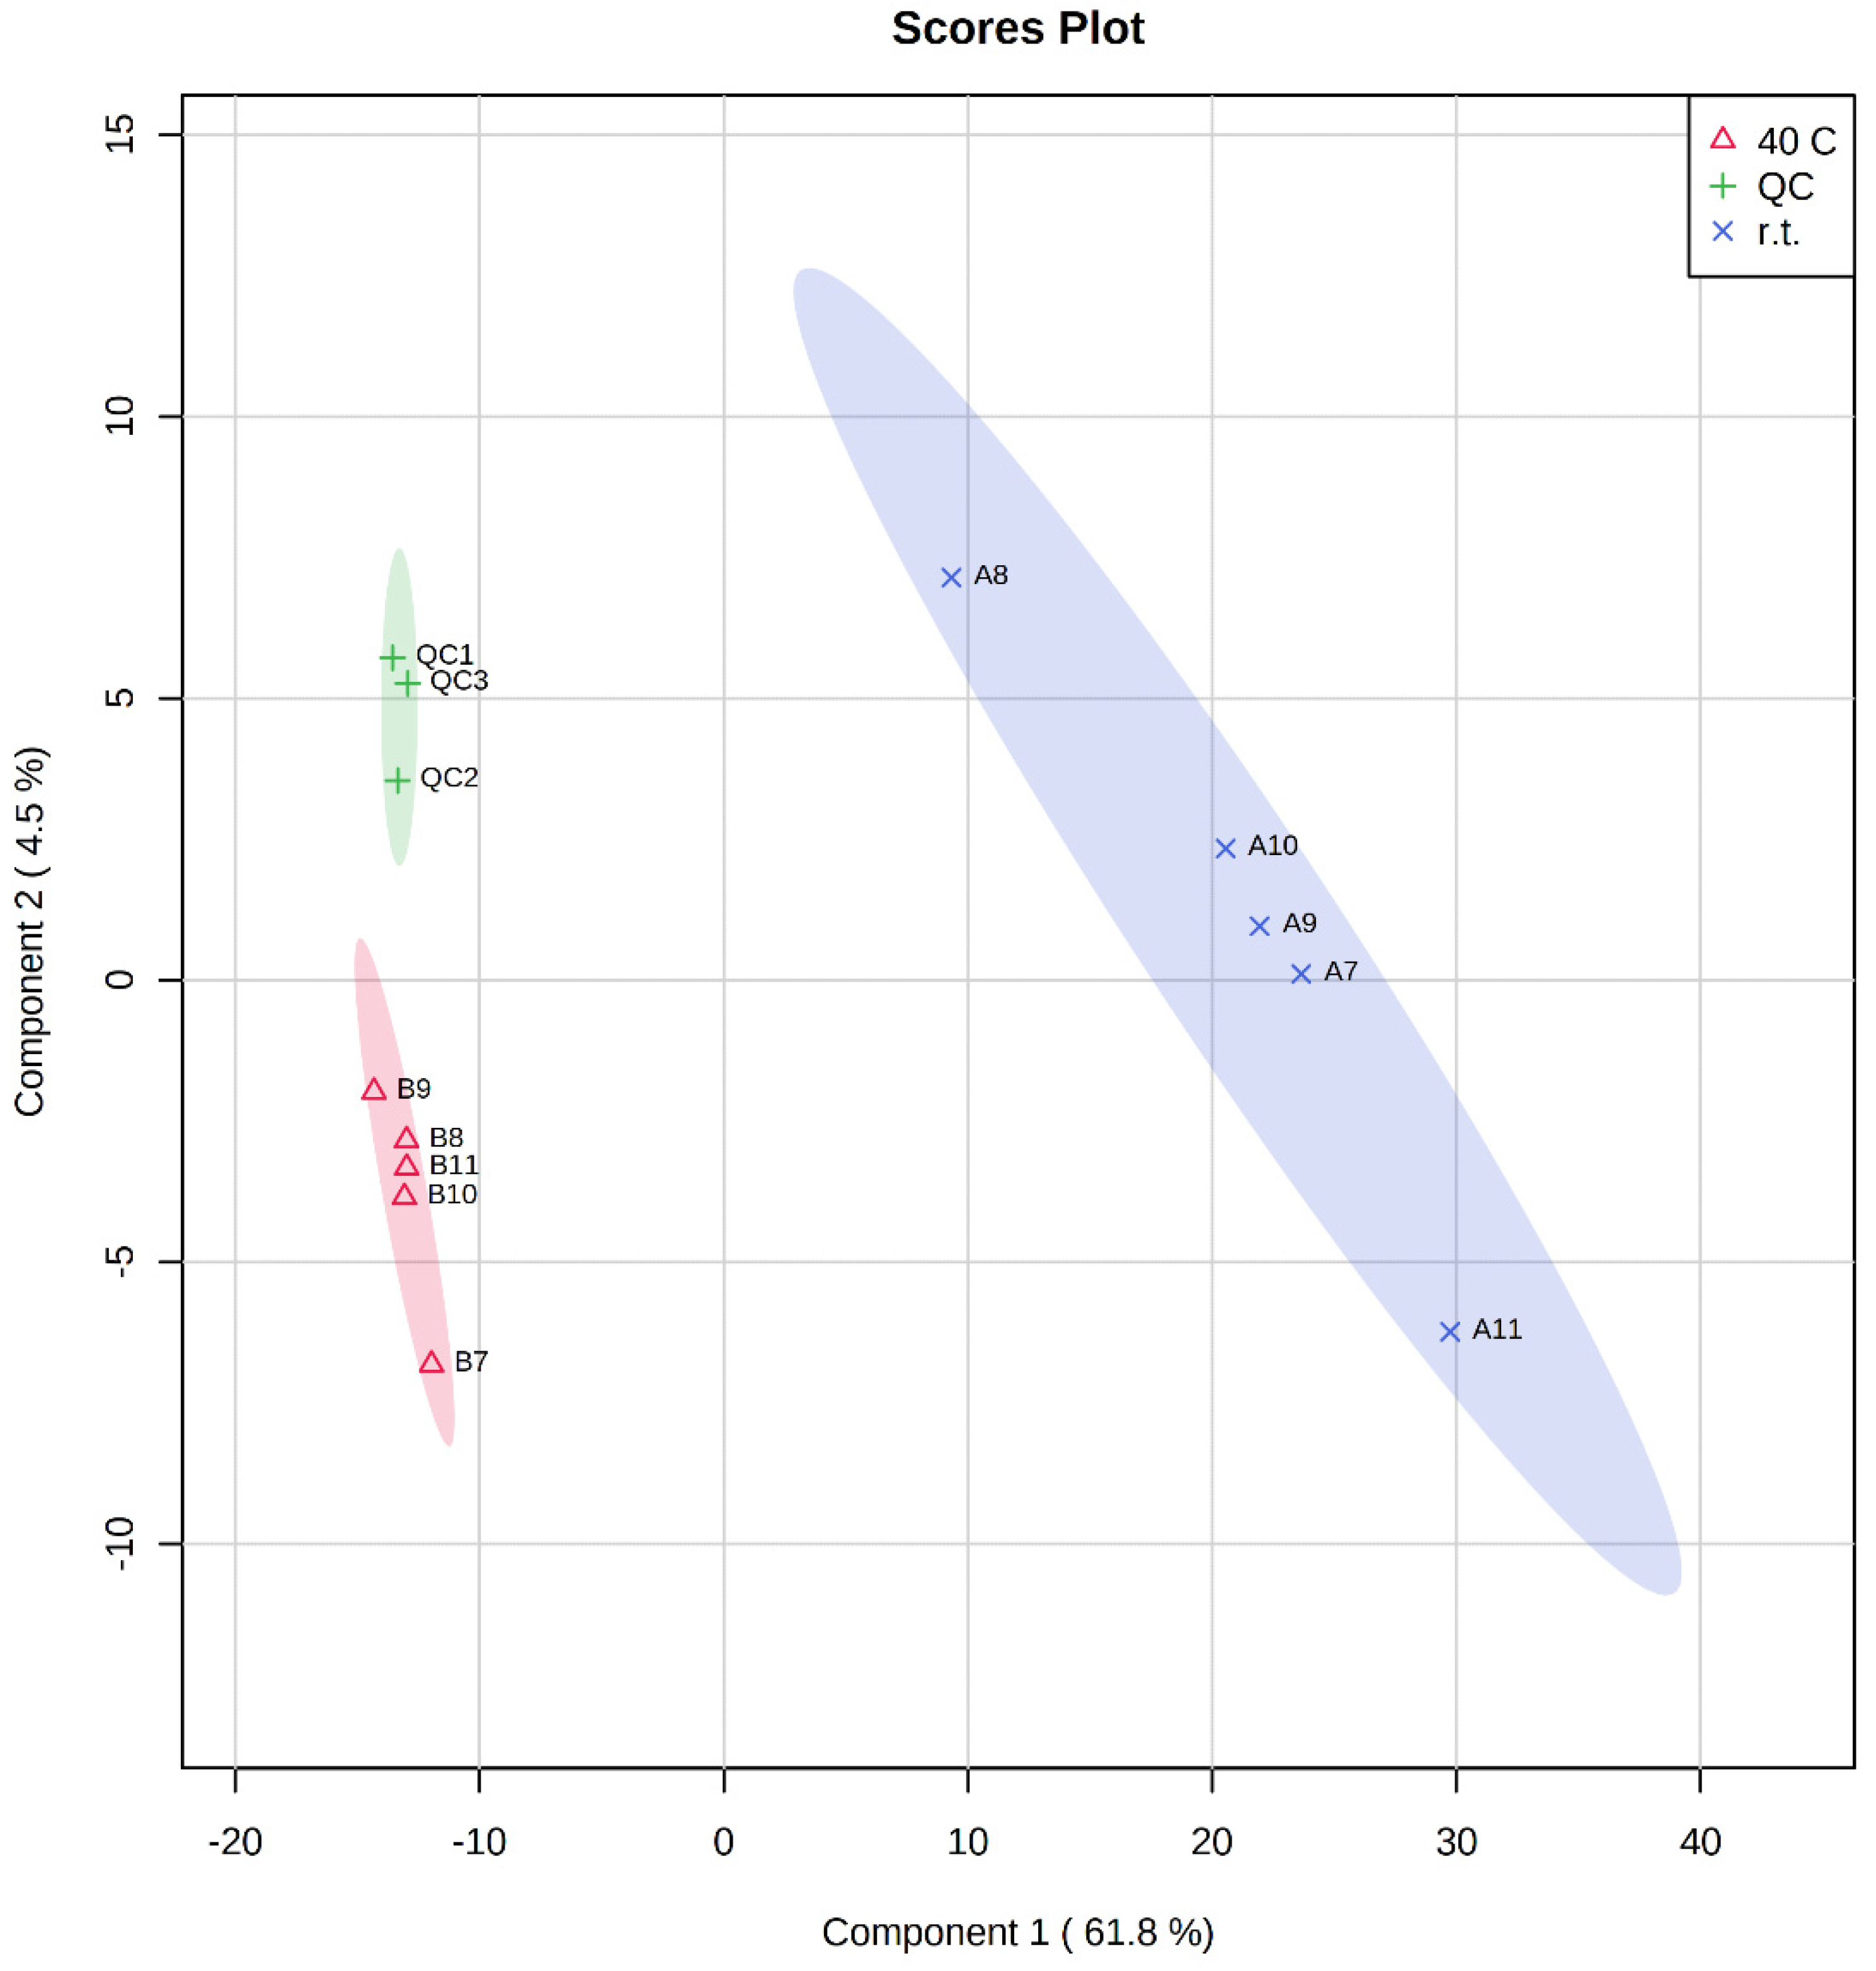
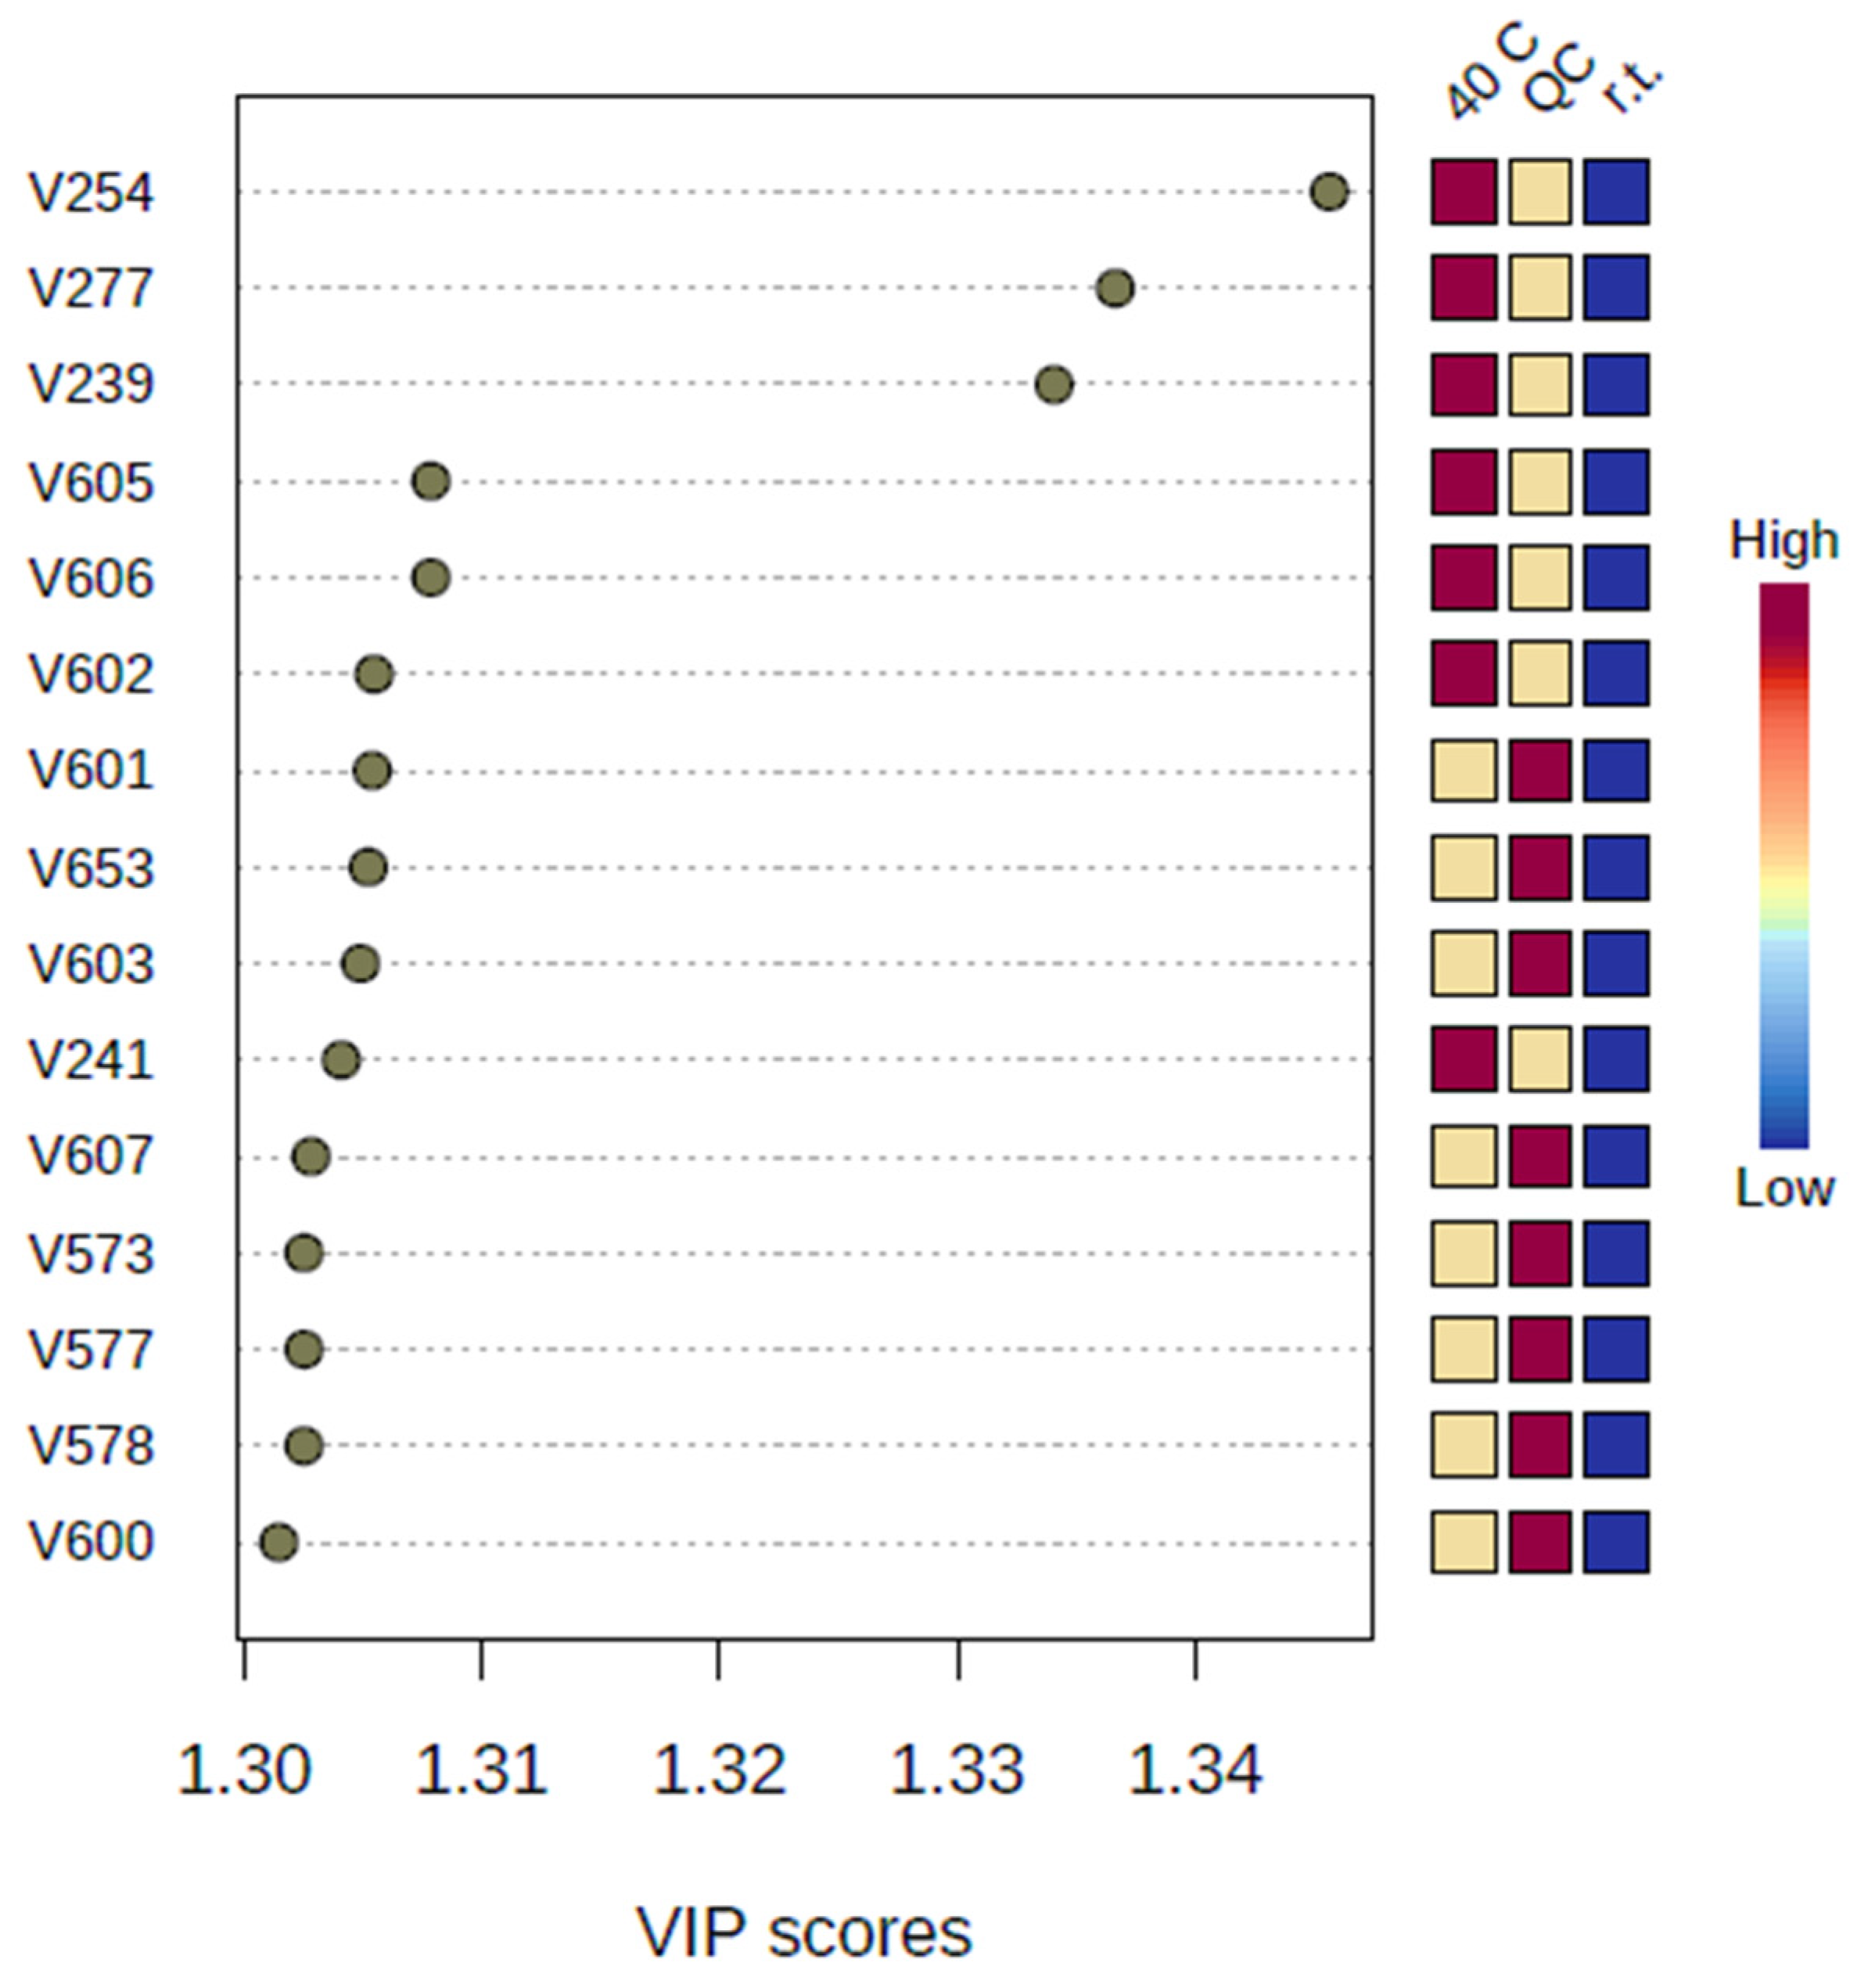
2.6. Multivariate Analysis

Multivariate analysis was conducted with the online tool MetaboAnalyst 5.0 [9], while for the PLS-DA regression, the plsr function provided by the R pls package was employed [10].

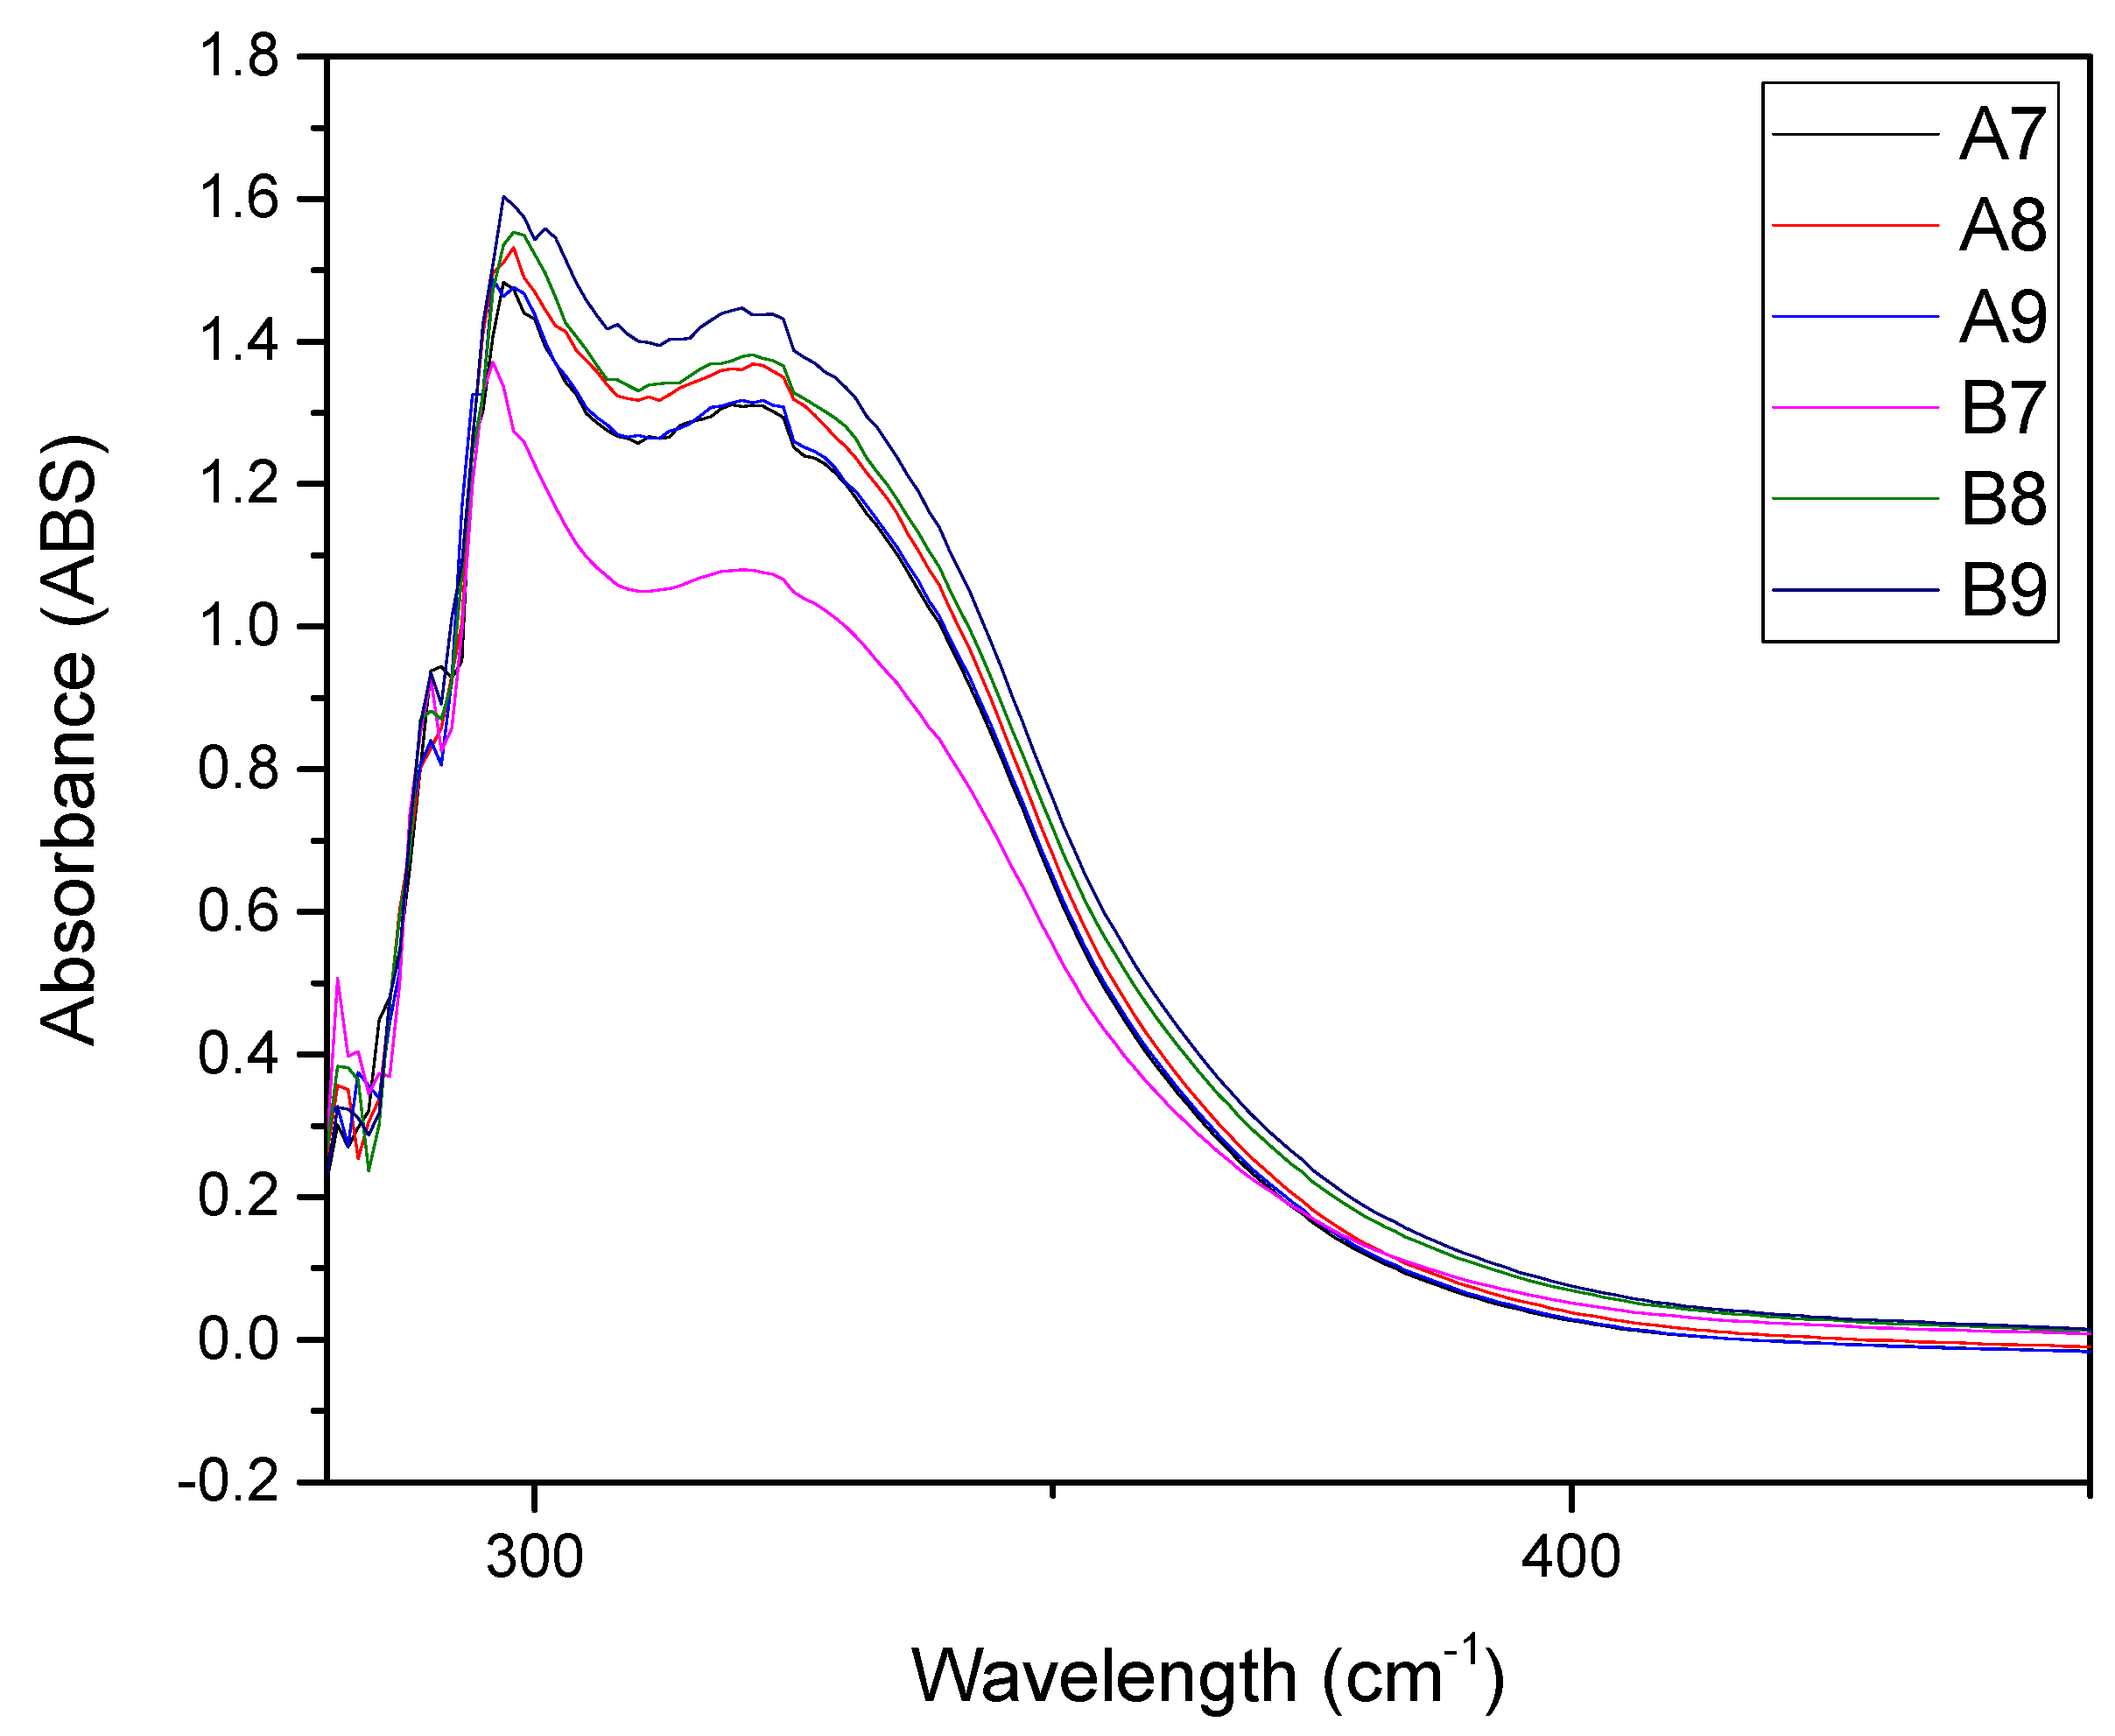
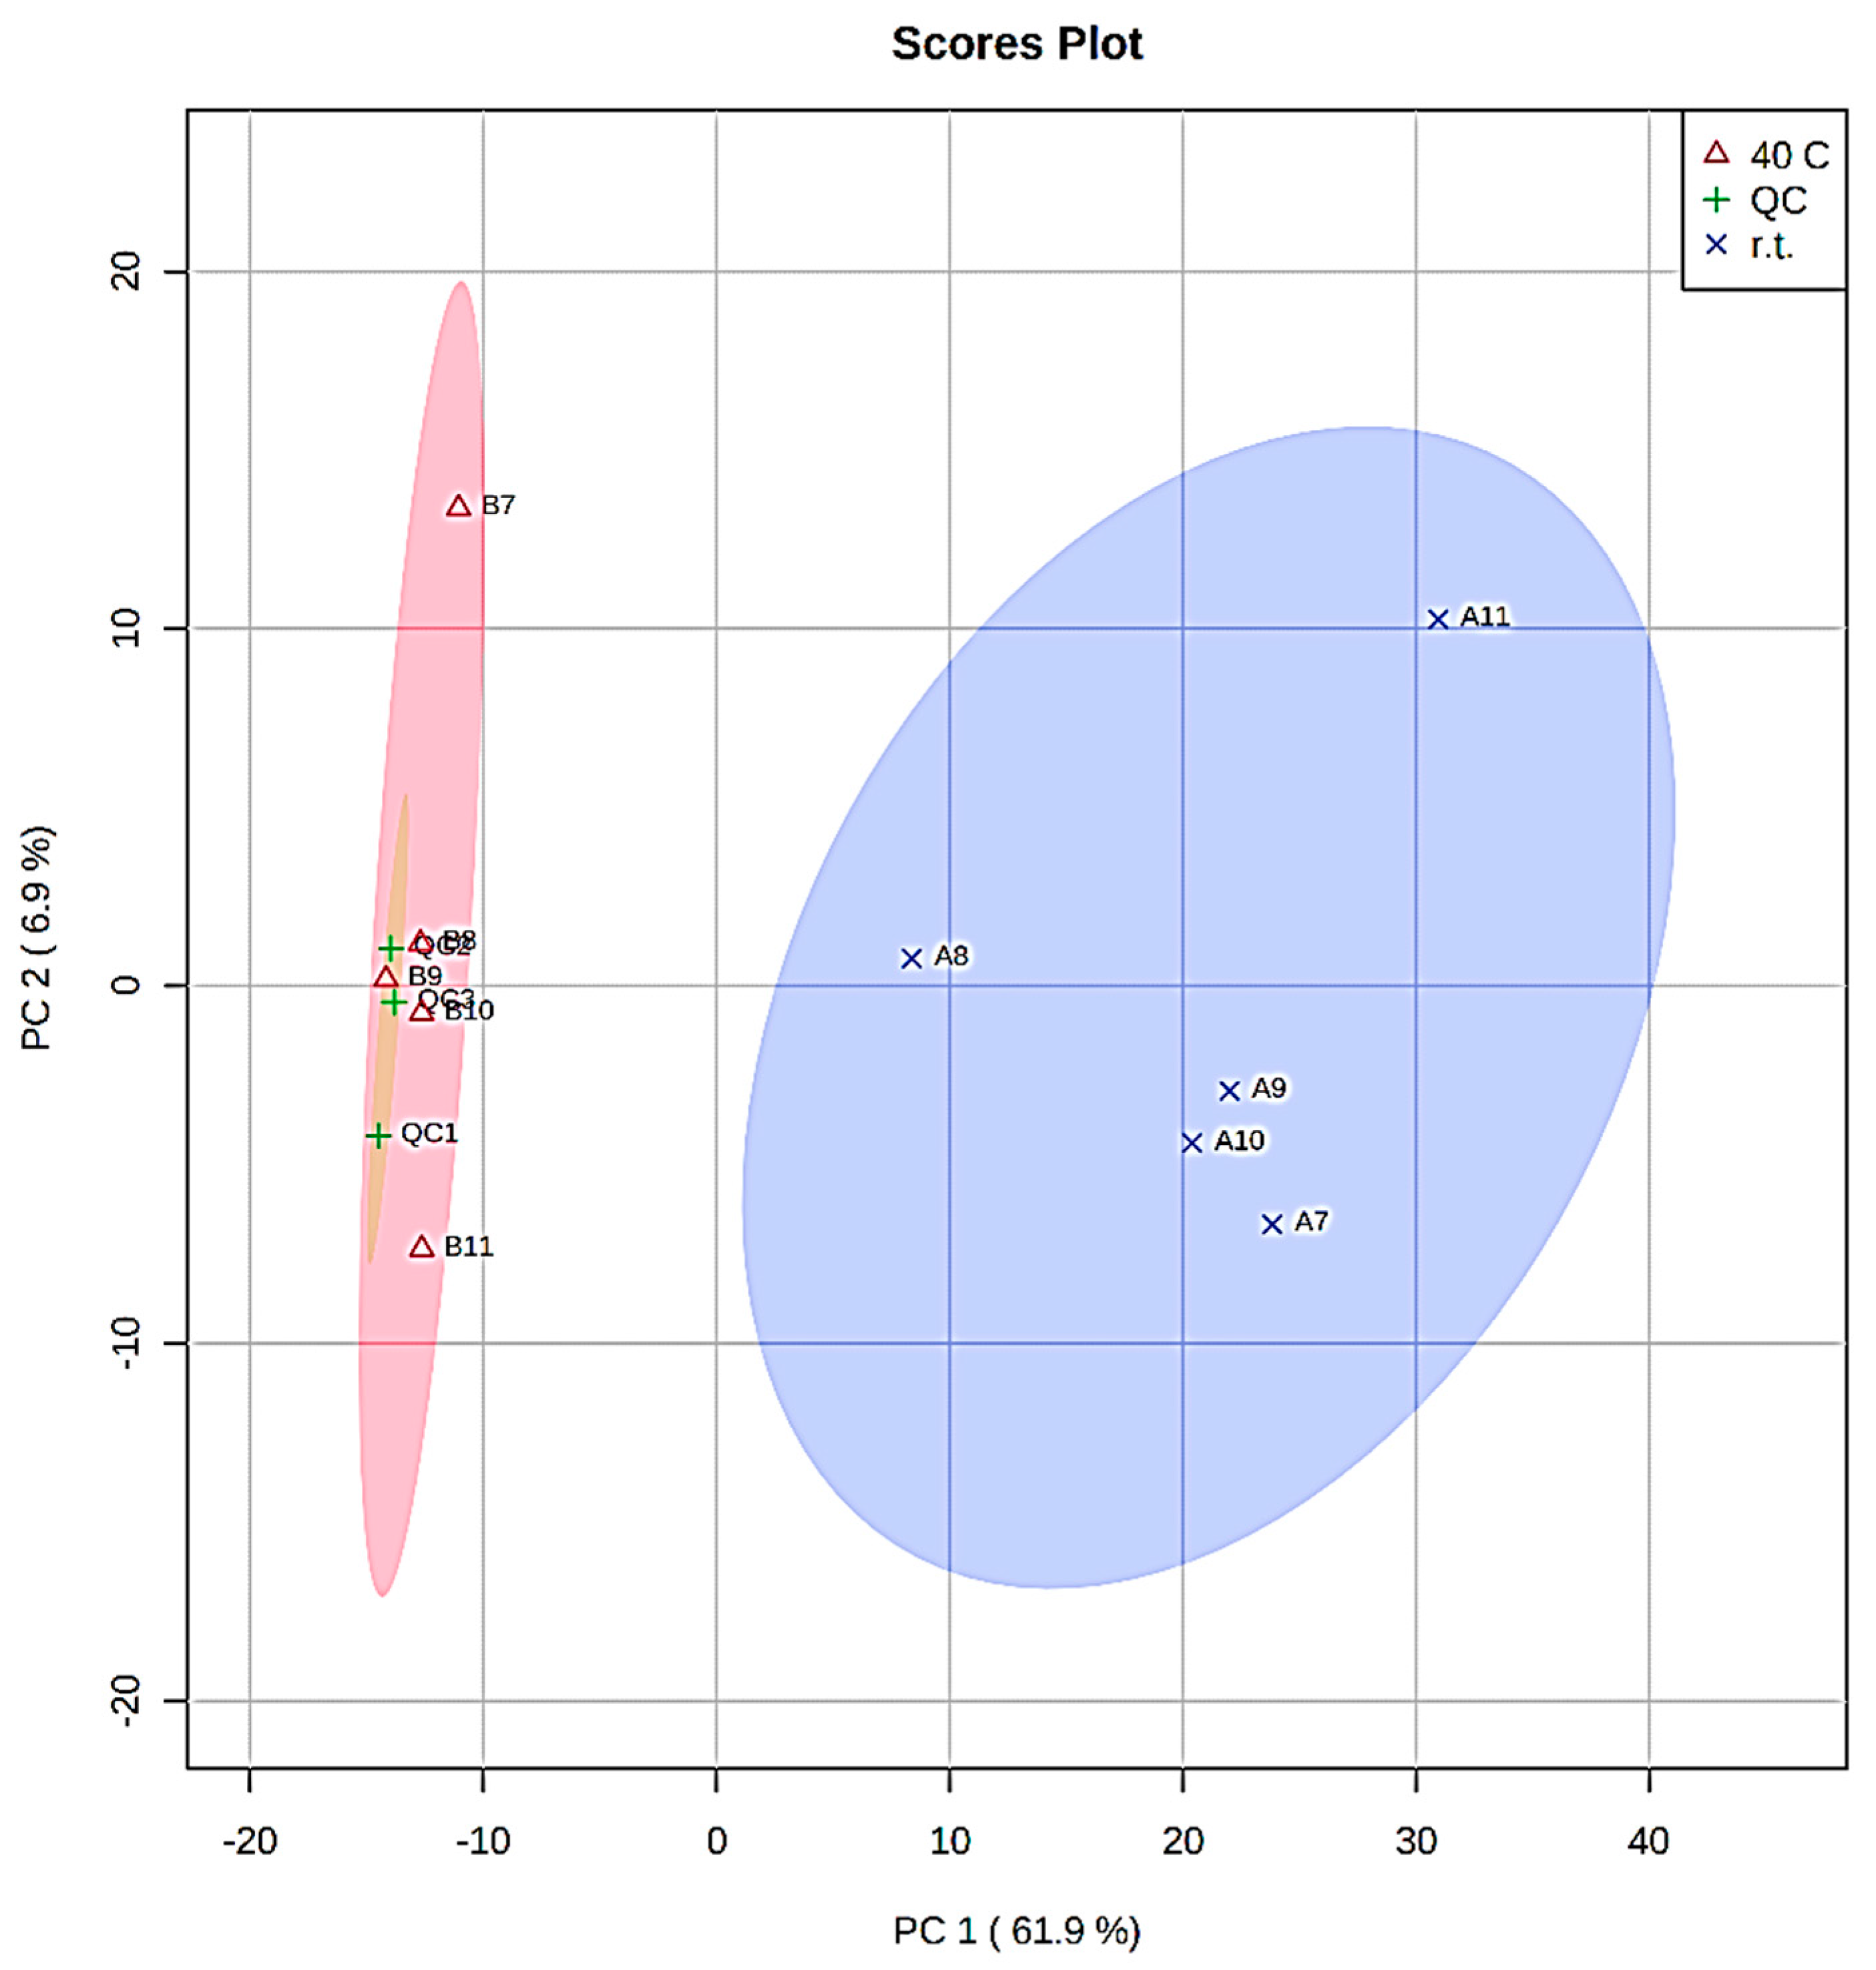
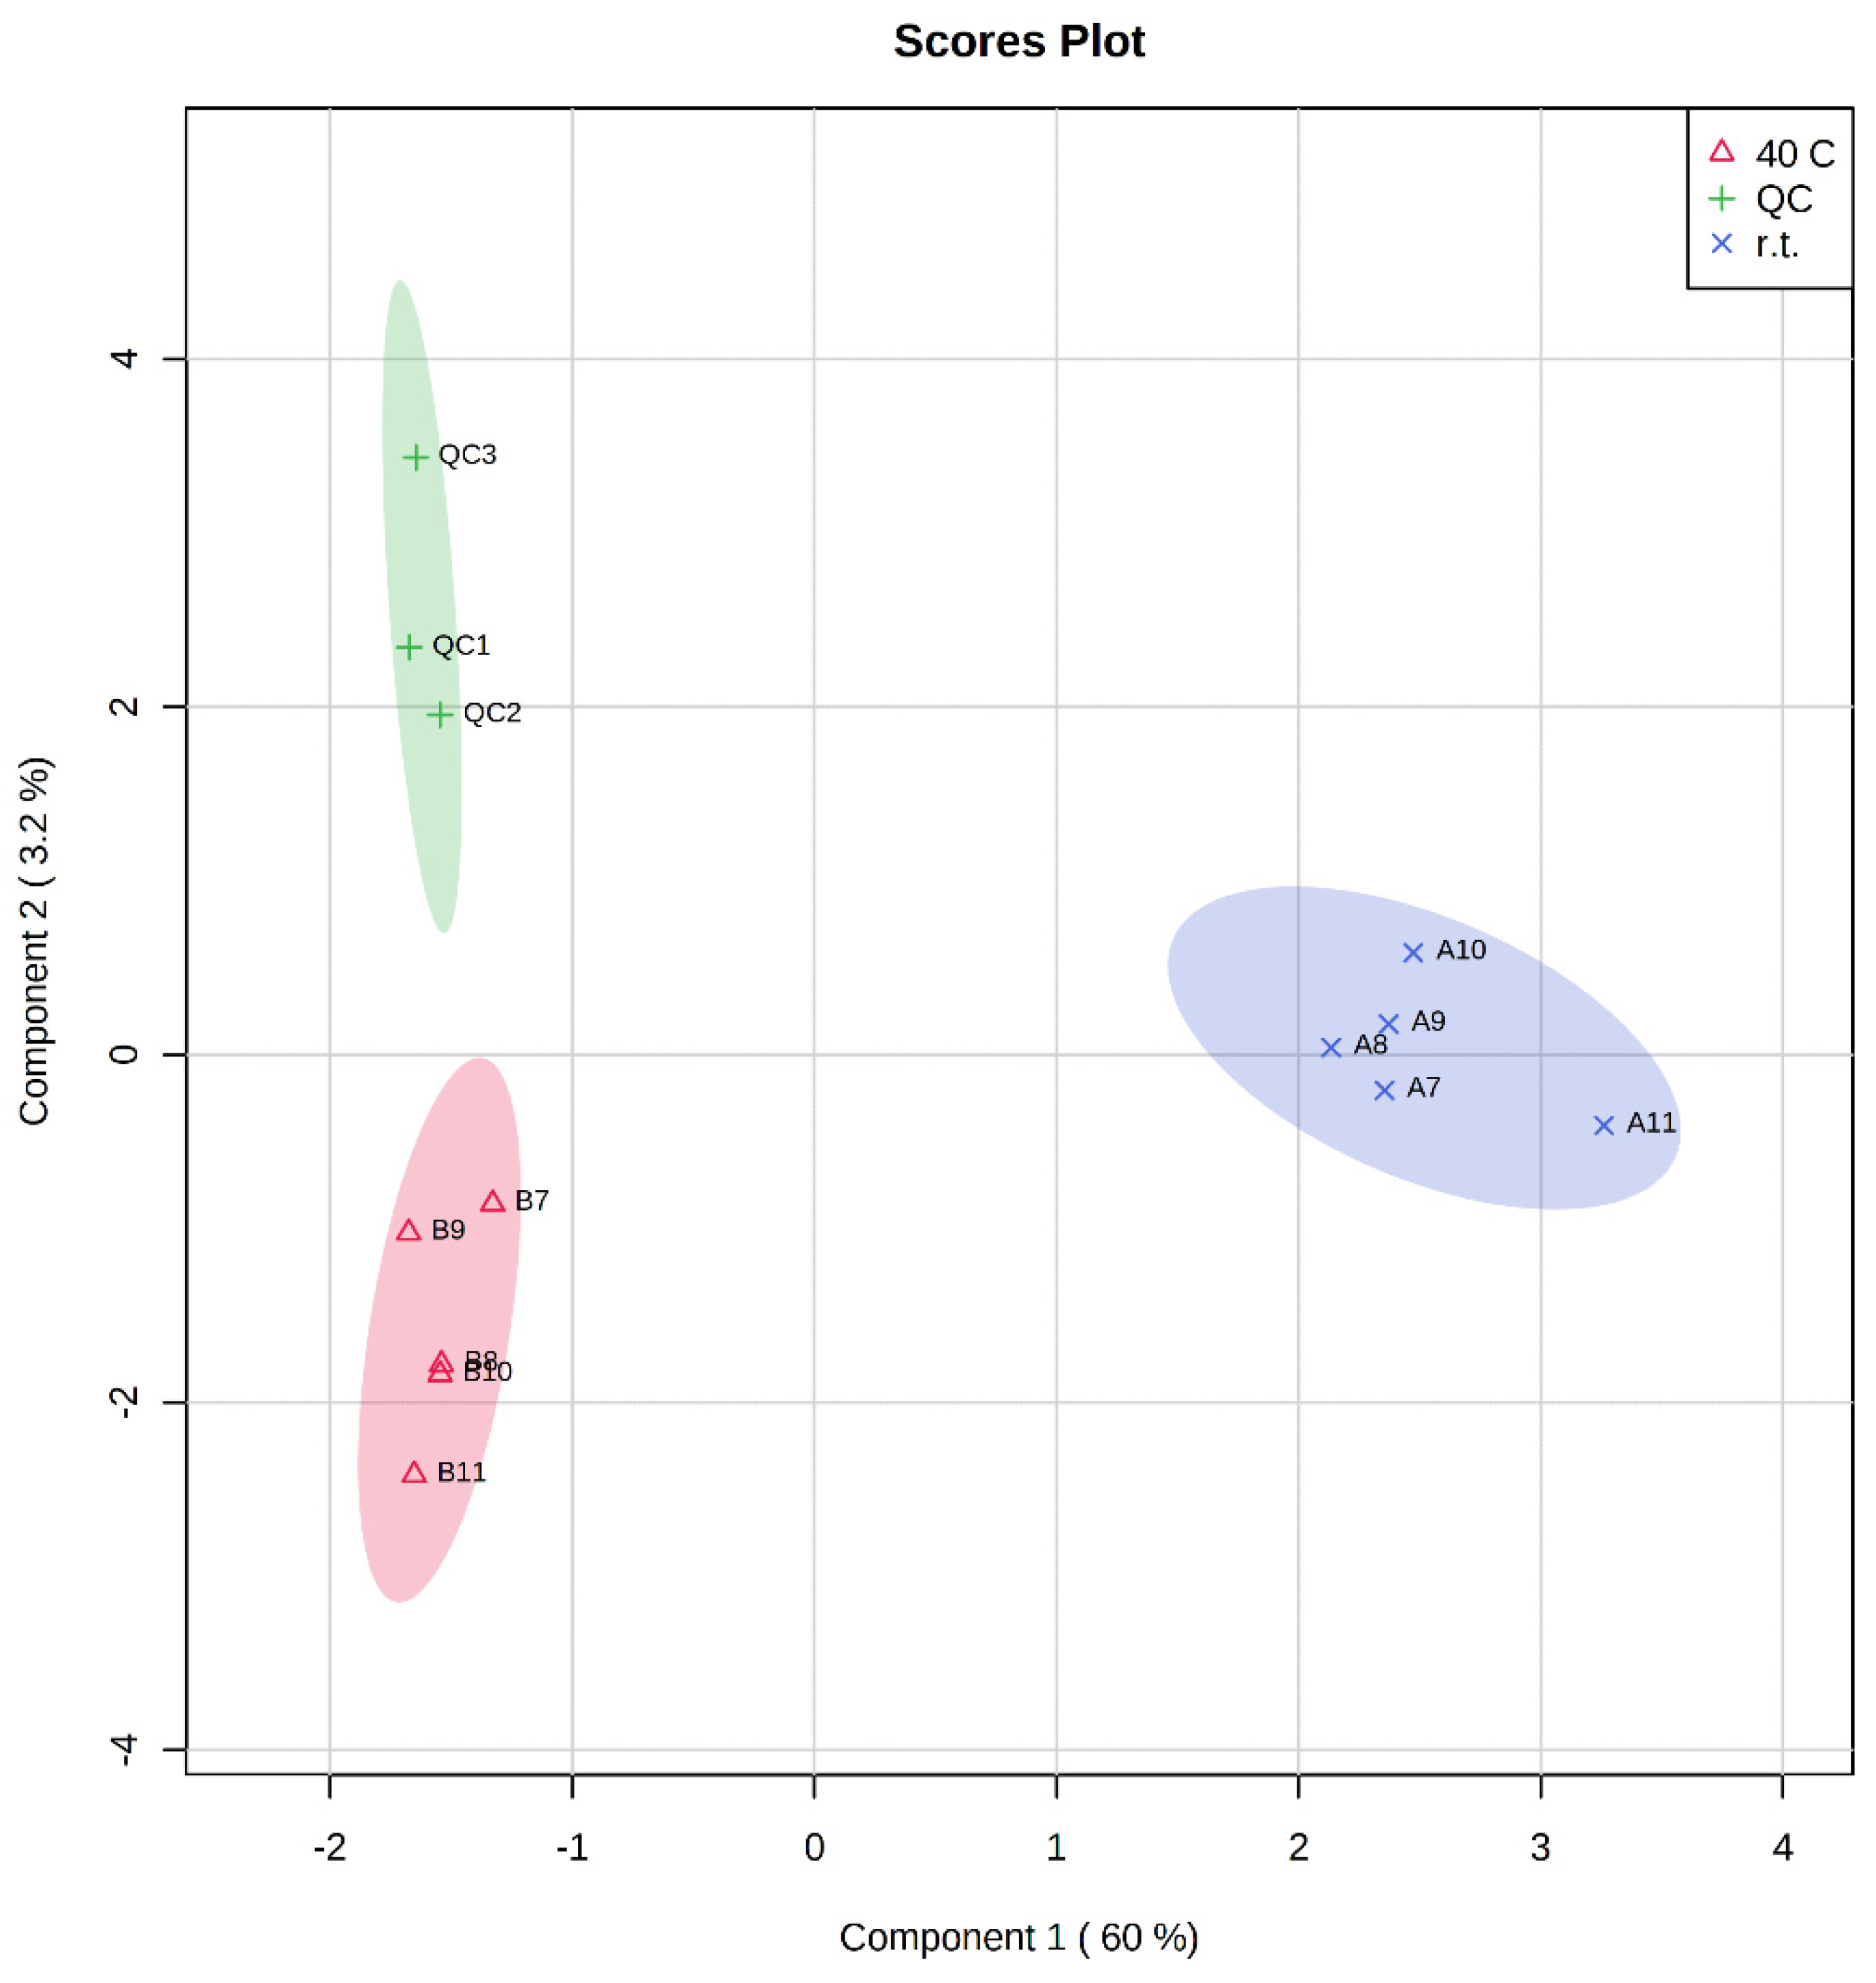
3. Results and Discussion

Chopped flavedo samples of Citrus grandis were subjected to ethanol extraction under two different temperature conditions (r.t. and 40 °C). The procedure was monitored by UV–VIS spectroscopy, and in particular the absorbance at 400 nm at different time was measured. The value of the absorbance at this specific wavelength is in fact related to the concentration of the natural substances responsible for the color of the extracts and thus to the extraction kinetics [11]. Table 1 reports the experimental design of the extraction times, while in Figure 1 the extraction kinetic for the two experiments at different temperatures is shown. As expected, the absorbance follows a rapid increase at the beginning until the plateau is reached, and for each sampling time the amount of coloring substances resulted greater in the 40 °C experiment when compared with the RT experiment.
Regarding the assessment of the chemical composition of similar extracts pertaining to the citrus family, NMR spectroscopy stood out as a good tool both for the qualitative [12] and quantitative characterization [13].
NMR spectroscopy is often employed as a fast and reliable tool for food control and food quality assessment and many NMR-based techniques have been reported [14]. In particular, 1H NMR represents a suitable kind of experiment for having additional information about the presence of specific molecules in the extracts.
Taking into consideration the previous reported dataset for qualitative analysis, it was possible to confirm in our extracts the presence of a mixture of flavonoids. Among them, naringin [14] and naringenin are clearly visible in the aromatic part of the spectrum, characterized by the three pseudo doublets at 6.17, 6.83, and 7.33 ppm (Figure 2) [13].
Regarding the comparison between 1H NMR spectra relative to extracts obtained under different conditions of time and temperature (Figure 1), it is not possible to appreciate any relevant difference in the main chemical composition. In fact, only slight differences in the aliphatic region can be noticed by a qualitative visual analysis. A more accurate NMR screening could be conducted by a metabolomic analysis, which would require expensive standards or access to specific databases [15].
A similar outcome can be observed in the case of UV–VIS characterization (Figure 3).
A qualitative spectroscopic analysis is, hence, not able to distinguish between samples with small differences in their chemical composition.
Nevertheless, much hidden information can be extracted from raw spectroscopic data by means of multivariate statistical analysis. This approach has already been used for other food matrices [16], in particular, beverages [17]. The raw data of each UV–VIS spectra were processed with the statistical online tool MetaboAnalyst 5.0. The spectra of samples A7–A11 and B7–B11 were registered in triplicate and the average data were subjected to statistical analysis (as described in the experimental part section) in order to distinguish between extracts obtained at a room temperature of 40 °C. Control samples were prepared by mixing equal quantities of all the different oils subjected to analysis. At first, unsupervised Principal Component Analysis was performed, which gave the results reported in Figure 4.
Looking at Figure 4 it is evident that the PCA tool is suitable to distinguish between extracts obtained at different temperatures. Control samples results are superposed to the 40 °C group. Although the PCA can be employed for quality assessment purposes, further processing can improve the accuracy of the model.
As reported for similar matrixes such as frying oils [16] or wines [17], in such cases where the number of variables is higher than the number of observations, Partial Least Square Discriminant Analysis (PLS-DA) can allow suitable clusters for classification purposes [18,19]. In Figure 5, the corresponding PLS-DA plot is reported.
The PLS-DA model is made up of the data (X) and the permuted class labels (Y) using the optimal number of components determined by cross validation for the model based on the original class assignment. The class discrimination was estimated through two different statistical models. The first one is based on the prediction accuracy during training. The second one is the separation distance based on the ratio of the between group sum of the squares and the within group sum of squares (B/W-ratio). If the observed test statistic is part of the distribution based on the permuted class assignments, the class discrimination cannot be considered significant from a statistical point of view.
Looking at Figure 5, it is evident that an almost successful distinction between the two families of extracts (A at r.t. and B at 40 °C) and the control samples can be obtained. The classification obtained with PLS-DA statistical analysis can be further improved. In fact, in the PLS-DA model, the estimation of the statistical parameters is performed considering all the variables, even if some of these are not relevant for the prediction [20]. This presence of non-useful variables represents a disturbing element in the statistical framework, which negatively affects the effectiveness of the model [21]. A common procedure to reduce the number of insignificant variables and to improve the outcome of the statistical analysis, is represented by the application of a sparse approach to PLS-DA that excludes non-relevant variables during the calibration steps [22,23,24]. In Figure 6, the s-PLS-DA plot is reported.
As expected, the optimized statistical model allows to separate the pummelo extracts depending on their chemical composition, which is different when the process of extraction is performed at different temperatures.
PLS-DA statistical analysis also allows to determine a chemical fingerprint that is typical of each considered family of extracts. In particular, the number of variables representative of r.t. or 40 °C extracts is reduced to 15 more representative variables that determine the response [25,26,27]. A corresponding Variable Importance in Projection plot (VIP plot) can be derived, as showed in Figure 7.
In Figure 7, the most relevant variables corresponding to the two processes considered have been combined to obtain a chemical fingerprint characteristic of pummelo extracts obtained either at r.t. or at 40 °C. The model herein described, originally obtained from UV–VIS spectroscopical data, represents a suitable tool for the classification of this beverage.
In order to increase the amount of information related to the chemical composition of the two extracts, a head space solid phase microextraction followed by gas chromatography mass spectrometry was applied to the extracts. The chemical analysis of the headspace showed that volatiles of the final liquor revealed the presence of two compounds that represented over 98% of the total chemical composition, namely limonene (69.5%) and b-myrcene (28.8%) (Figure 8). This result is in accordance with the previous literature papers [8] focused on the analysis of the essential oil of pomelo. Recently, Sun et al. (2014) [11] studied the essential oils of pummelo extracted in different ways; the authors evidenced, in line with our results, that although many compounds were detected, the sum of β-myrcene and limonene accounted for about 91% (w/w) of the total raw essential oil.

4. Conclusions

Several pummelo extracts were prepared by ethanol processing at two different temperatures (r.t. and 40 °C). The kinetic profile at λ = 400 nm, obtained by UV–VIS spectroscopic monitoring, revealed the complete extraction of the color-responsible chemicals after 8 h of treatment. As the qualitative UV–VIS analysis of the extracts obtained at different temperatures does not show any difference between samples, a statistical model based on multivariate analysis was implemented in order to distinguish between liquors obtained under different temperature conditions. After a first assessment through PCA and PLS-DA analyses, the statistical model was optimized by employing the sparse approach and the opportune selection of the most relevant variables allowed to determine a chemical fingerprint that is typical of pummelo extracts obtained at r.t. or at 40 °C. The implemented tool can be used for classification purposes as well as for quality assurance of commercial liquors. Qualitative analysis was conducted by means of 1H NMR spectroscopy and head space SPME followed by gas chromatography, which revealed, respectively, the presence of the flavonoids naringin and naringenin, and myrcene and limonene.

Author Contributions

Conceptualization, A.M. and G.L.P.; methodology, A.M. and G.L.P.; software, A.M.; validation, A.M.; formal analysis, M.E.D.P. and G.L.P.; data curation, A.M. and G.L.P.; writing—original draft preparation, A.M. and G.L.P.; review and editing, M.P. and G.P. All authors have read and agreed to the published version of the manuscript.

Funding

This research received no external funding.

Institutional Review Board Statement

This study did not require any ethical approval.

Informed Consent Statement

Not applicable.

Data Availability Statement

Not applicable.

Conflicts of Interest

The authors declare no conflict of interest.

References

  1. FAO. 2020. Available online: http://www.fao.org/economic/est/est-commodities/citrus-fruit/en/ (accessed on 23 April 2022).
  2. Igual, M.; García-Martínez, E.; Camacho, M.M.; Martínez-Navarrete, N. Stability of Micronutrients and Phytochemicals of Grapefruit Jam as Affected by the Obtention Process. Food Sci. Technol. Int. Cienc. Tecnol. Los Aliment. Int. 2016, 22, 203–212. [Google Scholar] [CrossRef] [PubMed]
  3. Restani, P. Food Supplements Containing Botanicals: Benefits, Side Effects and Regulatory Aspects; Springer International Publishing: Cham, Switzerland, 2017. [Google Scholar]
  4. Schipilliti, L.; Bonaccorsi, I.; Cotroneo, A.; Dugo, P.; Mondello, L. Evaluation of Gas Chromatography−Combustion−Isotope Ratio Mass Spectrometry (GC-C-IRMS) for the Quality Assessment of Citrus Liqueurs. J. Agric. Food Chem. 2013, 61, 1661–1670. [Google Scholar] [CrossRef]
  5. Magbalot-Fernandez, A.; de Guzman, C.C. Phenology of ‘Magallanes’ Pummelo (Citrus maxima) Trees and Its Growth and Development as Influenced by Potassium Nutrition. Asian J. Res. Agric. For. 2019, 3, 1–18. [Google Scholar] [CrossRef]
  6. Tsai, H.I.; Chang, S.C.K.; Chang, S.J. Antioxidant content and free radical scavenging ability of fresh red pummel [Citrus grandis (L.) Osbeck] Juice and Freeze-Dried Products. J. Agric. Food Chem. 2007, 55, 2867–2872. [Google Scholar] [CrossRef]
  7. Gonzalez-Mas, M.C.; Rambla, J.L.; Lopez-Gresa, M.P.; Amparo Blazquez, M.; Granell, A. Volatile compounds in citrus essential oils: A comprehensive review. Front. Plant Sci. 2019, 10, 12. [Google Scholar] [CrossRef] [PubMed]
  8. Tao, N.-G.; Liu, Y.-J. Chemical Composition and Antimicrobial Activity of the Essential Oil from the Peel of Shatian Pummelo (Citrus grandis Osbeck). Int. J. Food Prop. 2012, 15, 709–716. [Google Scholar] [CrossRef]
  9. MetaboAnalyst 5.0. Available online: https://www.metaboanalyst.ca/ (accessed on 23 April 2022).
  10. Wehrens, R.; Mevik, B.H. The pls Package: Principal Component and Partial Least Squares Regression in R. J. Stat. Softw. 2007, 18, 1–23. [Google Scholar]
  11. Sun, H.; Ni, H.; Yang, Y.; Chen, F.; Cai, H.; Xiao, A. Sensory evaluation and gas chromatography-mass spectrometry (GC-MS) analysis of the volatile extracts of pummelo (Citrus maxima) peel. Flavour Fragr. J. 2014, 29, 305–312. [Google Scholar] [CrossRef]
  12. Intekhab, J.; Aslam, M. Isolation of flavonoid from the roots of citrus sinensis. Malays. J. Pharm. Sci. 2009, 7, 1–8. [Google Scholar]
  13. Cordenonsi, L.M.; Sponchiado, R.M.; Campanharo, S.C.; Garcia, C.V.; Raffin, R.P.; Schapoval, E.E.S. Study of flavo-noids present in Pomelo (Citrus máxima) by DSC, UV-VIS, IR, 1H and 13C NMR and MS. Drug Anal. Res. 2017, 1, 31–37. [Google Scholar] [CrossRef]
  14. Sudto, K.; Pornpakakul, S.; Wanichwecharungruang, S. An efficient method for the large scale isolation of naringin from pomelo (Citrus grandis) peel. Food Sci. Technol. 2009, 9, 1737–1742. [Google Scholar] [CrossRef]
  15. Kirtil, E.; Cikrikci, S.; McCarthy, M.J.; Oztop, M.H. Recent advances in time domain NMR & MRI sensors and their food applications. Curr. Opin. Food Sci. 2017, 17, 9–15. [Google Scholar]
  16. Hatzakis, E. Nuclear Magnetic Resonance (NMR) Spectroscopy in Food Science: A Comprehensive Review. Compr. Rev. Food Sci. Food Saf. 2018, 18, 189–220. [Google Scholar] [CrossRef] [Green Version]
  17. Mannu, A.; Poddighe, M.; Garroni, S.; Malfatti, L. Application of IR and UV–VIS spectroscopies and multivariate analysis for the classification of waste vegetable oils. Resour. Conserv. Recycl. 2021, 178, 106088. [Google Scholar] [CrossRef]
  18. Mannu, A.; Karabagias, I.K.; Di Pietro, M.E.; Baldino, S.; Karabagias, V.K.; Badeka, A.V. 13C NMR-Based Chemical Fingerprint for the Varietal and Geographical Discrimination of Wines. Foods 2020, 9, 1040. [Google Scholar] [CrossRef]
  19. Brereton, R.G.; Lloyd, G.R. Partial least squares discriminant analysis: Taking the magic away. J. Chemom. 2014, 28, 213–225. [Google Scholar] [CrossRef]
  20. Ramadan, Z.; Jacobs, D.; Grigorov, M.; Kochhar, S. Metabolic profiling using principal component analysis, discriminant partial least squares, and genetic algorithms. Talanta 2006, 68, 1683–1691. [Google Scholar] [CrossRef]
  21. Westerhuis, J.A.; Hoefsloot, H.C.J.; Smith, S.; Vis, D.J.; Smilde, A.K.; van Velzen, E.J.J.; van Duijnhoven, J.P.M.; van Dorsten, F.A. Assessment of PLSDA cross validation. Metabolomics 2008, 4, 81–89. [Google Scholar] [CrossRef] [Green Version]
  22. Kim, L.C.; Debra, R.; Christèle, R.G.; Philippe, B. A sparse PLS for variable selection when integrating omics data Statistical applications in genetics and molecular biology. Sat. Appli. Genet. Mol. 2008, 7, 1–32. [Google Scholar]
  23. Camacho, J.; Saccenti, E. Group-wise partial least square regression. J. Chemom. 2018, 32, e2964. [Google Scholar] [CrossRef] [Green Version]
  24. Colombani, C.; Croiseau, P.; Fritz, S.; Guilleaume, F.; Legarra, A.; Ducroq, V.; Robert-Granié, C. A comprasion of partial least squares (PLS) and sparse PLS regression in genomic selection in French dairy cattle. J. Dairy Sci. 2012, 95, 2120–2131. [Google Scholar] [CrossRef] [PubMed] [Green Version]
  25. Erik, A. Sparse models by iteratively reweighted feature scaling: A framework for wavelength and sample selection. J. Chemom. 2013, 27, 50–62. [Google Scholar]
  26. Jiménez-Carvelo, A.M.; Martín-Torres, S.; Ortega-Gavilán, F.; Camacho, J. PLS-DA vs. sparse PLS-DA in food tracea-bility. A case study: Authentication of avocado samples. Talanta 2021, 224, 121904. [Google Scholar] [CrossRef] [PubMed]
  27. Mehmood, T.; Liland, K.H.; Snipen, L.; Saebo, S. A review of variable selection methods in partial least squares regression. Chemometr. Intell. Lab. Syst. 2012, 118, 62–69. [Google Scholar] [CrossRef]
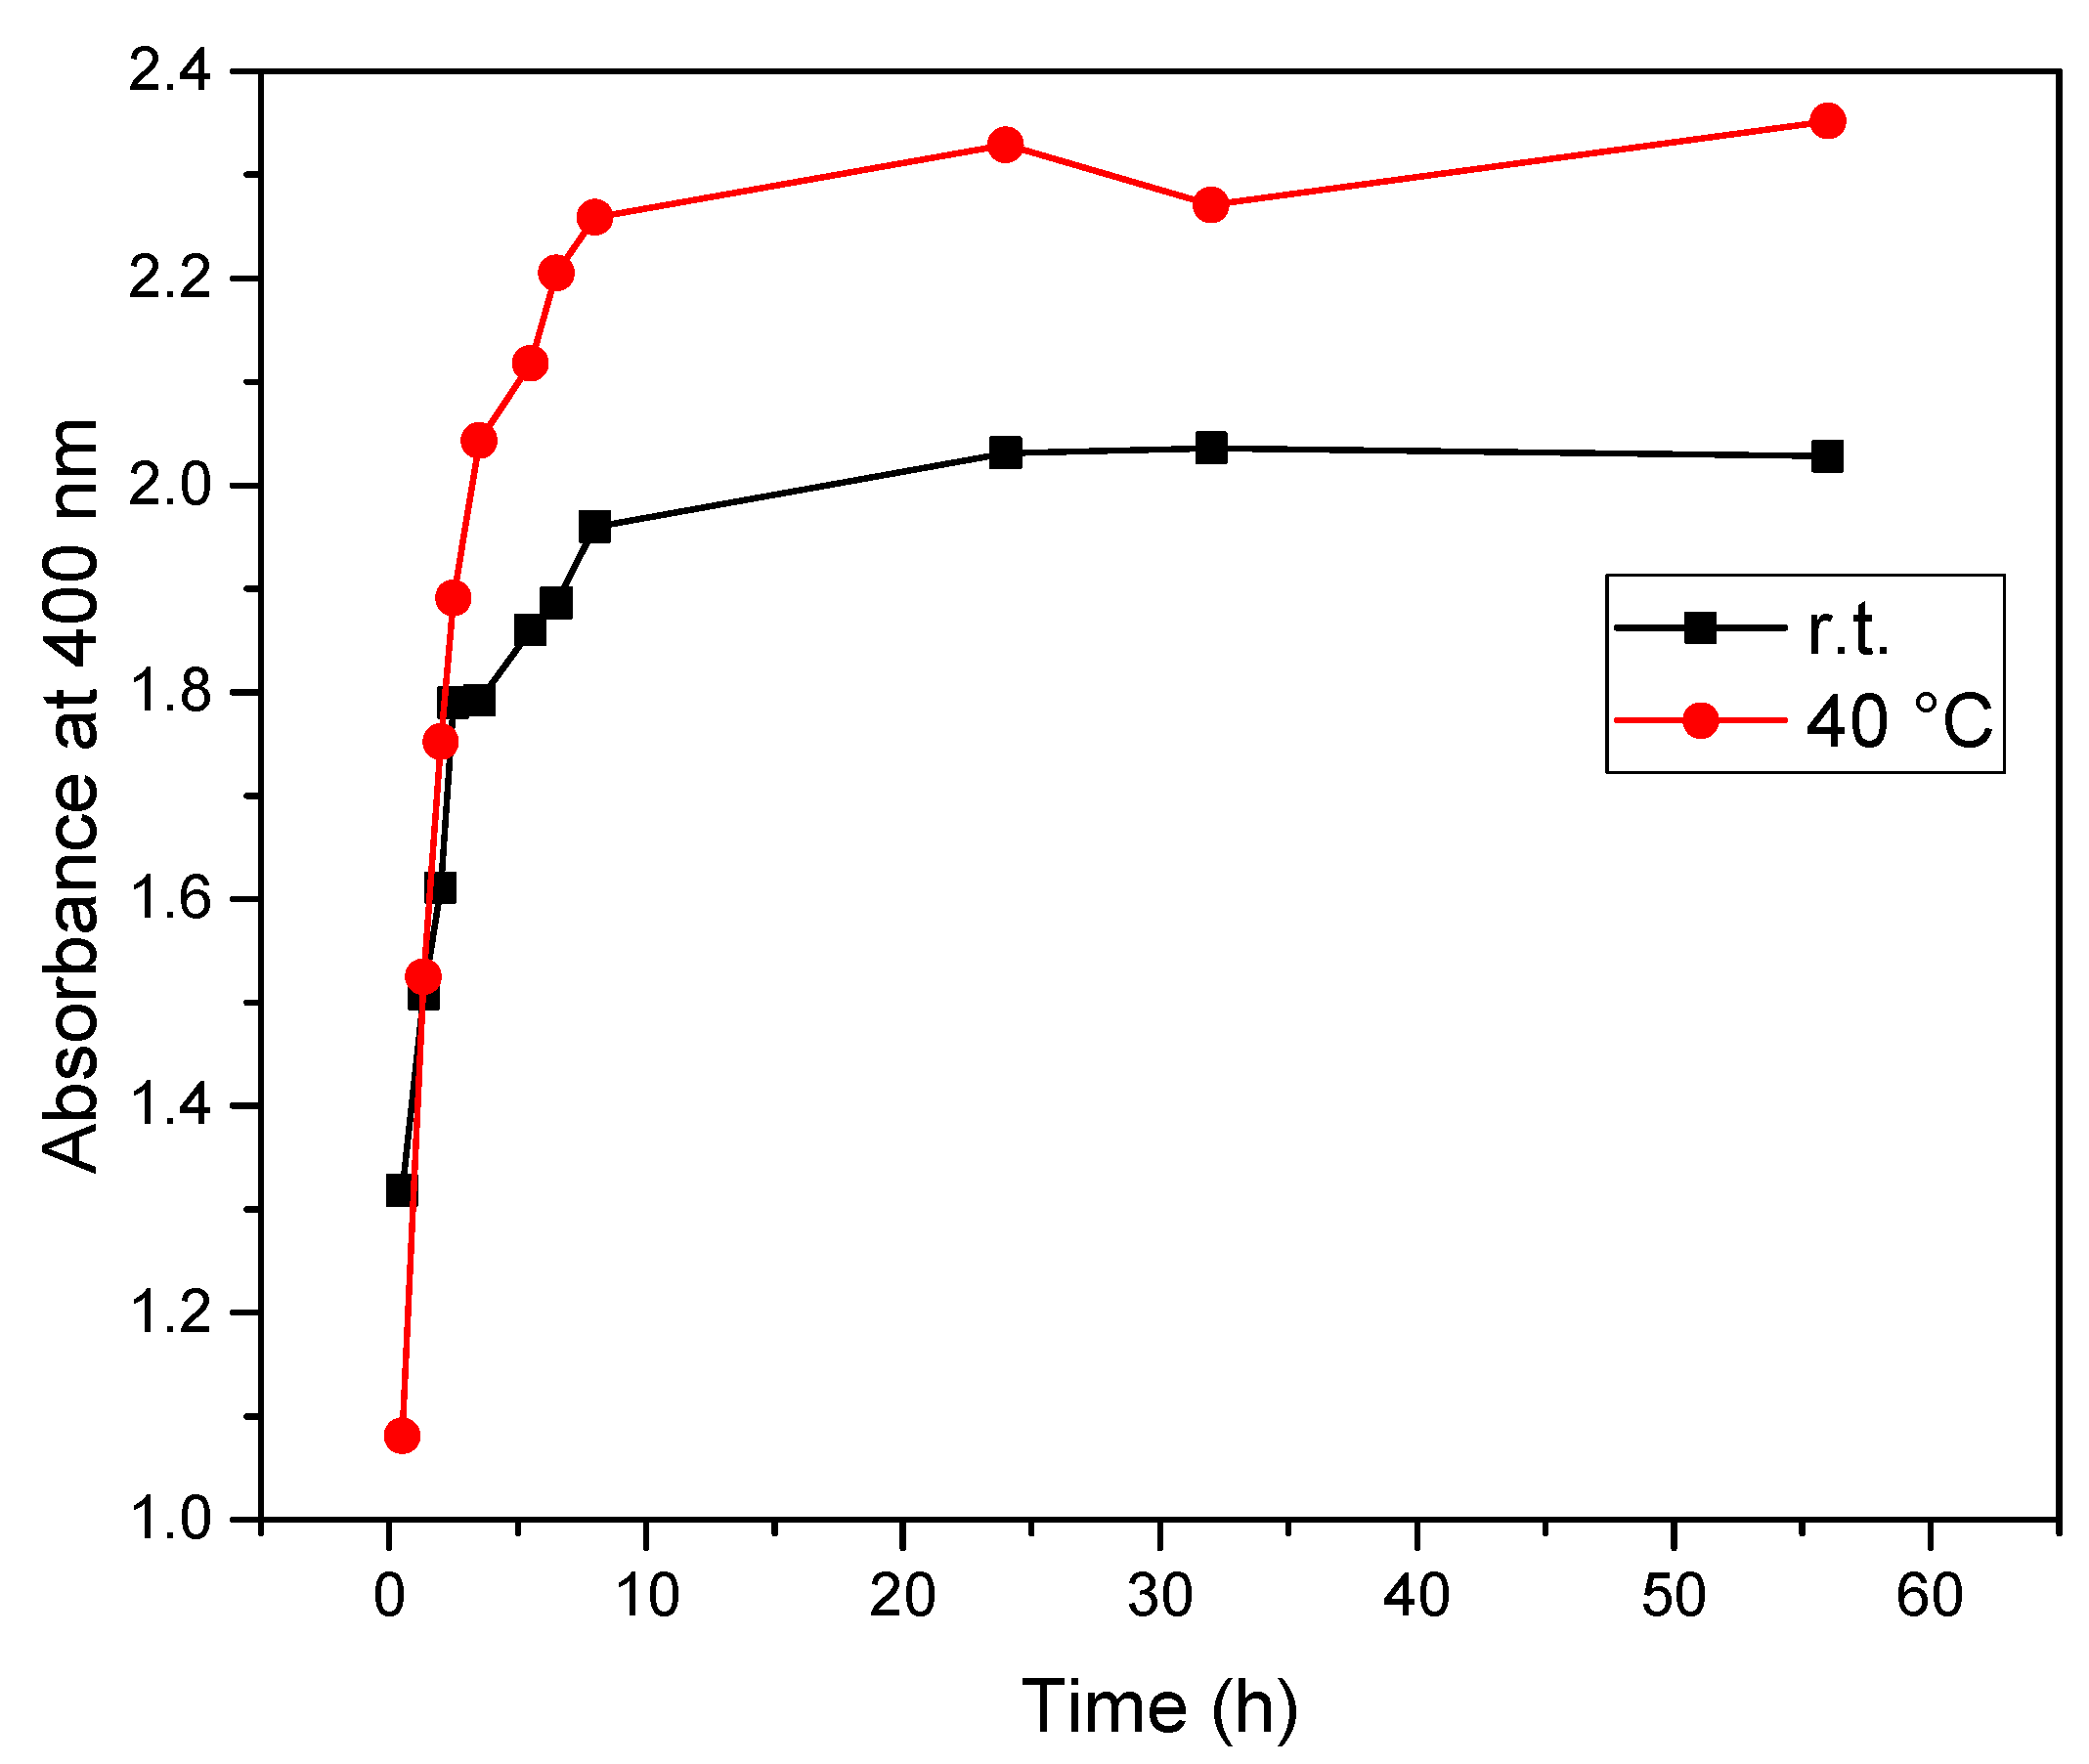
Figure 1. Kinetic profiles at λ = 400 nm at r.t. and 40 °C.
Beverages 08 00034 g001
Figure 2. Representative 1H NMR spectra with water suppression of different pummelo extracts.
Beverages 08 00034 g002
Figure 3. UV–VIS spectra of representative samples A7–A9, B7–B9.
Beverages 08 00034 g003
Figure 4. 2D Scores plot for samples A7–A11, B7–B11, and control samples. The explained variances are shown in brackets.
Beverages 08 00034 g004
Figure 5. 2D PLS-DA scores plot for samples A7–A11, B7–B11, and control samples.
Beverages 08 00034 g005
Figure 6. 2D PLS-DA and s-PLS-DA scores plots for samples A7–A11, B7–B11, and control samples.
Beverages 08 00034 g006
Figure 7. Important features identified by s-PLS-DA. The colored boxes on the right indicate the relative concentrations of the corresponding UV–VIS signals for each category.
Beverages 08 00034 g007
Figure 8. Gas chromatogram obtained by HS-SPME/GC of the pummelo liquor.
Beverages 08 00034 g008
Table 1. Nomenclature of the extracts.
Extract A (r.t.)Extract B (40 °C)Time (h)
A1B10.5
A2B21.3
A3B32.0
A4B42.5
A5B53.5
A6B65.5
A7B76.5
A8B88
A9B924
A10B1032
A11B1156
Publisher’s Note: MDPI stays neutral with regard to jurisdictional claims in published maps and institutional affiliations.

