Article

Alcoholic Fermentation Monitoring and pH Prediction in Red and White Wine by Combining Spontaneous Raman Spectroscopy and Machine Learning Algorithms

St Michelle Wine Estates WSU Wine Science Center, School of Food Science, College of Agricultural, Human, and Natural Resource Sciences, Washington State University, 359 University Drive, Richland, WA 99354, USA
*
Author to whom correspondence should be addressed.
Beverages 2021, 7(4), 78; https://doi.org/10.3390/beverages7040078
Submission received: 19 November 2021 / Revised: 8 December 2021 / Accepted: 10 December 2021 / Published: 13 December 2021
(This article belongs to the Section Wine, Spirits and Oenological Products)

Abstract

:
In the following study, total sugar concentrations before and during alcoholic fermentation, as well as ethanol concentrations and pH levels after fermentation, of red and white wine grapes were successfully predicted using Raman spectroscopy. Fluorescing compounds such as anthocyanins and pigmented phenolics found in red wine present one of the primary limitations of enological analysis using Raman spectroscopy. Unlike the spontaneous Raman effect, fluorescence is a highly efficient process and consequently emits a much stronger signal than spontaneous Raman scattering. For this reason, many enological applications of Raman spectroscopy are impractical as the more subtle Raman spectrum of any red wine sample is in large part masked by fluorescing compounds present in the wine. This work employs a simple extraction method to mitigate fluorescence in finished red wines. Ethanol and total sugars (fructose plus glucose) of wines made from red (Cabernet Sauvignon) and white (Chardonnay, Sauvignon Blanc, and Gruner Veltliner) varieties were modeled using support vector regression (SVR), partial least squares regression (PLSR) and Ridge regression (RR). The results, which compared the predicted to measured total sugar concentrations before and during fermentation, were excellent (R2SVR = 0.96, R2PLSR = 0.95, R2RR = 0.95, RMSESVR = 1.59, RMSEPLSR = 1.57, RMSERR = 1.57), as were the ethanol and pH predictions for finished wines after phenolic stripping with polyvinylpolypyrrolidone (R2SVR = 0.98, R2PLSR = 0.99, R2RR = 0.99, RMSESVR = 0.23, RMSEPLSR = 0.21, RMSERR = 0.23). The results suggest that Raman spectroscopy is a viable tool for rapid and trustworthy fermentation monitoring.

Graphical Abstract

1. Introduction

The Raman effect, first observed by C.V. Raman in 1928, refers to inelastic light scattering upon molecular interaction [1,2]. Elastic and inelastic light scattering are defined as the maintaining or changing of photon frequency, respectively. Since the discovery of the Raman effect, considerable advancements in technology, such as the invention of lasers [3] and photon detection [4] have given rise to Raman spectroscopy. Raman spectroscopy refers to the rapid evaluation of molecular attributes in a sample by observing frequency shifts in a monochromatic light source upon molecular interaction. When the incident light strikes a molecule, most of the photons undergo elastic scattering or Rayleigh scattering. The remaining fraction of photons undergo inelastic scattering or Raman scattering. This increase or decrease in the incident photon energy is detectable as an electromagnetic (EM) shift, more commonly referred to as anti-stokes and stokes shifts, respectively. These changes in photonic energy bring about changes in the associated EM spectrum and are a result of intramolecular oscillations generated when the molecule interacts with a photon. Specific chemical bonds generate specific peaks in the ultraviolet, visible, and near-infrared spectra upon laser excitation, making the Raman spectra of a given molecule unique. The combination of spectral fingerprinting with the expediency of Raman analysis makes Raman spectroscopy an invaluable tool in a wide range of disciplines including pharmaceuticals [5], protein analysis [6], DNA analysis [7], single-cell analysis [8], gemstone identification [9], bone structure analysis [10], and many more.
Developing simple, rapid, and accurate measurement practices is of high importance in any industry, including the wine industry. Enologically speaking, a variety of techniques, including chromatographic [11,12] and spectrophotometric [13,14] methods, are available each with their own drawbacks. In the first approach, beyond the prohibitive initial expense of many chromatography systems, such as high-performance liquid chromatography (HPLC) systems, a high level of expertise is required for proper operation and maintenance. In the second approach, the cost of buffers can dramatically increase the operational costs depending on the application, although that cost pales in comparison to that of chromatographic systems. For this reason, spectrophotometric techniques have grown in popularity in both enological research and industrial applications.
The Raman effect is inherently weak; consequently, traditional Raman spectrometers typically cannot detect molecular concentrations less than a few grams per liter. This makes Raman spectroscopy well suited to circumstances where high concentrations of substrates and products are expected, such as converting sugars to ethanol during alcoholic fermentation. While Raman spectroscopy is potentially advantageous over other instrumentation for alcoholic fermentation monitoring, substantial limitations in this application were observed. The extraction of anthocyanins from red wine grapes during fermentation, as well as their interaction with other phenolic compounds and organic acids during aging, leads to the formation of complex polymeric pigments [15]. In terms of Raman spectroscopy, the presence of these complex polymers and their evolution over time is a significant contributor to overall fluorescence upon laser exposure [16]. While current work for baseline correction in Raman spectra is either mathematical [17] or not reliable for quantification, phenolic removal such as that performed by Ranatunge [18] may prove to be a valid method of fluorescence reduction in the Raman spectrum. Ranatunge effectively and nondestructively reduced the presence of phenol-containing compounds in green tea extracts by exposing samples to polyvinylpolypyrrolidone (PVPP); PVPP exposure is applied to enological processes as well. Mattick and Rice [19] reported the use of PVPP for the decolorization of wine in the colorimetric determination of tartaric acid.
While Raman spectroscopy is used in a wide variety of enologically relevant applications, including spoilage yeast identification [20], methanol and ethanol identification and quantification [21,22], glucose identification and quantification [23], beverage adulteration quantification [24], phenolic identification [25,26], sugar and ethanol quantification [27], beverage aging [28], and wine authentication [29], Raman techniques are scarcely applied directly to wine making. The goal of this study was twofold:
  • Explore ways in which Raman spectroscopy can monitor the alcoholic fermentation of wine grapes;
  • Address ways in which Raman signal obstruction due to fluorescence might be mitigated.

2. Materials and Methods

2.1. Chemicals

Polyvinylpolypyrrolidone (PVPP) was purchased from Central Industrial Sales (Richland, WA, USA).

2.2. Sample Collection

Sauvignon Blanc, Grüner Veltiner, Chardonnay, and Cabernet Sauvignon grapes used in the fermentation component of this study were sourced from commercial and research vineyards in Patterson, Washington, USA during the 2020 vintage. Alcoholic fermentation for whites and reds was conducted at 20 °C and ambient winery temperatures, respectively. Fermentation continued until total reducing sugars were below 0.5 g/L. During fermentation, 15 mL was collected from each tank several times per day and stored at 5 °C. All samples were centrifuged for 5 min at 15,000 revolutions per minute (rpm) prior to both Raman and reference analysis. Red wine samples used for phenolic reduction included Cabernet Sauvignon, Merlot, Petit Verdot, Syrah, and blends. They were also taken from both commercial (Columbia Valley) and research sources with vintages ranging from 2015 to 2019. A total of 541 samples were collected in total.

2.3. Reference Analysis

A total of 254 alcohol concentrations of finished wines were referenced with an Anton Paar Alcolyzer (Anton-Paar, Graz, Austria). A total of 287 total sugar (glucose plus fructose) concentrations of juice and fermenting wines were measured using an Admeo Y15 Automatic Analyzer (Admeo Inc., Angwin, CA, USA) that utilized enzymatic analysis of glucose and fructose. A total of 258 pH values were recorded using a Mettler Toledo SevenCompact S-230 pH meter (Columbus, OH, USA). For alcohol, system integrity was monitored by performing a pass/fail water density check prior to every wine sample run and periodically running a wine sample of known alcohol concentration to ensure accuracy. Prior to each wine sample run, the system was first flushed with 35 mL of the sample to be tested to avoid contamination. For total sugars the Y15 system (Admeo Inc., Angwin, CA, USA) was first calibrated with an external standard provided by Admeo. The system was recalibrated every time a new standard was needed. For every run, the results were compared to a multi-calibration standard provided by Admeo to ensure accuracy. For pH, the system was first calibrated with pH standards (2, 4, 7, and 10) to ensure linearity.

2.4. Raman Analysis

Raman spectra were acquired with a portable B&W Tek i-Raman Plus source (Metrohm group, Herisau, Switzerland) equipped with a 785 nm laser and a cooled charge-coupled detector. A B&W Tek BCR100A accessory accompanied the Raman probe for liquid measuring in a cuvette (1 cm × 1 cm OD). Approximately one milliliter of wine was placed in a cuvette and the spectral acquisitions were recorded with BWSpec 4.11 software provided by B&W Tek. Each spectrum was recorded by averaging five scans at a resolution of 4.5 cm−1 from 65–3350 cm−1. Acquisition time was between 100 to 8000 milliseconds at a constant laser power of 340 mW.

2.5. Phenolic Reduction

Of the 254 alcohol reference samples, 137 were subsampled for PVPP exposure. Briefly, 120 mg of PVPP and 1.5 mL of red wine were added to a 1.5 mL microcentrifuge tube. Samples were then vortexed for 10 min, centrifuged at 15,000 rpm, and filtered through a 0.45-micron nylon filter. The supernatant was extracted and all subsequent sampling was measured using the Raman specifications described above.

2.6. Statistical Analysis

Training and validation for all data sets were conducted using the R Project (4.0.2) for statistical computing and RStudio (version 1.3.1073, release name “Giant Goldenrod”). Prior to model building, all spectral data were scaled using the scale function from the R base package. After preprocessing, optimal values of cost, number of components, and lambda for support vector regression (SVR), partial least squares regression (PLSR), and ridge regression (RR) were determined, respectively. Briefly, training (80 percent of the data) and test (20 percent of the data) subsets were divided after randomizing the full dataset by row. Next training and testing for each possible parameter in a range of set parameters for each algorithm (0.1 to 2.0 in increments of 0.1 for SVR, 2 to 21 in increments of 1 for PLSR, and 0.01 to 0.2 in increments of 0.01 for RR) was executed. This process was repeated five times for each possible parameter and the parameters that produced the lowest root mean squared error and the highest coefficients of determination were used for further testing. After each model was optimized, models for total sugars and ethanol were cross validated by randomizing training and testing sets twenty times.

2.7. Software

For Raman spectra acquisition, BWSpec version 4.11_1 from B&W Tek was used (Metrohm group, Herisau, Switzerland). For all statistical analysis, the R Foundation for Statistical Computing (Vienna, Austria) was used. For SVR, the e1071 package was used; for PLSR, the pls package was used; and, for RR, the ridge package was used.

3. Results and Discussion

3.1. Algorithm Comparison and Feature Selection

Machine learning for quantification is a rapidly expanding field with an ever-expanding number of available algorithms. The purpose of this work was not algorithm exclusion but model integration. For a model to be considered trustworthy, the predictive results should be similar regardless of the algorithm. All three algorithms gave similar predictions for both total sugars and ethanol with neither algorithm outperforming the other exclusively. Similar model performance across the compared algorithms emphasizes model integrity.
Beyond algorithm selection, Raman spectroscopy allows for some flexibility in terms of data filtration. Unlike UV-visible spectroscopy, the Raman spectrum offers a very high native resolution. For this work, different abbreviations for the spectral analysis of ethanol (57:1796 cm−1 and 2803:3362 cm1) and total sugars (57:847 cm−1) were used, as suggested by Teixera et al. [30]. Another more general filtration was also applied (375:3362 cm−1) to compensate for highly fluorescent samples that reached the maximum permitted value cap of the BWSpec software. The more general filtration method performed slightly better although the difference in performance between the filtration methods was negligible. This suggests that the higher native resolution of the Raman effect also permits data to be filtered mathematically by adjusting the parameters of the algorithm.

3.2. Ethanol and Total Sugar Model Performance

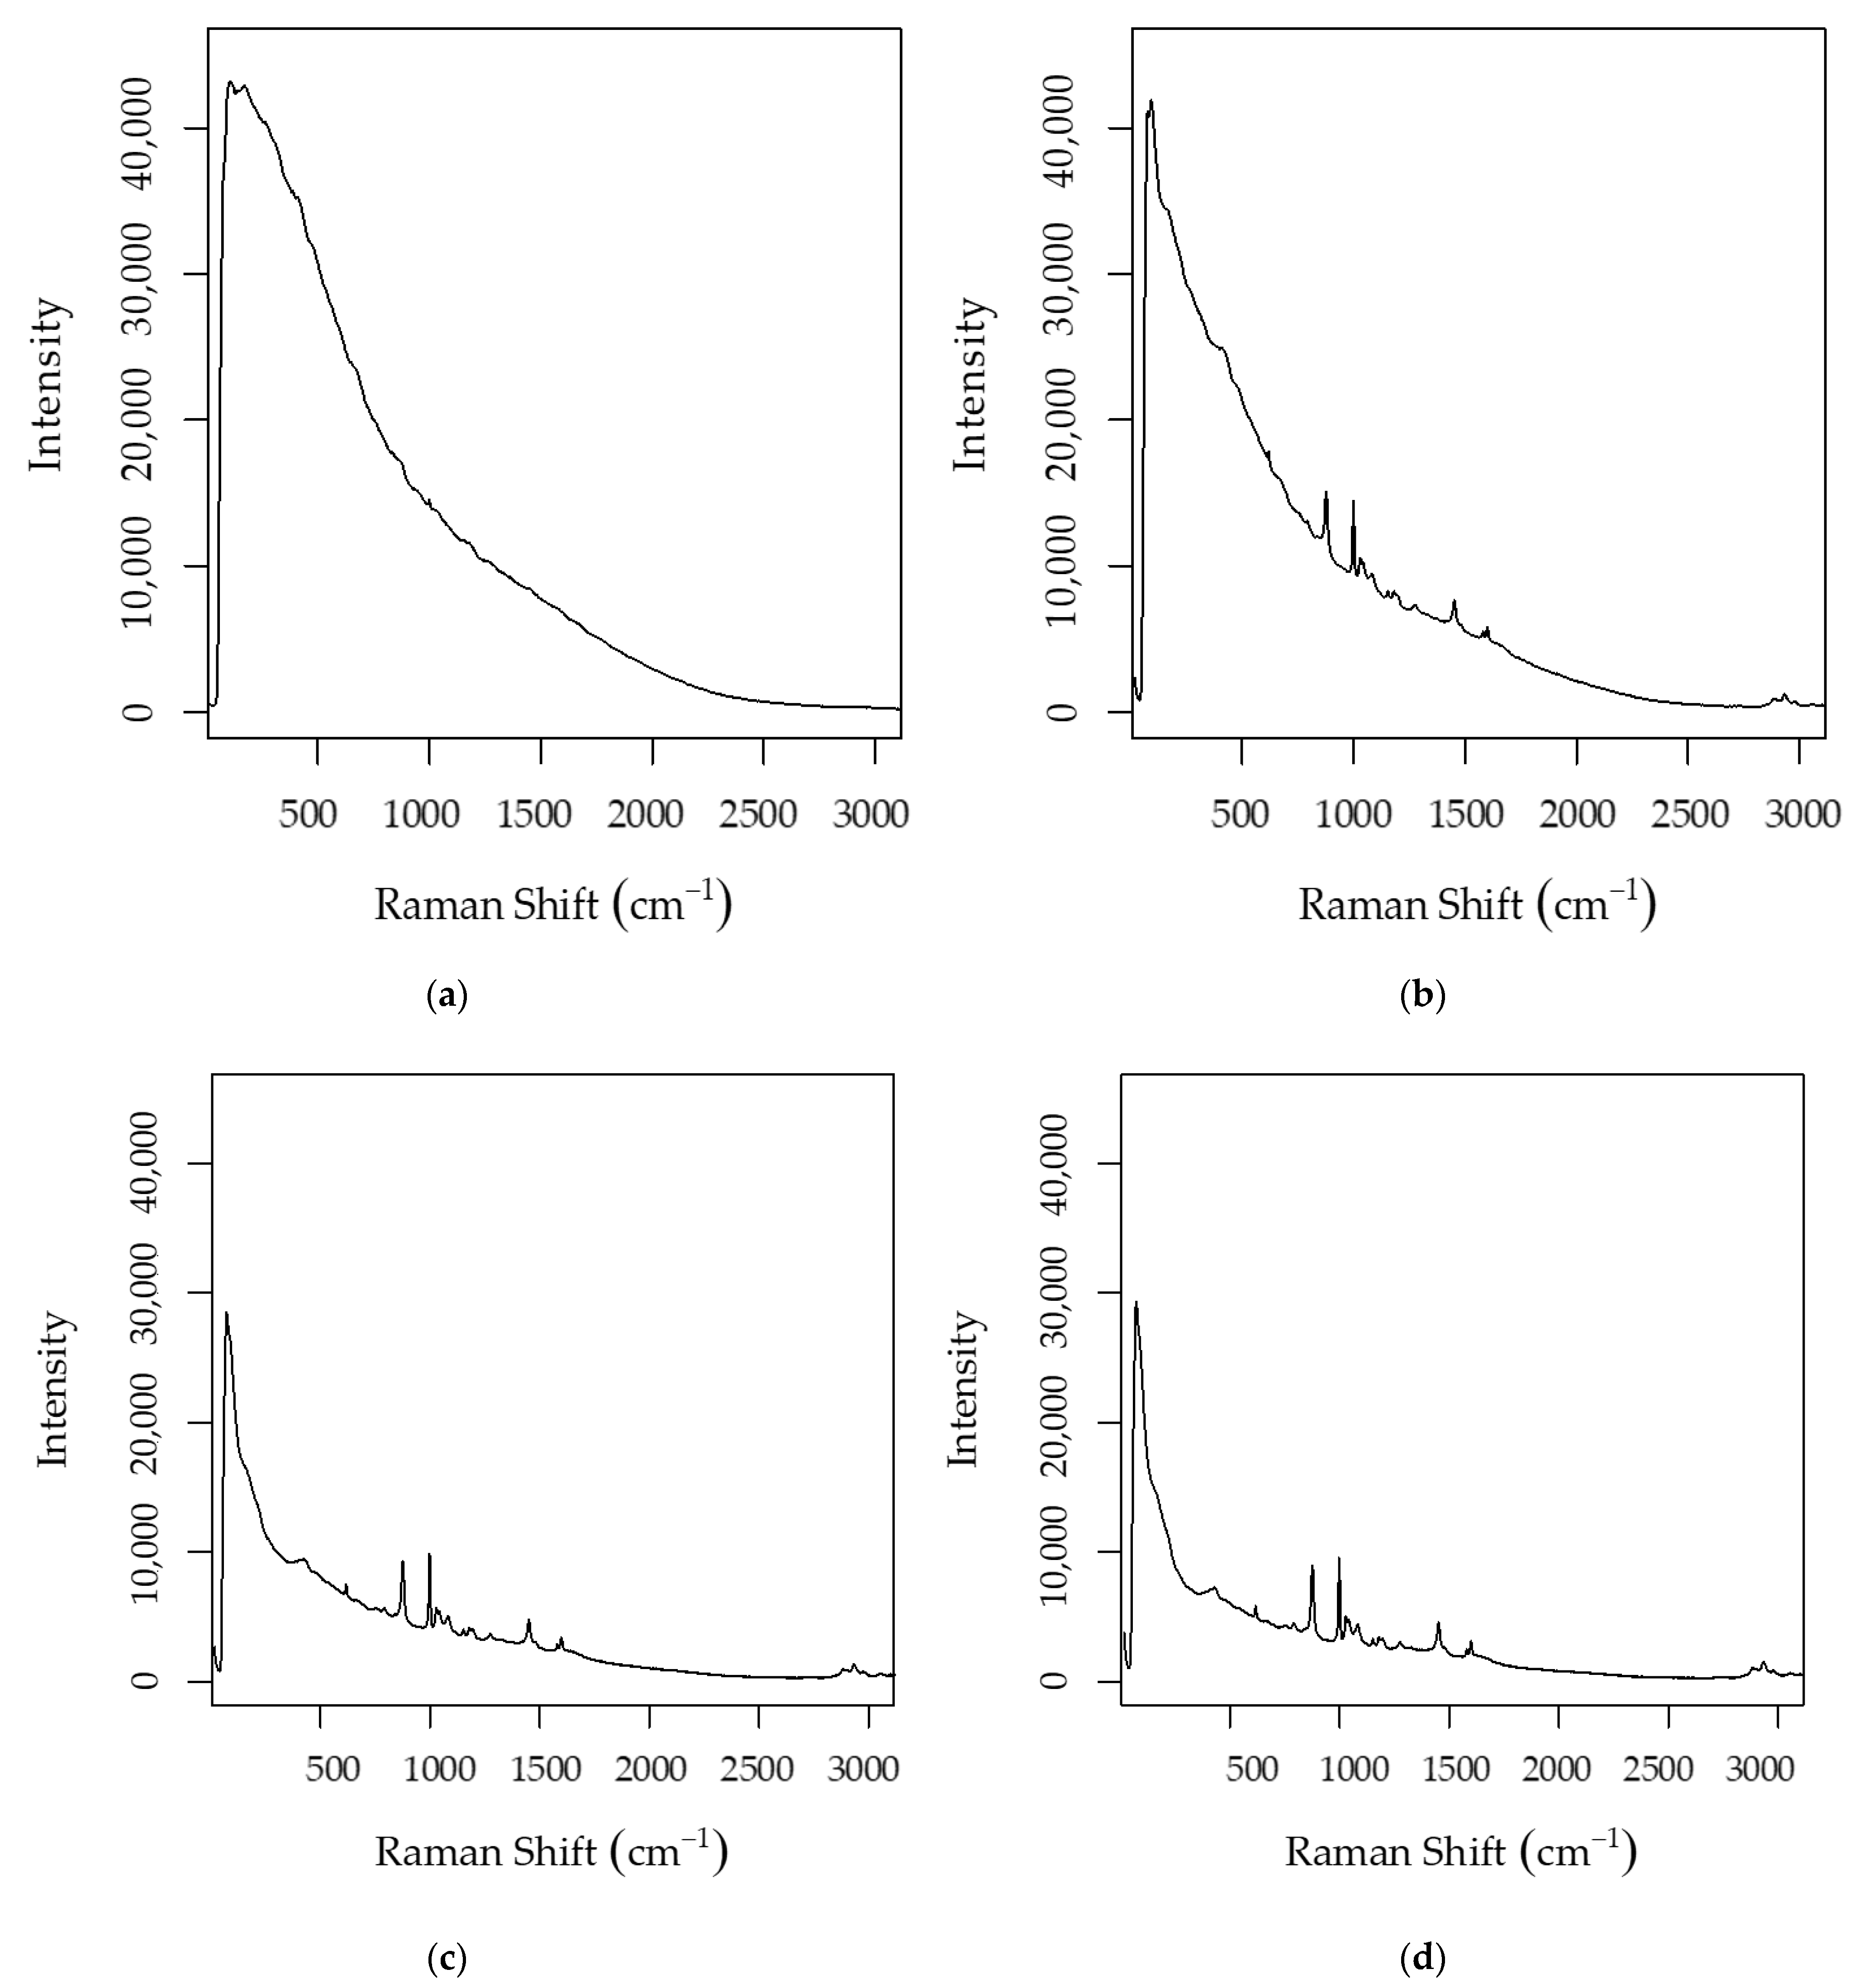
Table 1 shows a summation of model performance for ethanol and pH before exposure to PVPP (left), ethanol and pH after exposure to PVPP (center), and total sugars (right). As shown in the table, total sugar models were well-correlated with all measured values. As sugar models were built prior to or during red wine fermentation, the background interference due to the presence of fluorophores was minimal and any resulting spectral baseline loss was negligible in terms of model performance. Figure 1 shows the Raman spectra of Cabernet Sauvignon and Chardonnay at the initiation of fermentation (Figure 1a,b) and after fermentation (Figure 1c,d), respectively. As shown in the figure, base line loss due to fluorescence significantly increased after fermentation was complete in red wines (Figure 1c).
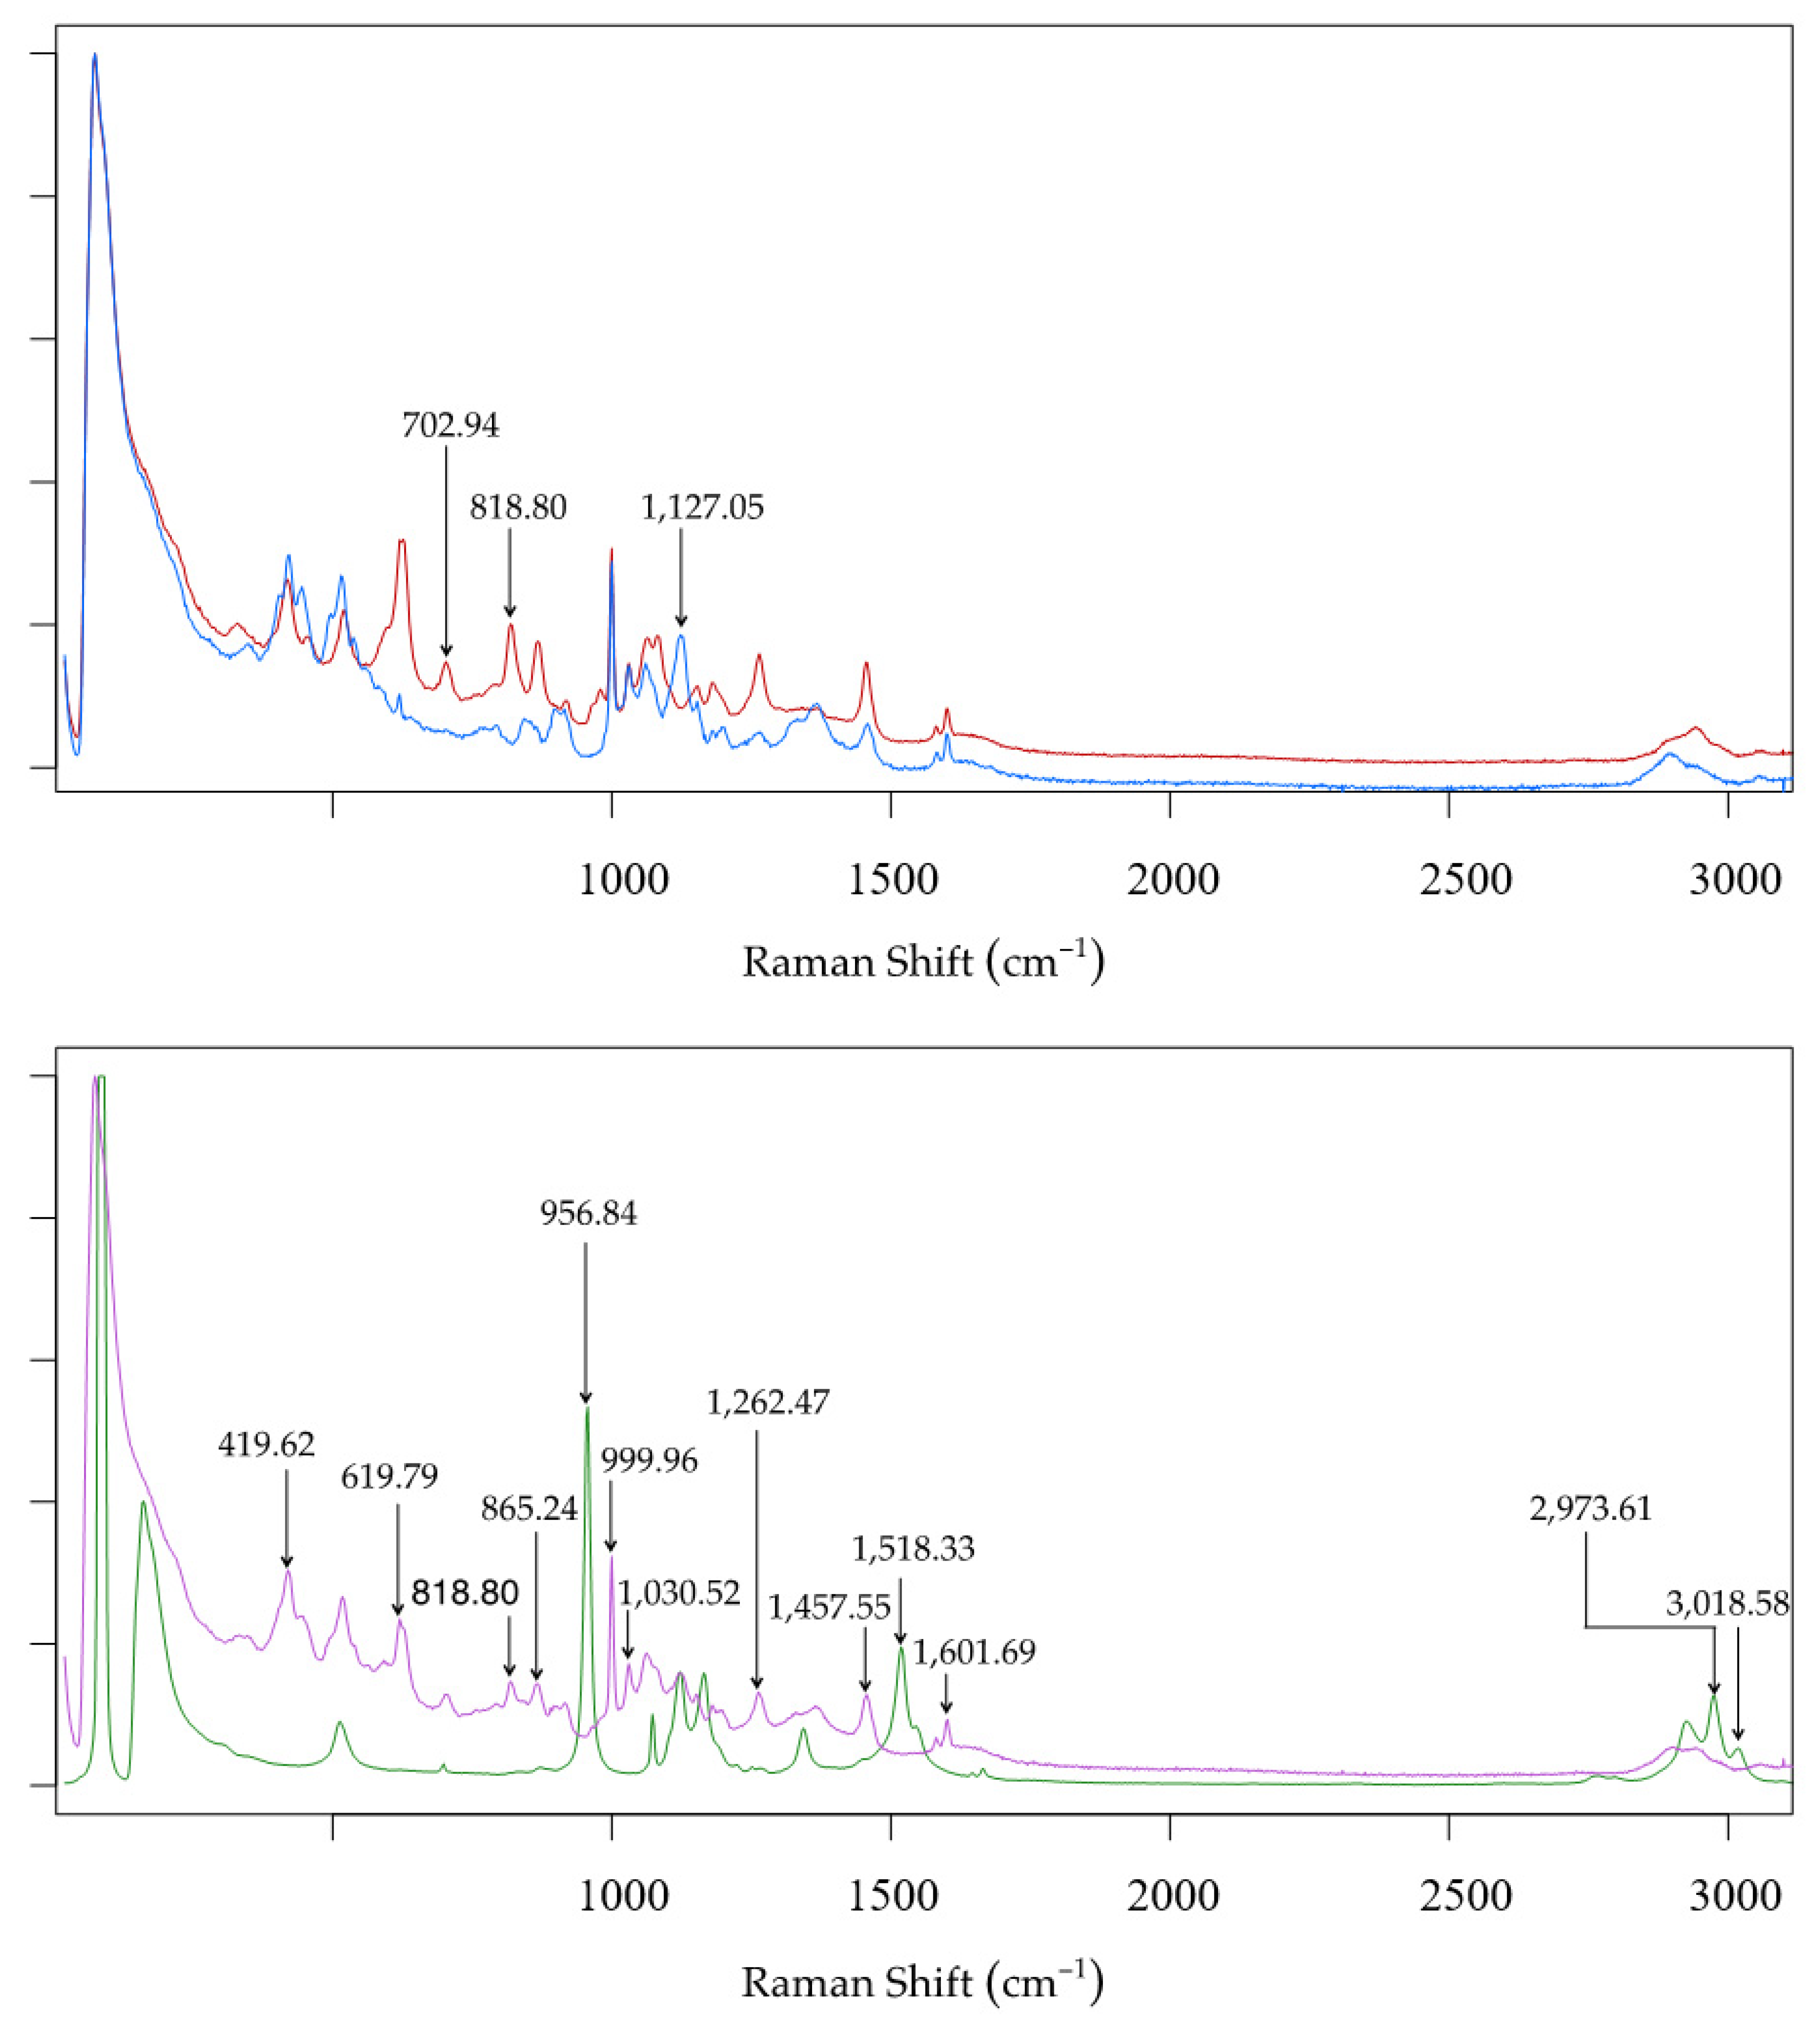
Originally, sugar models were built to predict glucose and fructose separately. Unfortunately, these models did not perform well due to excessive spectral overlap between the sugars (Figure 2, top). As described by Pierna et al. [31], glucose and fructose have similar Raman spectra with several overlapping spectral peaks. This makes reliable quantification much more difficult. Since total sugars calculates both fructose and glucose combined, the effect of overlapping spectra is negated. Ethanol and total sugars on the other hand gave enough unique spectral peaks to maintain their respective model integrities (Figure 2, bottom).

3.2.1. Post Fermentation Baseline Loss

Although ethanol gives a strong Raman signal with a 785 nm laser, many of its spectra were largely masked in this experiment upon laser excitation due to the presence of fluorophores extracted during red wine fermentation and developed as the wine aged [32,33] (anthocyanins and polymeric pigments, respectively). This was not such an issue immediately after fermentation in either the red or white wines, as distinct Raman peaks were still visible (Figure 1c) and the models could be transformed mathematically to yield more accurate predictions.
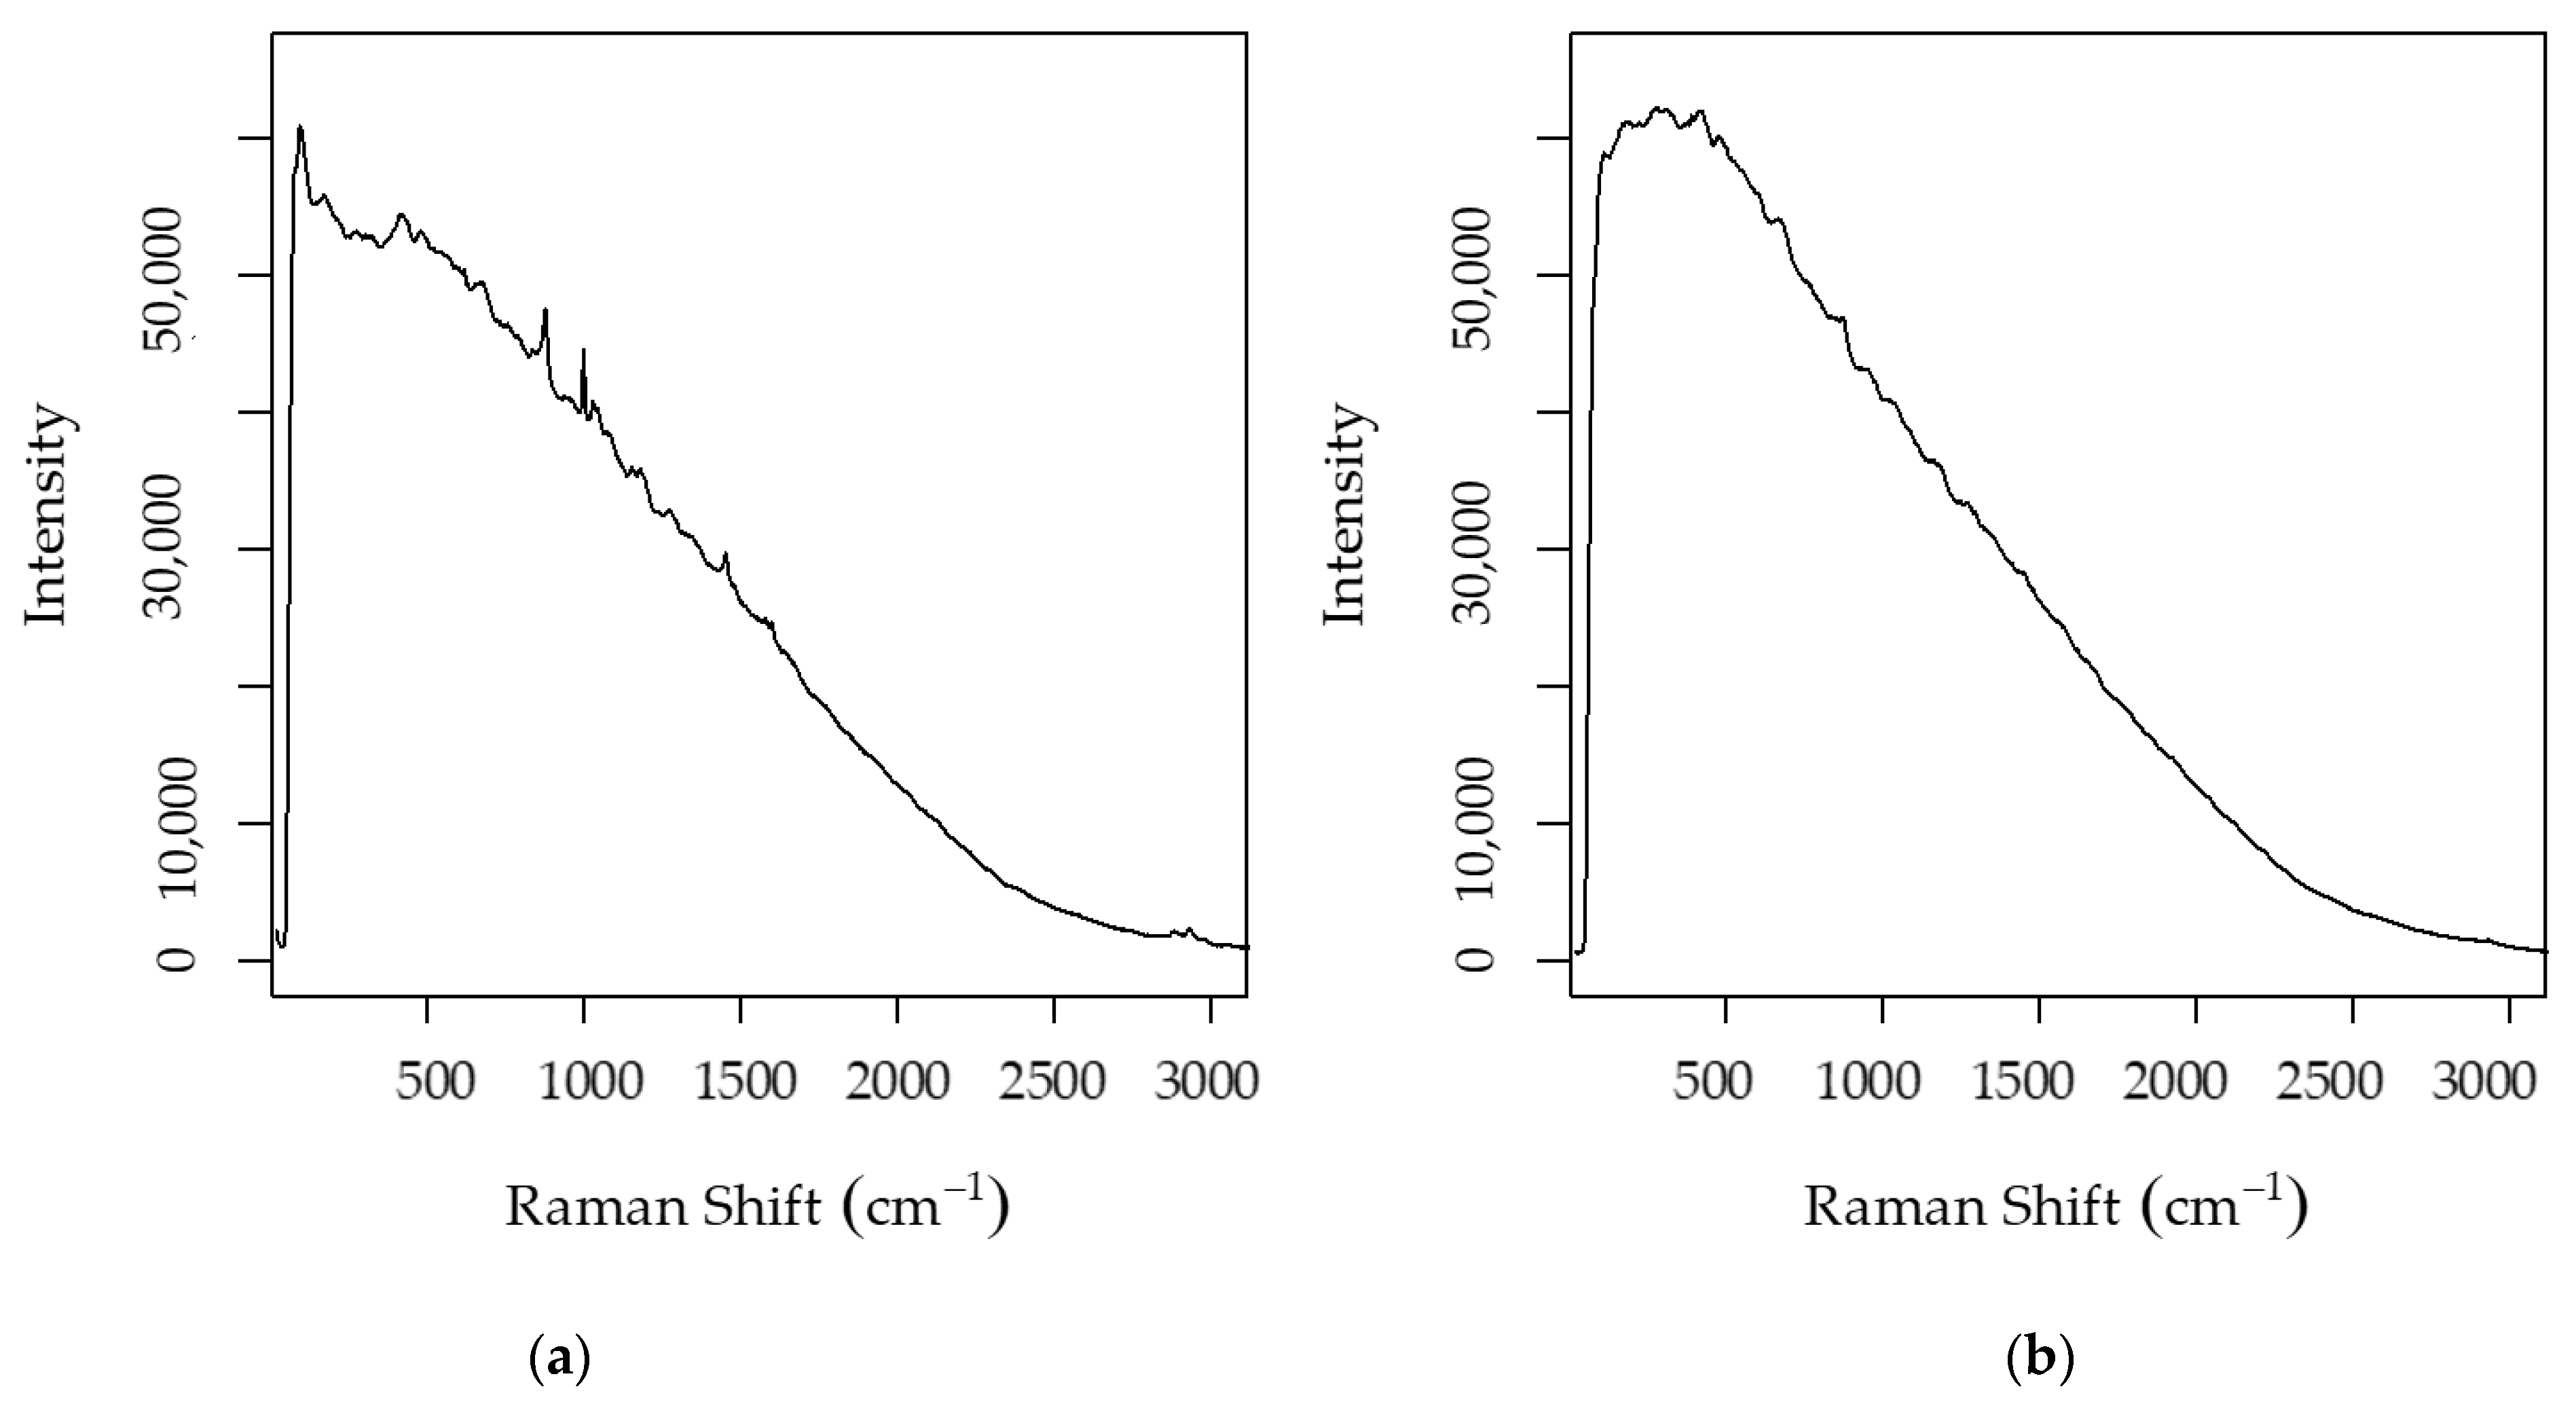
As red wine ages, anthocyanins bond with tannins and other phenolic compounds to form polymeric pigments [34,35]. With increasing pigmentation, the probability of noncovalent bonding between ethanol and the pigments also increases. Hydrogen bonding between ethanol and the pigments potentially reduces the physical flexibility of the ethanol, and hence reduces the probability of any molecular contortions needed to induce Raman scattering. Furthermore, maximum spectral intensities were somewhat positively correlated with recorded polymeric pigment (PP) values but very negatively correlated with wine age when laser exposure time was included as a factor (RPP = 0.51, RVintage = −0.91, data not shown). In other words, as the wine aged and the red wine phenolics formed pigments, their spectral intensities increased, not due to Raman scattering but rather to fluorescence emission (Figure 3). In 2019, Silva et al. [36] reported a significant increase in fluorescence for some anthocyanins upon their absorption onto sepiolite clay. The decreasing Raman intensity coupled with the increasing fluorescence intensity only served to further reduce Raman peak visibility and predictive accuracy.
Although the Raman effect is not directly related to pH, Raman spectroscopy coupled with machine learning was suggested as a novel way to obtain pH values nonetheless [37]. Similar to ethanol, pH measurement accuracy was significantly affected by baseline loss due to fluorescence (Table 1).

3.2.2. Fluorescence Reduction Using Polyvinylpolypyrrolidone (PVPP)

To compensate for baseline loss regardless of the age of the wine, Raman spectroscopy can give reliable predictions for ethanol and pH in red wine if the samples are first filtered with polyvinylpolypyrrolidone (PVPP). Figure 2 shows the effect of PVPP filtration on the red wine Raman spectra at different concentrations of PVPP. As shown in the Figure 4, at 67 mg/L of PVPP, baseline loss due to fluorescence is greatly reduced, yielding clearly visible Raman peaks and highly accurate predictive models for both ethanol and pH (Table 1).
Where the original work of Ranatunge et al. [18] used PVPP packed columns for filtration, this work found that filtration results were more repeatable if the sample containing PVPP was placed in a micocentrifuge tube, vortexed, and only the supernatant was used for Raman analysis. By using only the supernatant of the PVPP filtered samples, any potential spectral interference or increase in standard deviation due to intermolecular or intramolecular bonding between wine phenolics and PVPP was avoided.

3.3. Limitations of Supervised Models

Ethanol, pH, and total sugar models were supervised models, meaning they were built as a means of approximating some established form of measurement. For ethanol, models were built using the Anton Paar Alcolyzer. The near-infrared (NIR) spectrum of ethanol [38] as is utilized by a certain patented method with the Alcolyzer (https://www.laboaragon.com/docs/marcas/anton-paar/Alcolyzer%20Wine.pdf, last accessed on 9 December 2021) presents several potential overlaps with the NIR spectra of other compounds that may be present in any given wine sample, including methanol [39], glucose, fructose, and water [40]. While the Raman spectrum of ethanol does overlap at some points with sugars such as glucose and fructose, the native high resolution of the Raman spectrum allows for the negation of overlapping peaks without sacrificing model accuracy. As for total sugars, models were built with measurements obtained using a BioSystems Admeo Y15. Beyond time constraints, the utilization of enzymatic reactions has a fairly low limit of linearity (8 g/L), according to the website of the company (https://cdn.accentuate.io/4486617071682/11567497445442/Enology-Brochure-19-v1585857897992.pdf, last accessed on 9 December 2021). While spontaneous Raman spectroscopy is admittedly insensitive, the utilization of multivariate regression models allows for rapid, accurate sugar predictions at a broader range than the enzymatic methods applied by BioSystems. As for pH, the accuracy of the measurement using traditional meters can vary greatly depending on electrode type, buffer type, and frequency of calibration [41]. The post PVPP Raman model for pH which was tested here, offers reliable measurements (RMSEPSVR,PLSR,RR = 0.12) with less potential error. While Raman spectroscopy is used for wine authentication [42] and classification [43] purposes, this work suggests that Raman spectroscopy can also be applied quantitatively to wine as well. Future work should focus on building unsupervised Raman models for ethanol and sugar measurements as they will offer more accurate measurements with a greater rapidity than the other methods currently in use.

4. Conclusions

Raman analysis of ethanol, pH, and total sugars in wine offers a low-latency alternative to other commonly used forms of analysis during and after fermentation. While the detection limit for spontaneous Raman spectroscopy is well above the average concentrations of common wine components such as organic acids, this is actually advantageous in building predictive models for compounds in greater abundance, such as ethanol and total sugars, as it avoids some spectral interference. Additionally, the high native resolution and minimal sample preparation needed for Raman spectroscopy prioritizes the construction of unsupervised Raman models for total sugars in fermenting wines, and ethanol and pH levels in finished wines, as it avoids some potential spectral interference issues present with some current methods. Red wines present a unique challenge in Raman modeling as pigmented phenolics are the primary source of fluorescence that masks the more subtle Raman spectra. Moreover, the intensity of the fluorescence increases as the wine ages. This can be easily overcome by removing large phenolic polymers with polyvinylpolypyrrolidone (PVPP). In conclusion, while Raman spectroscopy is widely applied across many industries, Raman spectroscopy for enological quantification is a budding field. Surface-enhanced Raman spectroscopy (SERS), spatially offset Raman spectroscopy (SORS), ultraviolet (UV) Raman spectroscopy, and photoacoustic Raman spectroscopy (PARS) represent only a fraction of the many possible applications of vibrational spectroscopy that are yet to be fully explored in both viticultural and enological applications.

Author Contributions

Conceptualization and methodology, J.H. and C.B.; experimental work, H.F.; software, validation, and formal analysis, H.F. and C.B.; investigation and resources, J.H. and C.B.; data curating, C.B.; writing—original draft preparation, H.F. and C.B.; writing—review and edition, J.H.; visualization, C.B.; supervision, J.H.; project administration, J.H.; funding acquisition, J.H. All authors have read and agreed to the published version of the manuscript.

Funding

This research was funded by the Washington Research Advisory Committee, the Washington Wine Commission and the Washington Grape and Wine Research Program, grant number WRAC 2019-2.EN.HJ1.

Institutional Review Board Statement

Not applicable.

Informed Consent Statement

Not applicable.

Data Availability Statement

Data are available upon request.

Conflicts of Interest

The authors declare no conflict of interest.

References

  1. Banerjee, S.C.V. Raman and colonial physics: Acoustics and the quantum. Phys. Perspect. 2014, 16, 146–178. [Google Scholar] [CrossRef]
  2. Raman, C.V.; Krishnan, K.S. A new type of secondary radiation. Nature 1928, 121, 501–502. [Google Scholar] [CrossRef]
  3. Radziemski, L.; Cremers, D. A Brief history of laser-Induced breakdown spectroscopy: From the concept of atoms to LIBS 2012. Spectrosc. Acta B 2013, 87, 3–10. [Google Scholar] [CrossRef]
  4. Huang, W.E.; Li, M.; Jarvis, B.M.; Goodacre, R.; Banwart, S.A. Shining light on the microbial world: The application of Raman microspectroscopy. Adv. Appl. Microbiol. 2010, 70, 153–186. [Google Scholar]
  5. Fini, G. Application of Raman spectroscopy in pharmacy. J. Raman Spectrosc. 2004, 35, 335–337. [Google Scholar] [CrossRef]
  6. Bunaciu, A.A.; Aboul-Enein, H.Y.; Hoang, V.D. Raman spectroscopy for protein analysis. Appl. Spectrosc. Rev. 2015, 50, 377–386. [Google Scholar] [CrossRef]
  7. Pyrak, E.; Kajczewski, J.; Kowalik, A.; Kubelski, A.; Jaworska, A. Surface enhanced Raman spectroscopy for DNA biosensors—How far are we? Molecules 2019, 24, 4423. [Google Scholar] [CrossRef] [PubMed] [Green Version]
  8. Strohm, E.M.; Moore, M.J.; Kolios, M.C. High resolution ultrasound and photoacoustic imaging of single cells. Photoacoustics 2016, 4, 36–42. [Google Scholar] [CrossRef] [Green Version]
  9. Jenkins, A.; Larsen, R. Gemstone identification using Raman spectroscopy. Spectroscopy 2004, 19, 20–25. [Google Scholar]
  10. Nieuwoudt, M.K.; Shahlori, R.; Naot, D.; Patel, R.; Holtkamp, H.; Aguergaray, C.; Watson, M.; Musson, D.; Brown, C.; Dalbeth, N.; et al. Raman spectroscopy reveals age- and sex-related differences in cortical bone from people with osteoarthritis. Sci. Rep. 2020, 10, 19443. [Google Scholar] [CrossRef]
  11. Gomez-Alonso, S.; Garcia-Romero, E.; Hermosin-Gutierrez, I. HPLC analysis of diverse grape and wine phenolics using direct injection and multidetecion by DAD and fluorescence. J. Food Comp. Anal. 2007, 20, 618–626. [Google Scholar] [CrossRef]
  12. Cordella, C.; Moussa, I.; Martel, A.C.; Sbirrazzuoli, N.; Lizzani-Cuvelier, L. Recent developments in food characterization and adulteration detection: Technique-oriented perspectives. J. Agric. Food Chem. 2002, 50, 1751–1764. [Google Scholar] [CrossRef]
  13. Aleixandre-Tudo, J.L.; Buica, A.; Nieuwoudt, H.; Aleixandre, J.L.; Toit, W. Spectrophotometric analysis of phenolic compounds in grapes and wines. J. Agric. Food Chem. 2017, 65, 4009–4026. [Google Scholar] [CrossRef] [PubMed]
  14. Philippidis, A.; Poulakis, E.; Kontzedaki, R.; Orfanakis, E.; Symianaki, A.; Zoumi, A.; Velegrakis, M. Application of ultraviolet-visible absorption spectroscopy with machine learning techniques for the classification of cretan wines. Foods 2021, 10, 9. [Google Scholar] [CrossRef]
  15. Skogerson, K.; Downey, M.; Mazza, M.; Boulton, R. Rapid determination of phenolic components in red wines from UV-visible spectra and the method of partial least squares. Am. J. Enol. Vit. 2007, 58, 318–325. [Google Scholar]
  16. Chase, D.B. Fourier transform Raman spectroscopy. J. Am. Chem. Soc. 1986, 108, 7485–7488. [Google Scholar] [CrossRef]
  17. Guo, S.; Chernavskaia, O.; Popp, J.; Bockiltz, T. Spectral reconstruction of shift-excitation Raman difference spectroscopy. Talanta 2018, 186, 372–380. [Google Scholar] [CrossRef] [PubMed]
  18. Ranatunge, I.; Adikary, S.; Dasanayake, P.; Fernando, C.D.; Soysa, P. Development of a rapid and simple method to remove polyphenols from plant extracts. Int. J. Anal. Chem. 2017, 2017, 7230145. [Google Scholar] [CrossRef] [Green Version]
  19. Mattick, L.R.; Rice, A.C. The use of PVPP of decolorizing wine in the determination of tartrate by metavanadate method. Am. J. Enol. Vit. 1981, 32, 297–298. [Google Scholar]
  20. Rodriguez, S.B.; Thornton, M.A.; Thornton, R.J. Raman Spectroscopy and chemometrics for identification and strain discrimination of the wine spoilage yeasts Saccharomyces cerevisiae, Zygosaccharomyces bailii, and Brettanomyces bruxellensis. App. Environ. Micro. 2013, 79, 6264–6270. [Google Scholar] [CrossRef] [Green Version]
  21. Frausto-Reyes, C.; Medina-Gutierrez, C.; Sato-Berru, R.; Sahagun, L.R. Qualitative study of ethanol content in tequila by Raman spectroscopy and principal components analysis. Spectrosc. Acta A 2005, 61, 2657–2662. [Google Scholar] [CrossRef] [PubMed]
  22. Boyaci, I.H.; Genis, H.E.; Guven, B.; Tamer, U.; Alper, N. A novel method for quantification of ethanol and methanol in distilled alcoholic beverages using Raman spectroscopy: Simultaneous detection of ethanol and methanol. J. Raman Spectrosc. 2012, 43, 1171–1176. [Google Scholar] [CrossRef]
  23. Delfino, I.; Camerlingo, C.; Portaccio, M.; Ventura, B.D.; Mita, L.; Mita, D.G.; Lepore, M. Visible micro-Raman spectroscopy for determining glucose content in beverage industry. Food Chem. 2011, 127, 735–742. [Google Scholar] [CrossRef]
  24. Richardson, P.I.C.; Muhamadali, H.; Ellis, D.I.; Goodacre, R. Rapid Quantification of the adulteration of fresh coconut water by dilution and sugars using Raman spectroscopy and chemometrics. Food Chem. 2019, 272, 157–164. [Google Scholar] [CrossRef]
  25. Pompeu, D.R.; Larondelle, Y.; Rogez, H.; Abbas, O.; Pierna, J.A.F.; Baeten, V. Characterization and discrimination of phenolic compounds using fourier transform Raman spectroscopy and chemometric tools. Biotechnol. Agron. Soc. Environ. 2018, 22, 13–28. [Google Scholar]
  26. Wu, Z.; Xu, E.; Long, J.; Pan, X.; Xu, X.; Jin, Z.; Jiao, A. Comparison between ATR-IR, Raman, concatenated ATR-IR and Raman spectroscopy for the determination of total antioxidant capacity and total phenolic content of chinese rice wine. Food Chem. 2016, 194, 671–679. [Google Scholar] [CrossRef] [PubMed]
  27. Wang, Q.; Li, Z.; Ma, Z.; Liang, L. Real time monitoring of multiple components in wine fermentation using an on-line suto-calibration Raman spectroscopy. Sens. Actuators B 2014, 202, 426–432. [Google Scholar] [CrossRef]
  28. Ramírez-Elías, M.G.; Guevara, E.; Zamora-Pedraza, C.; Rogelio Aguirre, J.R.; Juárez, B.I.F.; Bárcenas-Pezos, G.M.; Ruiz, F.; González, F.J. Assessment of mezcal aging combining Raman spectroscopy and multivariate analysis. Biomed. Spectrosc. Imaging 2017, 6, 75–81. [Google Scholar] [CrossRef]
  29. Magdas, D.A.; Guyon, F.; Feher, I.; Pinzaru, S.C. Wine Discrimination based on chemometric analysis of untargeted markers using FT-Raman spectroscopy. Food Control 2018, 85, 385–391. [Google Scholar] [CrossRef]
  30. Teixera dos Santos, C.A.; Pascoa, R.N.M.J.; Porto, P.A.L.S.; Cerdeira, A.L.; Gonzalez-Saiz, J.M.; Pizarro, C.; Lopes, J.A. Raman spectroscopy for wine analysis: A comparison with near and mid infrared spectroscopy. Talanta 2018, 186, 306–314. [Google Scholar] [CrossRef] [PubMed]
  31. Pierna, J.A.F.; Abbas, O.; Dardenne, P.; Baeten, V. Discrimination of Corsican honey by FT-Raman spectroscopy and chemometrics. Biotechnol. Agron. Soc. Environ. 2011, 15, 75–84. [Google Scholar]
  32. Agati, G.; Matteini, P.; Oliveira, J.; de Freitas, V.; Mateus, N. Fluorescence approach for measuring anthocyanins and derived pigments in red wine. J. Agric. Food Chem. 2013, 61, 10156–10162. [Google Scholar] [CrossRef]
  33. Poustka, F.; Irani, N.G.; Feller, A.; Lu, Y.; Pourcel, L.; Frame, K.; Grotewold, E. Trafficking pathway for anthocyanins overlaps with the endoplasmic reticulum-to-vacule protein-sorting route in Arabidopsis and continues to the formation of vacuolar inclusions. Plant Phys. 2007, 145, 1323–1335. [Google Scholar] [CrossRef] [PubMed] [Green Version]
  34. Somers, T.C. The polymeric nature of wine pigments. Phytochemistry 1971, 10, 2175–2186. [Google Scholar] [CrossRef]
  35. Fe, H.; Na-na, L.; Duan, C.Q. Anthocyanins and their variation in red wines II: Anthocyanin derived pigments and their color evolution. Molecules 2012, 17, 1483–1519. [Google Scholar]
  36. Silva, G.T.M.; da Silva, K.M.; Silva, C.P.; Rodigues, A.C.B.; Oake, J.; Gehlen, M.H.; Bohne, C.; Quina, F.H. Highly fluorescent hybrid prigments from anthocyanin- and red wine pyranoanthocyanin- analogs absorbed on sepiolite clay. Photochem. Photobiol. Sci. 2019, 18, 1750–1760. [Google Scholar] [CrossRef] [PubMed]
  37. Lackey, H.E.; Nelson, G.L.; Lines, A.M.; Bryan, S.A. Reimagining pH measurements; utilizing Raman spectroscopy for enhanced accuracy in phosphoric acid systems. Anal. Chem. 2020, 92, 5882–5889. [Google Scholar] [CrossRef] [PubMed]
  38. Fu, Q.; Wang, J.; Lin, G.; Suo, H.; Zhao, C. Short-wave near-infrared spectrometer for alcohol determination and temperature correction. J. Anal. Methods Chem. 2012, 2012, 728128. [Google Scholar] [CrossRef]
  39. Fernandes, H.L.; Raimundo, I.M., Jr.; Pasquino, C.; Rohwedder, J.J.R. Simultaneous determination of methanol and ethanol in gasoline using NIR spectroscopy: Effect of gasoline composition. Talanta 2008, 75, 804–810. [Google Scholar] [CrossRef] [PubMed]
  40. Golic, M.; Walsh, K.; Lawson, P. Short-wavelength near-infrared spectra of sucrose, glucose, and fructose with respect to sugar concentration and temperature. Appl. Spectrosc. 2003, 57, 139–145. [Google Scholar] [CrossRef] [PubMed]
  41. Cheng, K.L.; Da-Ming, Z. On calibration of pH meters. Sensors 2005, 5, 209–219. [Google Scholar] [CrossRef]
  42. Magdas, D.A.; Cozar, B.I.; Feher, I.; Guyon, F.; Dehelean, A.; Pinzaru, S.C. Testing limits of FT-Raman spectroscopy for wine authentication: Cultivar, geographical origin, vintage and terroir effect influence. Sci. Rep. 2019, 9, 19954. [Google Scholar] [CrossRef] [PubMed]
  43. Zanuttin, F.; Gurian, E.; Ignat, I.; Fornasaro, S.; Calabretti, A.; Bigot, G.; Bonifacio, A. Characterization of white wines from north-eastern Italy with surface-enhanced Raman spectroscopy. Talanta 2019, 203, 99–105. [Google Scholar] [CrossRef]
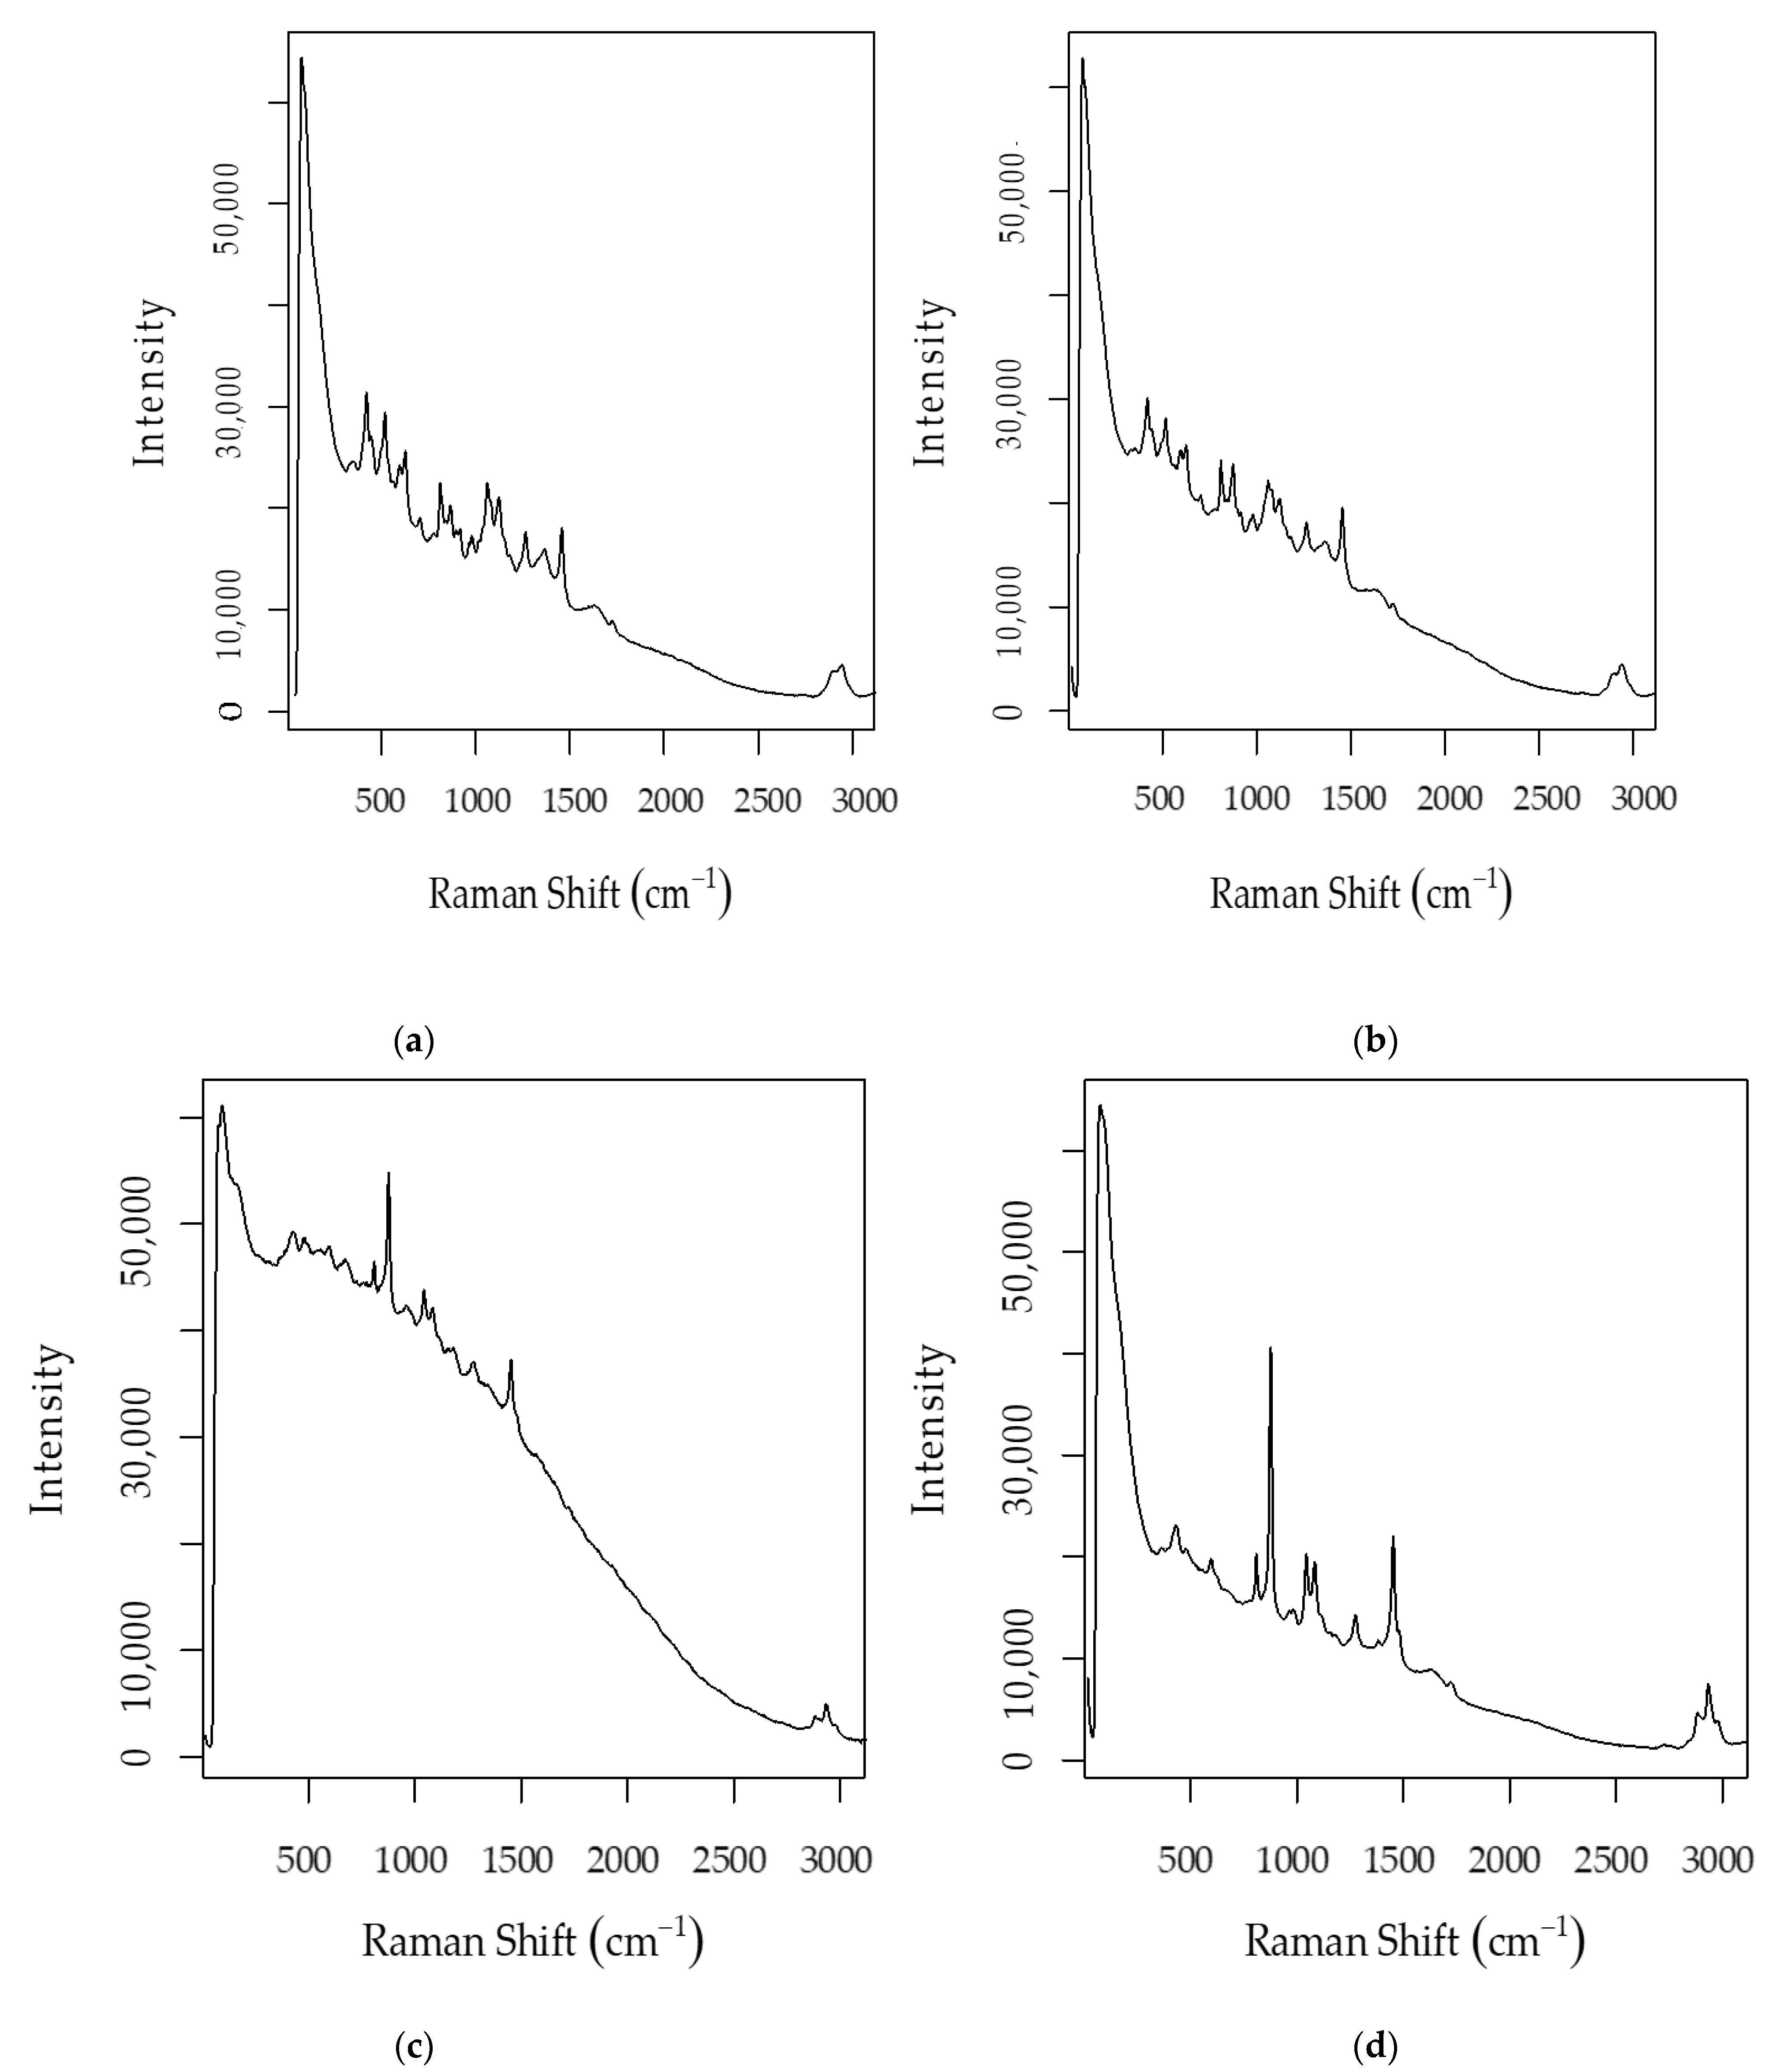
Figure 1. Raman spectra of Cabernet Sauvignon and Chardonnay before fermentation (a,b) and after fermentation (c,d), respectively.
Beverages 07 00078 g001
Figure 2. Comparison of the Raman spectra of glucose (blue), fructose (red), ethanol (green), and total sugars (glucose plus fructose, purple). Peaks for each spectrum that do not overlap with the corresponding spectrum in that subplot are marked with their respective Raman shift signals. To facilitate visual comparison, individual peak intensities were treated as a percentage of the maximum intensity of the respective spectrum (relative intensity).
Beverages 07 00078 g002
Figure 3. Comparison of the Raman spectra of a Syrah wine one year after fermentation (a) and five years after fermentation (b).
Beverages 07 00078 g003
Figure 4. Raman spectra of red wine filtered with 47 mg/L (a), 53 mg/L (b), 60 mg/L (c), and 67 mg/L (d) of polyvinylpolypyrrolidone (PVPP).
Beverages 07 00078 g004
Table 1. Summation of raw ethanol, raw pH, PVPP-exposed ethanol, PVPP-exposed pH, and total sugars model performance.
AlgorithmEthanol–Raw SpectrapH–Raw SpectraEthanol–Post PVPP SpectrapH–Post PVPP SpectraTotal Sugars
RMEPR2RMEPR2RMEPR2RMEPR2RMEPR2
SVR1.350.511.160.620.230.980.120.791.590.96
PLSR1.220.501.170.610.210.990.120.841.570.95
RR1.190.501.160.670.230.990.120.821.570.95
SVR = Support Vector Regression; PLSR = Partial Least Squares Regression; RR = Ridge Regression; RMEP = Root Mean Squared Error of Prediction; R2 = Coefficient of Determination.
Publisher’s Note: MDPI stays neutral with regard to jurisdictional claims in published maps and institutional affiliations.