Abstract
Olive leaves (OLL), an agricultural waste by-product, are considered a significant bioresource of polyphenols, known as bioactive compounds. This study evaluates the pulsed electric field (PEF) technique for the extraction of polyphenols from OLL. The study parameters included a series of “green” solvents (ethanol, water as well as mixtures of them at a 25% step gradient) and different input values for the pulse duration of PEF. The phytochemical extraction degree was evaluated using total phenol concentration (Folin–Ciocalteu method) and high-performance liquid chromatography (HPLC) analyses, while the antioxidant activity was assessed using differential scanning calorimetry (DSC). The results obtained from the PEF extracts were compared with those of the extracts produced without the PEF application. The highest PEF effect was observed for aqueous ethanol, 25% v/v, using a pulse duration of 10 μs. The increase in the total polyphenols reached 31.85%, while the increase in the specific metabolites reached 265.67%. The recovery in polyphenols was found to depend on the solvent, the pulse duration of treatment and the structure of the metabolites extracted.
1. Introduction
Olive (Olea europaea L.) leaves (OLL) have a dual identity, both as waste material from the olive oil production or the olive tree-pruning season and as aromatic and medicinal herbs that are beneficial for human health [1,2]. It is well known that during the pruning of olives, either in December or in March, substantial leaf and branch masses are destroyed either by fire or fermentation or by composting. Based on available data from the literature [3,4,5], the global volume of wasted olive leaves reaches 12 Mt/year. This volume comes from pruning and olive oil production waste (~2 Mt/year), with most of it produced in Europe (~50%). Greece is third amongst European countries in yielding olive grove waste.
OLL contain a considerable amount of bioactive compounds belonging to the group known as polyphenols, such as phenolic acids, phenolic alcohols (hydroxytyrosol and tyrosol), flavonoids (luteolin-7-O-glucoside, rutin, apigenin-7-O-glucoside, luteolin-4-O-glucoside), and secoiridoids (oleuropein) [5,6,7,8]. Among the aforementioned polyphenols, oleuropein is the most noted metabolite in OLL [7,9]. OLL have the highest level of oleuropein of all parts of the olive tree. Oleuropein is the most studied compound together with verbascoside, flavones, flavonols, flavan-3-ols, and other substituted phenols such as rutin. Most of the above compounds have been shown to possess hypo-cholesterolaemic properties [10]. In animal studies, dietary oleuropein from OLL resulted in hypo-cholesterolaemic activities [11]. Defensive action against the oxidation of low-density lipoproteins (LDL), implicated in the progress of atherosclerosis, as well as inhibition of the enzyme “3-hydroxy-3- methyglutaryl coenzyme A”, a significant enzyme for cholesterol synthesis [12], are reported for hydroxytyrosol and oleuropein. The above effects of hydroxytyrosol and oleuropein are possibly related to the decreases in the levels of plasma cholesterol [13].
Numerous techniques have been developed to produce OLL extracts [14,15]. However, currently, there is no significant exploitation of these wastes, since the commonly used processes present serious disadvantages [16]. Conventional extraction is not considered suitable because it can lead to the thermal decomposition of various unstable metabolites. Additionally, it is non-selective, complicated, costly, and harmful for the environment (expensive and toxic organic solvents are demanded in large quantities, high temperatures and long extraction times are used, and the solvent must be evaporated) [17]. Different techniques, including supercritical fluid extraction, ultrasonically assisted solvent extraction, accelerated pressurized and microwave-assisted extraction, appear to also have serious disadvantages, such as reduced recovery, high energy requirements and expensive equipment, making systematic, industrial production of bioactive compounds not feasible [18].
Pulsed electric field (PEF) is an emerging technique suitable for “green” sustainable production process development. The principle of PEF is to disintegrate the cell membrane structure for increasing extraction. During PEF, the phenomenon of electroporation (electrically induced formation of pores in the lipid bilayer under the influence of the induced transmembrane voltage) occurs periodically in a non-destructive manner for the cell under the effect of high-voltage pulsed electric field application. During PEF, the phenomenon of electroporation occurs periodically in a non-destructive manner for the cell. This way, an increased migration of intracellular water and solutes takes place to the external medium, resulting to enhanced mass transfer from the cell pores to the solution and therefore improvement of the recovery for the target compounds. Moreover, this non-thermal technology decreases processing time, reduces the degradation of unstable metabolites and energy costs, and, hence, improves the environmental impact [19]. The effectiveness of PEF treatment is directly related to the main processing factors such as electric field strength, pulse shape, duration, period, and specific energy.
PEF was initially applied for the non-thermal inactivation of microorganisms in liquid foods [20,21]. The utilization of the PEF technique for the recovery of bioactive phytochemicals was attempted first by Brodelius et al. [22] and is still limited. PEF has also been used before the extraction process to lower the operational costs, reduce the environmental impact, and achieve high yields of the desired compounds from a wide range of food processing wastes and by-products [9,23,24,25,26,27,28,29]. Another application of PEF was the extraction of flavor compounds from wood, resulting in the aging acceleration of young wine [30,31].
In our previous studies, we used pulsed electric field to extract polyphenols from Moringa oleifera leaves, aerial parts of Sideritis scardica, tepals of Crocus sativus, and fruits of Vitis vinifera [19,32], to increase bitter hops acids extraction rate [33], and to produce phenolic aromas in beer after enrichment of the beer wort with flax seeds [34].
In the present work, the PEF is proposed as a standalone extraction method of valuable bio-functional components, which can be applied in a simple “green” sustainable way. Moderate electric field intensity and relatively low energy input to succeed in the permeabilization of cell membranes by electroporation, preserving cell viability, were applied. Pure water, pure ethanol as well as their mixtures were used as extraction solvents, while PEF conditions that differentiated in pulse duration were tested to optimize the procedure. The use of PEF with solvent mixtures instead of pure water is a relatively new practice that can further increase the percentage of extraction. The purpose of the extraction solvent selection was to investigate the impact of the ratio of aqueous organic solvent on a potential PEF effect. Furthermore, the selectivity of the abovementioned procedure (PEF + solvent composition) concerning the extraction of different compounds was evaluated. To the best of our knowledge, such a study has not been carried out previously. Finally, this study was performed keeping in mind that even though high concentrations of organic solvents, such as ethanol, lead to higher extraction yields, these solvents must be recovered and recycled, resulting in weighing down the final product with an enormous operating cost and the overall process with environmental implications. Therefore, an additional aim appeared: to substantially reduce the use of the organic solvent, ethanol, using PEF and, at the same time, allow the extraction of phenolic compounds in an economically feasible way and determine any possible selectivity concerning the extraction of different compounds.
2. Materials and Methods
2.1. Chemicals
HPLC grade acetonitrile as well as formic acid (99%) were from Carlo Erba (Val de Reuil, France). Anhydrous sodium carbonate (99%) and gallic acid monohydrate were obtained from Penta (Prague, Czech Republic). Luteolin-7-O-glucoside, apigenin, rutin hydrate and oleuropein were purchased from Sigma-Aldrich (St. Louis, MO, USA). Ethanol (99.8%) and Folin–Ciocalteu reagent were purchased from Panreac (Barcelona, Spain).
2.2. Plant Material, Handling and Sample Preparation
The single variety of OLL used in this study was collected on the 12 October 2020 from a single 30-year-old olive tree (Olea europaea L., cv. Chondrolia Chalkidikis), in Karditsa Region, Greece (at 39°21′46″ N and 21°55′05″ E and elevation of 108 m, according to Google Earth version 9.124.0.1, Google, Inc., Mountain View, CA, USA). The plant material processing steps are illustrated in Figure 1. Before and after each extraction run, the temperature of the treatment chamber contents was measured. In all PEF-assisted extraction runs, the temperature increments due to the treatment never exceeded a ΔT of 1 °C.
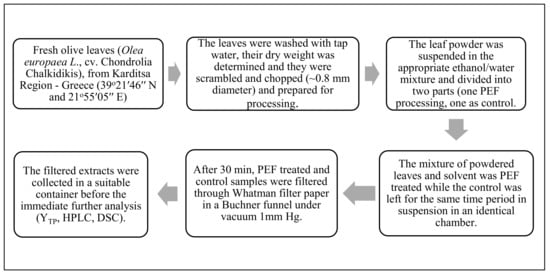
Figure 1.
Plant material processing steps. Abbreviations: pulsed electric field (PEF); total phenol content (YTP); high performance liquid chromatography (HPLC); differential scanning calorimetry (DSC).
2.3. OLL Water Content Determination
For the determination of dry matter content, a sufficient quantity of pulverized leaves, was placed in a suitable container. After being weighted, the sample was dried in an oven (Binder BD56, Bohemia, NY, USA) at 105 °C for 6 h. The moisture content of the leaves was about 50%.
2.4. PEF System
The PEF system used (Figure 2) was a static bench-scale system, and its layout consisted of a high voltage power generator (Leybold, LD Didactic GmbH, Huerth, Germany) that could provide a maximum voltage of 25 kV, a 25 MHz Function/Arbitrary Waveform Generator (Siglent SDG1025, SIGLENT Technologies Germany GmbH, Augsburg, Germany), a tailored electronic switch circuit (series of Insulated gate bipolar transistors-IGBTs) and a rectangular custom-made stainless steel treatment chamber consisting of two identical flat parallel stainless-steel plates with dimensions of 10 cm × 10 cm separated at a uniform distance of 1 cm by a “Π” shaped Teflon single piece that acted as an insulator. The effective volume of the treatment chamber was 80 mL.
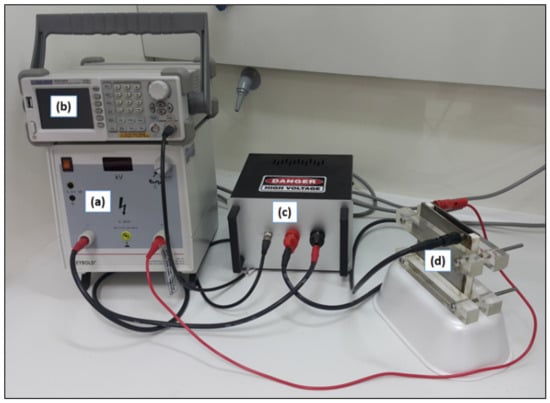
Figure 2.
PEF System: (a) high-voltage power generator; (b) function/arbitrary waveform generator; (c) electronic switch circuit (IGBTs); (d) treatment chamber.
2.5. PEF Assisted Extraction Parameters and Calculus
In depth pre-screening of the main PEF parameters took place in order to investigate the optimal PEF parameters set for the specific system (plant material and solvent) and maximize polyphenolic content of the extracts. As main PEF parameters, we pre-examined the permeability controlling parameters, meaning field intensity (E), pulse duration (tPulse), and the pulse period (T) for a specified extraction time (tExtraction). From the preliminary study (not reported here), our starting point (fixed variables) was pulse period (T): 1000 μs, electric field strength (E): 1 kV/cm, and extraction time (tExtraction): 30 min in an aqueous ethanol solution. Based on the latter, our main study parameters included the extraction solvent and the PEF actual treatment time (variance of pulse duration 10 μs and 100 μs) (please see also Table S1 in Supplementary Material). The series of the five green extraction solvents used was (i) water (0% EtOH), (ii) 25% v/v aqueous ethanol (25% EtOH), (iii) 50% v/v aqueous ethanol (50% EtOH), (iv) 75% v/v aqueous ethanol (75% EtOH) and (v) ethanol (100% EtOH). The electrical conductivity of solvents was 2.3 μS/cm for 0% EtOH, 0.8 μS/cm for 25% EtOH, 0.3 μS/cm for 50% EtOH, 0.1 μS/cm for 75% EtOH and <0.1 μS/cm for 100% EtOH.
Control extracts were prepared for comparison, following the same procedure as for PEF extracts, without the application of PEF. All extraction runs were carried out in triplicate.
The ratio of the applied voltage, U, and the distance between the two electrodes, d (1 cm), was used to calculate the electric field strength, E = U/d, which was set at 1 kV/cm for all PEF assisted extraction runs. The pulse generator provided unipolar, rectangular-shaped pulses, with pulse duration (tPulse) varying between 10 and 100 μs under a period (T) of 1000 μs (Frequency = 1000 Hz), while the total extraction time was 30 min, resulting in N = 1.8 × 10⁶ total number of pulses, according to the design of this study.
In each case of PEF-assisted extraction run, the actual PEF treatment time derived by the following equation:
where tPulse = pulse time duration (μs) and N = number of pulses (dimensionless).
Given that two different pulse times were investigated in the current study (tPulse1 = 10 μs and tPulse2 = 100 μs), the total PEF treatment time during the 30 min of each extraction was 18 and 180 s.
The specific energy input Wspec (kJ/kg) for the PEF-assisted static extraction was derived from the following equation [35]:
where N is the total number of pulses (dimensionless), m is the total weight of the sample (kg) poured into the PEF treatment chamber, tPulse is the duration of each pulse, U(t) is the output voltage, and I(t) the electric current applied to the sample.
For the application of PEF in a static homogenous solid–liquid extraction where the same pulse type and pulse time duration applied for each period, the values of U(t) and I(t) can be considered constant, simplifying the above function to the following equation for this study:
From the above equation, it was estimated that the energy input for all PEF assisted extractions was in the range of 0.155 and 1.55 kJ/kg, or 2.52 × 10⁻⁶ and 2.52 × 10⁻⁵ KWh, respectively.
2.6. Total Phenol Content of Extracts
The analysis was carried out using a validated protocol adopted by Lakka et al. [36]. Total polyphenol yield (YTP) was calculated as follows:
where CTP is the total polyphenol concentration of the extract (mg L−1), V is the volume of the extraction medium (L) and is the dry weight (g) of the plant material [37].
2.7. High-Performance Liquid Chromatography (HPLC)
A methodology previously described by Kaltsa et al. [6] was implemented. Chromatographic analyses were carried using a Shimadzu CBM-20A liquid chromatograph (Shimadzu Europa GmbH, Duisburg, Germany), coupled to a Shimadzu SPD-M20A detector (Shimadzu Europa GmbH, Duisburg, Germany), and interfaced by Shimadzu LC solution software (Version 1.22 SP1) (accessed on 14th October 2020). The column used was a Phenomenex Luna C18(2) (100 Å, 5 μm, 4.6 × 250 mm) (Phenomenex, Inc., Torrance, CA, USA). Quantification was done with calibration curves (0–50 μg mL−1) constructed with rutin (R2 = 0.9990), luteolin-7-O-glucoside (R2 = 0.9980), apigenin (R2 = 0.9999) and oleuropein (R2 = 0.9990). Luteolin-7-O-glucoside and apigenin were quantified at 345 nm, rutin at 360 nm and oleuropein at 270 nm. The estimation of the total area the wavelength selected was 230 nm as it was considered the most representative for the compounds contained.
2.8. Differential Scanning Calorimetry (DSC)
Antioxidant activity was estimated using the DSC method according to Bobinaitė et al. [23], after the solvents’ evaporation using a rotary evaporator. Determinations were conducted with a Perkin Elmer Diamond DSC (PerkinElmer Inc, Shelton, CT, USA). Oxygen was used as purge gas. In short, empty pans, hermetically sealed, were used as the control, while 4–5 mg of each sample was placed in DSC aluminum pans, closed with lids with a hole (1 mm in diameter), to allow the oxygen stream to be in contact with the sample. The temperature program was: hold for 1 min at 40 °C, heat from 40 to 200 °C (40 °C/min), and, finally, heat from 20 to 580 °C (20 °C/min). The onset temperature of the oxidation peak considered as the starting temperature of oxidation (Tmax).
2.9. Statistical Analysis
Extractions as well as all determinations were performed three times. Statistical analysis was carried out using the Microsoft Excel 2019 (Redmond, WA, USA) software (Version 16.0.14026.20304) (accessed on 8th January 2021). Evaluation of the statistical significance (at p < 0.05) of the differences between mean values was also carried out.
3. Results and Discussion
The extraction of valuable compounds from plant tissues and the evaluation of different techniques to manage this challenge were extensively studied. Yasemi et al. [38] reported Soxhlet extraction to show the highest recovery (62%) among different conventional techniques, such as maceration, ultrasound and microchannels. The optimum solvent for the Soxhlet technique, among different combinations tested, was ethanol:water (80:20). However, even higher recoveries, from 80 to 95%, were reached by emerging techniques that implicate supercritical fluid extraction combined with pressurized liquid extraction and high temperatures combined with pressurized liquid extraction [39,40]. According to the study of Delsart et al. [41], an enhanced extraction in anthocyanins (19%) of Cabernet Sauvignon grapes before fermentation was achieved via the PEF treatment. Fincan et al. [42] applied PEF treatment to extract red pigment from red beetroot tissue and reached a release of total red coloring and ionic content of about 90%.
3.1. Total Phenol Content of the Extracts-Solvent/Water Composition Extraction Evaluation
Initially, a screening of the optimal ethanol/water ratio was carried out by choosing the highest difference in total phenol content between the samples treated with PEF and control. The results are presented in Figure 3 and Figure 4. As expected, the highest extraction rate was achieved by PEF and Control samples with 50% and 75% EtOH (no significant difference shown between them). However, the highest percentage increase in YTP between PEF and the control sample was achieved by means of the addition of 25% EtOH. A significant (p < 0.05) increase in YTP for PEF extract (compared to the control extract) was observed following the addition of 25% EtOH, which reached the maximum of 31.85%. YTP for the 25% EtOH PEF extract was 20.75 mg GAE g−1 dw, while for the 25% EtOH control extract, it was 15.74 mg GAE g−1 dw.
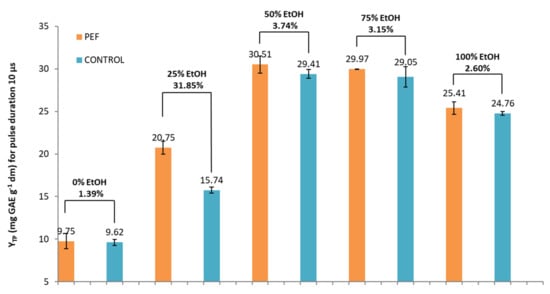
Figure 3.
YTP (mg of gallic acid equivalents (GAE) per gram of dry weight (dw)) for PEF and control samples in five different tested solvents and a pulse duration of 10 μs.
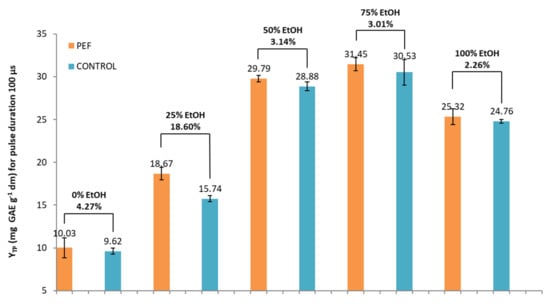
Figure 4.
YTP (mg of gallic acid equivalents (GAE) per gram of dry weight (dw)) for PEF and control samples in five different tested solvents and a pulse duration of 100 μs.
Next, a second set of PEF conditions was used. The pulse duration was increased from 10 to 100 μs, while the other PEF parameters, as well as induction time, were kept constant. The extracts were prepared using the same solvents. The results regarding the effect of EtOH addition for a pulse duration of 100 μs were similar as for a pulse duration of 10 μs. Again, the highest extraction efficiency was achieved by PEF and control samples with 50% and 75% EtOH. At a pulse duration of 100 μs, the solvent 25% EtOH, resulted again in the higher percentage increase (significant at p < 0.05) in YTP between PEF and control sample. YTP at this EtOH content (25%) was lower (by 10.02%) than the corresponding yield reached with a PEF condition of 10 μs.
According to the results, the highest difference is ultimately in the samples treated with 25% ethanol. It seems that any percentage losses in yield, caused by the solvent choice, were balanced from the application of the PEF. Another point of interest is that the application of a large number of short-duration pulses seems to lead to higher efficiencies of total phenolic content recovery.
3.2. Differential Scanning Calorimetry (DSC)
DSC is a thermal analysis technique used to assess the changes in the different physicochemical properties of materials and their relationship with the heat flow delivered by the instrument [43]. As reported by the same authors, the DSC method can be used to determine the oxidative stability of antioxidants. Relying on the measurements of the incubation period, oxidative stability can be estimated by the extrapolated temperature at the beginning of the oxidation process. Therefore, DSC can be used to determine the kinetic parameters of an oxidation from the resulting thermographic curves which reveal the temperature of the extrapolated onset of the thermo-oxidation process [43]. Specifically, Tmax is considered the highest oxidation peak of the thermographic curve. The higher the Tmax appears to be, the higher the resistance of the sample is.
During this study, the exothermic peaks of the extracts were measured in the range of 40 to 580 °C, relating to their autoxidation process. According to the results (Table 1), the maximum peak oxidation (Tmax) was 569 °C, which was achieved by the samples treated by pulse duration of 100 μs, a pulse period of 1000 μs, an electric field strength of 1 kV/cm, and an induction time of 30 min with addition of 75% EtOH. These samples presented the higher oxidation resistance and, therefore, the higher antioxidant activity. All the results of the DSC determinations showed that the Tmax was directly related to the total phenol content of each sample, while, concerning the difference in extraction efficiency, the highest (significant at p < 0.05) was presented between control samples and PEF samples treated by a pulse duration of 10 μs with 25% EtOH (15.16%), followed by the PEF samples treated with a pulse duration of 100 μs (8.56%) and 75% EtOH (both pulse durations). No significant differences were observed when 0% and 100% EtOH (both pulse durations) and 50% EtOH (100 μs) were used.

Table 1.
DSC results on temperature (°C) of oxidation (Tmax) of the various samples.
In Figure 5, Figure 6 and Figure 7, the thermograms of control samples (no PEF applied) and PEF-treated samples in five different tested solvents are displayed. It appears that all the curves of the thermograms have different shapes. This possibly denotes a different composition of each extract, meaning that each and every extract is unique and contains a different proportion of active compounds or, maybe, a different composition of compounds. This is a result that should have been expected due to the different conditions used for the extraction.
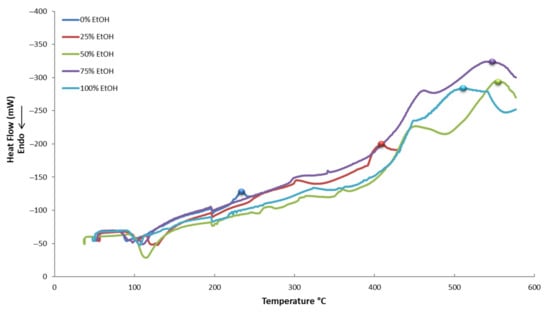
Figure 5.
Differential scanning calorimetry (DSC) thermograms of control samples (no PEF applied) in five different tested solvents.
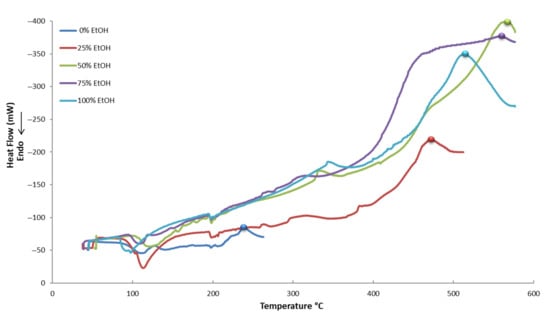
Figure 6.
Differential scanning calorimetry (DSC) thermograms of PEF-treated (10 μs) samples in five different tested solvents.
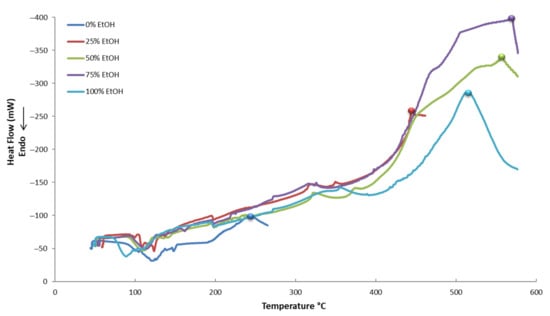
Figure 7.
Differential scanning calorimetry (DSC) thermograms of PEF-treated (100 μs) samples in five different tested solvents.
3.3. Characterization of the Extracts Using HPLC
3.3.1. Estimation of PEF Effect by Determination of Extracts Total Area
The results based on the estimated total area are in accordance with the phenol content determination results. The PEF condition with a pulse duration of 10 μs in 25% EtOH led to the highest percentage difference for the total area between PEF and the control sample (please see also Figures S1 and S2 in Supplementary Material). Specifically, the total area for the optimum condition of a pulse duration of 10 μs in 25% EtOH was 44,156,899 for the PEF sample and 36,566,097 for the control sample, reflecting a significant (p < 0.05) percentage increase of 20.76%. The corresponding percentage increase for the PEF condition with a pulse duration of 100 μs was 18.38% (again significant at p < 0.05). For pure water, the PEF condition with a pulse duration of 10 μs was also significantly (p < 0.05) superior to the PEF condition with a pulse duration of 100 μs. Percentage increases over PEF sample for pure water reached 17.44% and 7.38%, respectively, for the two PEF conditions. A gradual increase in EtOH content up to 100% did not result in a corresponding percentage increase in the total area over the PEF sample. On the contrary, the addition of EtOH to water in percentages higher than 25% resulted in a gradual reduction (however, not significant at p < 0.05) in the percentage increase in the total area over the PEF sample. When extracting with pure EtOH, the PEF effect for both conditions of pulse duration is minimized and considered not significant.
3.3.2. Polyphenolic Composition
According to the literature, luteolin and its related compounds are the most frequently found flavonoids in olive leaf water and EtOH extracts, while the most abundant phytochemicals are luteoline-7-O-glucoside and oleuropein. Quercetin-3-O-rutinoside and apigenin-7-O-rutinoside have also been identified [5,6,7,8,44,45]. The results of the current study are in accordance with the above relevant literature. The chromatograms (Figure 8) revealed the existence of six principal constituents. Peaks 2 (λmax at 351 nm) and 4 (λmax at 347 nm) were identified as quercetin-3-O-rutinoside and luteolin-7-O-glucoside, respectively, comparing their retention time and absorption spectrum to those of the corresponding reference substances. Peaks 5 and 6 were tentatively identified in our previous work [6] as apigenin-7-O-rutinoside and luteolin-3′-O-glucoside, respectively. Peaks 1, 3 and 7 could not be identified due to a lack of corresponding reference substances. However, according to their typical flavone UV-VIS spectrum (please see also Figure S3 in Supplementary Material) and bibliographic data [5,6], they are believed to be luteolin-related compounds (luteolin diglucoside, luteolin rutinoside and luteolin aglycone, respectively). Peak 8 with a λmax at 280 nm was identified as oleuropein following the comparison of its retention time and absorption spectrum with the corresponding values of the reference substance. Luteoline-7-O-glucoside and oleuropein indeed appear to be the predominant phytochemicals. Their content in the control samples extracts prepared in 25% EtOH amounted to 0.48 and 0.58 mg g−1 dw, respectively. Quercetin-3-O-rutinoside, apigenin-7-O-rutinoside and luteolin-3′-O-glucoside had lower contents of 0.07, 0.14 and 0.2 mg g−1 dw, respectively (please see also Table S2 in Supplementary Material).
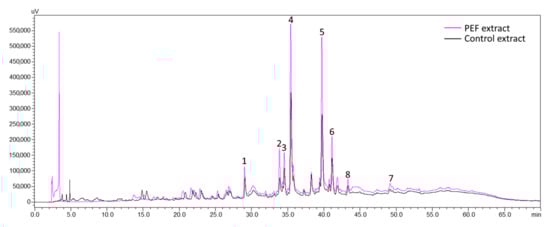
Figure 8.
Overlay of chromatograms of PEF and control extracts with a pulse duration of 10 μs and extraction solvent 25% EtOH. Peak 1: not identified, Peak 2: quercetin-3-O-rutinoside, Peak 3: not identified, Peak 4: luteolin-7-O-glucoside, Peak 5: apigenin-7-O-rutinoside, Peak 6: luteolin-3′-O-glucoside, Peak 7: not identified, Peak 8: oleuropein.
Comparing the extraction efficiency between the set of PEF conditions utilizing pulses of 10 and 100 μs, the 10 μs pulses showed better performance in the extraction of phenolics. It is obvious that PEF treatment has a remarkable positive effect in the recovery of these compounds, reaching an increase of up to 265.67%. The above observations are illustrated comparatively in Figure 9 and Figure 10 (in 25% EtOH), and confirm an adequately reported observation of a short-duration pulse disintegration effect on the membranes and intracellular compounds extraction rate from vegetable cells. Looking at the above figures, it can be concluded that the pulse time affects the extraction and probably has to do with the structure of the molecules being extracted. For compounds such as phenolic glycosides, where the molecule usually comprises one or two sugar units bound to a flavone-backbone (quercetin), the time of 10 μs gave significantly (p < 0.05) better results for all compounds apart from oleuropein (no significant difference). Concerning oleuropein, the longer time of 100 μs gave significantly (p < 0.05) better results. Looking at the molecular structures, oleuropein is different from other phenolic compounds since it has no flavone backbone and is smaller in size.
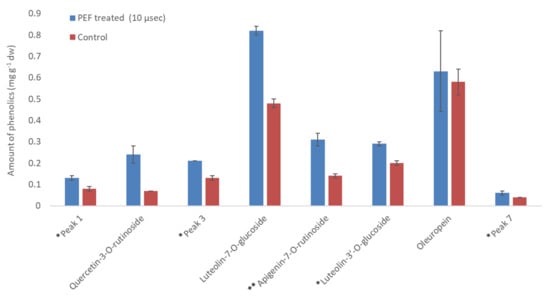
Figure 9.
Amount of phenolics (mg g−1 dw) in PEF-treated leaves versus control at 10 μs pulse duration and 25% EtOH. * Luteolin-3′-O-glucoside and peaks 1,3 and 7 were quantified as luteolin-7-O-glucoside; ** Apigenin-7-O-rutinoside was quantified as apigenin.
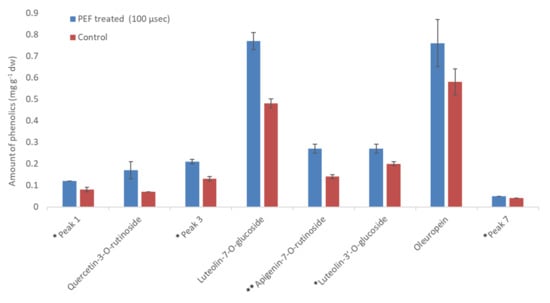
Figure 10.
Amount of phenolics (mg g−1 dw) in PEF treated leaves versus control at 100 μs pulse duration and 25% EtOH. * Luteolin-3′-O-glucoside and peaks 1, 3 and 7 were quantified as luteolin-7-O-glucoside; ** Apigenin-7-O-rutinoside was quantified as apigenin.
Various compounds’ solubility is a key factor in samples treated with PEF. Regarding solubility, quercetin-3-O-rutinoside has a low water solubility of 0.125 g L−1, luteolin-7-O-glucoside of 1.08 g L−1, apigenin of 0.97 g L−1, and oleuropein of 0.73 g L−1. Ethanol is an excellent solvent for oleuropein (solubility: 30 g L−1), but all other glycosides are less soluble in it (i.e., rutin has a solubility of 5.5 g L−1 at room temperature). Therefore, the choice of different PEF conditions (pulses of 10 or 100 μs) can facilitate the selective extraction of different molecules from plant material. This is highly important since the selective extraction of compounds is often a tedious, time- and energy-consuming procedure. According to Figure 11, where a comparison of the effect (% increase) of the pulse time duration on the extraction of various compounds is presented, oleuropein is the only molecule whose extraction appears higher under a 100 μs pulse. This result leads us to the conclusion that the 10 μs pulses in a period of 1000 Hertz affect the less soluble molecules (i.e., rutin) to a greater extent. The larger molecules possibly need more pulses to be extracted and, therefore, a combination of molecular size and solubility has to be considered for their selective extraction. The thermographic curves during DSC analysis (Figure 5, Figure 6 and Figure 7) also show differences in the resistance to oxidation of the extracts, possibly due to their composition in active compounds. This is caused by the extracting ability of each extraction procedure.
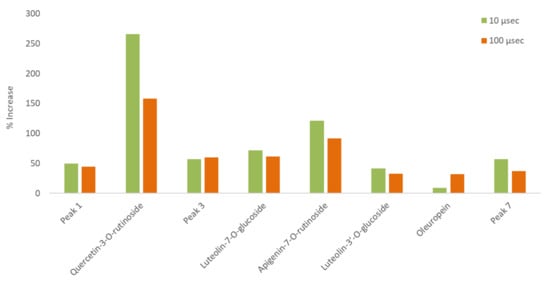
Figure 11.
Comparison of the effect (% increase) of different pulse time durations on the extraction of various compounds in the same ethanol/water ratio (25% EtOH).
The significance of the results presented above are further illustrated based on the fact that in the current study, the 71.87% increase, for the PEF condition with pulse duration 10 μs, in the case of the basic metabolite luteolin-7-O-glucoside, led to an amount of 0.82 mg g−1 dw in the extract. The exact same amount was reached by Palmeri et al. [45] using water at 80 °C as the extraction solvent with a liquid to solid ratio of 20:1 mL g−1. This result is considered significant as, in the current study, we conducted a non-thermal extraction, using a much lower liquid to solid ratio (just 2.5:1 w/w), with the addition of a green organic solvent (EtOH) in a percentage of only 25%. Regarding the secondary metabolites, quercetin-3-O-rutinoside, apigenin-7-O-rutinoside, and luteolin-3′-O-glucoside, we also succeeded in extracting amounts around 0.3 mg g−1 dw. This quantity has also been reported in previous studies [6,45] using energy demanding extraction methods and a significant quantity of extraction solvent.
PEF processing factors, such as electric field strength, pulse shape, duration, period, and specific energy, could be further optimized in a future work to maximize polyphenol concentration and explore the possibility of selective extraction. Another point of interest for future work is to further investigate the role of solvent polarity to the PEF effect.
4. Conclusions
This study aimed to extract polyphenols from olive leaves using the PEF technique and to suggest a method that would substantially reduce the use of the organic solvent ethanol (used in a conventional extraction techniques), replacing it with a technology that would allow us to isolate phenolic compounds in an economically feasible way. During the experiments, different solvent mixtures and different PEF conditions were applied. The novelty of the research includes the selection of an aqueous organic solvent with the lowest possible ratio of ethanol and the development of the PEF technique as a standalone static solid liquid extraction process. Although higher green solvent ratios gave an increased extraction rate, a PEF-assisted procedure with a much lower ratio of EtOH (25%) showed the maximum increase in the total yield in polyphenols. Therefore, one of the aims of this work, the substantial reduction in the quantity of solvent, was fulfilled. According to the results, olive leaves’ PEF extracts possess higher content in total polyphenols. PEF application (pulse duration: 10 μs, pulse period: 1000 μs, electric field strength: 1 kV/cm, and induction time: 30 min) in 25% EtOH, increased the total yield in polyphenols up to 31.85%. The recovery of major and secondary metabolites was enhanced by PEF treatment up to 265.67%. The amount of the extracted polyphenols was a function of the solvent, the pulse duration of treatment, as well as the structure of the metabolites extracted and their solubility. The DSC results show that the Tmax was directly related to the total phenol content of each sample. In conclusion, PEF treatment increased the recovery of polyphenols. This indicates that PEF presents excellent potential for “green” selective extraction of biofunctional constituents from olive leaves (phenolic compounds) that can be of further use in functional food manufacturing in a sustainable way, producing high quality products that present numerous public health benefits.
Supplementary Materials
The following are available online at https://www.mdpi.com/article/10.3390/beverages7030045/s1, Figure S1: HPLC total area for PEF and Control samples in five different tested solvents and a pulse duration of 10 μsec, Figure S2: HPLC total area for PEF and Control samples in five different tested solvents and a pulse duration of 100 μsec. Figure S3: UV-Vis spectras obtained by HPLC-DAD analysis of a) peak 1, b) peak 3, c) peak 7 and d) Luteolin-7-O-glucoside reference substance. Table S1: Extraction conditions and PEF procedure parameters. Table S2: Averages (mg g−1 dw) of major compounds of olive leaf PEF treated and control extracts, prepared with 25% ethanol.
Author Contributions
Conceptualization, S.I.L. and V.G.D.; Methodology, V.M.P., G.N., and A.L.; Validation, A.L.; Formal Analysis, A.L., D.P., E.B., G.B. and V.A.; Investigation, V.M.P., A.L., D.P., E.B., G.B., G.N. and V.A.; Resources, S.I.L.; Data Curation, V.M.P., A.L. and E.B.; Writing—Original Draft Preparation, A.L., V.M.P. and D.P.; Writing—Review and Editing, S.I.L., V.G.D., V.A. and E.B.; Supervision, S.I.L., V.G.D. and D.P.M.; Project Administration, S.I.L.; Funding Acquisition, S.I.L. All authors have read and agreed to the published version of the manuscript.
Funding
This research was co-financed by the European Union and Greek national funds through the Operational Program Competitiveness, Entrepreneurship and Innovation, under the call RESEARCH-CREATE-INNOVATE (project code: T1EDK-03762).
Data Availability Statement
The data presented in this study are included in the article; further inquiries can be directed to the corresponding author.
Conflicts of Interest
The authors declare no conflict of interest.
References
- Sahin, S.; Bilgin, M. Olive tree (Olea europaea L.) leaf as a waste by-product of table olive and olive oil industry: A review. J. Sci. Food Agric. 2018, 98, 1271–1279. [Google Scholar] [CrossRef] [PubMed]
- Toledano, A.; Alegria, I.; Labidi, J. Biorefining of olive tree (Olea europea) pruning. Biomass Bioenerg. 2013, 59, 503–511. [Google Scholar] [CrossRef]
- Khdair, A.; Abu-Rumman, G. Sustainable environmental management and valorization options for olive mill byproducts in the Middle East and North Africa (MENA) region. Processes 2020, 8, 671. [Google Scholar] [CrossRef]
- Romero, I.; Ruiz, E.; Castro, E.; Moya, M. Acid hydrolysis of olive tree biomass. Chem. Eng. Res. Des. 2010, 88, 633–664. [Google Scholar] [CrossRef]
- Herrero, M.; Temirzoda, T.N.; Segura-Carretero, A.; Quirantes, R.; Plaza, M.; Ibañez, E. New possibilities for the valorization of olive oil by-products. J. Chromatogr. A 2011, 1218, 7511–7520. [Google Scholar] [CrossRef] [Green Version]
- Kaltsa, O.; Grigorakis, S.; Lakka, A.; Bozinou, E.; Lalas, S.; Makris, D.P. Green valorization of olive leaves to produce polyphenol-enriched extracts using an environmentally benign deep eutectic solvent. AgriEngineering 2020, 2, 226–239. [Google Scholar] [CrossRef] [Green Version]
- Lalas, S.; Athanasiadis, V.; Gortzi, O.; Bounitsi, M.; Giovanoudis, I.; Tsaknis, J.; Bogiatzis, F. Enrichment of table olives with polyphenols extracted from olive leaves. Food Chem. 2011, 127, 1521–1525. [Google Scholar] [CrossRef]
- Mylonaki, S.; Kiassos, E.; Makris, D.P.; Kefalas, P. Optimization of the extraction of olive (Olea europaea) leaf phenolics using water/ethanol-based solvent systems and RSM. Anal. Bioanal. Chem. 2008, 392, 977–985. [Google Scholar] [CrossRef] [PubMed]
- Briante, R.; La Cara, F.; Febbraio, F.; Patumi, M.; Nucci, R. Bioactive derivatives from oleuropein by a biotransformation on Olea europaea leaf extracts. J. Biotechnol. 2002, 93, 109–119. [Google Scholar] [CrossRef]
- Romani, A.; Mulinacci, N.; Pinelli, P.; Vincieri, F.F.; Cimato, A. Polyphenolic content in five tuscany cultivars of Olea europaea L. J. Agric. Food Chem. 1999, 47, 3. [Google Scholar] [CrossRef] [PubMed]
- Sarica, S.; Toptas, S. Effects of dietary oleuropein supplementation on growth performance, serum lipid concentrations, and lipid oxidation of Japanese quails. J. Anim. Physiol. Anim. Nutr. 2014, 98, 1176–1186. [Google Scholar] [CrossRef]
- Cayan, H.; Erener, G. Effect of olive leaf (Olea europaea) powder on laying hens performance, egg quality, and egg yolk cholesterol levels. Asian Australas. J. Anim. Sci. 2015, 28, 538–543. [Google Scholar]
- Patrick, L.; Uzick, M. Cardiovascular disease: C-reactive protein and the inflammatory disease paradigm: HMG-CoA reductase inhibitors, alpha-tocopherol, red yeast rice, and olive oil polyphenols. A review of the literature. Altern. Med. Rev. 2001, 6, 248–271. [Google Scholar] [PubMed]
- Otero, D.M.; Oliveira, F.M.; Lorini, A.; Antunes, B.F.; Oliveira, R.M.; Zambiazi, R.C. Oleuropein: Methods for extraction, purifying and applying. Rev. Ceres 2020, 67, 315–329. [Google Scholar] [CrossRef]
- Mahugo Santana, C.; Sosa Ferrera, Z.; Esther Torres Padrón, M.; Juan Santana Rodríguez, J. Methodologies for the extraction of phenolic compounds from environmental samples: New approaches. Molecules 2009, 14, 298. [Google Scholar] [CrossRef] [PubMed] [Green Version]
- Araújo, M.; Pimentel, F.B.; Alves, R.C.; Oliveira, M.B.P.P. Phenolic compounds from olive mill wastes: Health effects, analytical approach and application as food antioxidants. Trends Food Sci. Tech. 2015, 45, 200–211. [Google Scholar] [CrossRef]
- Lamprou, G.K.; Vlysidis, A.; Tzathas, K.; Vlyssides, A.G. Statistical optimization and kinetic analysis of the extraction of phenolic compounds from olive leaves. J. Chem. Technol. Biotechnol. 2020, 95, 457–465. [Google Scholar] [CrossRef]
- Ferrera, Z.S.; Sanz, C.P.; Santana, C.M.; Rodríguez, J.J.S. The use of micellar systems in the extraction and pre-concentration of organic pollutants in environmental samples. TrAC Trend. Anal. Chem. 2004, 23, 469–479. [Google Scholar] [CrossRef]
- Bozinou, E.; Karageorgou, I.; Batra, G.; Dourtoglou, V.; Lalas, S. Pulsed electric field extraction and antioxidant activity determination of Moringa oleifera dry leaves: A comparative study with other extraction techniques. Beverages 2019, 5, 8. [Google Scholar] [CrossRef] [Green Version]
- Álvarez, I.; Pagán, R.; Condon, S.; Raso, J. The influence of process parameters for the inactivation of Listeria monocytogenes by pulsed electric fields. Int. J. Food Microbiol. 2003, 87, 87–95. [Google Scholar] [CrossRef]
- Grahl, T.; Märkl, H. Killing of microorganisms by pulsed electric fields. Appl. Microbiol. Biotechnol. 1996, 45, 148–157. [Google Scholar] [CrossRef]
- Brodelius, P.E.; Funk, C.; Shillito, R.D. Permeabilization of cultivated plant cells by electroporation for release of intracellularly stored secondary products. Plant. Cell Rep. 1988, 7, 186–188. [Google Scholar] [CrossRef] [PubMed]
- Bobinaitė, R.; Pataro, G.; Lamanauskas, N.; Šatkauskas, S.; Viškelis, P.; Ferrari, G. Application of pulsed electric field in the production of juice and extraction of bioactive compounds from blueberry fruits and their by-products. J. Food Sci. Tech. 2015, 52, 5898–5905. [Google Scholar] [CrossRef] [PubMed]
- Carullo, D.; Pataro, G.; Ferrari, G. Effect of PEF pre-treatment and extraction temperature on the recovery of carotenoids from tomato wastes. Chem. Eng. Trans. 2019, 75, 139–144. [Google Scholar]
- Hendrawan, Y.; Larasati, R.; Wibisono, Y.; Umam, C.; Sutan, S.; Hawa, L. Extraction of phenol and antioxidant compounds from kepok banana skin with PEF pre-treatment. IOP Conf. Ser. Earth Environ. Sci. 2019, 305, 012065. [Google Scholar] [CrossRef]
- Luengo, E.; Álvarez, I.; Raso, J. Improving carotenoid extraction from tomato waste by pulsed electric fields. Front. Nutr. 2014, 1, 12. [Google Scholar] [CrossRef] [Green Version]
- Martín- García, B.; Tylewicz, U.; Verardo, V.; Pasini, F.; Caravaca, A.M.G.; Caboni, M.; Rosa, M.D. Pulsed electric field (PEF) as pre-treatment to improve the phenolic compounds recovery from brewers’ spent grains. Innov. Food Sci. Emerg. 2020, 64, 102402. [Google Scholar] [CrossRef]
- Pataro, G.; Carullo, D.; Siddique, A.; Falcone, M.; Donsì, F.; Ferrari, G. Improved extractability of carotenoids from tomato peels as side benefits of PEF treatment of tomato fruit for more energy-efficient steam-assisted peeling. J. Food Eng. 2018, 233. [Google Scholar] [CrossRef]
- Sukardi, S.; Purwaningsih, I.; Sita, P. Extraction of phenolic compounds from basil (Ocimum americanum L.) leaves with pretreatment using pulsed electric field (PEF). IOP Conf. Ser. Earth Environ. Sci. 2020, 475, 012056. [Google Scholar] [CrossRef]
- Drosou, F.; Yang, E.; Marinea, M.; Dourtoglou, T.; Chatzilazarou, A.; Dourtoglou, V. An assessment of potential applications with pulsed electric field in wines. In BIO Web of Conferences; EDP Sciences: Les Ulis Cedex, France, 2017; Volume 9. [Google Scholar] [CrossRef] [Green Version]
- Zeng, X.A.; Yu, S.; Zhang, L.; Chen, X. The effects of AC electric field on wine maturation. Innov. Food Sci. Emerg. 2008, 9, 463–468. [Google Scholar] [CrossRef]
- Lakka, A.; Bozinou, E.; Makris, D.P.; Lalas, S.I. Evaluation of pulsed electric field polyphenol extraction from Vitis vinifera, Sideritis scardica and Crocus sativus. Chemengineering 2021, 5, 25. [Google Scholar] [CrossRef]
- Ntourtoglou, G.; Tsapou, E.A.; Drosou, F.; Bozinou, E.; Lalas, S.; Tataridis, P.; Dourtoglou, V. Pulsed electric field extraction of α and β-acids from pellets of Humulus lupulus (hop). Front. Bioeng. Biotechnol. 2020, 8, 297. [Google Scholar] [CrossRef] [PubMed]
- Tsapou, E.A.; Ntourtoglou, G.; Drosou, F.; Tataridis, P.; Dourtoglou, T.; Lalas, S.; Dourtoglou, V. In situ creation of the natural phenolic aromas of beer: A pulsed electric field applied to wort-enriched flax seeds. Front. Bioeng. Biotechnol. 2020, 8, 1219. [Google Scholar] [CrossRef]
- Roselló-Soto, E.; Barba, F.; Parniakov, O.; Galanakis, C.; Lebovka, N.; Grimi, N.; Vorobiev, E. High voltage electrical discharges, pulsed electric field, and ultrasound assisted extraction of protein and phenolic compounds from olive kernel. Food Bioprocess Tech. 2014, 8, 885–894. [Google Scholar] [CrossRef]
- Lakka, A.; Grigorakis, S.; Karageorgou, I.; Batra, G.; Kaltsa, O.; Bozinou, E.; Lalas, S.; Makris, D.P. Saffron processing wastes as a bioresource of high-value added compounds: Development of a green extraction process for polyphenol recovery using a natural deep eutectic solvent. Antioxidants 2019, 8, 586. [Google Scholar] [CrossRef] [Green Version]
- Karakashov, B.; Grigorakis, S.; Loupassaki, S.; Makris, D.P. Optimisation of polyphenol extraction from Hypericum perforatum (St. John’s Wort) using aqueous glycerol and response surface methodology. J. Appl. Res. Med. Aromat. Plants 2015, 2, 1–8. [Google Scholar] [CrossRef]
- Yasemi, M.; Heydarinasab, A.; Rahimi, M.; Ardjmand, M. Microchannels effective method for the extraction of oleuropein compared with conventional methods. J. Chem. 2017, 2017, 6594156. [Google Scholar] [CrossRef] [Green Version]
- Xynos, N.; Papaefstathiou, G.; Psychis, M.; Argyropoulou, A.; Aligiannis, N.; Skaltsounis, L. Development of a green extraction procedure with super subcritical fluids to procedure extracts enriched in oleuropein from olive leaves. J. Supercrit. Fluid 2012, 67, 89–93. [Google Scholar] [CrossRef]
- Xynos, N.; Papaefstathiou, G.; Gikas, E.; Argyropoulou, A.; Aligiannis, N.; Skaltsounis, L. Design optimization study of the extraction of olive leaves performed with pressurized liquid extraction using response surface methodology. Sep. Purif. Technol. 2014, 122, 323–330. [Google Scholar] [CrossRef]
- Delsart, C.; Cholet, C.; Ghidossi, R.; Grimi, N.; Gontier, E.; Geny, L.; Vorobiev, E.; Mietton-Peuchot, M. Effects of pulsed electric fields on cabernet sauvignon grape berries and on the characteristics of wines. Food Bioprocess Technol. 2014, 7, 424–436. [Google Scholar] [CrossRef]
- Fincan, M.; DeVito, F.; Dejmek, P. Pulsed electric field treatment for solid–liquid extraction of red beetroot pigment. J. Food Eng. 2004, 64, 381–388. [Google Scholar] [CrossRef]
- Batra, G.; Gortzi, O.; Lalas, S.I.; Galidi, A.; Alibade, A.; Nanos, G.D. Enhanced antioxidant activity of Capsicum annuum L. and Moringa oleifera L. extracts after encapsulation in microemulsions. ChemEngineering 2017, 1, 15. [Google Scholar] [CrossRef] [Green Version]
- Olmo-García, L.; Bajoub, A.; Benlamaalam, S.; Hurtado-Fernández, E.; Bagur-González, M.; Chigr, M.; Mbarki, M.; Fernadéz -Gutierréz, A.; Carrasco-Pancorbo, A. Establishing the phenolic composition of Olea europaea L. leaves from cultivars grown in morocco as a crucial step towards their subsequent exploitation. Molecules 2018, 23, 2524. [Google Scholar] [CrossRef] [PubMed] [Green Version]
- Palmeri, R.; Parafati, L.; Trippa, D.; Siracusa, L.; Arena, E.; Restuccia, C.; Fallico, B. Addition of olive leaf extract (OLE) for producing fortified fresh pasteurized milk with an extended shelf life. Antioxidants 2019, 8, 255. [Google Scholar] [CrossRef] [PubMed] [Green Version]
Publisher’s Note: MDPI stays neutral with regard to jurisdictional claims in published maps and institutional affiliations. |
© 2021 by the authors. Licensee MDPI, Basel, Switzerland. This article is an open access article distributed under the terms and conditions of the Creative Commons Attribution (CC BY) license (https://creativecommons.org/licenses/by/4.0/).