1. Introduction
The conversion of freshly harvested green tea obtained from Camellia
sinensis var.
sinensis, into Japanese-styled green teas (i.e., Sencha and Gyokuro) is a lucrative export market for several countries [
1,
2]. However, the revenue of this market is highly dependent on the perceived sensory qualities of green tea and how effectively these qualities can be portrayed as desirable to customers [
3,
4]. Therefore, maximizing the value of green tea after harvest is pivotal to its ongoing commercial viability of the entire green tea value chain.
Crucial to a sustainable, modern green tea manufacturing value chain and a significant component of food loss and waste (FLW) is the rapid deactivation of polyphenol oxidase (PPO). Immediately after the harvest of tea, PPO initiates oxidization of the catechins and chlorophyll complexes. This reaction results in the formation of tannins and other products of fermentation and oxidation that typically characterize common tea varieties such as ‘semi’ or ‘completely fermented’ tea (i.e., oolong or black tea varieties) [
5,
6,
7]. This process, resulting in the darkening of the leaves and stems, changes the overall phytochemical composition and alters the organoleptic profile of the final tea product.
Optimal green tea manufacture suggests that harvested tea leaves should be processed immediately after removal from the plant. Within European-, US-, and Australian-based farming enterprises, this practice is commonly associated with the use of chilled temperature storage to preserve the sensory and quality components. Often this is aided by the co-location of processing facilities which are purposely built in growing regions to create a constant flow of raw materials into the processing site. However, for agricultural producers that are geographically separated from processing facilities, as often is the case in emerging markets and countries such as Australia, this can pose a problem. Therefore, innovative post-harvest handling, storage and transport techniques are required to achieve a competitive advantage, optimal value and reduce harvest FLW. This will create a delicate balance between harvesting efficiency and processing delays, allowing for the greatest volume and the highest quality of green tea products to be achieved [
8,
9].
To assist green tea producers in achieving the best harvest outcomes, research on post-harvest processing conditions must produce quality raw materials. Previous findings have indicated that green tea storage temperature can impact the sensory and nutritional quality of the raw material [
10,
11,
12,
13,
14]. The use of frozen temperature storage (below −18 °C) for freshly harvested green tea material has shown to significantly preserve the quality, biochemistry and aroma of prepared green tea products [
15]. However, studies utilising objective quality methods have proven ineffective in measuring the quality decline that is observed in raw materials that have undergone post-harvest processing delays [
16,
17,
18]. While the quality decline caused by PPO activity is easily distinguished in sensory analysis, rapid assessment techniques cannot differentiate between immediate and delay processed teas [
19,
20]. Chilled storage has shown to be effective for the slowing of similar oxidative effects and browning in many green leafy vegetables (i.e., lettuce and brassica), and whilst it is commonly practised in commercial horticultural enterprises, the total effect of chilled storage upon the preservation of quality constituents of fresh green tea raw material undergoing post-harvest processing delays is unclear [
21,
22]. Therefore, the use of controlled low-temperature storage (0–5 °C) may be a simple and accessible technique to improve yield, value and competitive advantage to novel decentralized green tea supply chains via reducing the creation of FLW.
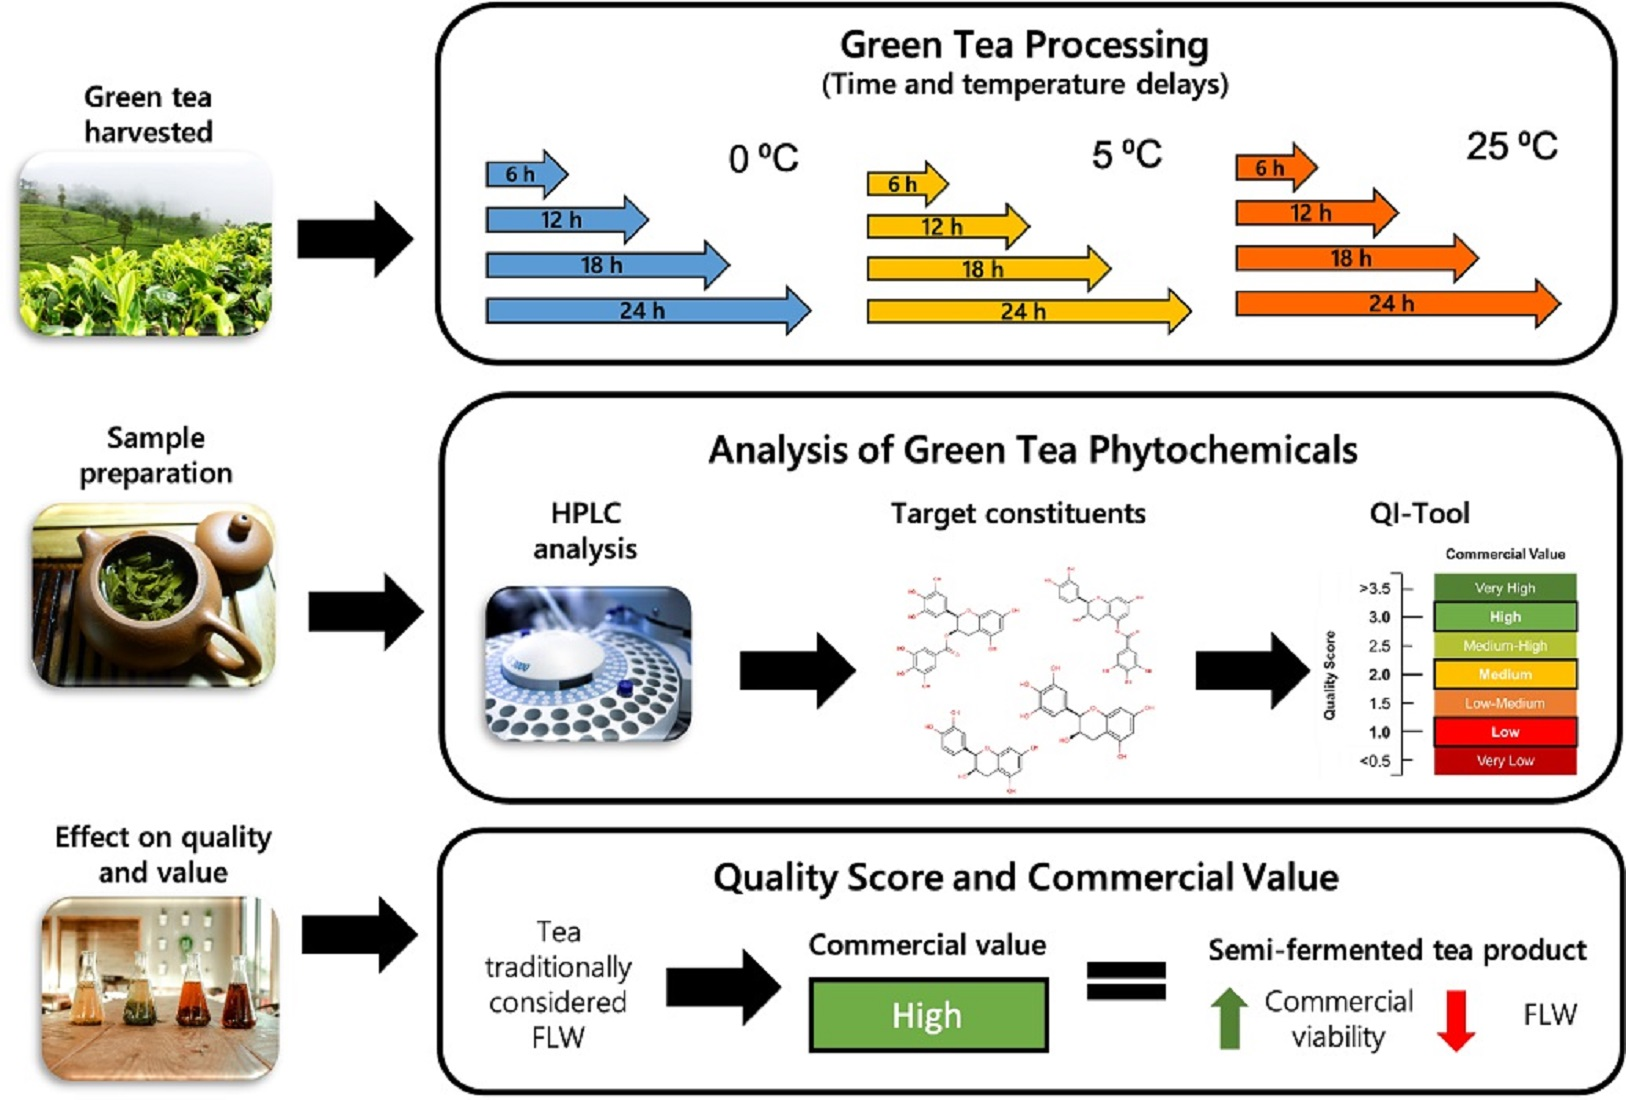
Therefore, the primary aim of this study was to evaluate the impact of time delay and temperature conditions during post-harvest processing of Japanese-styled green tea, specifically on the commercial quality, functional properties and production of FLW from green tea material grown in Australia.
2. Materials and Methods
2.1. Green Tea Horticultural Description and Conditions
The green tea samples used in the current study were Camellia sinensis var. sinensis plants grown on the New South Wales, Central Coast of Australia. The cultivar was Yabukita, with a plant age of approximately 10 to 12 years. All rows were planted as single cultivars, with the major cultivars separated from one another by areas of non-planted space (i.e., local maintained grass).
The site was situated on an elevated plateau (33°18′6.43″ S, 151°11′29.99″ E, 250 m a.s.l) with relatively flat topography and no slope in any direction. The growing conditions of the plants were maintained using a constant pressure drip irrigation system for water. The soil was partly sandy and provided adequate drainage to a depth of 150 cm above a rocky clay sub-layer. Designated control plants consisted of plants within the same row as the treatment plants at each of the study sites. This ensured they were exposed to similar factors, such as sunlight intensity and direction, and that the experimental factors were the only major differences between the treatment and control plants. The control and treatment groups comprised equal numbers of Yabukita green tea plants of similar maturity and health.
2.2. Green Tea Collection and Processing
Samples were collected during the summer (second) harvest (i.e., February). The fresh plant material underwent mixing to homogenize the total sample before being re-sampled into 12 equal 1 kg samples. Each sample was allocated to a processing delay of 6, 12, 18 or 24 h at a temperature of 0, 5 and 25 °C. A control sample was immediately processed after harvest. The processing method employed low-pressure steam denaturing of PPO in a screw-driven tumble steamer. The leaves were hot air tumble-dried for 20 min, hot press single-direction roller dried for 20 min, then dried in a warm incubating oven for 40 min to reach a moisture content below 6%. All samples were packaged into high moisture and light barrier laminate packaging and transported to the University of Newcastle (Ourimbah, NSW, Australia) for analysis. The green tea samples were stored in a cool, dry and dark ambient condition before analysis.
This method was used because the hand harvesting and processing technique would not be truly representative of the scale and effect of unprocessed raw green tea material that can occur under commercial storage conditions. The processing equipment used was pilot plant-sized, designed and obtained for the application (Kawasaki Heavy Industries Ltd., Kobe, Japan), but the specific processes were perfected by the Kunitaro Coffee and Tea Company (Tokorozawa, Japan). The target moisture content of the teas after this processing was between 3 and 6% (w/w), as determined using a calibrated moisture balance (Sartorius 11213–98, Cole-Parmer Australia, Willoughby, Australia).
2.3. Chemicals and Reagents
All chemicals used in this study were of analytical grade. Acetonitrile, tetrahydrofuran, orthophosphoric acid, L-tryptophan, caffeine, theanine and the catechins (EC, (-)-epicatechin; ECG, (-)-epicatechin-3-gallate; EGC, (-)-epigallocatechin; EGCG, (-)-epigallocatechin-3-gallate; GCG, (-)-gallocatechin gallate) were purchased from Sigma–Aldrich (Castle Hill, NSW, Australia). Deionized water was prepared on the day, using the Millipore water purification system with a resistivity greater than 18 MΩ cm−1 (Millipore Australia, North Ryde, NSW, Australia).
2.4. Sample Preparation and Processing
Green tea samples were prepared in triplicate for each treatment group. This involved the brewing of 1 g of green tea in 100 mL of deionized water with 0.002% L-tryptophan added to each sample as an internal standard. Samples were agitated for 20 min in a shaking water bath before being cooled immediately on ice (until the temperature was less than 4 °C). After cooling, the samples were filtered (0.22 µm) and analysed using high-performance liquid chromatography (HPLC).
2.5. Qualitative–Quantitative Analysis of Green Tea Phytochemicals
The analytical method used in this study was a combination of two previously published and verified methods of reverse-phase HPLC, capable of the separation of caffeine, EC, ECG, EGC, EGCG and GCG [
23] and the identification of theanine in green tea [
24]. The HPLC method was employed for its reliable identification and measurement of the seven target constituents (theanine, caffeine, EC, ECG, EGC, EGCG and GCG). Standard curves of each pure reagent with the addition of 0.02% L-tryptophan, for use as an internal standard were produced for each target constituent and used as reference standards to quantify and identify the target constituents within the green tea samples.
The analysis of each green tea sample was completed in duplicate, and the output was calculated as the mean concentration (mg/g of dried tea) of each target constituent. If duplicate results varied from one another by greater than 2%, the samples were rejected from analysis as an outlier and re-assayed. The HPLC was conducted using a Shimadzu analytical HPLC system, controlled via an SCL-10A VP control unit and the Class-VP 5.03 software (Shimadzu Analytical Australia, Rydalmere, Australia). The system used an LC-10AT Liquid Chromatography Pump, and samples were initiated via a SIL-10AXL VP auto-injector with a 100 μL sample loop. A reverse phase C18 Phenomenex Synergi Fusion-RP (Phenomenex Inc., Lane Cove, NSW, Australia) was used within a 12–25% acetonitrile gradient elution pattern over a 60 min separation period at a constant column temperature of 25 °C [
19]. Detection was achieved using a SPD-10A/10AV UV detection unit set to 280 nm and 210 nm wavelengths.
2.6. Measurement of Quality
The determination of product quality and commercial value was achieved using the Quality Index (QI) Tool, previously described in detail in [
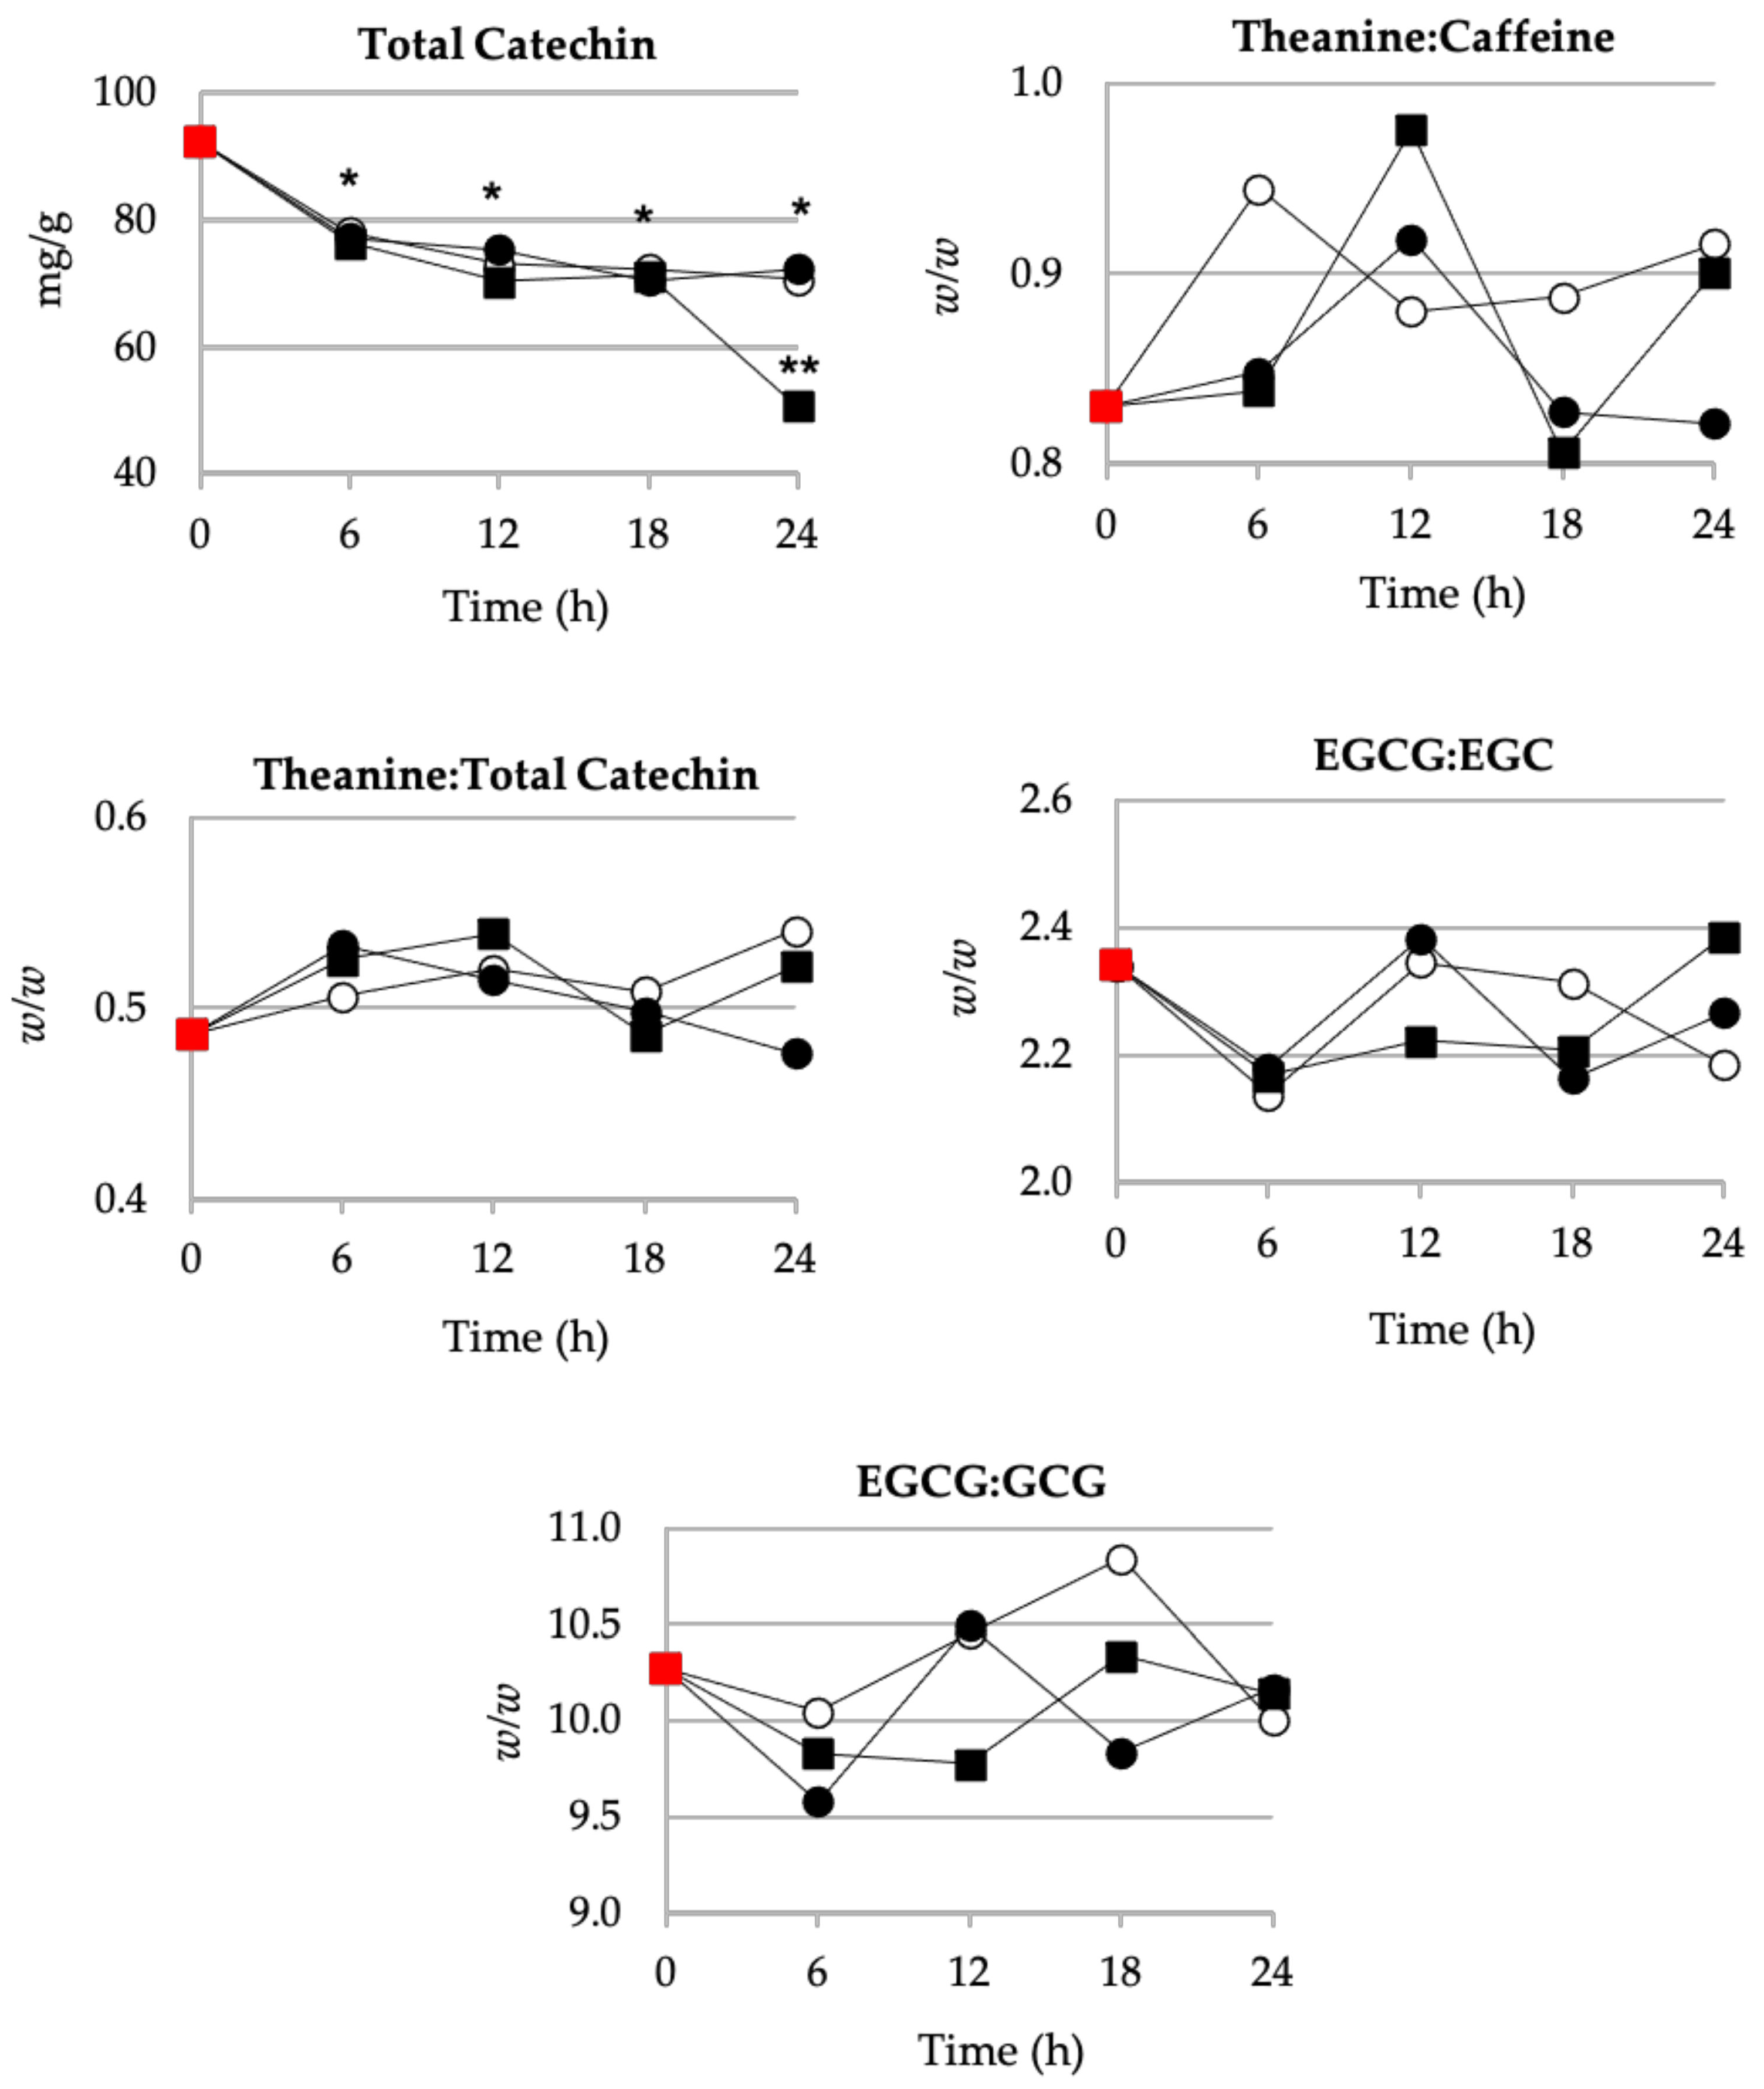
25]. Briefly, the QI-Tool relies upon quantitative analysis of individual target constituents, being theanine, caffeine and the catechins (EC, ECG, ECG, EGCG and GCG) to identify five Quality Markers (QM) of green tea:
Total catechins: EC, EGC, ECG, EGCG and GCG (mg/g tea)
Theanine:total catechin (w:w)
Theanine:caffeine (w:w)
EGCG:EGC (w:w)
EGCG:GCG (w:w)
For each sample, the QM and commercial value were calculated from the quantitative data. The mean value from each triplicate was used for comparison and variation analysis. The Quality Scores of each sample were calculated for each time-temperature relationship, as was the mean of each of the five QM’s.
2.7. Statistical Analysis
Data were analysed using SPSS 26.0 Statistics for Windows (IBM Corp 2021, Armonk, NY, USA). Mean ± SD are presented. Multivariant analysis was used to determine the preservation effect of time and temperature of storage conditions for each target constituent with Bonferroni post hoc analysis to determine individual differences between treatment groups. The significance level was considered at p < 0.05.
3. Results
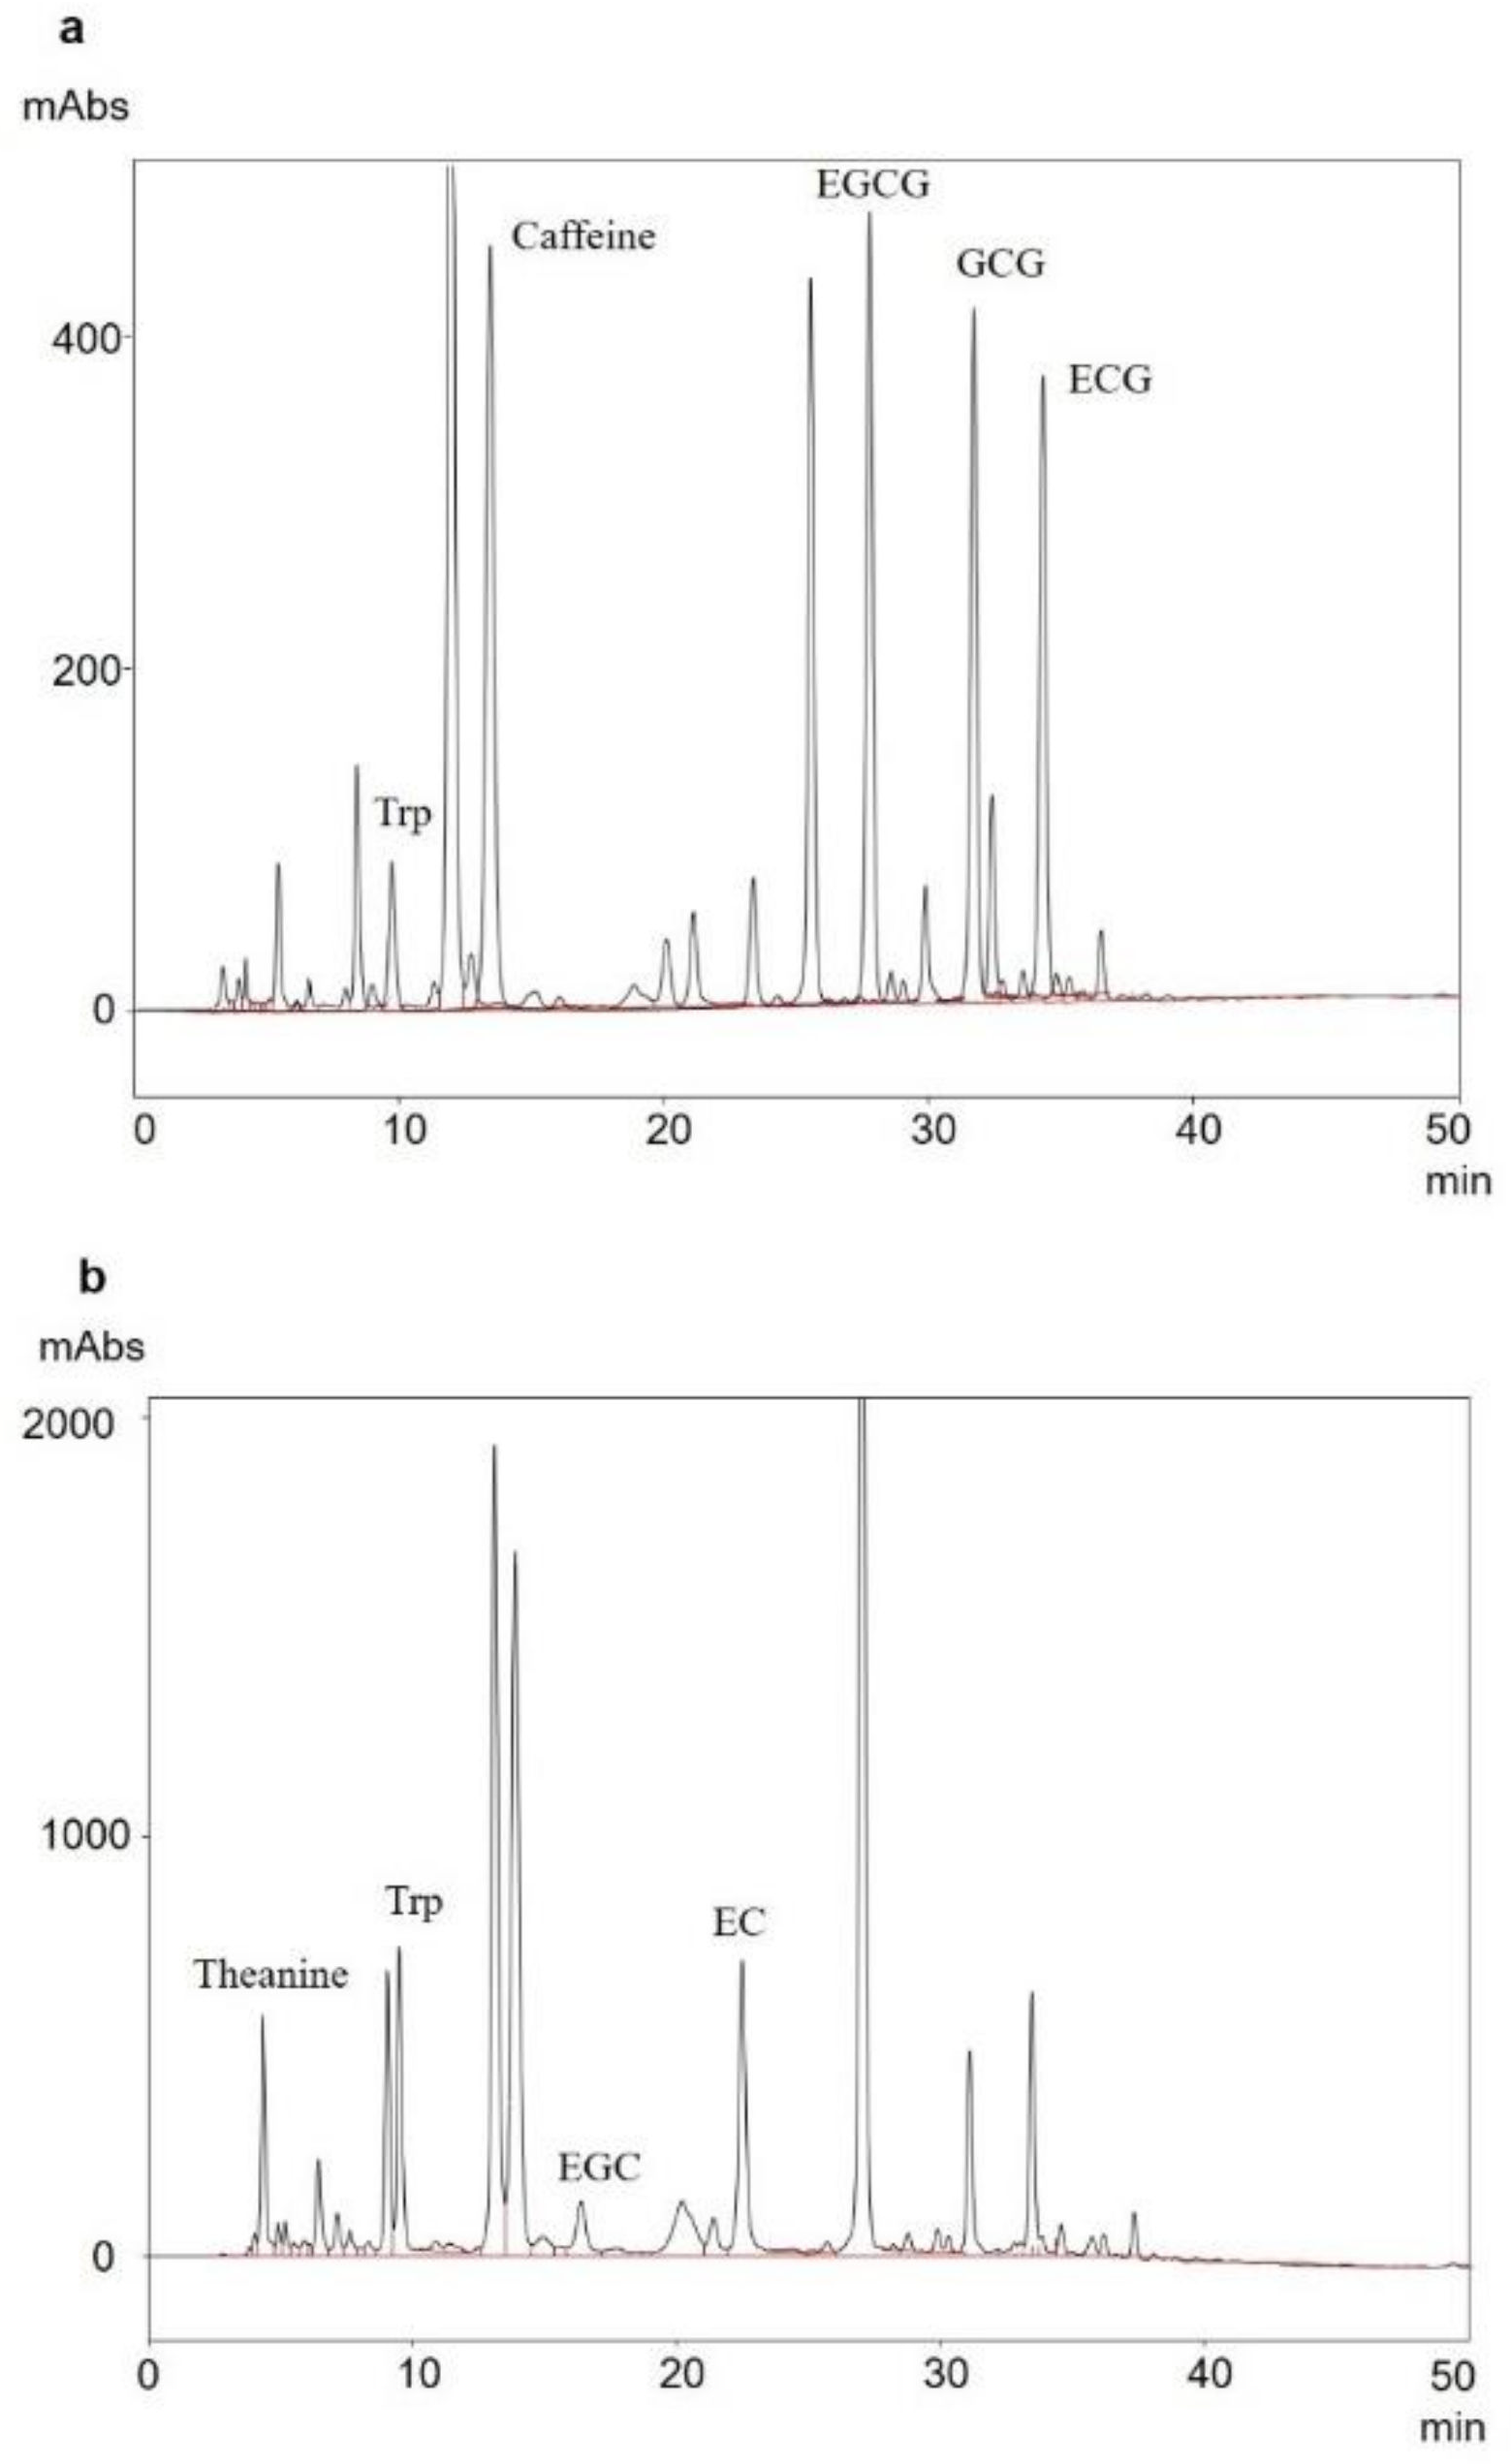
The separation of the seven target constituents of green tea was successfully achieved via HPLC. Adequate separation of the internal standard and the target constituents: caffeine, EGCG, GCG and ECG were achieved at 280 nm (
Figure 1a), and theanine, L-tryptophan (internal standard), EGC and EC were achieved at 210 nm (
Figure 1b).
Figure 2 illustrates the separation of target constituents of typical green tea samples at 280 nm (
Figure 2a) and 210 nm (
Figure 2b).
The concentration of the major green tea constituents theanine, caffeine and the catechins (EC, ECG, ECG, EGCG and GCG) after controlled temperature storage at 0, 5 and 25 °C for periods up to 24 h post-harvest, are shown in
Table 1. The maximum concentration of all target constituents was recorded within the control sample, which was steam processed immediately after harvesting. The raw green tea material quality was highest and most biochemically concentrated when it was freshly harvested from the plant.
There were no significant time and temperature relationships. Despite this, significant (p < 0.05) losses in caffeine, EGCG, GCG and ECG were identified when compared to the control after a 6 h processing delay, which is equivalent to a delay commonly encountered within a medium-sized commercial processing facility. Further, there was a trend towards the preservation of theanine, caffeine and the catechins at storage conditions of 0 and 5 °C. When compared to the sample stored at 25 °C for 24 h (see sample 12), there were significant differences in all target constituents (p < 0.05).
The effect of storage time–temperature conditions upon the five QMs is presented in
Figure 3. The total catechin content for all samples stored at 0, 5 and 25 °C post-harvest rapidly declined within the first 6 h (
p < 0.01) and then stabilized over the remaining 18 h, except for samples stored at 25 °C, which continued to decline up to a 24 h period (
p < 0.001). The effect of storage temperature during processing delays did not significantly affect the QM ratios of theanine: total catechin, theanine: caffeine, EGCG:EGC and EGCG:GCG.
Tea that was stored at 25 °C for 24 h post-harvest yielded the highest Quality Score and generated the greatest commercially valuable product (
Table 2). Interestingly, this sample group (samples 10 to 12) also recorded the lowest concentration for all target constituents (
Table 1). Overall, samples achieved a medium (~
$300 USD) commercial value.
4. Discussion
In this study, green tea was sourced from the summer harvest, where the total catechin concentration within the plant naturally increases due to the higher sunlight intensity over the Australian summer period. This, in turn, encourages catechin antioxidant production, as the plant produces fewer chloroplasts, resulting in a less intense green colour within the harvested material. The quality of the summer harvest raw green tea material was highest and most biochemically concentrated when it was freshly collected from the plant.
These findings align with existing consensus amongst green tea manufacturers and the previously published literature [
26,
27]. This could be due to the reactions responsible for the formation of dark pigments, theaflavins and thearubigins, forming from chlorophyll and catechin precursors, which begin very soon after harvest. Additionally, the loss in constituent concentration occurred independently of storage temperature conditions and was predominantly influenced by processing time delays. These findings indicate that summer harvested green tea material produces some of the defining characteristics of oolong or other semi-fermented tea products (i.e., oxidation of catechins) due to post-harvest storage conditions.
Further, it may be plausible that the product quality as measured by the QI-Tool was influenced by the specificity of the tool towards green tea samples, which have not assumed some of the attributes of semi-fermented teas. Hence, the total catechin concentration was moderated by degradation within the unprocessed raw green tea materials. The concentration of total catechins mimicked that of a moderate quality spring (first) harvested tea where catechins are converted to other larger oxidated compounds, such as lignin [
28]. Despite the higher commercial quality in tea that was delayed for up to 24 h, this was somewhat misleading albeit objectively correct, as the manufactured product from process delayed materials is less similar to optimal quality green tea, but rather more similar to optimal semi-fermented teas. It should therefore be considered that the processing of raw green tea materials that may otherwise be considered suboptimal or outside of typical production specification can still produce a commercially acceptable tea product.
Any raw material produced for human consumption that is removed from the value chain for any reason may be considered FLW [
29,
30]. Globally, this equates to 1.6 billion tons annually [
30,
31] and includes raw material rejected due to inferior quality or not meeting manufacturing specifications [
32]. Often in primary export-focused supply chains that rely on premiums from overseas markets for continued viability, the processing of lower grade material is considered high risk. In the case of green tea production, harvested material subject to delayed processing is traditionally considered FLW. Efficiency and due diligence programs have been shown to improve the on-farm management at agricultural production sites to counteract the effects of high FLW industries. The integration of agricultural producers into the processing value chain has also resulted in further efficiencies [
33]. These programs allow for the standardisation of post-harvest or pre-manufacture processing and standardisation of practices for the storage of raw materials [
34]. They are mutually beneficial for the primary and secondary producer, creating larger volumes of an optimal commercial product, resulting in improved profits filtering back through the value chain [
1]. The problem with these highly integrated and efficient supply chains is the introduction of out-of-specification raw materials and products, referred to as the creation of FLW. Due to the co-location of supply chains, this was not initially considered as a significant problem, as the unused organic material could be reutilised using common on-farm practices or used in animal feed. However, as the size and value of supply chains have grown and become delocalised, FLW has also become a significant and complex problem with the potential to considerably impact total supply chain value and export and manufacturing volumes [
35].
When a green tea product has begun to take on characteristics of a semi-fermented tea, the constituent profile changes, this, in turn, results in perceived errors in the calculation of the Quality Score. Teas which are considered of lower production quality and often deemed as FLW, can, as shown in this study, improve in quality as measured by the QI-Tool. Whilst this can be initially viewed as a limitation of the QI-Tool and reduce its industry translation potential, this study presents a potentially lucrative commercial opportunity. As shown in the results, there is a consumer-led quality preference towards teas with lower total catechin concentration, which could be due to their association with milder levels of astringency, often highly desired by the common consumer. Additionally, the subsequent loss of catechin content via PPO activity and simultaneous chlorophyll breakdown reduces the green colour of the tea [
36]. In return, this may further increase consumer desirability from a visual perspective.
Whilst there may still be a commercial benefit for manufacturers to process green tea raw material that has undergone processing delays, particularly from summer harvests which are naturally higher in total catechin content, a delicate balance between improving the taste whilst minimising the decline of visual appeal must be achieved if products are to be sold as green tea.
5. Conclusions
The findings of the current study provide a deeper understanding of the impact of post-harvest processing conditions on the product quality and commercial value of green tea for summer or late harvest materials. Later harvests produce more FLW than spring harvested material because it is less commercially prized and thus tends to be treated less carefully. The volumes of summer harvests can also vary as a result of longer sunlight hours and warmer temperatures. Harvesting later in the season means that manufacturing facilities prioritise spring harvested material.
The drawbacks to using catechin ratios to measure product quality and advocating for the measurement of important bioactive constituents were highlighted. Whilst the QI-Tool is capable of quantifying the quality of green tea products, it appears limited in its ability to discriminate objectively between teas of a different classification. This is also limited by the lack of consumer behaviour being included in manufacturing assessments.
Rarely will consumers exclusively consume one classification of tea—some may consume a cup of green tea in the morning and a cup of black tea during the day or in the evening (or vice versa). Furthermore, others will purchase and consume new and different products but return to personal favourites over the longer term. This behaviour can indicate that consumers have diverse acceptance profiles, something that the QI-Tool being calibrated to a range of tiered consumer products incorporates—as such, using the tool to focus on desirable profiles allows for consistent consumer acceptance within the manufacturing Quality Assurance and Control function but also innovation and new product development within Research and Development functions.
In our study, when summer harvested green tea raw material was exposed to post-harvest processing delays and variations in storage temperature conditions, it began to take on some of the defining characteristics of oolong or other semi-fermented teas. These products, which are traditionally considered FLW, were showing similar consumer profiles to a high-quality semi-fermented tea.
Therefore, based on the findings from this study, it is proposed that hybrid tea products within the spectrum of green to semi-fermented teas may be acceptable by consumers, which were once thought to be considered as FLW. This could provide a more economical option for consumer markets with less traditional or historical perceptions related to the particular colour or classification of their tea, such as in the USA, Australia, New Zealand, and the Middle East. In turn, this creates a possible solution to reducing FLW from later harvested green tea, driving more value back into the green tea manufacturing supply chain.
Author Contributions
Conceptualization, J.K., M.A.K. and N.N.; Data curation, J.K.; Formal analysis, J.K., M.A.K. and N.N.; Methodology, J.K., M.A.K. and N.N.; Validation, J.K., M.A.K. and N.N.; Writing—original draft, J.K.; Writing—review and editing, J.K., M.A.K. and N.N. All authors have read and agreed to the published version of the manuscript.
Funding
This research received no external funding.
Data Availability Statement
Data available on request due to restrictions.
Acknowledgments
We greatly acknowledge the work of the New South Wales Department of Industry and Investment—Primary Industries Central Coast NSW and Kunitaro Coffee and Tea Company for completing the harvesting and processing of the green tea samples for this project.
Conflicts of Interest
J.K. currently works as the Innovation Manager at the Food Innovations Australia (FIAL), and the described project was completed at the University of Newcastle prior to his employment at FIAL. The authors declare no conflict of interest.
References
- Golding, J.; Roach, P.; Parker, S. Production of High Quality Export Green Tea through Integrated Management; Rural Industries Research and Development Corporation: Canberra, ACT, Australia, 2009. [Google Scholar]
- Austin, T.; Cavill, R.; Chaffey, S.; Gerber, A.; Morgan, M. The Australian Growers Guide: Japanese Green Tea; Australian Green Tea Growers Association: Victoria, Australia, 2006. [Google Scholar]
- Cheng, W.H. Green Tea: An ancient antioxidant drink for optimal health? J. Nutr. 2019, 149, 1877–1879. [Google Scholar] [CrossRef]
- Xing, L.; Zhang, H.; Qi, R.; Tsao, R.; Mine, Y. Recent advances in the understanding of the health benefits and molecular mechanisms associated with green tea polyphenols. J. Agric. Food Chem. 2019, 67, 1029–1043. [Google Scholar] [CrossRef] [PubMed]
- Cermak, R.; Durazzo, A.; Maiani, G.; Bohm, V.; Kammerer, D.R.; Carle, R.; Wiczkowski, W.; Piskula, M.K.; Galensa, R. The influence of postharvest processing and storage of foodstuffs on the bioavailability of flavonoids and phenolic acids. Mol. Nutr. Food Res. 2009, 53 (Suppl. 2), S184–S193. [Google Scholar] [CrossRef] [PubMed]
- Stodt, U.W.; Blauth, N.; Niemann, S.; Stark, J.; Pawar, V.; Jayaraman, S.; Koek, J.; Engelhardt, U.H. Investigation of processes in black tea manufacture through model fermentation (oxidation) experiments. J. Agric. Food Chem. 2014, 62, 7854–7861. [Google Scholar] [CrossRef] [PubMed]
- Li, Y.; Shibahara, A.; Matsuo, Y.; Tanaka, T.; Kouno, I. Reaction of the black tea pigment theaflavin during enzymatic oxidation of tea catechins. J. Nat. Prod. 2010, 73, 33–39. [Google Scholar] [CrossRef] [PubMed]
- Shewfelt, R.L.; Prussia, S.E.; Sparks, S.A. Challenges in handling fresh fruits and vegetables. In Postharvest Handling: A Systemas Approach; Florkowski, W.J., Shewfelt, R.L., Brueckner, B., Prussia, S.E., Eds.; Academic Press Inc.: Cambridge, MA, USA, 2014. [Google Scholar]
- Batziakas, K.G.; Singh, S.; Ayub, K.; Kang, Q.; Brecht, J.K.; Rivard, C.L.; Pliakoni, E.D. Reducing postharvest losses of spinach stored at nonoptimum temperatures with the implementation of passive modified atmosphere packaging. HortScience 2020, 55, 326–335. [Google Scholar] [CrossRef]
- Zokti, J.A.; Sham Baharin, B.; Mohammed, A.S.; Abas, F. Green tea leaves extract: Microencapsulation, physicochemical and storage stability study. Molecules 2016, 21, 940. [Google Scholar] [CrossRef] [PubMed]
- Friedman, M.; Levin, C.E.; Lee, S.U.; Kozukue, N. Stability of green tea catechins in commercial tea leaves during storage for 6 months. J. Food Sci. 2009, 74, H47–H51. [Google Scholar] [CrossRef]
- Chen, Q.; Liu, A.; Zhao, J.; Ouyang, Q. Classification of tea category using a portable electronic nose based on an odor imaging sensor array. J. Pharm. Biomed. Anal. 2013, 84, 77–83. [Google Scholar] [CrossRef]
- Qin, Z.H.; Pang, X.L.; Chen, D.; Cheng, H.; Hu, X.S.; Wu, J.H. Evaluation of Chinese tea by the electronic nose and gas chromatography-mass spectrometry: Correlation with sensory properties and classification according to grade level. Food Res. Int. 2013, 53, 864–874. [Google Scholar] [CrossRef]
- Wang, Y.; Kan, Z.; Thompson, H.J.; Ling, T.; Ho, C.T.; Li, D.; Wan, X. Impact of Six Typical Processing Methods on the Chemical Composition of Tea Leaves Using a Single Camellia sinensis Cultivar, Longjing 43. J. Agric. Food Chem. 2019, 67, 5423–5436. [Google Scholar] [CrossRef] [PubMed]
- Xu, W.; Song, Q.; Li, D.; Wan, X. Discrimination of the production season of Chinese green tea by chemical analysis in combination with supervised pattern recognition. J. Agric. Food Chem. 2012, 60, 7064–7070. [Google Scholar] [CrossRef] [PubMed]
- Yu, D.; Gu, Y. A Machine Learning Method for the Fine-Grained Classification of Green Tea with Geographical Indication Using a MOS-Based Electronic Nose. Foods 2021, 10, 795. [Google Scholar] [CrossRef]
- Dutta, R.; Kashwan, K.R.; Bhuyan, M.; Hines, E.L.; Gardner, J.W. Electronic nose based tea quality standardization. Neural. Netw. 2003, 16, 847–853. [Google Scholar] [CrossRef]
- Chang, Y.; Zhang, Z.; Yoshino, K.; Zhou, S. Farmers’ tea and nation’s trees: A framework for eco-compensation assessment based on a subjective-objective combination analysis. J. Environ. Manag. 2020, 269, 110775. [Google Scholar] [CrossRef]
- Koch, W.; Kukula-Koch, W.; Komsta, L.; Marzec, Z.; Szwerc, W.; Glowniak, K. Green tea quality evaluation based on its catechins and metals composition in combination with chemometric analysis. Molecules 2018, 23, 1689. [Google Scholar] [CrossRef] [PubMed]
- Li, X.; Zhang, L.; Ahammed, G.J.; Li, Z.X.; Wei, J.P.; Shen, C.; Yan, P.; Zhang, L.P.; Han, W.Y. Stimulation in primary and secondary metabolism by elevated carbon dioxide alters green tea quality in Camellia sinensis L. Sci. Rep. 2017, 7, 7937. [Google Scholar] [CrossRef] [PubMed]
- Prusky, D. Reduction of the incidence of postharvest quality losses, and future prospects. Food Secur. 2011, 3, 463–474. [Google Scholar] [CrossRef]
- Galani, J.H.Y.; Patel, J.S.; Patel, N.J.; Talati, J.G. Storage of fruits and vegetables in refrigerator increases their phenolic acids but decreases the total phenolics, anthocyanins and vitamin C with subsequent loss of their antioxidant capacity. Antioxidants 2017, 6, 59. [Google Scholar] [CrossRef] [PubMed]
- Hirun, S.; Roach, P. A study of stability of (-)-Epigallocatechin gallate (EGCG) from green tea in a frozen product. Int. Food Res. J. 2011, 18, 1261–1264. [Google Scholar]
- Vuong, Q.V.; Golding, J.B.; Stathopoulos, C.E.; Nguyen, M.H.; Roach, P.D. Optimizing conditions for the extraction of catechins from green tea using hot water. J. Sep. Sci. 2011, 34, 3099–3106. [Google Scholar] [CrossRef] [PubMed]
- Krahe, J.C.; Krahe, M.A.; Roach, P.D. Development of an objective measure of quality and commercial value of Japanese-styled green tea (Camellia L. sinensis): the Quality Index Tool. J. Food Sci. Technol. 2018, 55, 2926–2934. [Google Scholar] [CrossRef] [PubMed]
- Sharpe, E.; Hua, F.; Schuckers, S.; Andreescu, S.; Bradley, R. Effects of brewing conditions on the antioxidant capacity of twenty-four commercial green tea varieties. Food Chem. 2016, 192, 380–387. [Google Scholar] [CrossRef] [PubMed]
- Peluso, I.; Serafini, M. Antioxidants from black and green tea: from dietary modulation of oxidative stress to pharmacological mechanisms. Br. J. Pharmacol. 2017, 174, 1195–1208. [Google Scholar] [CrossRef] [PubMed]
- Teng, R.M.; Wang, Y.X.; Li, H.; Lin, S.J.; Liu, H.; Zhuang, J. Effects of shading on lignin biosynthesis in the leaf of tea plant (Camellia sinensis (L.) O. Kuntze). Mol. Genet. Genom. 2021, 296, 165–177. [Google Scholar] [CrossRef] [PubMed]
- Gorzen-Mitka, I.; Bilska, B.; Tomaszewska, M.; Kolozyn-Krajewska, D. Mapping the structure of food waste management research: A co-keyword analysis. Int. J. Environ. Res. Public Health 2020, 17, 4789. [Google Scholar] [CrossRef]
- Ishangulyyev, R.; Kim, S.; Lee, S.H. Understanding food loss and waste: Why are we losing and wasting food? Foods 2019, 8, 297. [Google Scholar] [CrossRef]
- Pickin, J.; Randell, P.; Trinh, J.; Grant, B. National Waste Report 2018; Department of the Environment and Energy, Ed.; Blue Environment Pty Ltd.: Canberra, ACT, Australia, 2018.
- Papargyropoulou, E.; Lozano, R.; Steinberger, J.K.; Wright, N.; bin Ujang, Z. The food waste hierarchy as a framework for the management of food surplus and food waste. J. Clean. Prod. 2014, 76, 106–115. [Google Scholar] [CrossRef]
- Sheng, Y.; Jackson, T. A Manual for Measuring Total Factor Productivity in Australian Agriculture; Department of Agriculture and Water Resources, Ed.; Australian Government: Canberra, ACT, Australia,, 2015.
- Luo, J.; Ji, C.; Qiu, C.; Jia, F. Agri-food supply chain management: bibliometric and content analayses. Sustainability 2018, 10, 1573. [Google Scholar] [CrossRef]
- Roy, T.N. Supply Chain Management of Horticultural Crops, In Value Addition of Horticultural Crops: Recent Trends and Future Directions; Sharangi, A.B., Datta, S., Eds.; Springer: New Delhi, India, 2015; pp. 293–314. [Google Scholar]
- Owuor, P.O.; Obanda, M. Comparative responses in plain black tea quality parameters of different tea clones to fermentation temperature and duration. Food Chem. 2001, 72, 319–327. [Google Scholar] [CrossRef]
| Publisher’s Note: MDPI stays neutral with regard to jurisdictional claims in published maps and institutional affiliations. |
© 2021 by the authors. Licensee MDPI, Basel, Switzerland. This article is an open access article distributed under the terms and conditions of the Creative Commons Attribution (CC BY) license (https://creativecommons.org/licenses/by/4.0/).


