Article

Precision of a Small Brew House by Determining the Repeatability of Different Brews to Guarantee the Product Stability of the Beer

1
Faculty III Process Sciences—Institute of Food Technology and Food Chemistry, Technical University of Berlin, Straße des 17. Juni 135, 10623 Berlin, Germany
2
Ziemann Holvrieka GmbH, Schwieberdinger Str. 86, 71636 Ludwigsburg, Germany
3
Faculty 7—Applied Biosciences and Process Technology, Anhalt University of Applied Sciences, Bernburger Str. 55, 06366 Köthen (Anhalt), Germany
*
Author to whom correspondence should be addressed.
Beverages 2019, 5(4), 67; https://doi.org/10.3390/beverages5040067
Submission received: 31 October 2019 / Revised: 18 November 2019 / Accepted: 20 November 2019 / Published: 1 December 2019

Abstract

:
The most important success factors of a brewery are to brew a high-standard beer and to sell this product successfully on the market. Especially, guaranteeing an objective product quality is a difficult task, in terms of beer quality, for craft brewers. Following these product stability parameters is not only necessary to secure the expiry date but also with regard to the repeatability of the brews (from batch to batch). To evaluate the precision of a small brew house (1 hL), three different beer types, lager beer (Pilsener), pale ale (Kölsch), and wheat beer (Weißbier) were repeatedly produced and analyzed. It was found that small fluctuations in the wort preparation, in terms of time or analysis, have no noticeable difference on the sensory characteristics of the final product. Nevertheless, strict adherence to the brew recipe and raw material monitoring are necessary in order to keep these deviations as minimal as possible. Finally, this study verified that microbrews can be repeated so that the consumers will not detect any differences with their five senses in the end.

1. Introduction

The demand for individual and unique tasting beers is constantly increasing. Craft brewers follow this trend and create new recipes with special raw materials. More than 150 types of beer are already accepted [1,2]. It is essential for brewers to be able to produce their beer varieties repeatedly in the same quality. Regardless of the size of the brewery, customer satisfaction has first priority. The factors that determine beer quality for a customer are taste, smell, color, and beer foam [3]. A deviation from the well-known appearance and taste would directly attract the consumer’s attention and cause a negative association.
For craft breweries, it is a challenge to produce constant quality. On the one hand, they usually do not have the possibilities of process monitoring like breweries with a 24/7 production. On the other hand, it takes too long to analyze raw materials and semi-finished products (e.g., wort) in an external laboratory and to react to changes in composition with recipe adjustments. In addition, craft breweries usually try to produce in a cost-effective manner; however, they do not save on raw materials. They often use special raw materials in large quantities, such as aroma hops in the form of pellets and cone hops. This significantly contributes to the taste and uniqueness of the beer [4]. Conversely, if the product quality is not consistent, there will be considerable financial losses.
Another aspect is the participation of small breweries with their products for an external award for outstanding quality. With a moderate financial effort, the company can increase its level of awareness supraregionally and market the product’s quality. In addition, such an award motivates employees. The prerequisite for achieving a medal is the production of a constant product quality [5].
With the limitations and possibilities for small breweries mentioned above, the question arises of how a brewer can produce a constant beer quality if the brewing plant is not able to produce a constant objective quality. The term objective product quality means product stability with its three dimensions: Physico-chemical, microbiological, and sensorical stability [6].
For this purpose, a series of experiments were carried out, which are described in this paper. In order to determine the repeatability r of a brewing plant with a 1-hL batch size, a total of six brews were performed. Due to the difficulty of identifying sensory differences in strong hopped beers, standard beer types were selected for the test series: Pale ale (Kölsch), lager beer (Pilsener) and wheat beer (Weißbier). In the process, various beer parameters as well as the taste of the beer were examined and compared.

2. Materials and Methods

2.1. Beer Production

Brewing was carried out in a 1-hL pilot plant (BAM, Brauerei-Anlagen-Marketing, Freising, Germany). Each selected type of beer was brewed twice. The two pale ales and two lager beers were brewed on one day each, while the two wheat beers were produced on two different days. The total period for brewing all beers was 1.5 weeks. For the production of the beers, various raw materials corresponding to the beer types were utilized, which are listed in Table 1. It was ensured that the raw materials were processed from the same production lots.
The malt was milled with a two-roller mill (Künzel Maschinenbau GmbH, Mainleus, Germany) set at a 0.7-mm roller distance. As the raw materials mentioned above, the mashing process was also adapted to the beer types. For the pale ale, the following mashing scheme was utilized: 63 °C/40 min, 65 °C/30 min, 72 °C/30 min, and 77 °C/11 min. The mash of the lager beer was produced as follows: 57 °C/10 min, 63 °C/35 min, 72 °C/20 min, and 78 °C/5 min. While the following rest times were applied for the wheat beer: 45 °C/10 min, 52 °C/10 min, 62 °C/30 min, 72 °C/30 min, and 78 °C/10 min. The heating rate corresponded to 1 °C/min. In all brews, the mash was separated using a lauter tun. The average lautering time for the pale ale was 3.72 h, for the lager beer 4.35 h, and for the wheat beer 8.83 h. The wort was boiled for one hour with the corresponding hop dosing times, as shown in Table 2. With the sour wort, the worts of the pale ale and lager beer were adjusted to pH 5.1 to 5.2.
Depending on the beer type, the whirlpool rest times varied: 30 min for pale ale, 40 min for lager beer, and 20 min for wheat beer. After trub separation, the wort was cooled down to the respective pitching temperature: 9 °C for the bottom-fermented beer (lager beer) and 15 °C for the top-fermented beers (pale ale and wheat beer). The duration of fermentation varied from 4 days for pale ale and 9 days for wheat beer, to 11 days for lager beer until the final attenuation was reached. Subsequently, the beers were stored at 3 to 4 °C for about 6 weeks. After 2 weeks of storage, the beers were examined for the relevant parameters. The filled bottles were stored at 3 to 5 °C.

2.2. Analyses

The beer samples were analyzed for: pH value with HI99161 Foodcare HACCP-pH Meter from Hanna Instruments Deutschland GmbH (Vöhringen, Germany), density/original gravity/alcohol content with DMA 35N from Anton Paar Germany GmbH (Ostfildern-Scharnhausen, Germany), total nitrogen (WBBM 2.6.1.1 [7] by Kjeldahl), coagulable (coag.) nitrogen (WBBM 2.6.2 [7]), bittering units (BUs) (WBBM 2.17.1 [7]), viscosity with a Höppler falling ball viscometer (WBBM 2.25.1 [7]), and color with Neo Comparator (WBBM 2.12.1 [7]).

2.3. Equations

In order to calculate the repeatability of the brewhouse, Equations (1)–(3) were selected according to DIN ISO 5725:1981-11 [8]. Equation (1) illustrates the calculation of the repeatability standard deviation (sr). For the determination of the repeatability according to DIN [8], the quantile 2.00 instead of 1.96 was utilized, resulting in Equation (2). In order to obtain a more accurate result with a smaller number of repetitions, the factor f can be multiplied instead of the quantile, see Equation (3). However, the DIN recommends the utilization of Equation (2). Since the repeatability r refers to the difference of two analysis results and factor f depends on the number of test results, factor 2 results. Factor f differs not much from the value 2 provided, that there is an approximate normal distribution, a probability of 95%, and a sufficiently large number of analysis results. Since in this test series the number of analysis results appears low with six values, the repeatability with factor f was also calculated for comparison:
s r = j = 1 m i = 1 n j ( x ij   x ¯ j ) 2 N m
where sr is the repeatability standard deviation, m is the quantity of beer types, nj is the quantity of the individual determinations of the beer type j, xj is the mean of the individual determinations, and N is the total number of determinations.
r DIN = 2.00 · 2 · s r = 2.83 · s r
where r is the repeatability according to DIN ISO 5725:1981-11 [8] and sr is the repeatability standard deviation.
r t = f · 2 · s r
where rt is the repeatability, sr is the repeatability standard deviation, f is the factor f, as a function of the confidence level, γ = 95%, and the quantity of measured values, n = 2.
In order to be able to compare the yield of the individual brews in the brewhouse, the equation for calculating the brewhouse yield is shown below [9]:
Y bh = e c   ·   ρ   ·   0.96   ·   c w a   g
where Ybh is the brewhouse yield in %, ec is the extract content of cast wort in kg/dt,   ρ is the density of the cast wort in kg/m3, cwa is the amount of cast wort in hL, and g is the grist in dt.

3. Results

3.1. Wort Preparation
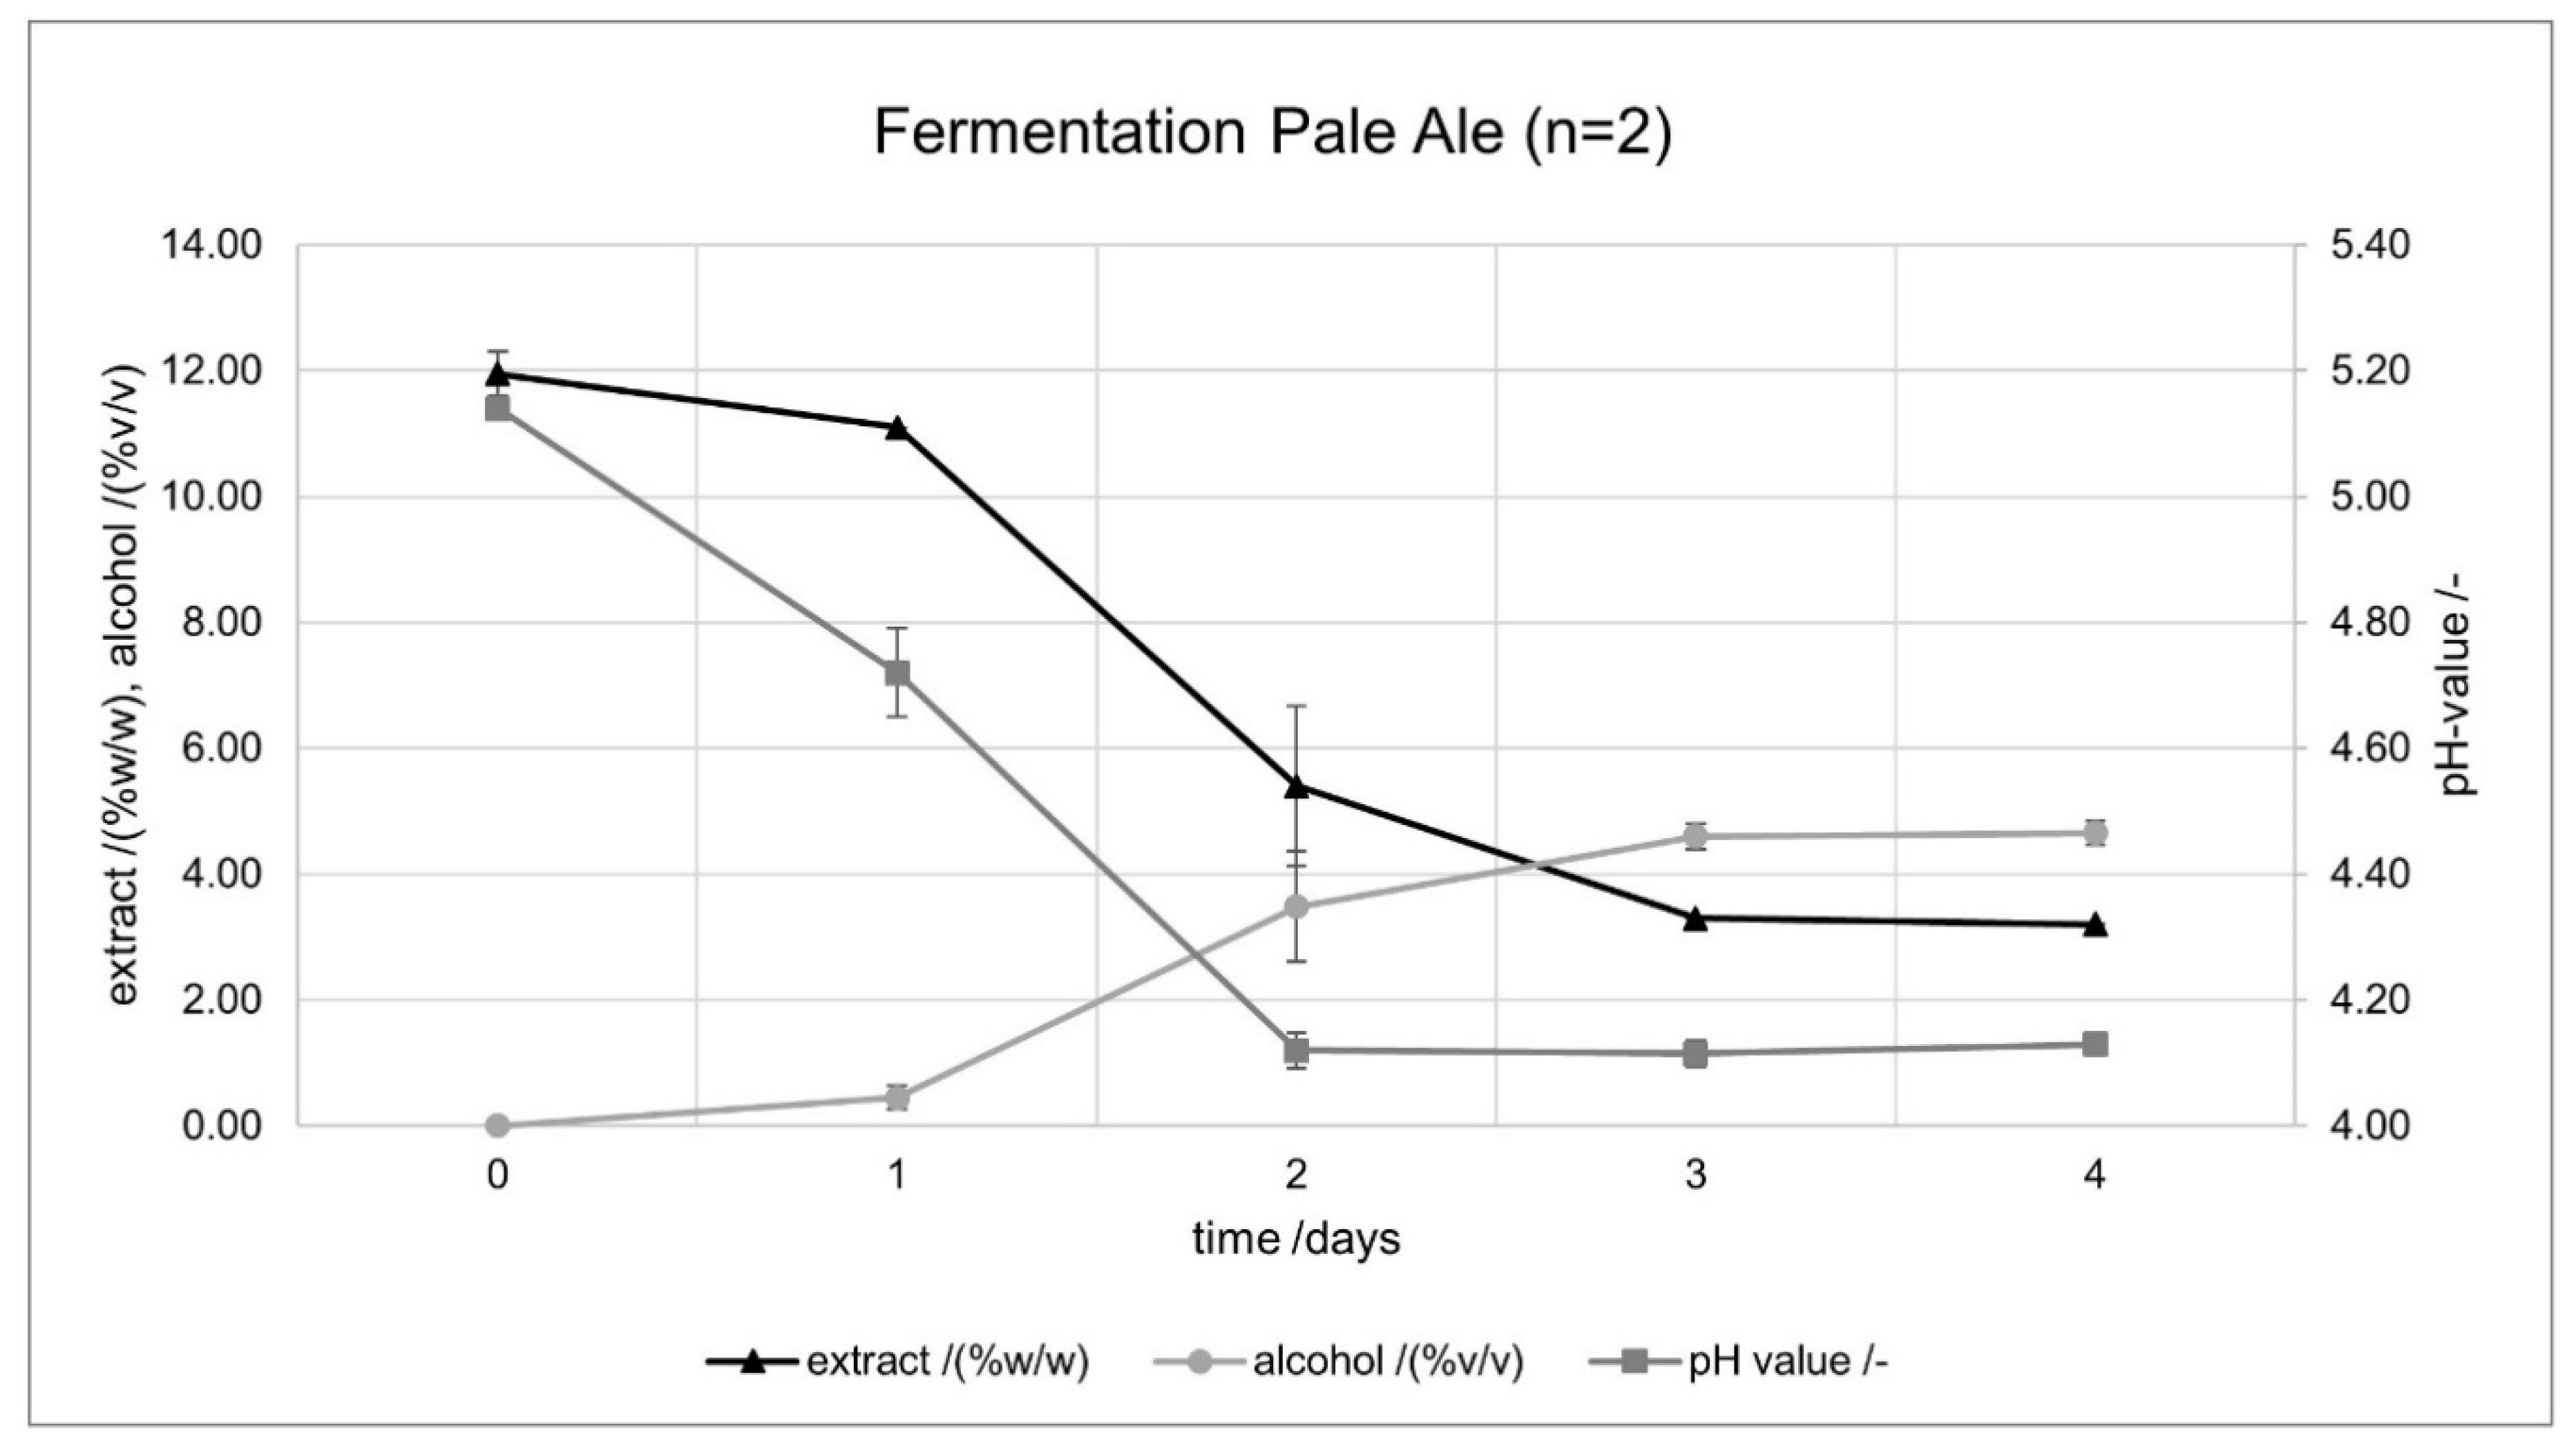
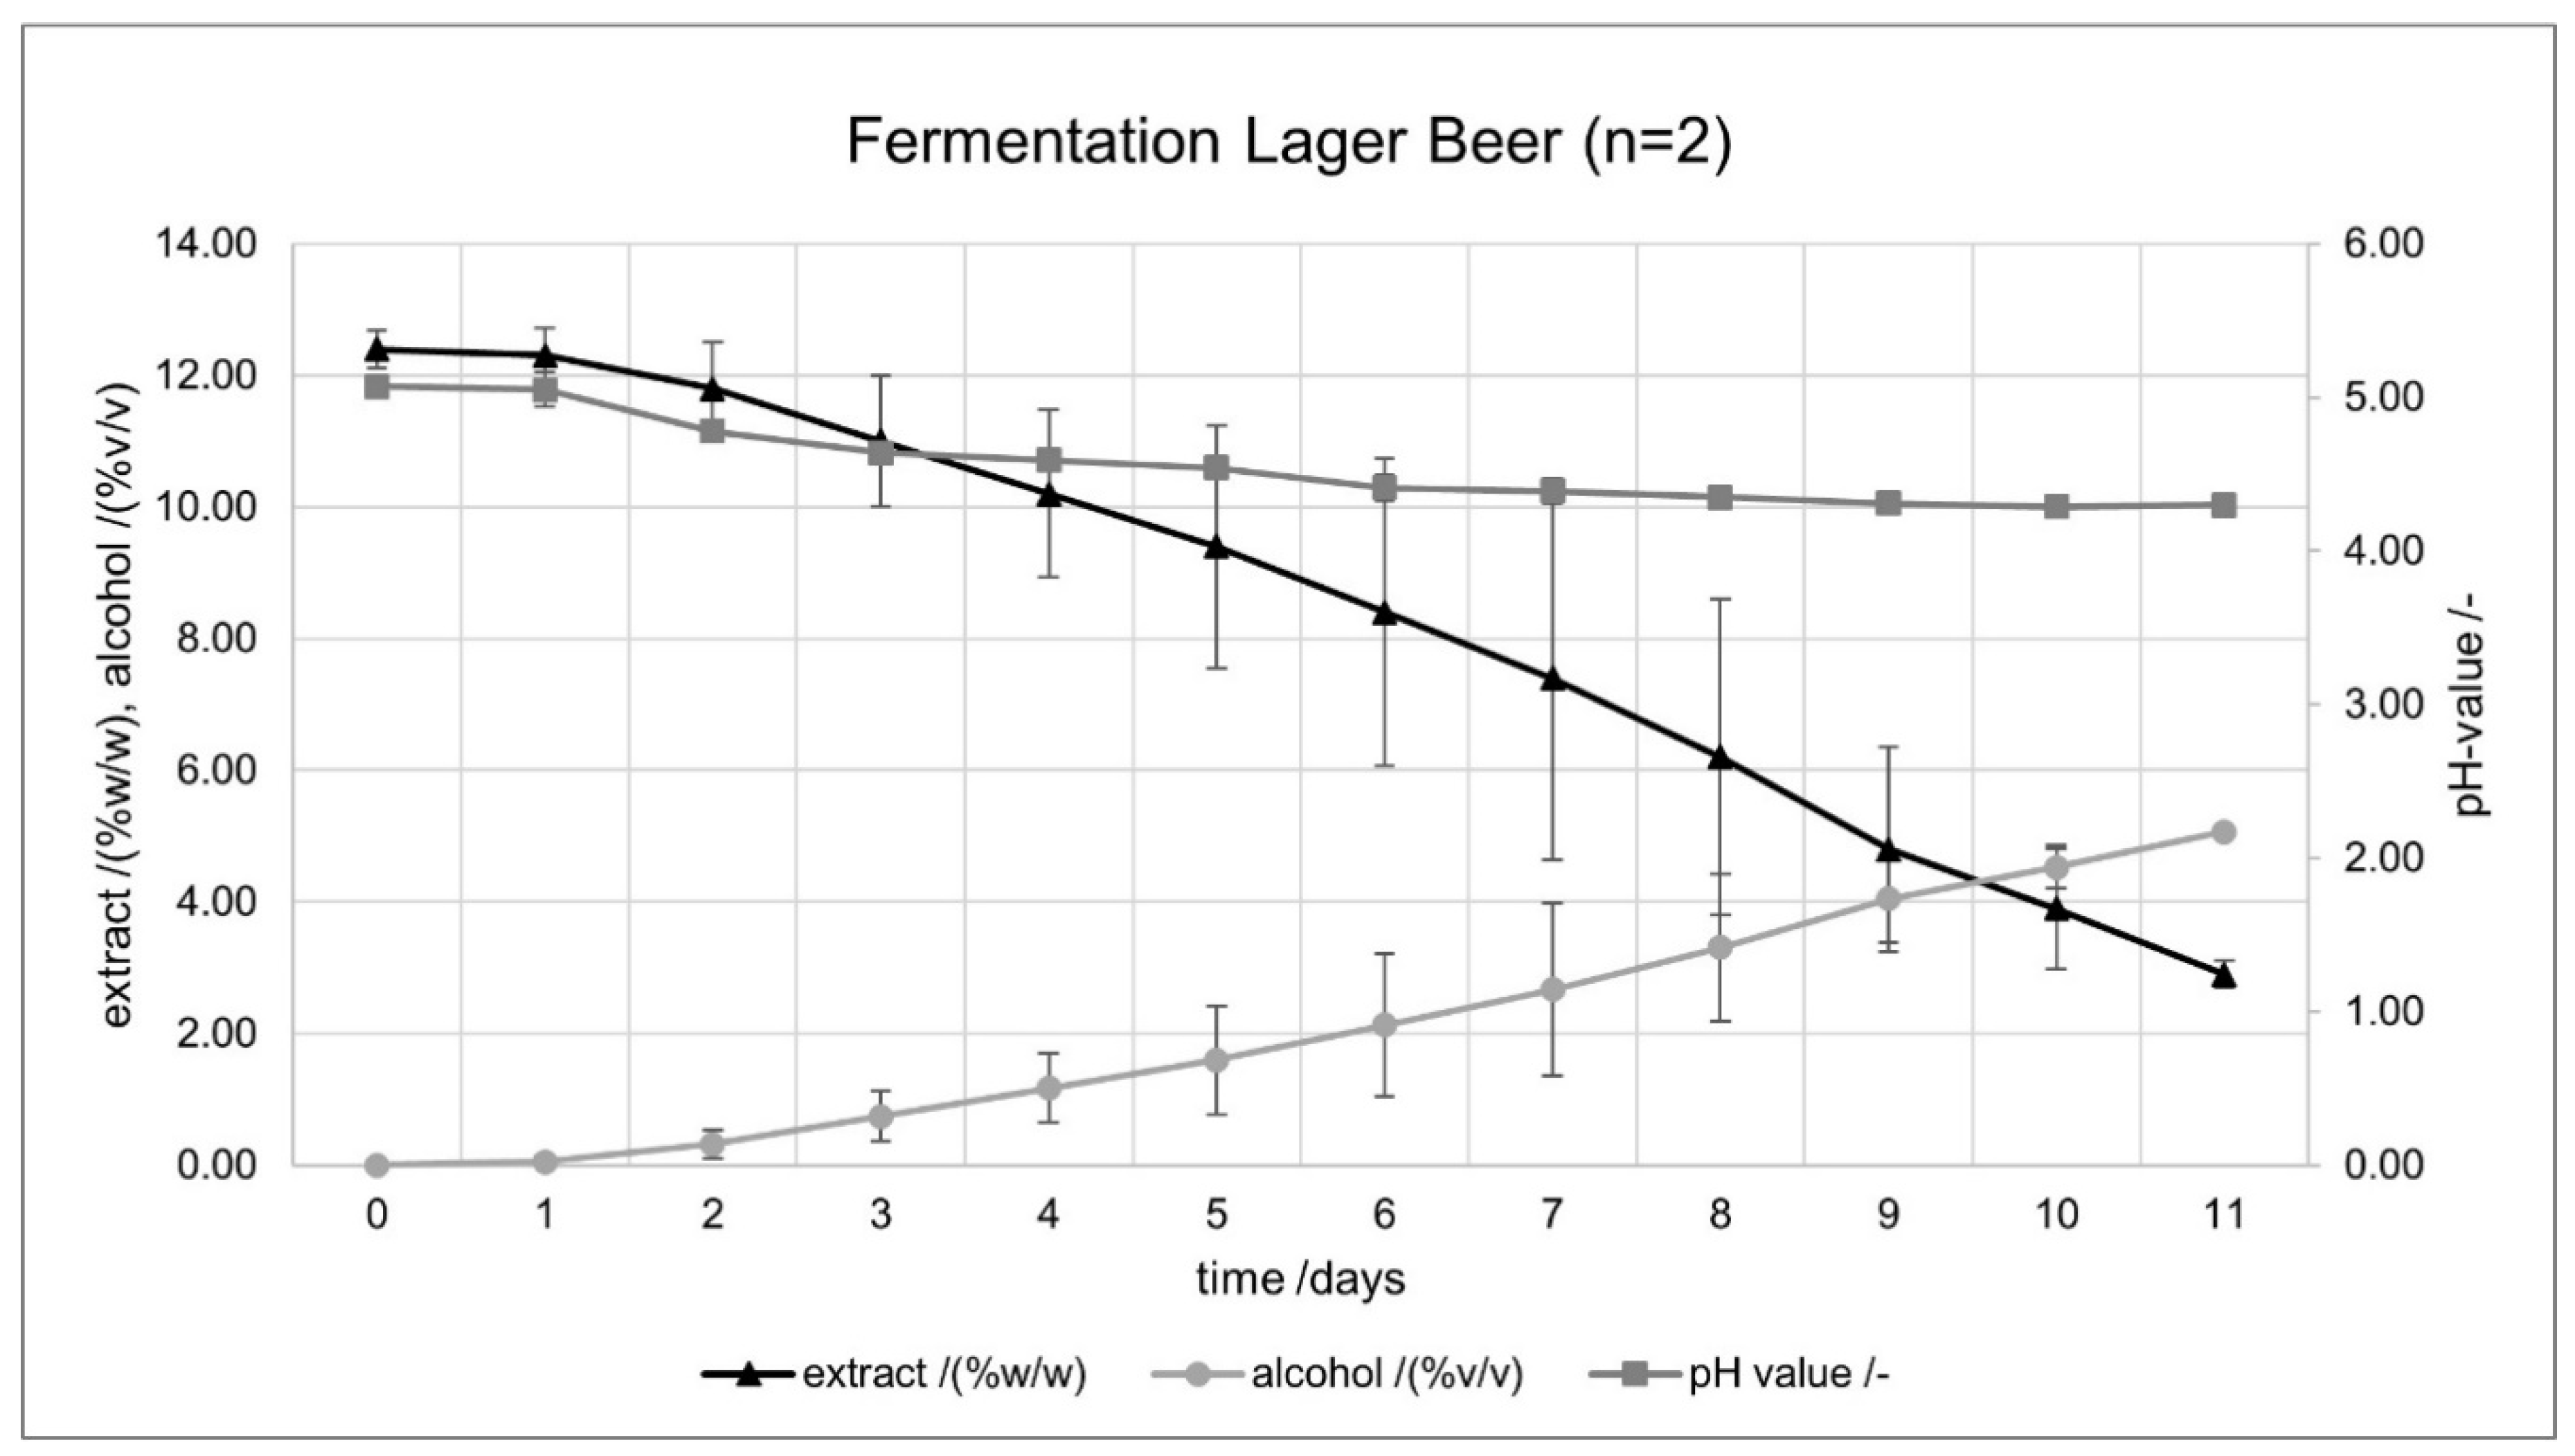
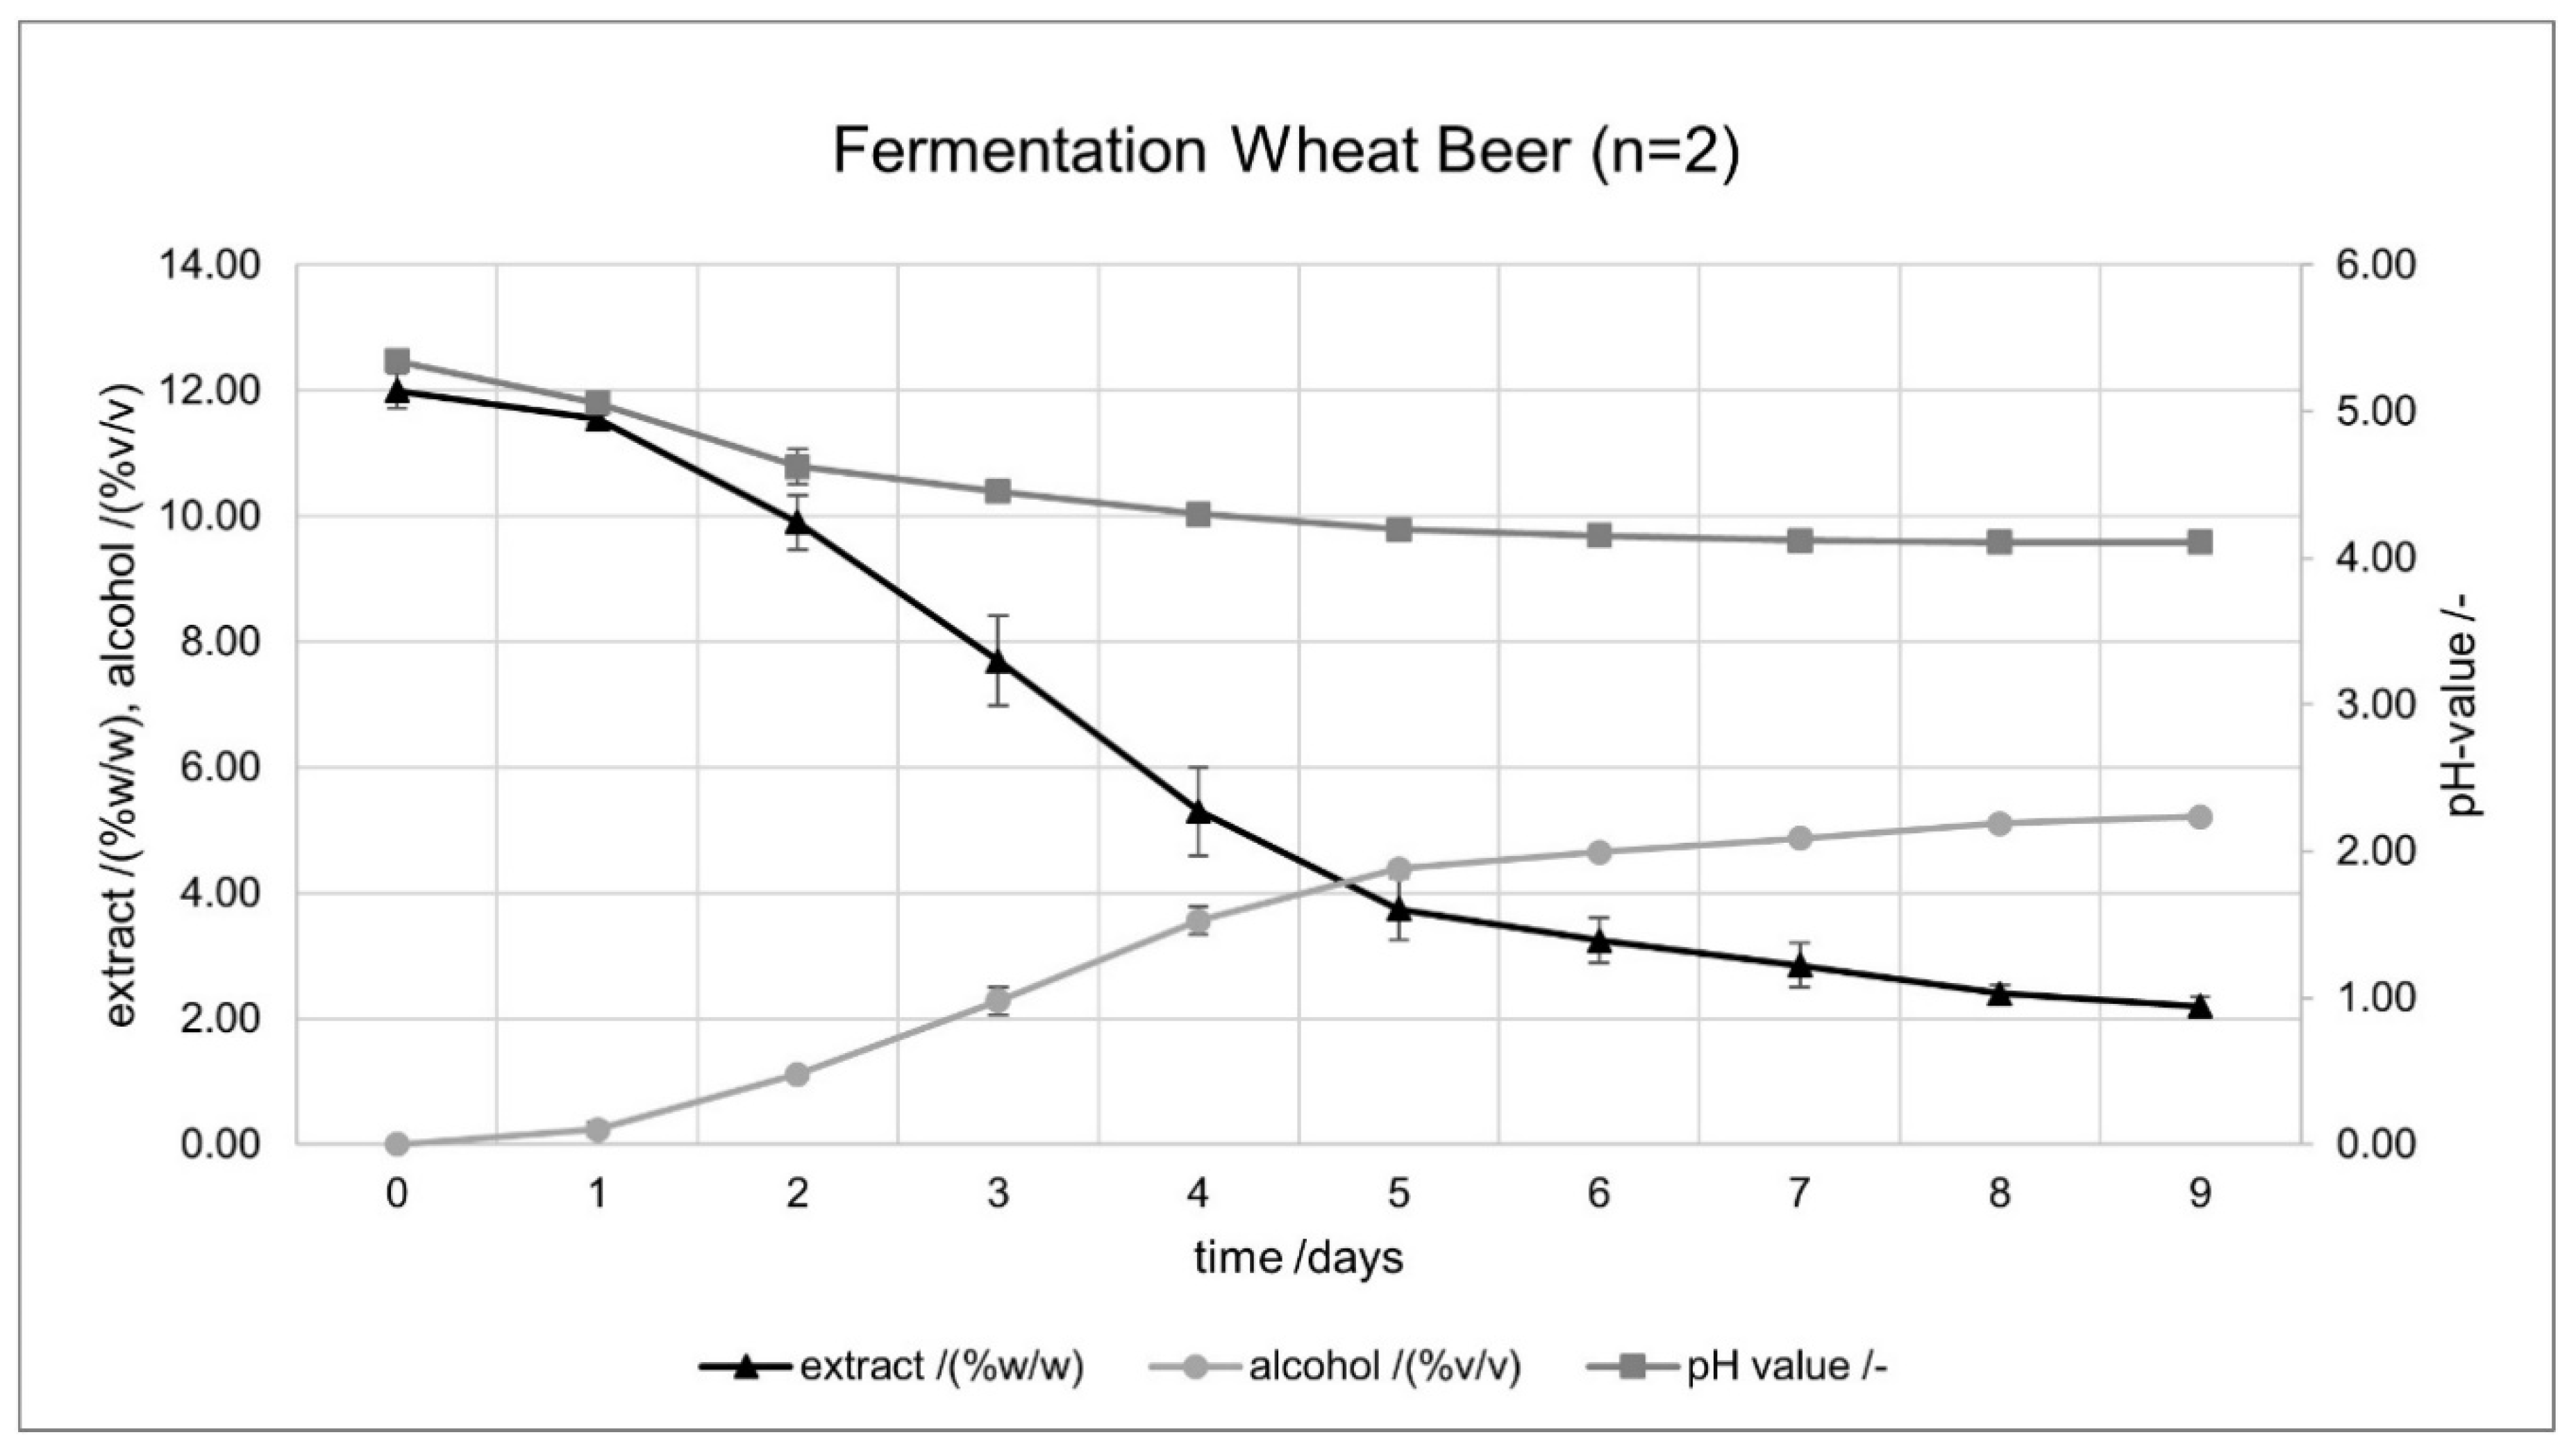
The most important parameters for monitoring the wort preparation process are presented in Table 3. In pale ale and lager beer preparation, the pH curve decreases from preboil wort (on average pH 5.68/5.53) to cast wort (on average pH 5.14/5.10). The reason for this is the addition of sour wort to obtain a more beneficial pH value for protein precipitation and fermentation [10]. For all beer types, a comparison between the first and second brew reveals differences in the spent grains quantity, in the wort preparation time and ultimately also in the brewhouse yield, despite compliance with the recipes. The brewhouse yield (Equation (4)) is a measure of the effectiveness of brewhouse work. It considers the proportion of malt that has been transferred to the wort during mashing and lautering [9]. Variations between the parameter values of the respective brews are due to process fluctuations and raw material-related changes in the brewing process. The following evaluation of fermentation, beer parameter, and the sensory evaluation will show whether these fluctuations affect beer quality and stability.

3.2. Fermentation

Summaries of the fermentation processes are shown in Figure 1, Figure 2 and Figure 3 by the degradation of the extract, the drop in pH, and the increase in alcohol content. The error indicators in the figures represent the standard deviations.
Between the individual beer types, there are significant differences in the fermentation time and the associated extract degradation. Figure 1 shows the curve of the pale ale. With a fermentation time of 4 days, it shows the shortest time, but the extract was only degraded to 3.20/(%w/w) on average. This is also reflected in the lower alcohol content of 4.66/(%v/v). The lager beer has the longest fermentation time with 11 days (Figure 2), a reduction of the extract to 2.75/(%w/w), and an alcohol content of 5.04/(%v/v). For the second top-fermented beer, the wheat beer, the fermentation time was 9 days (Figure 3). The extract degraded to 2.20/(%w/w) and the product contained an average of 5.22/(%v/v) alcohol.
The different extract values achieved in beer can be explained by the utilized yeast strains. According to the data sheet [11], the Safbrew™S-33 yeast strain achieves an apparent attenuation of 70%, which was achieved in both brews with 73.77% and 72.65%. The yeast strain Saflager™W34/70 [12], applied for the lager beer, reaches an apparent attenuation of up to 83%, which was not matched in the experiment with 78.33% and 79.03%. The wheat beer fermented with Safbrew™ WB-06 (apparent attenuation: 86% [13]) shows the highest apparent degree of fermentation, with 82.20% and 82.79%, respectively. The increases in the apparent attenuation are reflected in the aforementioned extracts of the beers.

3.3. Beer Parameter

The following section shows the values of selected beer parameters and calculates their repeatability for the corresponding beer types. This theoretical consideration should provide information on whether it is possible to produce a constant beer quality in a microbrewery or craft brewery. Table 4 contains the mean values for the individual brews ( x ¯ , y ¯ , z ¯ ) as well as the calculated repeatabilities according to DIN ISO 5725 rDIN [8] (Equation (2)), rt calculated with factor f (Equation (3)), and repeatabilities of the analyses from MEBAK, rMEBAK. The value of repeatability indicates the maximum difference between two repetitions in 95% of the measurements. Comparison of the values rDIN and rt shows that the values calculated with factor f are always greater than the values calculated according to DIN. This is due to the higher value of the t-quantile of 4.501. As the number of repetitions decreases, the t-quantile increases. However, this allows the repeatability to be calculated more precisely for small numbers of repetitions.
The comparison with rMEBAK indicates high repeatability for the parameter coaguable nitrogen/(mg/L) and color/EBC. A slight deviation of 0.018 to 0.048 can be observed for the pH value, as well as a significant deviation in viscosity/mPas. Besides the comparison to rMEBAK, the bittering units/EBC show a great repeatability. The calculated repeatability of the bittering units has a value of rDIN 2.95 and rt 4.68. Due to the values of the lager beer brews with 33.50 EBC and 31.00 EBC, these fluctuating repeatabilities occur. Only trained people can identify the difference in the taste of 2.5 EBC in this bitter range, since the evaluation of bitterness is not one of the human strengths [14]. In addition, the examination of the repeatability of a brewing plant cannot be one-to-one compared with the examination of the repeatability of an analytical method in terms of time. First, the brew must be produced and then the analysis can take place. This can also explain the fluctuations of the measured values as well as the calculated repeatabilities compared to rMEBAK. Nevertheless, the sensory triangle test described in the next section must be awaited.

3.4. Sensory Evaluation

Since customers do not judge beer according to analytical values, but by taste, odor, color, and beer foam, a sensory tasting was carried out with 10 participants according to DIN EN ISO 4120 [15]. For this purpose, the beers were bottled and checked by means of a triangle test to see whether there was a significant difference in taste between the first brew and the second brew of a beer type. In addition, bottles of the brews were artificially aged for 24 h in a warming cabinet at 60 °C and tasted against the fresh beers. The statistics of this particular triangular test were already explained in the publication of Titze et al. [6]. For the sake of completeness, the results (Table 5) are shown and utilized for the evaluation in this article.
At a significance level of α = 0.05, at least seven tasters must correctly identify (right answer in Table 5) the deviating sample in order to detect a significant difference between them. This threshold was not reached in any of the six tastings. Consequently, a significant difference between the two brews of the beer types, fresh or aged, could not be identified. Conversely, this does not prove that there is no significant difference between the test samples at all. To confirm this, at least 23 [6], better 24 to 30 [15] tasters would be necessary.

4. Conclusions

For the determination of repeatability, DIN ISO 5725:1981-11 [8] specifies that constant test conditions should prevail. This includes, for example, that the verification should be carried out within a short time interval. The aim is to reduce fluctuations of the factors. The difficulty of such constancy applied in particular to the repetition of wort and beer preparation is evident, as already demonstrated by the monitored brewhouse parameters. Influencing factors are, for example, raw material fluctuations or system-related variations—especially by human factor—as well as combination of these.
The evaluation of the selected beer parameters showed that not all repeatabilities were within the MEBAK limits. However, the triangle test confirmed that these deviations in the calculated repeatability were not detectable from a taste point of view, as the brews could not be distinguished significantly. The test series demonstrated that a constant beer quality can be produced in microbreweries or craft breweries. A prerequisite for this is strict adherence to the recipe (in process analytics) as well as consideration of raw material fluctuations and subsequent recipe adjustments. This is the necessary condition for the brewer to maintain the beer quality expected by the consumer.

Author Contributions

Methodology, J.T.; validation, N.B.; investigation, M.G.; data curation, N.B.; writing—original draft preparation, N.B.; writing—review and editing, J.T.; visualization, N.B.; supervision, J.T.

Funding

This research received no external funding.

Acknowledgments

The authors would like to thank Jörg Wikert, Ilona Jawinski and Jil Schwarze for their support in beer preparation, beer analyses and the triangle test.

Conflicts of Interest

The authors declare no conflict of interest.

References

  1. Miller, S.R.; Sirrine, J.R.; McFarland, A.; Howard, P.H.; Malone, T. Craft Beer as a Means of Economic Development: An Economic Impact Analysis of the Michigan Value Chain. Beverages 2019, 5, 35. [Google Scholar] [CrossRef]
  2. Guido, L.F. Brewing and Craft Beer. Beverages 2019, 5, 51. [Google Scholar] [CrossRef]
  3. Lukinac, J.; Mastanjević, K.; Mastanjević, K.; Nakov, G.; Jukić, M. Computer Vision Method in Beer Quality Evaluation-A Review. Beverages 2019, 5, 38. [Google Scholar] [CrossRef] [Green Version]
  4. Biendl, M.; Engelhard, B.; Forster, A.; Gahr, A.; Lutz, A.; Mitter, W.; Schmidt, R.; Schönberger, C. Hops. Their Cultivation, Composition and Usage, 1st ed.; Fachverlag Hans Carl: Nürnberg, Germany, 2015. [Google Scholar]
  5. Titze, J. Qualitätssiegel oder Medaille? Güte und Sicherheit von Produkten richtig kommunizieren. Getränkeindustrie 2010, 10, 52–55. [Google Scholar]
  6. Titze, J.; Ilberg, V.; Huber, H.W. Garantie der Produktstabilität: Die objektive Qualität als zentraler Erfolgsfaktor für Craft-Biere. Brauindustrie 2018, 11, 24–27. [Google Scholar]
  7. Wort, Beer, Beer-based Beverages. Collection of Brewing Analysis Methods of the Mitteleuropäische Brautechnische Analysenkommissio, New ed.; Jacob, F. (Ed.) MEBAK: Freising-Weienstephan, Germany, 2013; ISBN 978-3-9805814-7-9. [Google Scholar]
  8. Deutsches Institut für Normung, e.V. Bestimmung von Wiederholbarkeit und Vergleichbarkeit durch Ringversuche; DK 519.23:620.1.08:31:658.562 (DIN ISO 5725:1981-11); Beuth Verlag GmbH: Berlin, Germany, 1981. [Google Scholar]
  9. Kunze, W.; Mieth, H.O. Technology Brewing and Malting, 2nd rev. Internat Ed.; VLB berlin: Berlin, Germany, 1999; ISBN 3-921-690-39-0. [Google Scholar]
  10. Die Bierbrauerei. Band 2: Die Technologie der Würzebereitung; Narziss, L.; Back, W. (Eds.) Wiley-VCH: Hoboken, NJ, USA, 2009; ISBN 978-3-527-32533-7. [Google Scholar]
  11. Safbrew™ S-33. Data Sheet; Fermentis Division of S.I. Lesaffre, Ed.; Marcq-en-Baroeul, France. 2018. Available online: https://www.hobbybrauerversand.de/mediafiles/Datenblaetter/Fermentis/SFB_S33_DE.pdf (accessed on 31 October 2019).
  12. Saflager™ W-34/70. Data Sheet; Fermentis Division of S.I. Lesaffre, Ed.; Marcq-en-Baroeul, France. 2018. Available online: https://www.hobbybrauerversand.de/mediafiles/Datenblaetter/Fermentis/SFG_W34_DE.pdf (accessed on 31 October 2019).
  13. Safbrew™ WB-06. Data Sheet; Fermentis Division of S.I. Lesaffre, Ed.; Marcq-en-Baroeul, France. 2018. Available online: https://www.hobbybrauerversand.de/mediafiles/Datenblaetter/Fermentis/SFB_WB06_DE.pdf (accessed on 31 October 2019).
  14. Joh. Barth & Sohn GmbH & Co. KG. Humulus Lupulus … und andere bittere Wahrheiten: Bittere Einsichten zu Bittereinheiten. Brauindustrie 2008, 29, 29. [Google Scholar]
  15. Deutsches Institut für Normung e.V. Sensorische Analyse-Prüfverfahren-Dreiecksprüfung; DIN EN ISO 4120-2009; Beuth Verlag GmbH: Berlin, Germany, 2009. [Google Scholar]
Figure 1. Curvature of extract/(%w/w), pH value/-, and alcohol content/(%v/v) during pale ale fermentation (n = 2). The error indicators in the figures represent the standard deviation.
Beverages 05 00067 g001
Figure 2. Curvature of extract/(%w/w), pH value/-, and alcohol content/(%v/v) during lager beer fermentation (n = 2). The error indicators in the figures represent the standard deviation.
Beverages 05 00067 g002
Figure 3. Curvature of extract/(%w/w), pH value/-, and alcohol content/(%v/v) during wheat beer fermentation (n = 2). The error indicators in the figures represent the standard deviation.
Beverages 05 00067 g003
Table 1. Overview of the raw materials utilized to produce the experimental beers.
Beer TypePale AleLager BeerWheat Beer
MaltWeyermann® Extra Pale
Premium Pilsner Malt
Weyermann®
Pilsner Malt
Weyermann® Pale
Wheat Malt
Weyermann®Weyermann®Weyermann® Dark
Wheat Malt
CARAHELL®CARAHELL®
-Weyermann® Acidulated MaltWeyermann®
Vienna Malt
--Weyermann®
Caramunich type II
HopsHallertau Magnum type 90 (HM) (α-acids: 12.2%)Hallertau Polaris (HPA)
(α-acids: 20.5%)
Hallertau Perle type 90 (HPE) (α-acids: 10.0%)
Hallertau Perle type 90 (HPE)
(α-acids: 10.0%)
Hallertau Callista (HCA)
(α-acids: 3.0%)
-
YeastFermentis Safbrew™ S-33 Fermentis\Saflager™ W34/70Fermentis Safbrew™ WB-06
Sour wortDöhler sour wort (60 °Brix)Döhler sour wort (60 °Brix)-
Table 2. Hopping rates classified by beer type. HCA = Hallertau Callista, HM = Hallertau Magnum, HPA = Hallertau Polaris, HPE = Hallertau Perle.
Hop Dosing TimePale AleLager BeerWheat Beer
When reaching 100 °C36.99 g HM58.72 g HPA-
10 min after reaching 100 °C-80.25 g HCA50 g HPE
10 min before end of boiling31.63 g HPE80.24 g HCA-
Table 3. The main parameters monitored during wort preparation of the six brews.
Sampling LocationParameterPale AleLager BeerWheat Beer
x 1 x 2 y 1 y 2 z 1 z 2
End of mashingextract/%17.918.118.518.419.421.6
pH value/-5.635.615.545.555.445.53
visual iodine testokokokokokok
Spent grainsamount/kg27.225.0825.3826.0625.7225.55
First wortvolume/L454745474537
Preboil wortvolume/L130130123124125117
extract/%11.411.011.512.012.312.0
pH value/-5.655.705.605.455.315.47
Cast wortextract/%12.011.612.212.612.312.4
pH value/-5.185.175.155.095.315.44
Cold wortextract/%12.211.712.012.411.812.2
pH value/-5.135.155.135.075.315.38
Wort preparation time/hh:mm10:0409:0011:4509:1513:5014:05
Brewhouse yield/%74.2272.0273.4276.0373.9969.66
Table 4. Results of the analyzed beer parameters. The repeatability r was calculated according to Equations (1) and (2), where N = 6, m = 3, f = 4.501. MEBAK = Methodensammlung der Mitteleuropäischen Brautechnischen Analysenkommission [7].
ParameterUnitPale Ale (n = 2)Lager Beer (n = 2)Wheat Beer (n = 2)Repeatability (95% Probability)
x ¯ 1 x ¯ 2 y ¯ 1 y ¯ 2 z ¯ 1 z ¯ 2 r DIN r t r MEBAK
Colour (n = 2)EBC10.0010.0010.0010.0027.0027.000.000.000.4
pH value (n = 2)-4.104.094.264.284.154.120.040.070.022
Viscosity (n = 3)mPas1.6331.5771.5081.6601.9261.8560.200.330.02
Coag. nitrogen (n = 2)mg/L25.4928.4341.3940.9036.2734.813.836.108
Apparent attenuation (calc.)%73.7772.6578.3379.0382.2082.791.672.660.50
Alcohol (n = 2)% vol.4.794.525.005.075.165.270.350.550.026
Bittering units (n = 2)EBC11.0011.5033.5031.0013.5013.502.954.680.71
Table 5. Results of the triangle test with 10 tasters according to DIN EN ISO 4120 [15].
Beer Type Answer
RightWrong
Pale alefresh28
aged46
Lager beerfresh37
aged28
Wheat beerfresh64
aged28

