Abstract
Microscopic and acoustic emission analysis and sound patterns recognition techniques were applied for the characterization of granular activated carbon (GAC). A new and improved methodology has been developed to characterize the exhaustion degree of GAC used in rum production: (1) based on the acoustic emission analysis of the sound produced by water flooded on GAC; and (2) based on the microscopic analysis of bubbles formed by immersion into glycerol. Acoustic measurements are made in a specific set-up, bubble detection and analysis is performed using dedicated software developed in MATLAB® for circular shape pattern detection based on the Hough transform. Both have been correlated with data of GAC characteristics based on thermogravimetric analysis (TGA) and Thermal Desorption-Gas Chromatography Mass Spectrometry (TD-GC/MS). Eight samples of GAC used in the rum production, obtained at different depths within the fixed-bed filter, have been evaluated. Good correlations are found between the immersion “bubble-metric” technique and the acoustic measurement data from the original signal processed by Band-Pass (BP) filtering at 1.3 kHz and weight loss amounts of adsorbed compounds on the GAC. The found relationship gives the possibility to determine the exhaustion degree of GAC applying these methods and to evaluate high-porosity materials.
1. Introduction
Activated carbon (AC) adsorption is the most common technique for removing various pollutants due to its extended surface area, high pore volume, well-developed porous structure and specific surface functional groups [1,2]. AC can be used in powdered or granular (0.2–5 mm) form. Granular activated carbons (GAC) are widely employed for product purification (such as sugar refining, food processing and water treatment) [2]. In spirits and liquor production, such as the rum industry, GAC are used to remove organic compounds that affect the sensorial quality of the final product [3]. Rums are a complex mixture of organic substances: 186 organic compounds have been identified [4,5]. When GAC become exhausted in the rum production they are landfilled and replaced by fresh GAC. However, the landfilled GAC create a solid waste problem. For this reason, a regeneration process should be applied and the effectiveness of regenerated GAC must be guaranteed. In order to determine the exhaustion level of GAC or the regeneration degree reached, a proper and fast analytical technique based on determination of specific surface area and porosity must be applied [6]. However, the technological facilities of rum producers are limited. Additionally, this quality parameter needs to be checked on a very regular base during the whole rum production process. At present, specialized rum taster experts determine when GAC need to be replaced based on the sensorial characteristics of the filtrated rum. Although effective, sensorial techniques cannot offer quantitative information about the real exhaustion degree of the GAC. Rum is filtered using fixed-bed filters of GAC; therefore, the exhaustion degree of GAC is different according to its location or position in the bed. A further characterization of the GAC in industrial rum filters gives the possibility to save a part of the GAC. It can be reused in the rum production process if its less exhaustion degree is quantified. A quick action is needed from the moment the taste of the produced rum is not within an accepted high-quality level. Therefore, an alternative, fast and reliable method to measure the exhaustion level of GAC is more than welcome.
This paper gives an improved approach of earlier findings [7,8], describing a new method for the characterization of activated carbons based on flooding a GAC sample with water. It results in a sound emission by bubbles escaping through the bulk water and exploding at the liquid surface. The GAC sound is produced by the bubbles escaping from the GAC cracks and pores when water molecules occupy the air-filled voids inside of the GAC by displacing the present air. The amount of produced bubbles is closely related to the porosity of the GAC [7]. The bubble volume fraction and rate at which the bubbles appear by approaching the water surface influence sound parameters as frequency and signal amplitude [7,9,10,11,12,13]. The acoustic emission (AE) produced in audible spectra can be analyzed by a proper acoustic signal analysis technique. In the case of GAC used in the rum production process, large amounts of organic compounds with different molecular sizes adsorb, and block cracks and pores of GAC, creating an important reduction of pore volume and specific surface area. Exhausted GAC therefore result in a reduction of bubbling potential and, consequently, in a reduction and a change in the sound signal amplitude. The use of acoustic measurements makes it possible to determine the overall porosity, but also to characterize the porous structure of GAC according to the sound patterns obtained. The acoustic emission of different samples of activated carbons used in the rum production process were studied by applying a non-professional set-up; it was observed that the best correlation between GAC parameters, SBET and total volume of pores with the acoustic measurements were obtained when the signal is processed at 1 kHz [7]. Bubbles and its corresponding sound patterns are, in general, widely studied, theoretically analyzed and applied in many scientific fields. The analysis of acoustic and vibrating signals to characterize mechanical events such as pump cavitation, cavity effects in gas-jet impingement propellers and stir spot welding process have proven to be accurate and sensitive techniques [9,10,11,12,13,14,15,16,17,18,19,20,21,22,23,24]. Recorded data can be correlated with GAC properties and more specific in the determination of its exhaustion degree. In this work, the set-up presented in [7] is improved in terms of signal acquisition devices, measurement chain and the applied signal processing by using MATLAB®, following a similar way to process the acoustic signal as is presented in [22,23] allowing a better characterization of the GAC acoustic emission phenomenon and its features. More accurate correlation with the GAC characteristics can now be demonstrated. Due to the complexity involved in bubble acoustic and mechanical vibration modeling, a previous knowledge about signal processing, math and physics is needed to face a deep interpretation of obtained results.
In the current study, the detection and analysis of the formed bubbles pictures are also performed. The general used process identifying possible circular objects (as bubbles) in the image applies the Hough transform [25]. An accumulator space is created made up of a cell for each pixel; initially, each of these cells will be set to 0. For each (edge point in image (i, j)) an increment of all cells which, according to the equation of a circle could be the center of a circle, is represented by “a” in the equation. For all possible values of “a” found in the previous step, all possible values of “b” can be found which satisfy the equation. The local maxima cells are searched, being any cells whose value is greater than every other adjacent cell. These cells have the highest probability of being at the location of the circle “s” [26,27,28,29,30,31]. The Hough transform can be conducted in Euclidean space where a threshold selection for the image transformation is needed. Only one channel of the image is selected with an input pixel ranging between 0 and 255 px, which is processed according to Equation (1) and using the polar coordinates (Equation (2)) for representing the circle equation under the same accumulator space concept.
In this work, an optical microscope coupled to a digital camera was applied to obtain the digital pictures of the formed bubbles produced in the immersing process of GAC into glycerol. The obtained results can be correlated with the GAC characteristics according to its exhausted degree in rum production, and also confirms the GAC acoustic emission results, as both phenomena are directly associated with each other (bubbling process and acoustic emission).
This work is an approach to enhance the use of the acoustic techniques, the optical microscopy and digital image processing by a pattern recognition technique to study porous characteristics of high-porous materials. Thermogravimetric analysis (TGA) as well as Thermal Desorption-Gas Chromatography Mass Spectrometry (TD-GC/MS) results confirmed the strength of both methods.
2. Materials and Methods
2.1. GAC Samples
Eight samples of GAC were obtained from the major rum producer in Cuba. A typical industrial rum filter previously declared as “exhausted” by a board of rum taste experts was used as the target filter to obtain the eight GAC samples at different layers (positions) in the GAC bed. Using a specific sampler (under patent registration), the GAC samples were taken from the top to the filter’s bottom according to the following order: Top (position = 0 m), 0.2, 0.4, 0.6, 0.8, 1, 1.3 m; and Bottom (position = 1.5 m) (Figure 1). In accordance with the GAC layer position, samples were labeled as GAC-Top, GAC-0.2 to GAC-1, GAC-1.3 and GAC-Bottom. The sample GAC-Top is the most exhausted GAC in the rum filter; the others have less exhaustion degree in a decreasing order. The closer to the bottom, the less its exhausted condition.
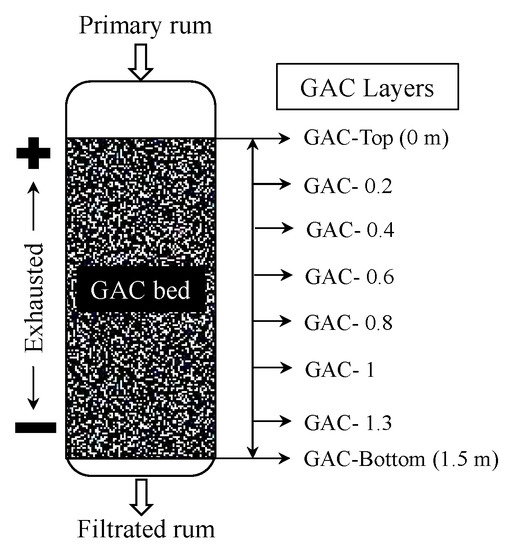
Figure 1.
Simplified scheme of the rum filter and sample location from different granular activated carbon (GAC) layers.
2.2. Characterization of the Samples
Selected GAC samples were characterized using different complementary techniques. Thermogravimetric curves were obtained using a TA Hi-Res 2950 Thermogravimetric Analyzer. About 7 mg of solid is pyrolyzed under approximately 35 mL/min N2 gas flow at a heating rate of 20 °C/min from room temperature to 800 °C.
Thermal desorption (TD)-GC/MS analyses were performed on a Trace GC Ultra gas chromatograph coupled with a DSQ-II mass spectrometer (Thermo Scientific). Samples were introduced in a Double Shot Pyrolyzer PY-2020iD (Frontier Lab) in desorption mode (100–450 °C). The GC-column was a 30 m DB-5MS 0.25 mm × 0.25 µm (Agilent Technologies) and the GC was programmed from 35 °C (1 min), ramped at 12 °C/min to 320 °C (for 10 min). The mass spectrometer was scanned 33–550 amu in 0.5 s in electron impact mode (70 eV).
2.3. Preparation of GAC Samples
The GAC samples were dried at 110 °C during 3 h. A Boxun oven (BGZ Series) was used applying ASTM Standard Test Methods for Moisture in Activated Carbon [32]. Samples were refreshed in a silica-gel desiccator during 2 h; 10 g of each GAC sample were weighed using a Sartorius analytical balance. Samples were kept in sealed envelopes and stored in the silica-gel desiccator prior to analysis.
2.4. Study of the GAC Bubbling Process
As the GAC sound is produced by bubbles escaping from the activated carbon pore and cracks [7], the GAC bubbling process was also studied applying the “immersion bubble-metric method” [33]. The bubble size measurement was performed as described in [33] using glycerol (Alfa Aesar®, reactant quality 99.9%) as immersing liquid at 25 °C. An NSZ-606 optical microscope coupled with an HDCE-50B digital camera was used to capture the microscopic images of the produced bubbles. A specific own software was created to detect and analyse the bubbles in the images. The software was developed on MATLAB® applying the Hough transform [25,26,27,28,29,30,31] as algorithm to the circular pattern recognition. After detection and recognition of the circular shapes (bubbles) in the images, the software automatically determines the independent radius and volume of each detected bubble, based on the pre-calibration transforming pixels into mm using a calibration microscopic ruler as described in [33].
All the data (radius and bubble volume) are saved in an Excel file for further processing. During the bubbles detection process, the software is equipped with several options to correct possible mistakes such as “false detection” or “not detected.” In that case, “delete” and “manual detection” options are available to eliminate possible errors using the interactive graphic software interface, e.g., before saving the data, the user can see all the changes made and rectify the initial detection by the software.
Different immersing liquids were tested: lactic acid, phosphoric acid, paraffin and glycerol because of their viscosity and transparency that allow for observing the formed bubbles at “slow motion” giving the possibility of fixing proper microscopic pictures of the bubbles for further analysis. However, only for glycerol the observed formed bubbles could be evaluated and gave reliable results.
Using glycerol as immersing liquid, the software performance took into account the following parameters:
- Efficiency for automatically detecting the real number of bubbles: 90%
- Efficiency for calculating the total volume of the bubbles (considering the detected ones): 97.5%
- Total of detected bubbles with the option of “manual detection”: 100%
2.4.1. Data Processing for Determining the Total Volume of Pores by the Immersion Bubble-Metric Method
Thirty-five (35) grains (one by one) per GAC sample were independently analysed. The size and the number of the formed bubbles were determined and its volume (in cm3) was calculated using the software described in Section 2.4. In order to express the volume of air bubbles released per gram of GAC in cm3/g as for the total volume of pores VT, a weight calibration curve was recorded. Different numbers of particles (Np) (previously prepared according to (Section 2.3) per GAC sample were weighed: i.e., 25, 50, 75, 100 and 125.
The used data are given in Table 1. The number of particles (Np) per GAC sample was plotted versus the total weight of GAC and a linear correlation was obtained.

Table 1.
Weight (in mg) for the calibration curves of the GAC particles.
The slope value is the main weight for a single GAC grain, (in g/GAC particle), being more accurate than weighing particles individually. The specific weight for a single GAC particle is similar within the analyzed GAC samples (Table 2). However a clear tendency of increasing from the GAC-Bottom to the GAC-Top can give the first evidence for differences in exhaustion degree between samples.

Table 2.
Average weight of a grain for each GAC sample.
Calculation
The calculation procedure was conducted as is reported in [33]. The total volume of air contained in a number of experimentally counted “k” bubbles (VTb (in cm3)) released per GAC sample was determined as:
being (Vi (in cm3)) the volume of each spherical single bubble (data from the software).
The immersion total volume of released bubbles per gram of GAC (VT“imm” (in cm3/g)) was determined as:
with Np = number of GAC particles (in this case (35) per GAC sample).
2.4.2. Experimental Set-Up
The Bubble Cuvette
The GAC immersion bubble-metric technique experiments were performed in the “bubble cuvette” (Figure 2) reported in [33] consisting of:
- A glass cuvette (25 × 25 × 20 mm).
- A glass cover (0.25 mm thickness) forming an angle θ with the bottom of the cuvette, which is experimentally determined and function of the physical properties (viscosity, molecular size, surface tension, …) of the medium used [33].
- An immersion liquid and GAC particle just trapped within the angle between the glass cuvette bottom and the glass cover.
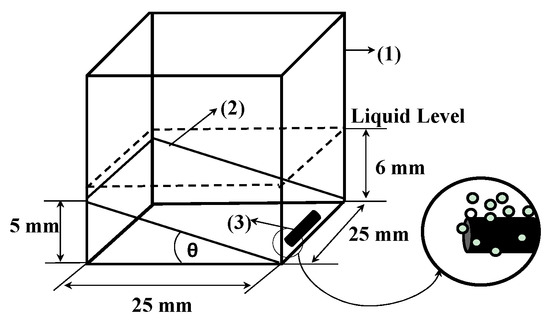
Figure 2.
Bubble cuvette characteristics [33].
3.75 mL of liquid is injected at 25 °C in the cuvette, not only covering the GAC particle (one grain (rod) each time) within 3 s, but reaching a 6 mm liquid level (Figure 2).
The aim of the glass cover with specific slope is: (1) to block the bubble’s movement giving the possibility to do size measurement; (2) to retain separated bubbles and to diminish overlapping and coalescence effects; and (3) to fix properly the GAC particle in the same position. In this way, an optimal condition is realized for correct microscopic observations of the bubble formation process [33].
Description of the Experimental Set-Up
The experimental set-up is the same as described in [7]: i.e., an optical microscope coupled with a digital camera which is connected to a computer. A microscopic model ruler is used (0.1 mm scale) for calibrating the software to calculate the bubbles volume after being detected in the microscopic image [33].
2.5. Acoustic Emission of GAC Samples
2.5.1. Experimental Set-Up
The experiments were performed using the same sound enclosure box presented in [7,8] with some modifications. In order to improve the signal recording, a G.R.A.S.® microphone, Type 46AG (Frequency Range 3.15 Hz–20 kHz Dynamic Range 17 dBA–146 dB Sensitivity 50 mV/Pa) for precision acoustic measurements was used.
The sound enclosure box described in [7] was adapted with a new microphone and a foam-sponge cover specially designed for fixing the microphone in the same position. Additionally, the sound enclosure condition for possible external interferences was reduced and possible unwanted resonant vibrations produced by the vessel during the measurement process were minimized. The working principle to obtain the acoustic signal is basically the same as described in [7]. A sample of GAC (10 g) is put into the Erlenmeyer flask and distributed uniformly on the bottom. The injection tube is introduced in the Erlenmeyer flask and the microphone is adjusted, capping the Erlenmeyer flask using the foam-sponge cover. The microphone is pointed directly towards the GAC layer to take advantage of the microphone’s directional characteristics. After closing the sound enclosure box, the valve of the separator funnel is opened and the sound registration software is initiated; 40 mL of pure bi-distilled water flow from the funnel towards the bottom of the Erlenmeyer. It takes 4 s for the water to reach the dispersed GAC. From the moment the water reaches the GAC, immediately bubbles are generated and sound is produced.
2.5.2. Signal Capture and Processing
The GAC acoustic signal acquisition was performed under different conditions from experiences reported in [7]. In this case, the GAC acoustic emission is captured by a more sensitive microphone model (G.R.A.S.® 46 AG) with the following characteristics: nominal sensitivity (12 mV/Pa), frequency response (3.15–20 kHz) and dynamic range (25–164 dB). The microphone was placed into the sound enclosure box where the immersion of GAC takes place (Figure 3). The acquired signal was amplified and digitalized using an NI USB-6211 data acquisition card. Digital data was recorded in the computer to be processed using MATLAB® software. The set-up was calibrated using a G.R.A.S.® 42AP Intelligent Pistonphone. Due to the characteristics of the proposed set-up, the recording time for the GAC sound was 90 s for all the samples.
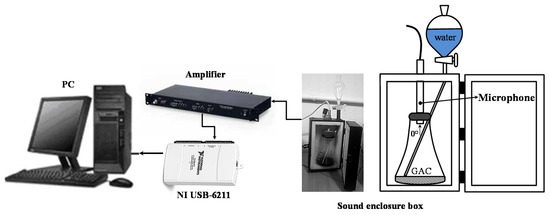
Figure 3.
Scheme of the experimental set-up.
The methodology applied for signal processing and analysis was performed following a similar methodology described in [23]. To select the useful frequency band, the behavior of the energy of the signal in time was taken into account, guaranteeing a similar pattern for all analyzed GAC.
In order to discard any external interference associated with the frequency of interest, a recording at the empty sound enclosure box was performed for generating a background signal.
Spectrogram and components of frequency at the range of 1–1.6 kHz were recorded at the empty sound enclosure box. No external interferences (noise) were found in the original signal in the selected frequency range.
Finally, the selected cut-off frequency of the Band-Pass (BP) filter was 1.3 kHz, and will be discussed later. All studied GAC showed a similar behavior of the signal in the frequency range of 1–1.6 kHz, but showed noticeable differences in the signal amplitude in this frequency range. Signal amplitude was used as an interesting parameter to compare the studied GAC samples. Once the signal component in the frequency range of interest was extracted, the next step was to conduct a characterization of the acoustical signals within the time domain, based on the envelope detection, in order to assess the feasibility of its use to estimate the exhaustion degree of GAC samples in different GAC layers of the target rum filter. In this case, the envelope detection was made using the Hilbert transform of the vibro-acoustical signals in the time domain. The Hilbert transform of the function x(t) is defined by the Equation (5) [23].
The Hilbert transform facilitates the formation of the analytical signal, which is useful for BP signal processing. An analytical signal is a complex signal consisting of the original signal x(t) as the real part, and the imaginary part as the Hilbert transform of the original signal y(t) [23], where
The Hilbert transform of the signal was found using a Finite Impulse Response filter, and it is then multiplied by “i” (the imaginary unit) and added to the original signal, obtaining a new complex signal z(t), named the analytical signal (Equation (7)) [23]
The original signal is time delayed before being added to the Hilbert transform to match the delay caused by the Hilbert transform, which is one-half the length of the Hilbert filter. The envelope of the signal can be found by taking the absolute value of the analytical signal z(t). The imaginary part is a version of the original sequence with a 90° phase shift. The Hilbert-transformed series have the same amplitude and frequency value as the original data and include phase information that depends on the phase of the original data. Once the envelope of the acoustical signal has been obtained, and in order to eliminate the rise and smooth of the envelope, the signal is passed by a low-pass filter. The main goal of this filtering is to facilitate the extraction of the signal envelope data in order to correlate them with the GAC characteristics which can define its exhaustion degree. The obtained results establish the relationship between envelopes of GAC acoustical signals generated by water flooding the GAC and its exhaustion degree produced by accumulation of adsorbed organic compounds in the GAC pores.
3. Results and Discussion
3.1. Acoustic Technique
The GAC sound is produced by the explosion of the bubbles on the water surface appearing randomly and chaotically, causing a great increase in pressure pulsation and a turbulent sound in a wide frequency range [21]. The higher the number of exploding bubbles at the water surface, the higher the amplitude and intensity of the recorded acoustic signal.
Figure 4a,b shows the relative amplitude power of the signal (RMS) of the acoustic signal of GAC-Top (a) and GAC-Bottom (b). Comparing both figures, it is possible to see evident differences between the samples located at extreme points in the rum filter. The signal power produced by GAC-Bottom is more intense than GAC-Top. Figure 4c,d presents the spectrograms of the signals of GAC-Top (a) and GAC-Bottom (b).
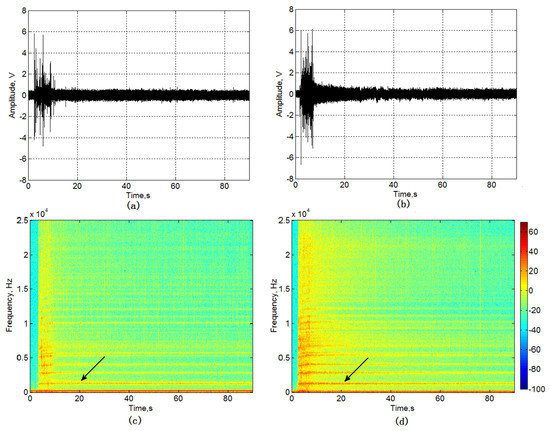
Figure 4.
RMS of the GAC acoustic signal. (a) GAC-Top and (b) GAC-Bottom and spectrograms of the GAC acoustic signal; (c) GAC-Top and (d) GAC-Bottom.
The wide range of observed frequency components was discussed in [7]. In general, the propagation of sound waves in a bubble liquid is a complex process, which involves the dynamics of the individual bubbles and their interactions. Each bubble acts as a resonator in which the gas acts as the spring and the moving mass is the liquid adjacent to the bubbles [19,24]. Therefore, resonant components during the bubbling process appear as intrinsically produced by the process itself. This feature is independent of the acoustic characteristic of the used set-up [7].
A typical frequency component around 1–1.5 kHz and its harmonics can be observed in both samples, but with different intensities (arrows in Figure 4c,d). The GAC-Bottom sound presents more intensity than GAC-Top, giving evidence of different exhaustion degrees of the GAC in the rum filter.
At the beginning of the sound recording process, the spectrograms show no external interferences (noise), which is in correspondence with the noise characterization recording at the empty enclosure box explained in Section 2.5.2.
Figure 5 shows the frequency component distribution found in the signals of GAC-Top (a) and GAC-Bottom (b). A magnification of the spectral range with the peak of interest is presented in Figure 5: (c) GAC-Top and (d) GAC-Bottom.
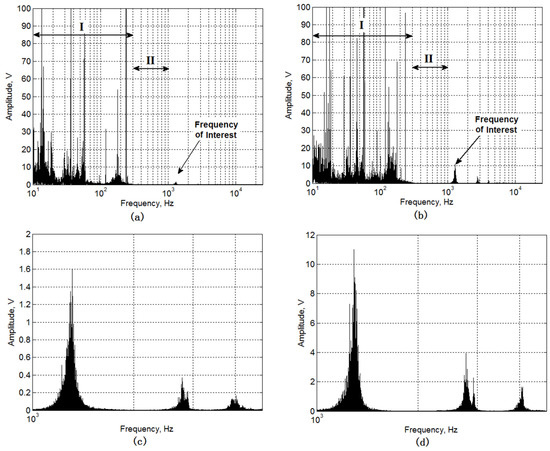
Figure 5.
Frequency component distribution of GAC acoustic signal. (a) GAC-Top and (b) GAC-Bottom and magnification of the frequency component distribution at the frequency of interest; (c) GAC-Top and (d) GAC-Bottom.
Analyzing Figure 5a,b, two zones can be clearly defined. Zone I (0–0.3 kHz) is defined by a great number of frequency components, which can be associated not only with the phenomena of GAC sound production, but also with the noise interferences produced during water injection, GAC particles colliding and unwanted resonant components. Actually, Zone I is not a good range to select any frequency component because of all these interferences. Zone II (0.3–1 kHz) is defined by a clear absence of frequency components. After Zone II, an interesting feature was found: a peak in the frequency domain around 1.3 kHz and its resonant components.
There are two important aspects to select the 1.3 kHz frequency component as the frequency of interest for characterizing the exhaustion degree in GAC used in the rum production process. The component is observed in both GAC sampled at extreme layers in the fixed-bed filter and its amplitude is clearly different in intensity. The amplitude value can be correlated with the GAC porous characteristics and is free of interferences [7].
According to the obtained results, 1.3 kHz was selected as the cut-off frequency to the BP signal filtration and being in line with previous results reported in [7].
Figure 6 displays a section of the filtrated (at 1.3 kHz) signal envelopes for the GAC-Top and GAC-Bottom. Significant differences are found between the GAC in terms of the shape of the envelope curves and the signal amplitude in the time domain. According to this, analyzing the envelope features, a characterization of the GAC can be obtained and clear differences in the GAC exhaustion degree can be observed.
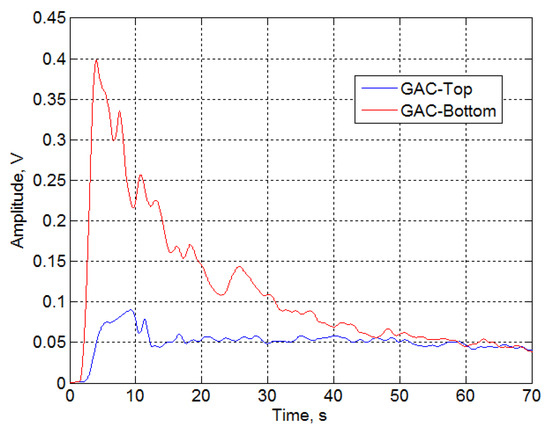
Figure 6.
Signal envelopes of GAC-Top and GAC-Bottom after being filtrated at 1.3 kHz.
The remaining GAC were analyzed following the same procedure. Figure 7 presents the signal features of the GAC samples at different layers of the rum filter. Differences between samples were found in terms of amplitude of the RMS signal, signal frequency spectrum amplitude and signal envelope at 1.3 kHz. Differences are more evident by comparing the signal amplitude and envelope. The peak amplitude and sound surface (SS) as the area under the signal envelope curve (“integral” (SS)) [7] at 1.3 kHz increases systematically from the top (more exhausted GAC) to the filter’s bottom, giving a strong correspondence between the exhausted behavior of GAC layers and the sound amplitude and SS in the frequency of interest.
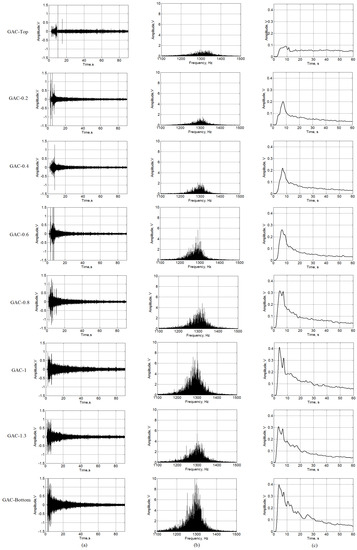
Figure 7.
Evolution of acoustic emission (AE) signal generated by GAC samples at different layers in the rum filter; (a) AE signals filtered at 1.3 kHz; (b) Amplitude spectra at 1.3 kHz; (c) Envelope of AE signals filtered at 1.3 kHz.
Table 3 shows the values of the Envelope Maximal Peak amplitude (EMP) and Sound Surface (SS) of the signal in line with the plots presented in Figure 7.

Table 3.
EMP and SS values of the signal.
The Multiple Comparison Method was applied to determine statistical differences between the mean of the samples. The applied method was the Fisher’s Lower Significant Difference (LSD). Based on statistical analysis, significant differences between EMP and SS of samples were found.
Figure 8 shows the profile of the GAC exhaustion degree at different layer positions in the rum filter based on the acoustic emission results considering as parameter the EMP (Figure 8a) and SS (Figure 8b) values at 1.3 kHz. A model fitting can be proposed with a proper correlation coefficient.
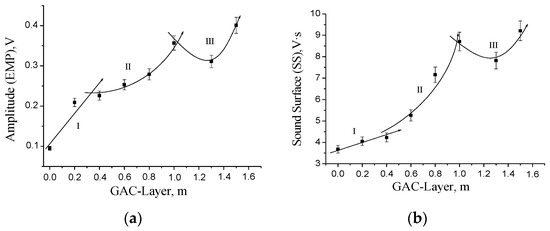
Figure 8.
Profile of the GAC exhaustion degree at different layer positions into the rum filter based on the acoustic emission using the EMP (a) and SS (b) values at 1.3 kHz as parameter.
However, based on Figure 7 and Figure 8 analyzing the behavior of the EMP and SS values at 1.3 kHz, the amplitude found for GAC-1.3 is lower than the amplitude observed in the sample GAC-1, indicating an apparent change in adsorption behavior of the GAC in that filter part.
Initially, we expect a systematic increasing trend with the increment of the GAC layer position to the bottom. However, the GAC-1.3 is actually more exhausted than GAC-1. This behavior is related to the characteristics of the rum filtration process. The primary rum is fed to the top of the filter as presented in Figure 1. The process is carried out under batch condition at atmospheric pressure and the liquid crosses the GAC bed by gravity force. However, the rum filtration is not a continuous process; a defined amount of primary rum is filtered each day according to the production plan of the factory. This filtration is regulated at constant flow velocity by the rum specialists. At the end of the batch operation process, the filter retains a certain amount of primary rum trapped into the GAC bed (bed porosity: around 40%). Slowly, the filter is drained and a certain volume of liquid is retained in the bed. As the hydraulic pressure depends on the liquid level, the draining process is faster at the beginning, but as the liquid level decreases the draining process slows down, meaning that an amount of primary rum is retained for a longer time in the GAC layers near the bottom. This effect results in a longer contact time around the GAC-1.3 in comparison with the GAC-1 layer.
Therefore, according to acoustic emission analysis, the GAC exhaustion profile in the rum filter can be divided into three zones (Figure 8): Zone I (near the Top), with a rather linear behavior; Zone II (layers above 0.4 and next to 1 m), featured by a polynomial tendency; and Zone III (above 1 m to the bottom), where a behavior of the GAC exhaustion degree is observed, characterized by an inflection point in between due to the specific characteristics of the rum-ending production process. The possibility to detect this behaviour in the GAC layers using the presented acoustic technique gives evidence of sensitivity and selectivity of the proposed method.
Figure 9 displays the surface plots of the signal envelope behavior in terms of amplitude (color scale), GAC layer depth and time.
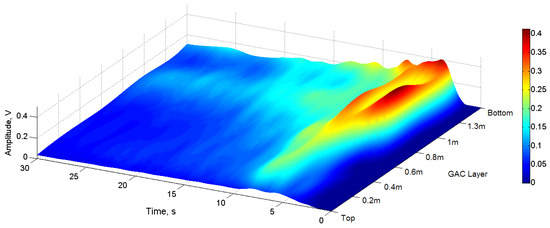
Figure 9.
Surface plots of the signal envelope behavior.
3.2. Bubble-Metric Technique
Immersion bubble-metric technique is an important tool to understand the relationship between the acoustic emission measurements and the GAC bubble process when the GAC is suddenly immersed in a pure and inert liquid. Glycerol was used as immersing liquid due to its transparency and viscosity that permits not only to obtain well-defined microscopic images, but also to understand the GAC bubble process in water since the bubble process in glycerol occurs slowly. The intensity of the bubble process and the fast rate of bubble formation make the bubble characterization impossible when water is used as immersing liquid.
Figure 10 displays digital microscopic images of the typical bubble production patterns of GAC grains from three specific layer positions in the rum filter immersed in glycerol.

Figure 10.
Digital microscopic images of bubble GAC samples immersed in glycerol from three specific layer positions in the rum filter.
Differences in the GAC bubble pattern are noticeable, giving the first evidence that the number and the total volume of produced bubbles are in correspondence with the GAC sound pattern observed in Figure 7, being higher for the bottom than for the top GAC, following a systematic trend.
Figure 11 presents the GAC bubble diameter distribution. No significant differences are found between the plots of GAC samples from GAC-0.2 to GAC-Bottom. For these GAC, the majority of formed bubbles are distributed around 0.2–0.4 mm in diameter. This is in correspondence with the observations reported in [33].
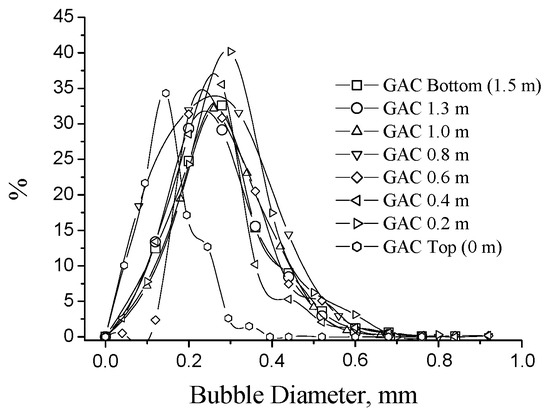
Figure 11.
Bubble diameter distribution.
However, the GAC-Top diameter distribution is located between 0.1 and 0.2 mm in diameter, it is almost half of the bubbles observed in the rest of the GAC layers, and such phenomenon can be associated with the concentration of adsorbed compounds on the GAC grain. If the concentration of these compounds is high enough, the carbonaceous primary matrix of the GAC can change by overloading. Therefore, the interaction solid-immersing liquid in the replacement process of the solid-air phase is different; consequently, a different bubble pattern appears. In this case, smaller bubbles are mainly present when the GAC is totally exhausted; this is an interesting and quick-assessment parameter to detect the “complete exhaustion degree” of a GAC in the rum process. According to this observation, the bubble process is not simple and depends not only on the immersing liquid properties, but also on the GAC surface characteristics, which must be further studied.
Table 4 shows the fitting parameters of the Gaussian model obtained for the different GAC plots. According to the regression coefficient, the Gaussian model fits quite well the found bubble diameter distribution. When comparing the parameters: and , no significant differences between GAC bubble diameter distribution into the range (GAC-0.2 to GAC-Bottom) can be found. However, and in the GAC-Top differs significantly from the rest, confirming the graphical comparison.

Table 4.
Fitting parameters of Gaussian model for GAC bubble diameter distribution.
The bubble diameter defines the frequency of the produced sound during the bubble process. The smaller the bubble, the higher the obtained frequency [7,9,10,11,12,13]. Taking into account the bubble behavior when glycerol is used as an approach to the water immersion, the results between Figure 7b and Figure 11 are comparable. If the bubble diameter distribution is almost the same, the frequency distribution must be the same as observed in Figure 7b. However, when comparing the shape of the spectra at 1.3 kHz (Figure 7b), it is noticeable that the peak of the amplitude distribution for the GAC-Top spectrum is not well defined in comparison with the other samples. Additionally, the distribution around 1.3 kHz for GAC-Top is slightly displaced to the right (higher frequencies), indicating smaller bubble contributions to the GAC sound.
Table 5 presents the results of total volume, by immersion bubble-metric technique. Each presented value was obtained by adding the total bubble volume of 35 independent particles per GAC sample analyzed individually as described in Equations (3) and (4) (Section 2.4.1).

Table 5.
Immersion total volume of the GAC.
The values of total volume of the “k” experimentally counted bubbles (VTb) are different. For GAC-Bottom the highest value of VTb was found and, correspondingly, the lowest value was observed for GAC-Top following a systematic tendency of increasing volume from the top to the filter bottom, which matches with the rum production process using fixed-bed “filters” (Figure 1).
The amount of the experimentally counted bubbles released (“k”) is quite high and characteristic for high-porosity materials. The obtained VT“imm” values are comparable with the porous characteristics of activated carbon in terms of pore volume.
Figure 12 presents the profile of the GAC exhaustion degree at different layer positions in the rum filter based on the immersion bubble-metric method.
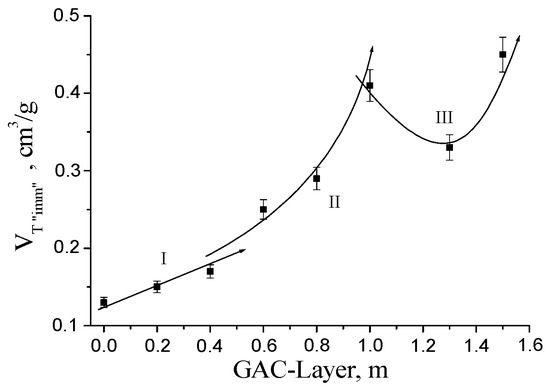
Figure 12.
Profile of the GAC exhaustion degree at different layer positions into the rum filter based on immersion bubble-metric technique.
3.3. TGA Technique
Figure 13a displays the thermogravimetric curves (TG) of weight loss (in wt %) vs. temperature for all studied samples. According to the graphs, the loss of weight for GAC-Top has the highest value (about 18%–20%); for the other samples; a systematic decreasing value is observed to reach the lowest value for the GAC layers near the bottom (about 13%–15%). The GAC-1, GAC-1.3 and GAC-Bottom are clearly clustered and separated from the other samples as their exhaustion degree is less and comparable between each other.
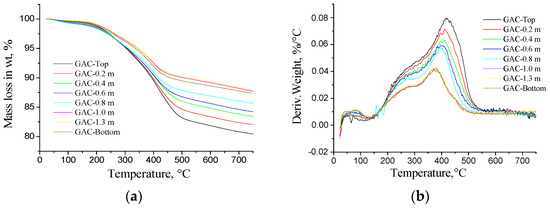
Figure 13.
(a) Thermogravimetric (TG) curves and (b) derivative weight loss curves (DTG) for GAC in N2 atmosphere.
Figure 13b displays the derivative weight loss in (wt %/°C) vs. temperature (DTG curves) for the studied samples. Comparing DTG curves, evident differences between the GAC can be noticed. Based on Figure 13b, the maximal desorption rate is located in the range of 325–500 °C for all the samples. Comparing the peak temperatures, a systematic shift towards lower temperatures can be found from GAC-Top towards GAC-Bottom. The GAC near the top presented a systematic increment in derived weight loss from GAC-0.8 up to GAC-Top. As could be expected, GAC-1, GAC-1.3 and GAC-Bottom are clustered. The differences observed in the peak temperature and weight loss can be attributed to the amount and the kind of adsorbed organic compounds on the GAC. The more the GAC is exhausted, the more time it takes for the organic compounds to be released from the GAC.
Based on these TGA results, a thermal treatment just above 500 °C for GAC-Top could result in a removal of most of the adsorbed organic compounds. Thermal desorption in absence of oxygen could point to a possible recycling strategy.
The behavior of the DTG curves in the vicinity of the maximal point is almost the same. A proper data fitting by a second-order polynomial gives satisfactory results as shown in Table 6.

Table 6.
Parameters and characteristics of the DTG curves fitted to second-order polynomial in the vicinity of the peak of maximal desorption rate.
As the derivative of weight loss can be associated with the mass of adsorbed compounds in GAC pores during the filtering process, the maximal desorption rate (Ymax) at the peak in the DTG curves can be used as a parameter to compare the exhaustion degree of the GAC used in the rum production process. As the exhaustion degree can be considered as proportional to the maximal rate of desorption expressed as derivative weight loss (wt %/°C), the non-exhausted condition of a GAC can then be assumed as proportional to 1/Ymax.
Figure 14 shows the profile of the GAC exhaustion degree at different layer positions in the rum filter based on the DTG analysis using the 1/Ymax as parameter. Similar trends between Figure 8, Figure 12 and Figure 14 are clearly noticeable. The three distinctive zones in the rum filter profile detected by the acoustic and immersion bubble-metric techniques are also observed using the TGA analysis.
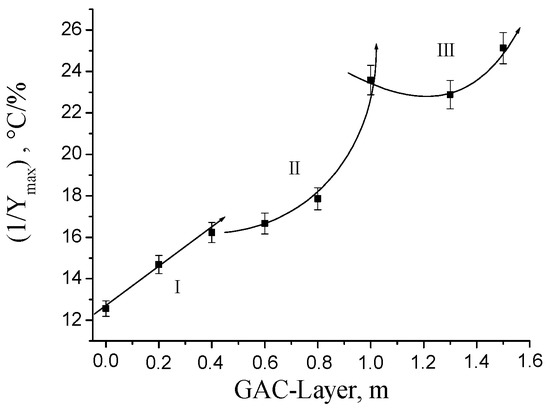
Figure 14.
Profile of the GAC exhaustion degree at different layer positions in the rum filter based on the DTG analysis using the (1/Ymax) as parameter.
3.4. TD-GC/MS Technique
Figure 15 presents the TD-GC/MS chromatograms of the different GAC samples in the rum filter, systematically ordered from the Top (superior left corner) to the bottom (inferior right corner).
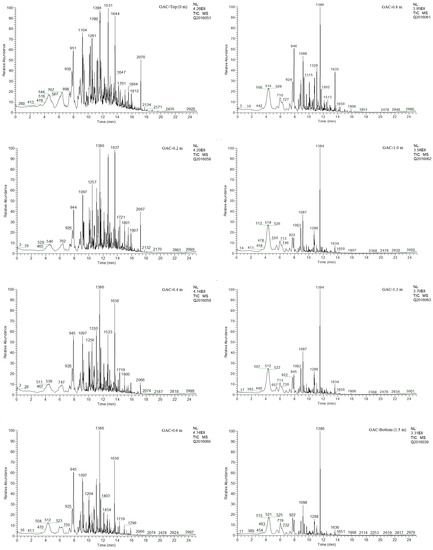
Figure 15.
TD-GC/MS chromatograms of the different GAC samples in the rum filter.
Different thermal desorption experiments were conducted at 300 °C, 450 °C and 500 °C based on the obtained TGA experiments. At 300 °C, it was found that this temperature was too low to obtain comparable chromatograms. At 500 °C, the original adsorbed compounds from the rum production process already show a thermal decomposition trend, making a proper comparison of the original adsorbed compounds in the different GAC samples not possible. It was found that at 450 °C, very reliable chromatograms were recorded for all GAC samples.
In general, for all the studied GAC samples the same predominant family of compounds were found, but with different relative abundance. Table 7 presents the predominant compounds found in all the GAC layers in the rum filter.

Table 7.
Predominant compounds detected in the rum filter GAC by TD-GC/MS analysis.
The tabulated compounds have been found in aged Cuban rums and were reported in detail by Pino et al. in [4,5]. The significant role of fatty esters, phenolic compounds and vanilloids on the improvement of the aroma and bouquet, not only in aged rums but also in other aged distilled beverages as whiskies, have been widely discussed by different authors [3,4,5,34]. In Cuban rum production, the GAC acts as a sensorial modulator of certain “key components” that define the sensorial characteristics in rums; the proper balance of these compounds is crucial to obtain the desirable sensorial typical characteristics in the final product. The rum filtration process is designed to let just pass the correct amounts of each compound in a delicate balance, where the contribution of each compound is optimal to reach the proper sensorial attributes. Therefore, the same compound can usually be found before and after filtrating with GAC, but at different concentration levels.
The GAC-Top shows higher concentration of adsorbed compounds with the highest signal intensity. The evolution of the sum of the peak areas is decreasing from the top to the bottom, reaching the lowest value for GAC-Bottom. The clustered behaviour between GAC-1, -1.3 and -Bottom is also clearly noticeable by directly comparing chromatograms in Figure 15. Also, the special exhaustion degree of GAC-1.3 can be observed, an increment in peak area distribution of dedicated compounds can be detected.
Ethyl decanoate is dominantly present in all the GAC layers and in enhanced concentration after GAC-0.8. The vanilloids are present in the top GAC layers. However, their relative fraction drops abruptly after GAC-0.4. A similar behaviour is observed for the phenolics; although present in all the GAC layers, their relative normalised peak areas decay from 60% in the GAC-Top to about 20% in GAC-1, but being rather constant at this value till the GAC-Bottom sample. In general, the family of esters is decreasing in relative abundancy from the top to the bottom. However, their decay can be associated to the molecular weight change. The heavier members of this family decay faster in relative abundance than the light esters. For instance, ethyl hexadecanoate is present in GAC-Top around 50%, but is nearly undetectable after GAC-0.4. The presented results suggest that the involved mechanisms in rum “filtration” and its relationship with the sensorial features of rum are rather unclear and must be further studied.
According to the TGA results, loss of organic compounds from the GAC at different layer positions in the rum filter reveals the following order:
GAC-Top > GAC-0.2 > GAC-0.4 > GAC-0.6 > GAC-0.8 > GAC-1.3 ≈ GAC-1 ≈ GAC-Bottom
The same order can be deduced from the proposed acoustic emission analysis and immersion bubble-metric technique.
According to the lower exhaustion degree observed in GAC-1, GAC-1.3 and GAC-Bottom, a possible reuse of these GAC layers in the rum filtration can be proposed. Around 30% of the GAC can be efficiently reapplied in a complete new rum filter, mixed with virgin GAC. In that case, the filling of a new rum filter should be started at the bottom using 70% virgin GAC and then completed with partially exhausted GAC at the top. This possibility is more cost-effective than removing all the GAC and replacing them with expensive virgin GAC. This aspect must be further evaluated and validated by rum specialists by sensorial judgment. If successful, it could be a very attractive proposal for reducing costs in the rum production process.
The above-mentioned new GAC characterization techniques offer in this particular case several advantages in comparison with well-known classical techniques such as N2 gas adsorption analysis, Brunauer–Emmett–Teller theory (BET). It is a sensitive and non-destructive method which can be performed quickly and thus is less time-consuming. It does not need special experimental conditions or special reactants. Additionally, it is found that for detecting the exhaustion degree in used GAC, the BET analysis could not be performed. Before BET analysis could be executed, the sample must be dried overnight at 300 °C in vacuum. In this case, the pre-treatment of the sample induces modifications in the studied GAC, desorption of a part of the absorbed organic compounds took place. It was even found that this required pre-treatment did not satisfy and could damage the equipment. Therefore, the measured BET results are not presented since it would not give the correct exhaustion degree of the sample as thermal desorption of adsorbed compounds occurred during the pretreatment, changing the exhaustion degree of the GAC. The proposed techniques are more reliable to determine the real exhaustion level, being an interesting tool for the control and management of GAC in the rum production process and analogue applications.
4. Conclusions
It can be stated that the acoustic measurement, based on signal processing of sound produced by GAC flooded with water, is a sensitive technique for determining the exhaustion degree of granular activated carbons used in the rum production process. It is a fast and correct predicting method for the detection of the exhaustion level of used GAC at different depths within the fixed-bed filter. An improved set-up and software to capture, process and characterize the GAC sound was proposed. It is proved that the maximal peak amplitude and the area under the curve of the GAC sound signal envelope in the time domain obtained by BP filtering at 1.3 kHz gives the most optimal and very reliable results. The immersion bubble-metric technique using glycerol as liquid medium and TGA of GAC proved to give analogue and complementary information as the acoustic technique.
The opportunity to reapply the partially exhausted GAC near the filter bottom is an attractive approach for rum producers, not only for its economic advantages, reducing about 30% of the cost to buy expensive virgin GAC, but also because of the significant reduction of the amount of landfilled exhausted GAC and the energy cost used for a possible regeneration process.
Although this study is focused on GAC used in rum production, the proposed technique shows its wider potential in the assessment of features of different adsorption systems. The simplicity and advantages of these proposed methodologies can be very interesting as a complementary analytical technique to characterize high-porosity materials.
Acknowledgments
The authors would like to thank the VLIR-UOS project between Belgium and Cuba for providing funding and granting the support of the current and future studies.
Author Contributions
H. Crespo Sariol, J. Yperman and R. Carleer conceived and designed the experiments; H. Crespo Sariol, T. Mariño Peacok, Á. Sánchez Roca and J. Czech performed the experiments; H. Crespo Sariol, J. Yperman, Á. Sánchez Roca, R. Carleer and H. Carvajal Fals analyzed the data; J. Navarro Campa advised the research as rum specialist; J. R. Ledea Vargas and H. Crespo Sariol conceived the idea about the software of bubbles recognition; J. R. Ledea Vargas programmed and created the software; and H. Crespo Sariol, J. Yperman, Á. Brito Sauvanell and R. Carleer wrote the paper.
Conflicts of Interest
The authors declare no conflict of interest.
References
- Hsieh, C.T.; Teng, H.S. Influence of mesopore volume and adsorbate size on adsorption capacities of activated carbons in aqueous solutions. Carbon 2000, 38, 863–869. [Google Scholar] [CrossRef]
- Ying, W.C. Proceedings of the 44th Purdue Industrial Waste Conference; Lewis Publishers: Chelsea, MI, USA, 1989; p. 313. [Google Scholar]
- Hernández, O.Q. Science and technologies of distillates beverages. Res. Inst. Food Ind. Cuba 2007, 11, 19. [Google Scholar]
- Pino, J.A. Characterization of rum using solid-phase micro extraction with gas chromatography–mass spectrometry. Food Chem. 2007, 104, 421–428. [Google Scholar] [CrossRef]
- Pino, J.A.; Tolle, S.; Gök, R.; Winterhalter, P. Characterisation of odour-active compounds in aged rum. Food Chem. 2012, 132, 1436–1441. [Google Scholar] [CrossRef]
- Gregg, S.J.; Sing, K.S.W. Adsorption, Surface Area and Porosity; Academic Press: London, UK, 1997. [Google Scholar]
- Sariol, H.C.; Yperman, J.; Sauvanell, A.B.; Carleer, R.; Campa, J.N.; Gryglewicz, G. A novel acoustic approach for the characterization of granular activated carbons used in the rum production. Ultrasonic 2016, 70, 53–63. [Google Scholar] [CrossRef] [PubMed]
- Sariol, H.C. Procedimento Para Obtener el Espectro Sonoro de Carbones Activados Granulares; Official Bulletin No. 325, Patent International Classification: G01N 29/46, CU ISSN 1028-1452; Cuban Office of Industrial Property (OCPI): Havana, Cuba, 2015; p. 132. [Google Scholar]
- Fedorchenko, A.I.; Chernov, A.A. Exact solution of the problem of gas segregation in the process of crystallization. Int. J. Heat Mass Transf. 2003, 46, 915–919. [Google Scholar] [CrossRef]
- Terrill, E.J.; Melville, K.W. A broadband acoustic technique for measuring bubble size distributions: Laboratory and shallow water measurements. J. Atmos. Ocean. Technol. 2000, 17, 220–239. [Google Scholar] [CrossRef]
- Gilbert, J.B.; Howea, M.S.; Koch, R.M. On sound generated by gas-jet impingement on a bubbly gas–water interface, with application to supercavity self-noise. J. Sound Vib. 2012, 331, 4438–4447. [Google Scholar] [CrossRef]
- Commander, K.W.; Prosperetti, A. Linear pressure waves in bubbly liquids: Comparison between theory and experiments. J. Acoust. Soc. Am. 1989, 85, 732–746. [Google Scholar] [CrossRef]
- Havlickova, M.M.; Prague. The Cocoa Sound Effect—Audible Rising of the Tone Pitch. Private communication, 1997. [Google Scholar]
- Tabacchi, M.; Asensio, C.; Pavón, I.; Recuero, M.; Mir, J.; Artal, M.C. A statistical pattern recognition approach for the classification of cooking stages. The boiling water. Appl. Acoust. 2013, 74, 1022–1032. [Google Scholar] [CrossRef]
- Manasseh, R.; Yoshida, S.; Rudman, M. Bubble formation processes and bubble acoustic signals. In Proceedings of the Third International Conference on Multiphase Flow, Lyon, France, 8–12 June 1998.
- Nikolovska, A.; Manasseh, R.; Ooi, A. Visualizing the acoustic field around bubbles using a hydrophone—Scanning method. In Proceedings of the Seventh Asian Symposium on Visualization, Singapore, 3–7 November 2003.
- Vazquez, A.; Sanchez, R.M.; Salinas-Rodrıíguez, E.; Soria, A.; Manasseh, R. A glance at three measurement techniques for bubble size determination. Exp. Therm. Fluid Sci. 2005, 30, 49–57. [Google Scholar] [CrossRef]
- Doney, G.D. Acoustic Boiling Detection; Department of Nuclear Engineering, Massachusetts Institute of Technology: Cambridge, MA, USA, 1994. [Google Scholar]
- Batchelor, G.K. Compression waves in a suspension of gas bubbles in liquid. Fluid Dyn. Trans. 1969, 4, 425–445. [Google Scholar]
- Foley, A.W.; Howe, M.S.; Brungart, T.A. Spectrum of the sound produced by a jet-impinging on the gas–water interface of a supercavity. J. Sound Vib. 2010, 329, 415–424. [Google Scholar] [CrossRef]
- Cudina, M.; Prezelj, J. Detection of cavitation in operation of kinetic pumps. Use of discrete frequency tone in audible spectra. Appl. Acoust. 2009, 70, 540–546. [Google Scholar] [CrossRef]
- Fernández, J.B.; Roca, A.S.; Fals, H.C.; Macías, E.J.; de la Parte, M.P. Application of vibroacoustic signals to evaluate tools profile changes in friction stir welding on AA 1050 H24 alloy. Sci. Technol. Weld. Join. 2012, 17, 501–510. [Google Scholar]
- Macías, E.J.; Roca, A.S.; Fals, H.C.; Muro, J.C.S.; Fernández, J.B. Characterisation of friction stir spot welding process based on envelope analysis of vibro-acoustical signals. Sci. Technol. Weld. Join. 2015, 20, 172–180. [Google Scholar] [CrossRef]
- Travnıcek, Z.; Fedorchenko, A.I.; Pavelka, M.; Hruby, J. Visualization of the hot chocolate sound effect by spectrograms. J. Sound Vib. 2012, 331, 5387–5392. [Google Scholar] [CrossRef]
- Hough, P.V.C. Method and Means for Recognizing Complex Patterns. U.S. Patent 3,069,654, 18 December 1962. [Google Scholar]
- Duda, R.O.; Hart, P.E. Use of the Hough Transformation to Detect Lines and Curves in Pictures. Commun. ACM 1972, 15, 11–15. [Google Scholar] [CrossRef]
- Ballard, D.H. Generalizing the Hough transform to detect arbitrary shapes. Pattern Recognit. 1981, 13, 111–122. [Google Scholar] [CrossRef]
- Fernandez, L.; Oliveira, M. Real-time line detection through an improved Hough transform voting scheme. Pattern Recognit. 2008, 41, 299–314. [Google Scholar] [CrossRef]
- Limberger, F.; Oliveira, M. Real-Time Detection of Planar Regions in Unorganized Point Clouds. Pattern Recognit. 2015, 48, 2043–2053. [Google Scholar] [CrossRef]
- Fernandes, L.; Oliveira, M. A general framework for subspace detection in unordered multidimensional data. Pattern Recognit. 2012, 45, 3566–3579. [Google Scholar] [CrossRef]
- Tahir, R.; van den Heuvel, F. Efficient Hough transform for automatic detection of cylinders in point clouds. In Proceedings of the 11th Annual Conference of the Advanced School for Computing and Imaging, Heijen, The Netherlands, 8–10 June 2005.
- American Standard Test Methods (ASTM). Standard Test Methods for Moisture in Activated Carbon; D 2867-04, R-2011; ASTM: West Conshohocken, PA, USA, 2011. [Google Scholar]
- Sariol, H.C.; Peacok, M.T.; Yperman, J.; Brito, S.Á.; Carleer, R.; Campa, N.J. Characterization of granular activated carbons used in the rum production by immersion “bubble-metric technique” in a pure liquid. J. Food Process. Beverages 2016, 4, 1–10. [Google Scholar]
- Maarse, H. Volatile Compounds in Foods and Beverages; TNO-CIVO Food Analysis Institute: Zeist, The Netherlands, 2009. [Google Scholar]
© 2017 by the authors; licensee MDPI, Basel, Switzerland. This article is an open access article distributed under the terms and conditions of the Creative Commons Attribution (CC BY) license (http://creativecommons.org/licenses/by/4.0/).