Article

Influence of Sample Storage on the Composition of Carbonated Beverages by MIR Spectroscopy

1
School of Pharmacy and Medical Sciences, University of South Australia, GPO Box 2471, Adelaide, SA 5001, Australia
2
School of Agriculture, Food and Wine, The University of Adelaide, Waite Campus, PMB 1, Glen Osmond, SA 5064, Australia
3
School of Medical and Applied Sciences, Central Queensland University, Rockhampton, QLD 4701, Australia
*
Author to whom correspondence should be addressed.
These authors contributed equally to this work.
Beverages 2016, 2(4), 26; https://doi.org/10.3390/beverages2040026
Submission received: 3 August 2016 / Accepted: 28 September 2016 / Published: 5 October 2016

Abstract

:
It is not uncommon for research and quality control samples, including carbonated beverage samples, to be refrigerated or frozen during peak periods of production and/or sampling, when analytical demand exceeds instrumental capacity. However, the effect of sub-ambient temperatures on carbonated beverage composition during storage has not been well characterized. Mid-infrared (MIR) spectroscopy combined with principal component analysis (PCA) and traditional chemical analyses were used to evaluate the effects of refrigeration (for 1 week) and freezing (for 1 or 6 weeks) on the composition of carbonated beverages, including sparkling water, sparkling wine, beer, and cider. Carbonated beverages were generally resistant to changes in pH, titratable acidity, alcohol, total phenolics, sugar, and color, during short-term (1 week) storage. However, long-term (6 week) freezing resulted in decreased total phenolics, with acidity also affected, albeit to a lesser extent. MIR spectroscopy combined with PCA enabled discrimination of carbonated beverages based on composition, with alcohol content having a significant influence. Examination of the MIR ‘fingerprint’ region indicated subtle compositional changes occurred in carbonated beverages following prolonged freezing.

1. Introduction

Quality control teams routinely perform a range of compositional analyses on carbonated beverages post-production, e.g., to ensure that products meet quality and/or legal specifications. However, during peak periods or when analytical equipment is offline, samples cannot always be analyzed immediately. In these cases, the storage of samples (often at sub-optimal temperatures) prior to analysis is unavoidable, yet very little information exists on how the chemical composition of carbonated beverages is affected by storage, particularly storage at sub-ambient temperatures. In an ideal world, carbonated beverages are analyzed either in situ during processing, or for routine quality control as soon as they become available, to provide a ‘real time’ snapshot of composition. However, the refrigeration or freezing of samples is often required prior to analysis, to accommodate peak analytical demand, instrument downtime, highly labile samples, or out-sourcing of analysis [1]. In these circumstances, the physical and chemical integrity of the samples must be maintained [1]; yet little is known about the influence of sub-ambient storage on beverage composition.
Several studies have considered the quality of beer [2], wine [3,4], and soft drinks [5] stored at ambient or slightly elevated temperatures, in the context of shelf life. Additionally, the effects of refrigeration on wine [3] and beer [6] composition have previously been examined, by gas chromatography-mass spectroscopy (GC-MS) or ultra-performance liquid chromatography-mass spectrometry (UPLC–MS); albeit these methods are expensive, time consuming, and typically require trained staff to interpret the data. However, there is a lack of information concerning the effect of freezing on carbonated beverage composition, particularly using cost effective methods of analysis.
Infrared (IR) spectroscopy is a rapid analytical technique that exploits the absorbance of light by different molecules, depending on their structural characteristics [7], which can then be used to identify components within a given matrix. Spectroscopic techniques in the mid-infrared (MIR) region have enabled characterization of many beverage constituents, including acids (malic, tartaric, and acetic acids), sugars, and alcohol [8]; with the minimal sample preparation requirements facilitating high sample throughput [9], compared to conventional GC-MS or UPLC-MS [6].
Wine, beer, and cider are highly complex substrates, comprising an array of constituents at different concentrations, many at trace levels. A number of studies have been undertaken to investigate the applications of MIR spectroscopy as non-destructive, cost-effective methods of beverage analysis. In wine, MIR analysis has been used for authentication [10] and varietal identification [11], as well as for determinations of alcohol, volatile acidity, titratable acidity, pH, sulphur dioxide, sugars, esters, and/or phenolic compounds, in red and white wines [12]. MIR spectroscopy has also been employed for the routine analysis of beer, albeit, while alcohol and lactic acid concentrations were accurately predicted with the aid of PLS regression models, other parameters, such as pH, bitterness, and EBC color, were only semi-quantitatively predicted [13]. Attenuated total reflectance Fourier-Transform mid-infrared (FTMIR-ATR) spectroscopy has also been used to quantify the adulteration of apple-based beverages [14,15], while Reid and coworkers differentiated apple juices on the basis of variety and heat treatment, with classification rates ≥77% [16]. In a subsequent study, the discrimination of apple variety was not possible until MIR and electronic tongue data were merged during data processing [17].
Ethanol and water are the most abundant constituents of sparkling wine, beer, and cider, and are known to dominate the IR spectra, masking signals from other molecules that absorb radiation at similar frequencies [18]. This was traditionally overcome by employing dry state analyses [19], but the analysis of ‘wet’ samples expedites processing and therefore commercial viability, especially when high sample throughput is required. Compositional applications of MIR spectroscopy are still relatively new, and generally require calibration and/or comparison against models based on traditional methods [11]. Statistical methods, such as principal component analysis (PCA), are often applied to enhance the validity of results; PCA converts correlated data (e.g., spectral measures) into linearly uncorrelated variables that describe or predict relationships amongst data [20].
Collectively, these examples demonstrate useful applications of MIR spectroscopy as a rapid method for the compositional analysis of beverages; albeit, to date, its application to carbonated beverages has been limited. The aim of this study was two-fold: (i) to evaluate the extent to which refrigeration and freezing affects sample integrity; and (ii) to determine the suitability of MIR spectroscopy as a rapid method for monitoring compositional changes during storage.

2. Materials and Methods

2.1. Carbonated Beverage Storage Trial

A range of carbonated beverages, comprising sparkling water (n = 1), sparkling wine (n = 1), cider (n = 4, hereafter cider A, B, C, and D) and beer (n = 4, hereafter beer A, B, C, and D), were sourced either commercially (for sparkling water) or directly from producers (for sparkling wine, cider, and beer). Samples (approximately 50 mL, 10 replicates per treatment per beverage) were then: refrigerated short-term, i.e., at 4 °C for 1 week; frozen short-term, i.e., at −15 °C for 1 week; or frozen long-term, i.e., at −15 °C for 6 weeks. Storage times were chosen to reflect both common laboratory practices, and durations of storage reported in a review concerning compositional changes in grapes samples after freezing [21]. Prior to chemical analysis, samples were thawed (where applicable) and degassed via sonication in an ultrasonic bath (Sonorex Digitec DT 1028F, Bandelin Electronic GmbH & Co. KG, Berlin, Germany) as previously described [22]. ‘Fresh’ samples, i.e., samples taken immediately after each carbonated beverage was opened (approximately 50 mL, 10 replicates per beverage), were also degassed prior to chemical analysis.

2.2. Basic Compositional Analyses

The pH and titratable acidity (TA, as tartaric acid equivalents for sparkling water and sparkling wine, and malic acid equivalents for beer and cider, to end points of pH 8.2) of the degassed samples were measured with an autotitrator (Compact Titrator, Crison Instruments SA, Allela, Spain) according to methods described previously [23]. Sugar levels (i.e., glucose and fructose) were determined enzymatically (Boehringer-Mannheim/R-BioPharm, Darmstadt, Germany) using a liquid handling robot (CAS-3800, Corbett Robotics, Eight Mile Plain, QLD, Australia) and a spectrophotometric plate reader (Infinite M200 Pro, Tecan, Grödig, Austria).
Alcohol content (% alcohol by volume, abv) was measured with an alcolyzer (Anton Paar GmbH, Graz, Austria). Total phenolics were measured as the absorbance of carbonated beverages at 280 nm, using a GBC Cintra 40 UV-Visible spectrophotometer (GBC Scientific Equipment, Melbourne, Australia) [23]. Color was also determined with a UV-Visible spectrophotometer; as the absorbance at 420 nm for sparkling wine [23] and the absorbance at 430 nm for beer and cider, using the European Brewing Convention’s spectrophotometric method [24].

2.3. Attenuated Total Reflectance Mid-Infrared Spectroscopy (ATR-MIR)

Carbonated beverage samples (fresh and degassed, ca. 0.5 mL) were scanned using a platinum diamond ATR single reflection sampling module cell mounted in a Bruker Alpha instrument (Bruker Optics GmbH, Ettlingen, Germany). The MIR spectra of samples were recorded with OPUS software (Version 7, Bruker Optics) by taking the average of 32 scans at a resolution of 8 cm−1, acquired between 4000 and 400 cm−1, with a scanner velocity of 7.5 KHz and a background of 32 scans. Background reference spectra were recorded using air, after every 4 samples. MIR spectra were then exported from OPUS into The Unscrambler (Edition 10.2, CAMO ASA, Oslo, Norway) for chemometric analysis. Spectra were pre-processed using the second-derivative transformation, the Savitzky-Golay derivation, and smoothing (20-point and 2nd-order filtering operation), to reduce baseline variation and to enhance spectral features. PCA was performed on both the entire spectral range (4000 to 400 cm−1) and the MIR ‘fingerprint’ region (1500 to 900 cm−1).

2.4. Statistical Analysis

Compositional data were analyzed using IBM SPSS Statistics 21 (IBM Corp., Armonk, NY, USA, 2011, Version 21.0) and Analysis of Variance (ANOVA) using GenStat (15th Edition, VSN International Limited, Herts, UK). Mean comparisons were performed by least significant difference (LSD) multiple comparison tests at a 5% level of significance (p < 0.05). Post hoc analysis was performed using the Tukey’s test.

3. Results and Discussion

Basic compositional analyses, i.e., determinations of pH, TA, sugar, alcohol content, total phenolics, and color, together with MIR spectroscopy measurements, were performed on carbonated beverages prior to storage (i.e., when freshly opened) and after short-term (1 week) refrigeration or freezing or long-term (6 week) freezing, in order to investigate any influence of storage conditions on beverage composition.

3.1. Influence of Storage Conditions on the Composition of Carbonated Beverages

Table 1 represents the mean and range of basic chemical parameters measured for each carbonated beverage, across all storage conditions (i.e., fresh, refrigerated for 1 week, and frozen for 1 or 6 weeks). Narrow ranges therefore indicate little variation amongst sample replicates stored under different conditions. Compositional differences were observed between the different types of carbonated beverages studied (Table 1), as expected. Sparkling water had almost neutral pH (6.1) and very low TA (0.5 g/L), whereas the mean pH for the sparkling wine, beer, and cider samples was 3.1, 4.1, and 3.1–3.6, respectively. TA ranged from 6.0 to 7.3 g/L for the sparkling wine, 5.4 to 6.8 g/L for the ciders, and 1.2 to 2.0 g/L for the beers. The alcohol content of sparkling wine was higher (averaging 11.7% abv) compared to that for beer (averaging 2.4% to 4.5% abv) and cider (averaging 2.4% to 5.0% abv). The ciders contained the highest sugar levels (averaging 11.0–21.7 g/L), while the sparkling wine contained moderate sugar levels (averaging 12.7 g/L,) and the beers were dry (≤0.2 g/L). Differences in total phenolics and color were also observed between the sparkling wine, beers, and ciders, as well as amongst the different beers and ciders (Table 1).
Storage did not significantly affect the pH or TA of sparkling water, nor the pH, alcohol, sugar, or color of the other carbonated beverages (Table 1), but some statistically significant differences were observed in TA and phenolics following the refrigeration and/or freezing of beer and cider (Supplementary Table S1). TA, expressed as either tartaric (wine and water) or malic acid (beer and cider; g/L), was generally not affected by short-term storage conditions, but long-term freezing resulted in both increased and decreased TA measurements, relative to control samples (i.e., freshly opened). Decreased TA might be explained by the precipitation of organic acids (and salts thereof) during freezing, but the increased TA observed for beer A and cider A could not be explained. The phenolic composition of sparkling wine was not affected by refrigeration or freezing, but decreases of up to 10% were observed for beer and cider samples following long-term freezing, and by approximately 40% in the case of beer D. Refrigeration and freezing were not expected to influence alcohol or sugar content, nor color, given that previous research has demonstrated the color stability of juice samples during storage [25].

3.2. Influence of Storage Conditions on the MIR Spectra of Carbonated Beverages

MIR spectra were collected for all carbonated beverages (sparkling water, sparkling wine, beers, and ciders) and the average spectra for each beverage type when freshly opened (and degassed) are shown in Figure 1. Strong absorbance peaks were observed at 3300 cm−1, while moderate absorbance peaks were found at 1045, 1085, and 1640 cm−1. Peaks at 1640 and 3300 cm−1 corresponded to the O–H stretching and bending (respectively) of water molecules [10,26]; whereas peaks at 1045 and 1080 cm−1 were likely attributable to C–OH bonds present in ethanol, glycerol, glucose, and fructose [10,26], i.e., common constituents of sparkling wine, beer, and cider, that occur at different concentrations.
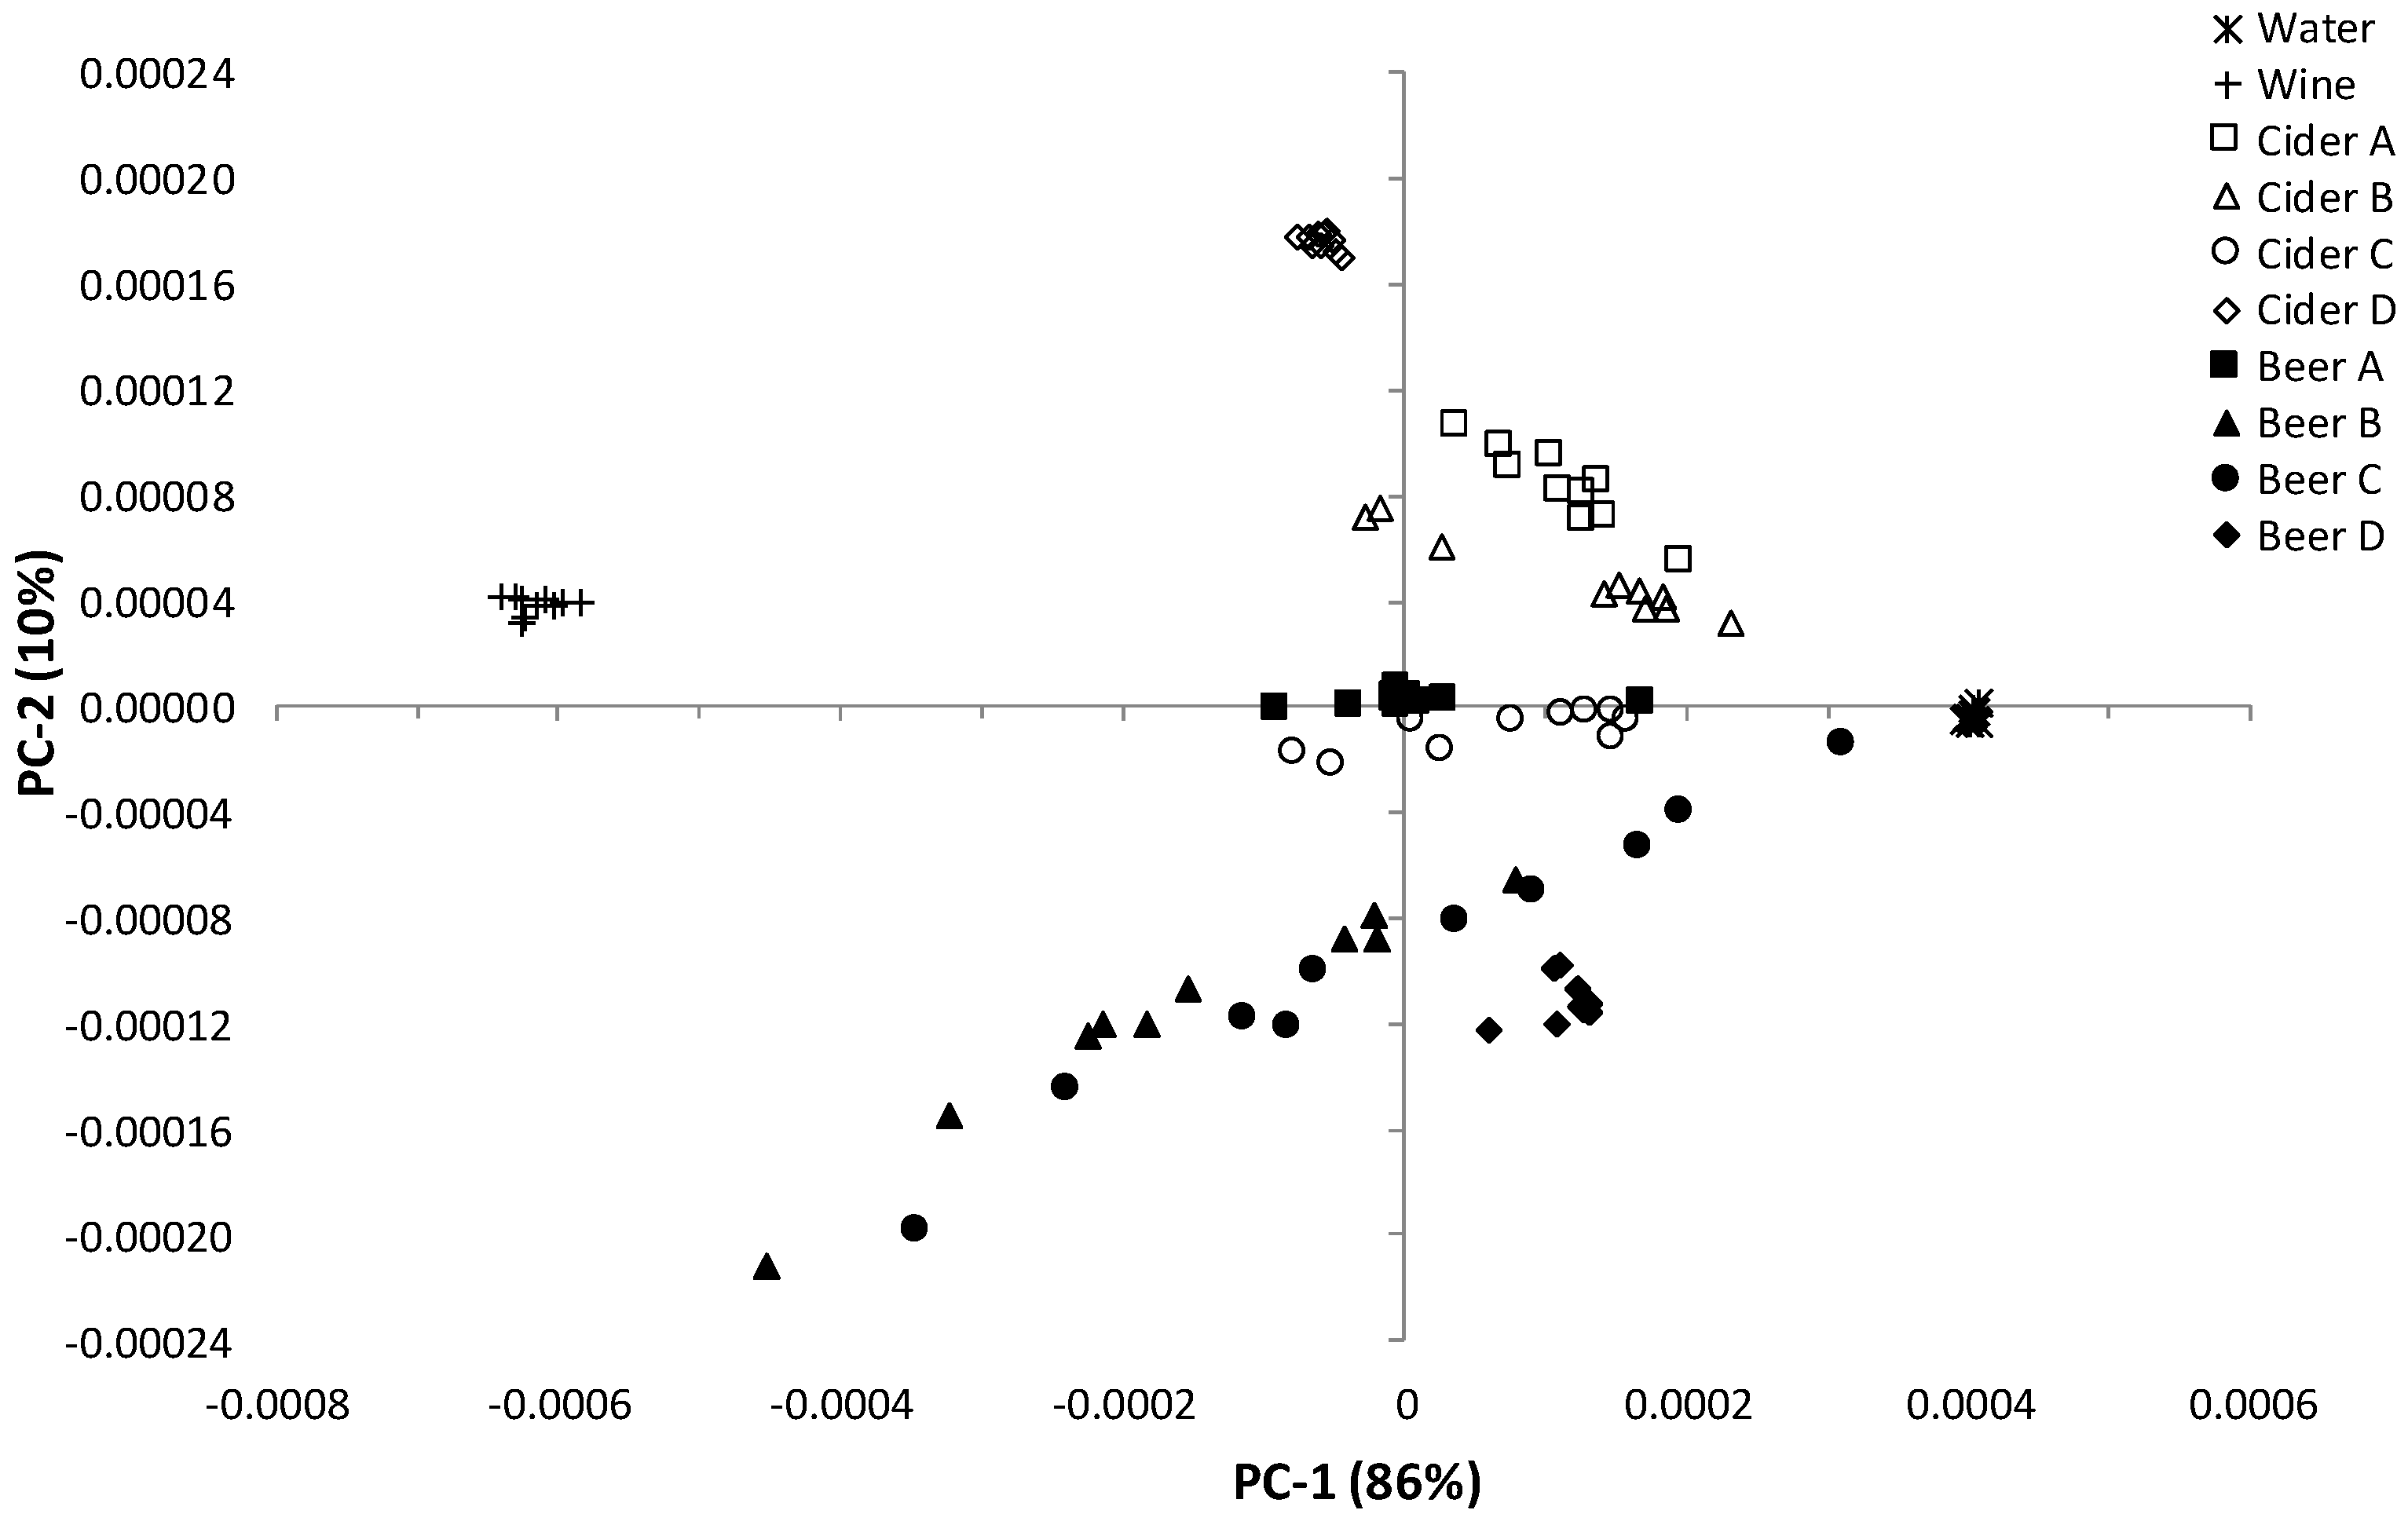
Most of the variation observed between MIR spectra of the different carbonated beverages occurred within the MIR fingerprint region, i.e., between 1500 and 900 cm−1 (Figure 1). Multivariate analysis was therefore performed on spectral data from this region and the PCA score plot of the first two principal components (PCs) derived from MIR spectral data is shown in Figure 2; with PC-1 and PC-2 explaining 85% and 10% of the observed variation, respectively. Distinct clustering of the different types of carbonated beverages was observed; with sparkling water samples located near the x-axis on the right side of the score plot, and sparkling wines located in the upper left quadrant. The four beers clustered within the upper right quadrant, while three ciders (ciders A, B, and D, all derived from apple) were located near the y-axis in the lower left quadrant. The remaining pear-based cider (cider C) was somewhat of an anomaly, with samples clustering in the upper right quadrant; i.e., in closer proximity to the beers, rather than the apple-based ciders.
An earlier study involving MIR spectroscopy of sparkling wines found that alcohol content and sugar strongly influenced separation of sparkling white wines following PCA of MIR spectral data [22]. In the current study, significant differences were observed in the alcohol and sugar content of the different types of carbonated beverages (Table 1). The clustering observed in Figure 2 is similarly driven by alcohol content; with alcohol levels highest in samples positioned on the right (i.e., sparkling water), and decreasing towards the center (i.e., beers and ciders), and the left (i.e., sparkling wine). Therefore, the differences in alcohol content between the beverages appear to be the biggest driving factor for separation across PC-1. Separation of the different beers and ciders (i.e., across PC-2) may be linked to compositional differences in acidity, phenolics, and color. In the case of beers, separation could also be attributable to compositional differences arising from barley variety and production styles; e.g., beers A and D were made from the same barley variety, but via different production methods. Separation of the pear vs. apple-based ciders (i.e., cider C vs. ciders A, B, and D) was not surprising, and likely reflects compositional differences between the pear and apple substrates used in cider production. Interestingly, ciders A and D were made from the same juice, but as different styles, further demonstrating the capacity for MIR to differentiate samples according to methods of production.
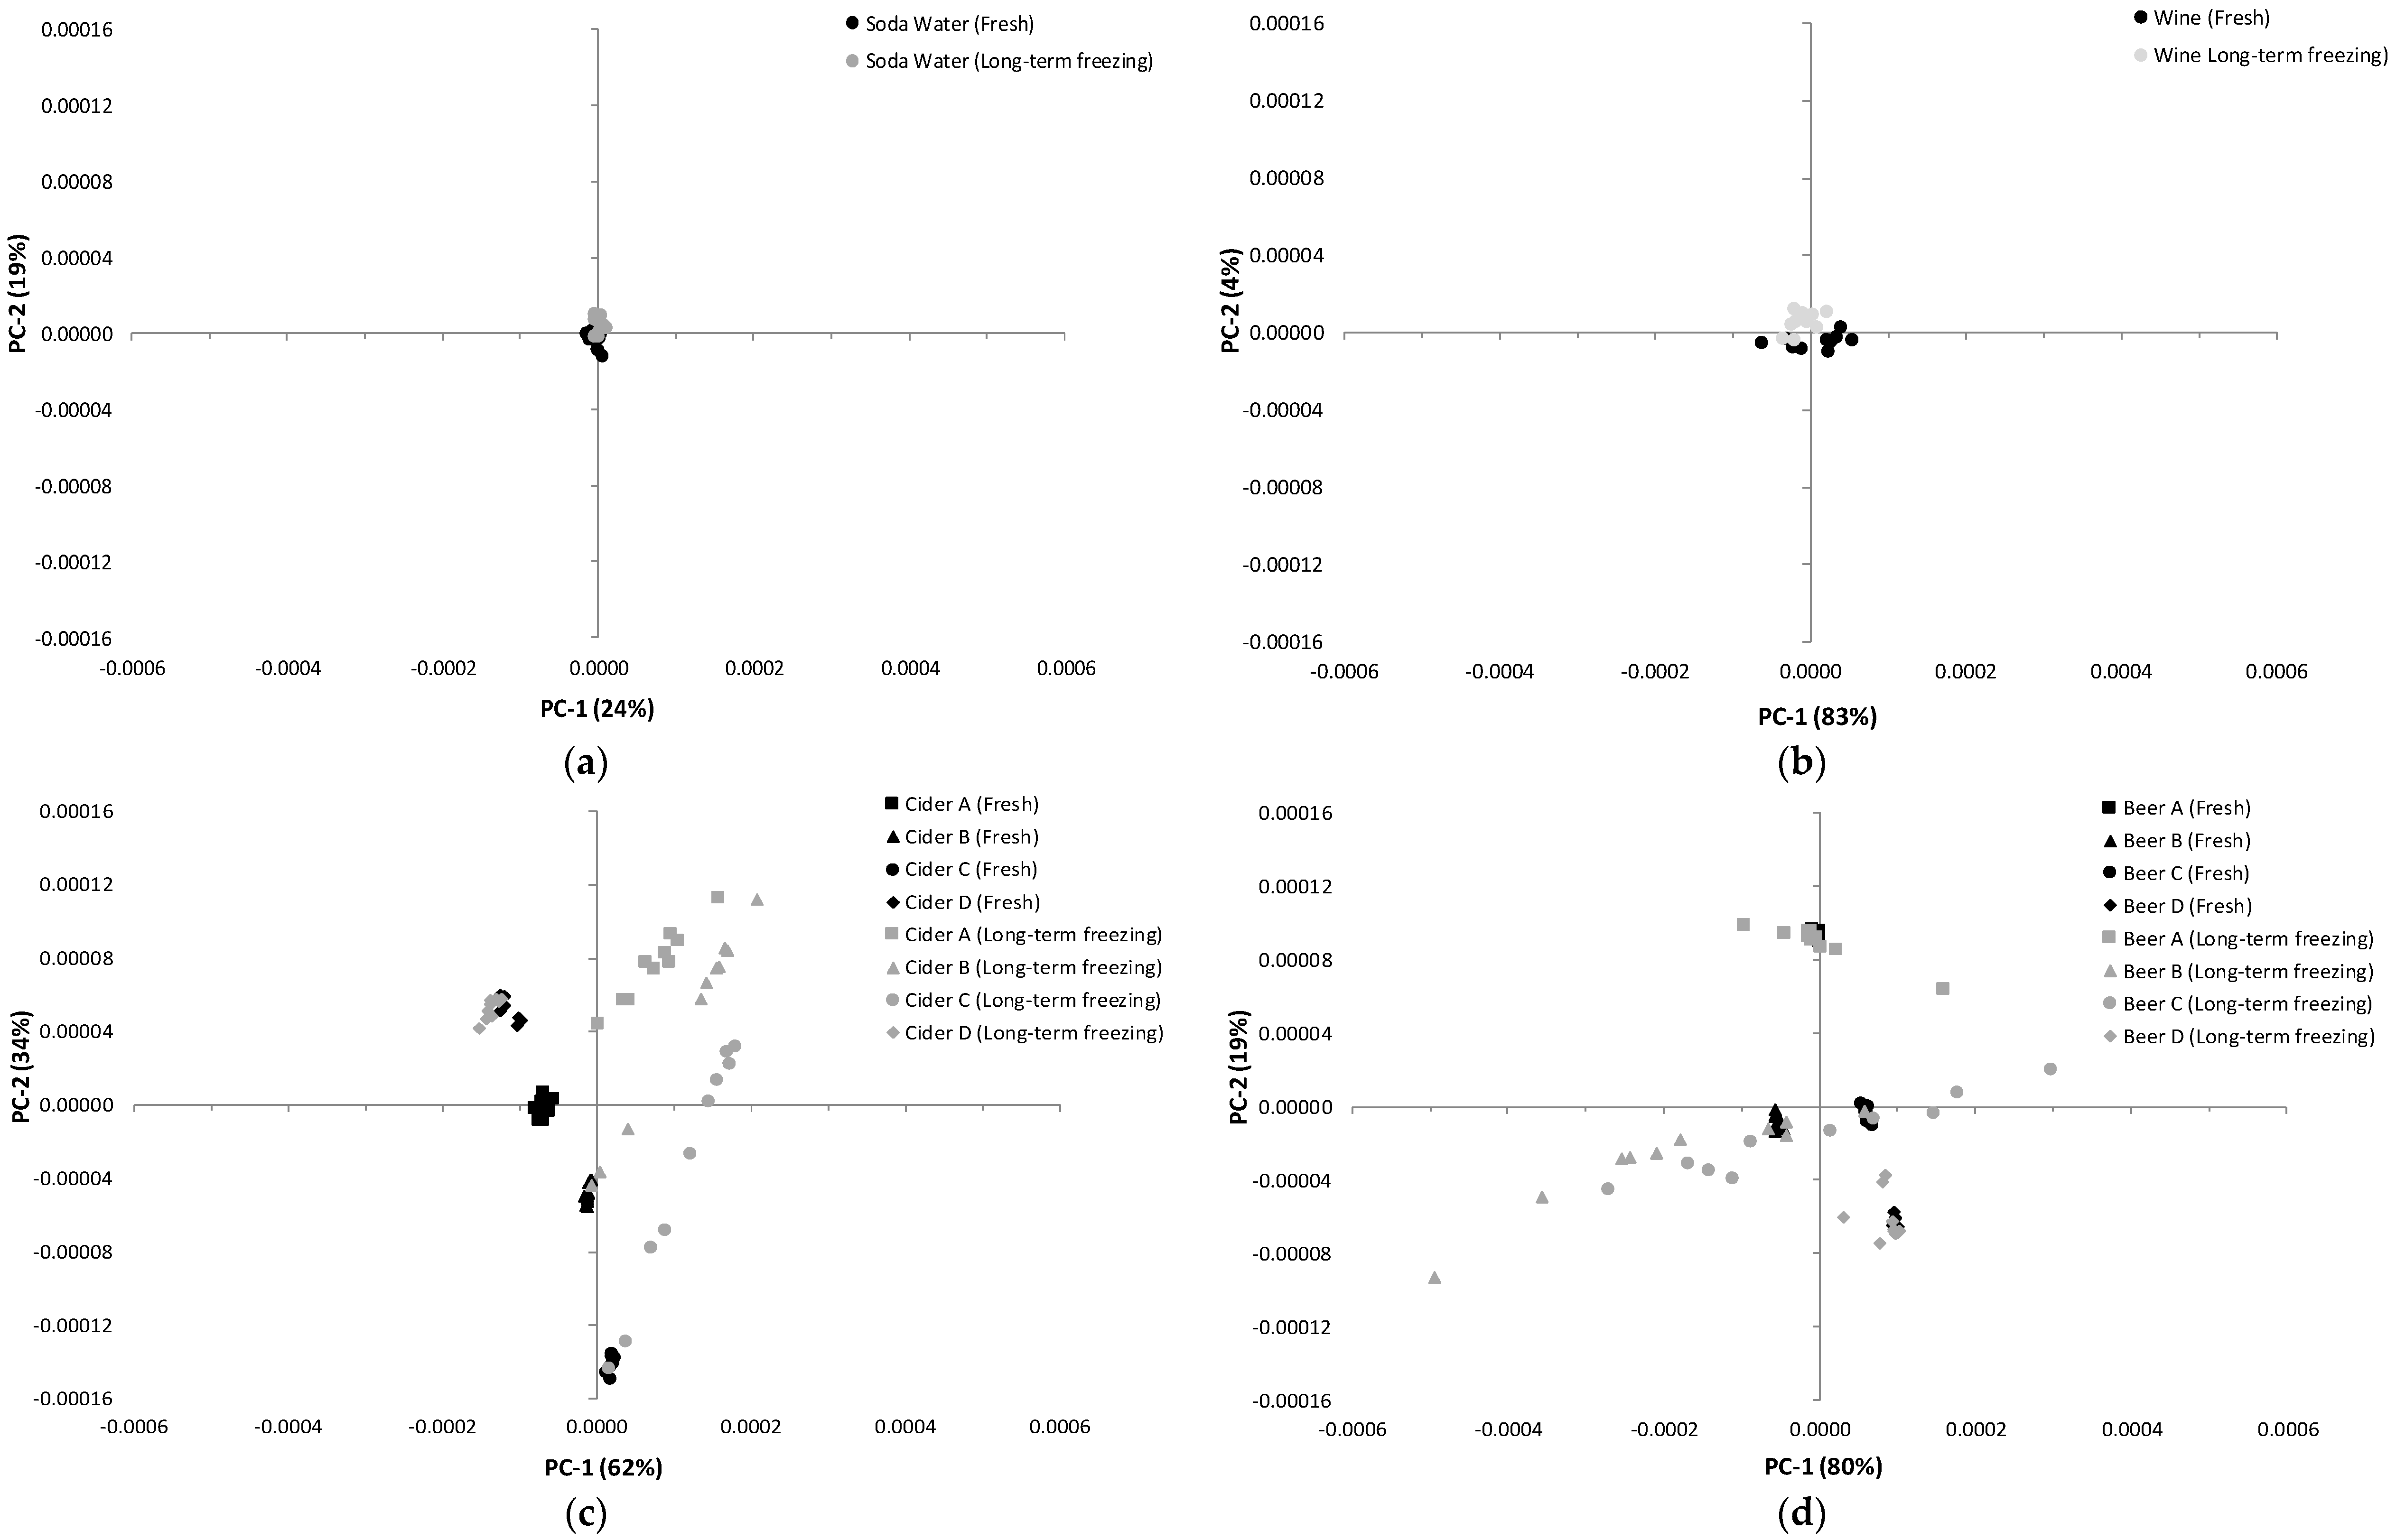
Short-term storage conditions (1 week of refrigeration or freezing) did not greatly influence the clustering patterns in the PCA score plots of the MIR spectra for the various beverages. In fact, the PCA score plots for the sparkling water, sparkling wine, beers, and ciders after short-term storage resembled that which is depicted in Figure 2 for the ‘fresh’ samples. However, long-term freezing resulted in notable ‘drift’ being observed amongst beer and cider samples (Figure 3 and Figure 4), suggesting compositional changes may have occurred under these storage conditions. Sparkling water and sparkling wine samples remained tightly clustered (Figure 3a,b, respectively). While Cider D samples also remained tightly clustered (in the upper left quadrant of the score plot), replicates of other cider samples were no longer positioned close to one another and showed a clear shift away from the ‘fresh’ samples (Figure 3c). Similar variation was observed in the spatial distribution of the beer samples following long-term freezing (Figure 3d). Interestingly, the pear cider (cider C) was still located away from the apple ciders, and amongst the beers (Figure 4).
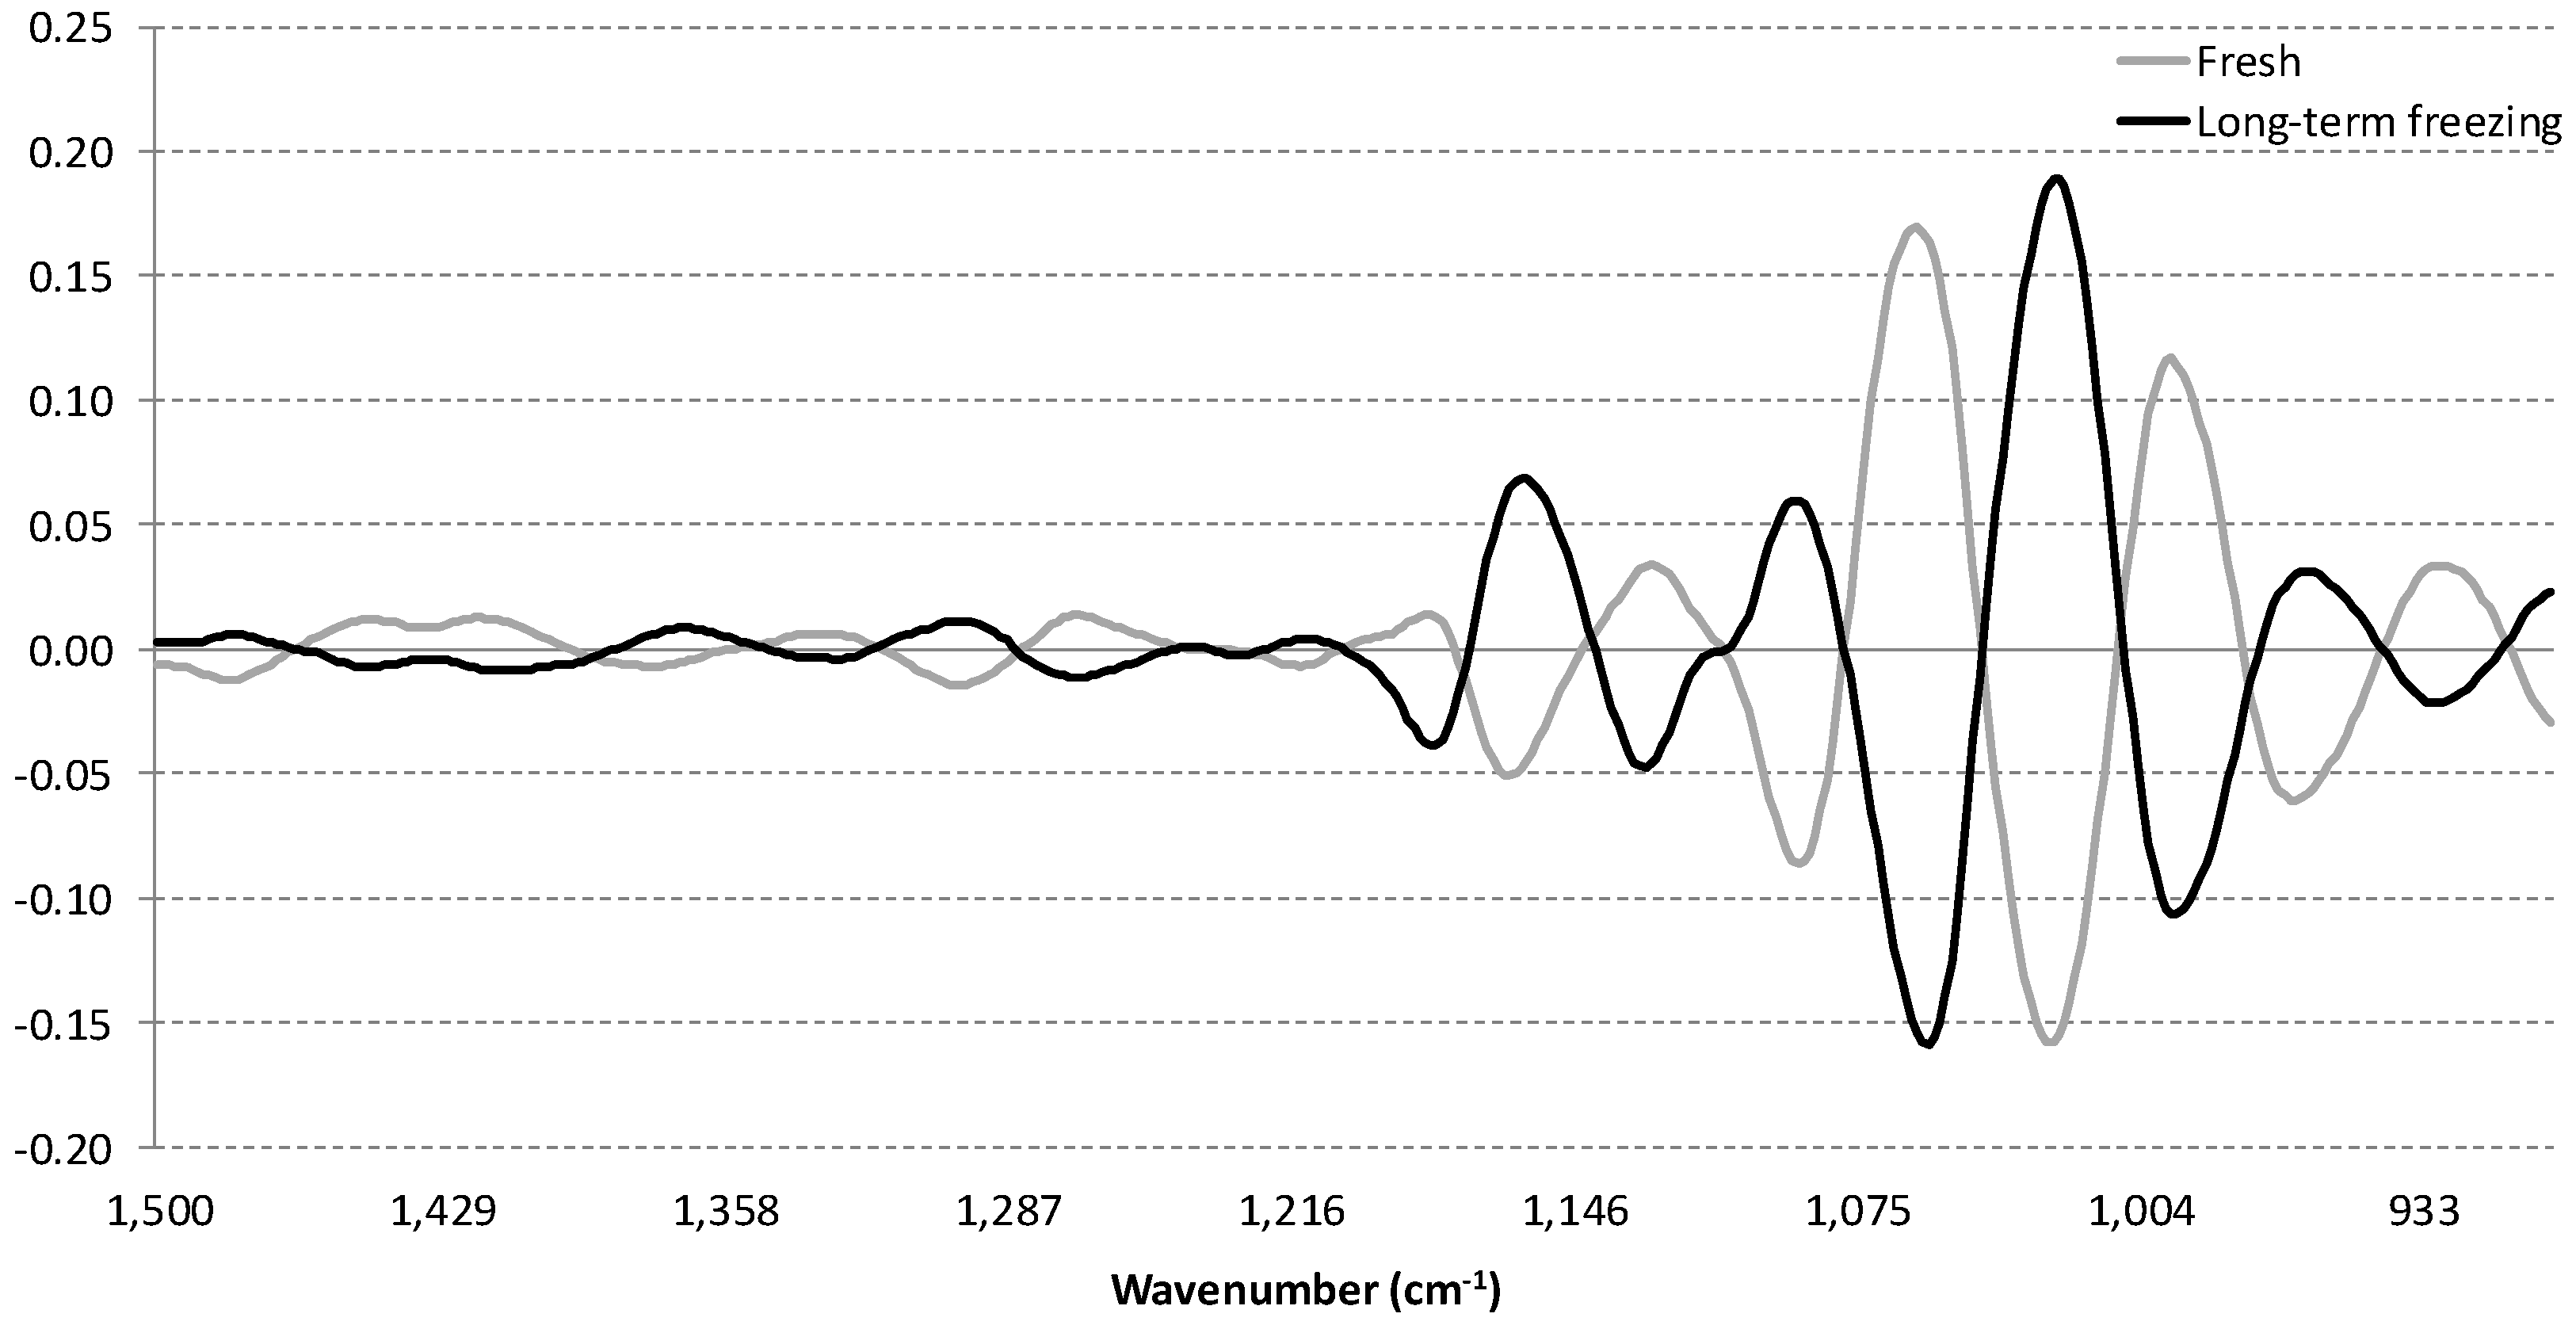
The loadings obtained for the first two PCs from the MIR fingerprint regions of carbonated beverages prior to storage (i.e., ‘fresh’ and degassed) and following long-term freezing were evaluated in an attempt to identify the factors driving the separation of sample replicates (Figure 5 and Figure 6). PC-1 loadings were highest at 1152, 1054, 1028, and 980 cm−1 (Figure 5), whereas PC-2 loadings were highest at 1151, 1130, 1087, 1070, 1020, and 970 cm−1 (Figure 5).
In the first principal component, which explained 85% of the variation, the highest loadings were observed in the region of 1075 to 1004 cm−1, while smaller and less significant variation was observed in the region of 1150 cm−1. Differences within the 1075 to 1004 cm−1 region were typically driven by changes associated with O–H, C–C, and C–OH bonds of ethanol, glycerol [9,10,27], cyclic alcohols (such as phenols) [26], and to a lesser extent sugars [27], while absorbance in the region of 1150 cm−1 usually arose from CO=O, C=C, C–H2, and C–H3 bonds from sugars [28], acids and aldehydes [9], and/or aromatic C–C stretching [17]. Importantly, for PC-1, the fresh and frozen samples followed an almost identical pattern, whereas for PC-2, fresh and frozen samples stored for 6 weeks displayed an inverse relationship. For PC-2, which explained 10% of the variation, the most dominant region was also observed at 1075 to 1004 cm−1, while less significant and smaller loadings were also observed within the 1151–1130 cm−1 region. Taken together, PC-1 and PC-2 suggest either alcohol, glycerol, or phenolics, or to a lesser extent sugar and acids, may be responsible for the ‘drift’ following long term storage of beer and cider.
However, consideration of the basic chemical parameters of individual beer and cider samples can also be used to explain the ‘drift’ as a result of storage conditions. Conventional analysis showed that alcohols, sugars, and color were stable over all storage conditions, suggesting that these components were not responsible for any of the changes observed in the PC score plots and for the loadings in PC-1. However, decreases after long term frozen storage in the phenolic content by 10%–40% in beer and up to 10% in cider, suggest that it is possible that cyclic phenolic alcohols were primarily driving the changes. As there is a scarcity of information on MIR analysis and the cyclic phenolic compounds likely to be present in beer and cider, further studies are needed to confirm if these compounds are changing over long-term storage and are therefore responsible for the observed ‘drift’ in the PCA score plots of the MIR spectra for these beverages. Conventional analysis also revealed changes in TA after long term freezing in beer and cider. Taken together with the PC-1 and PC-2 score plots, organic acids may also be responsible for the observed changes, albeit to a lesser extent than the cyclic phenolic acids. However, as MIR is an extremely sensitive analytical tool, it is also possible that other changes that have not been measured, such as oxidation, may be driving these changes.

4. Conclusions

This study demonstrated that the compositions of several carbonated beverages (sparkling water, sparkling wine, beers, and ciders) were generally not affected by short-term storage and sub-ambient temperatures (i.e., refrigeration or freezing). However, the TA and phenolic content of beer and cider samples were susceptible to long-term freezing. These results suggest that where industry might experience delays in sample analysis, some measurements (e.g., TA) may need to be prioritized to ensure confidence in the analytical data; whereas other measurements (such as pH, alcohol, and sugar content) could be delayed if required. MIR also proved to be an effective tool when combined with PCA, to both qualitatively discriminate between different carbonated beverages and samples stored under different conditions. Additionally, as conventional analytical methods of analysis are often time consuming, MIR spectroscopy could be used as a rapid, non-destructive method for routine analysis and/or to screen samples suited to more detailed compositional analysis by GC-MS or LC-MS.

Supplementary Material

The following is available online at www.mdpi.com/2306-5710/2/4/26/s1, Table S1: Significant changes in titratable acidity (TA) and/or total phenolics of beer and cider following short-term (1 week) refrigeration or freezing or long-term (6 week) freezing.

Acknowledgments

The authors gratefully acknowledge: the industry partners that provided the carbonated beverages used in this study; and financial support provided by Lion Nathan, South Australia. D.C. thanks the University of South Australia for a Summer Vacation Scholarship.

Author Contributions

Pearce, K., Culbert, J., Cozzolino, D. and Wilkinson, K. conceived and designed the experiments; Pearce, K., Culbert, J., Cass, D. and Wilkinson, K. performed the experiments; Pearce, K., Culbert, J., Cass. D. and Cozzolino, D analyzed the data; and Pearce, K. and Wilkinson, K wrote the paper, with Culbert, J., Cass, D. and Cozzolino, D. providing editing support.

Conflicts of Interest

The authors declare no competing financial interest.

References

  1. Tandon, K.; Worobo, R.W.; Churey, J.J.; Padilla-Zakour, O.I. Storage quality of pasteurised and UV treated apple cider. J. Food Process. Preserv. 2003, 27, 21–35. [Google Scholar] [CrossRef]
  2. Vanderhaegen, B.; Delvaux, F.; Daenen, L.; Verachtert, H.; Delvaux, F.R. Aging characteristics of different beer types. Food Chem. 2007, 103, 404–412. [Google Scholar] [CrossRef]
  3. Pérez-Coello, M.; González-Viñas, M.; Garcıa-Romero, E.; Diaz-Maroto, M.; Cabezudo, M. Influence of storage temperature on the volatile compounds of young white wines. Food Control 2003, 14, 301–306. [Google Scholar] [CrossRef]
  4. Perez-Prieto, L.; Lopez-Roca, J.; Gómez-Plaza, E. Differences in major volatile compounds of red wines according to storage length and storage conditions. J. Food Compos. Anal. 2003, 16, 697–705. [Google Scholar] [CrossRef]
  5. Del Nobile, M.A.; Mensitieri, G.; Nicolais, L.; Masi, P. The influence of the thermal history on the shelf life of carbonated beverages bottled in plastic containers. J. Food Eng. 1997, 34, 1–13. [Google Scholar] [CrossRef]
  6. Heuberger, A.L.; Broeckling, C.D.; Lewis, M.R.; Salazar, L.; Bouckaert, P.; Prenni, J.E. Metabolomic profiling of beer reveals effect of temperature on non-volatile small molecules during short-term storage. Food Chem. 2012, 135, 1284–1289. [Google Scholar] [CrossRef] [PubMed]
  7. Penner, M. Ultraviolet, Visible and Fluorescence Spectroscopy; Springer Science: New York, NY, USA, 2010. [Google Scholar]
  8. Bauer, R.; Nieuwoudt, H.; Bauer, F.F.; Kossman, J.; Koch, K.R.; Esbensen, K.H. FTIR spectroscopy for grape and wine analysis. Anal. Chem. 2008, 80, 1371–1379. [Google Scholar] [CrossRef] [PubMed]
  9. Harrison, G.R. Spectroscopy in Food Research. J. Food Sci. 1938, 3, 121–125. [Google Scholar] [CrossRef]
  10. Cozzolino, D.; Holdstock, M.; Dambergs, R.G.; Cynkar, W.U.; Smith, P.A. Mid infrared spectroscopy and multivariate analysis: A tool to discriminate between organic and non-organic wines grown in Australia. Food Chem. 2009, 116, 761–765. [Google Scholar] [CrossRef]
  11. Bevin, C.J.; Dambergs, R.G.; Fergusson, A.J.; Cozzolino, D. Varietal discrimination of Australian wines by means of mid-infrared spectroscopy and multivariate analysis. Anal. Chim. Acta 2008, 621, 19–23. [Google Scholar] [CrossRef] [PubMed]
  12. Cozzolino, D.; Cynkar, W.; Shah, N.; Smith, P. Technical solutions for analysis of grape juice, must, and wine: The role of infrared spectroscopy and chemometrics. Anal. Bioanal. Chem. 2011, 401, 1475–1484. [Google Scholar] [CrossRef] [PubMed]
  13. Lachenmeier, D.W. Rapid quality control of spirit drinks and beer using multivariate data analysis of Fourier transform infrared spectra. Food Chem. 2007, 101, 825–832. [Google Scholar] [CrossRef]
  14. Gómez-Carracedo, M.; Andrade, J.; Fernández, E.; Prada, D.; Muniategui, S. Evaluation of the pure apple juice content in commercial apple beverages using FTMIR-ATR and potential curves. Spectrosc. Lett. 2004, 37, 73–93. [Google Scholar] [CrossRef]
  15. Sivakesava, S.; Irudayaraj, J.M.K.; Korach, R.L. Detection of adulteration in apple juice using mid infrared spectroscopy. Appl. Eng. Agric. 2001, 17, 815–820. [Google Scholar] [CrossRef]
  16. Reid, L.M.; Woodcock, T.; O’Donnell, C.P.; Kelly, J.D.; Downey, G. Differentiation of apple juice samples on the basis of heat treatment and variety using chemometric analysis of MIR and NIR data. Food Res. Int. 2005, 38, 1109–1115. [Google Scholar] [CrossRef]
  17. Rudnitskaya, A.; Kirsanov, D.; Legin, A.; Beullens, K.; Lammertyn, J.; Nicolaï, B.M.; Irudayaraj, J. Analysis of apples varieties—Comparison of electronic tongue with different analytical techniques. Sens. Actuators B 2006, 116, 23–28. [Google Scholar] [CrossRef]
  18. Fudge, A.L.; Wilkinson, K.L.; Ristic, R.; Cozzolino, D. Classification of Smoke Tainted Wines Using Mid-Infrared Spectroscopy and Chemometrics. J. Agric. Food Chem. 2011, 60, 52–59. [Google Scholar] [CrossRef] [PubMed]
  19. Batten, G. Plant analysis using near infrared reflectance spectroscopy: The potential and the limitations. Anim. Prod. Sci. 1998, 38, 697–706. [Google Scholar] [CrossRef]
  20. Brereton, R.G. Introduction to multivariate calibration in analytical chemistry. Analyst 2000, 125, 2125–2154. [Google Scholar] [CrossRef]
  21. Garcia, S.; Santesteban, L.G.; Miranda, C.; Royo, J.B. Variety and storage time affect the compositional changes that occur in grape samples after frozen storage. Aust. J. Grape Wine Res. 2011, 17, 162–168. [Google Scholar] [CrossRef]
  22. Culbert, J.; Cozzolino, D.; Ristic, R.; Wilkinson, K. Classification of sparkling wine style and quality by MIR spectroscopy. Molecules 2015, 20, 8341–8356. [Google Scholar] [CrossRef] [PubMed]
  23. Iland, P.G.; Bruer, N.; Edwards, G.; Weeks, S.; Wilkes, E. Chemical Analysis of Grapes and Wine: Techniques and Concepts; Patrick Iland Wine Promotions: Adelaide, Australia, 2004. [Google Scholar]
  24. Moll, M.; European Brewery Convention. Method 8.3, E131. In Analytics-EBC, 4th ed.; Brauerei- und Getränke-Rundschau: Zurich, Switzerland, 1987. [Google Scholar]
  25. Hoff, S.; Lund, M.N.; Petersen, M.A.; Frank, W.; Andersen, M.L. Storage stability of pasteurized non-filtered beer. J. Inst. Brew. 2013, 119, 172–181. [Google Scholar] [CrossRef]
  26. Cozzolino, D.; Cynkar, W.; Shah, N.; Smith, P. Feasibility study on the use of attenuated total reflectance mid-infrared for analysis of compositional parameters in wine. Food Res. Int. 2011, 44, 181–186. [Google Scholar] [CrossRef]
  27. Gishen, M.; Cozzolino, D.; Dambergs, R.G. The analysis of grapes, wine, and other alcoholic beverages by infrared spectroscopy. In Handbook of Vibrational Spectroscopy; John Wiley and Sons: New York, NY, USA, 2006. [Google Scholar]
  28. Bevin, C.J.; Fergusson, A.J.; Perry, W.B.; Janik, L.J.; Cozzolino, D. Development of a rapid ”fingerprinting” system for wine authenticity by mid-infrared spectroscopy. J. Agric. Food Chem. 2006, 54, 9713–9718. [Google Scholar] [CrossRef] [PubMed]
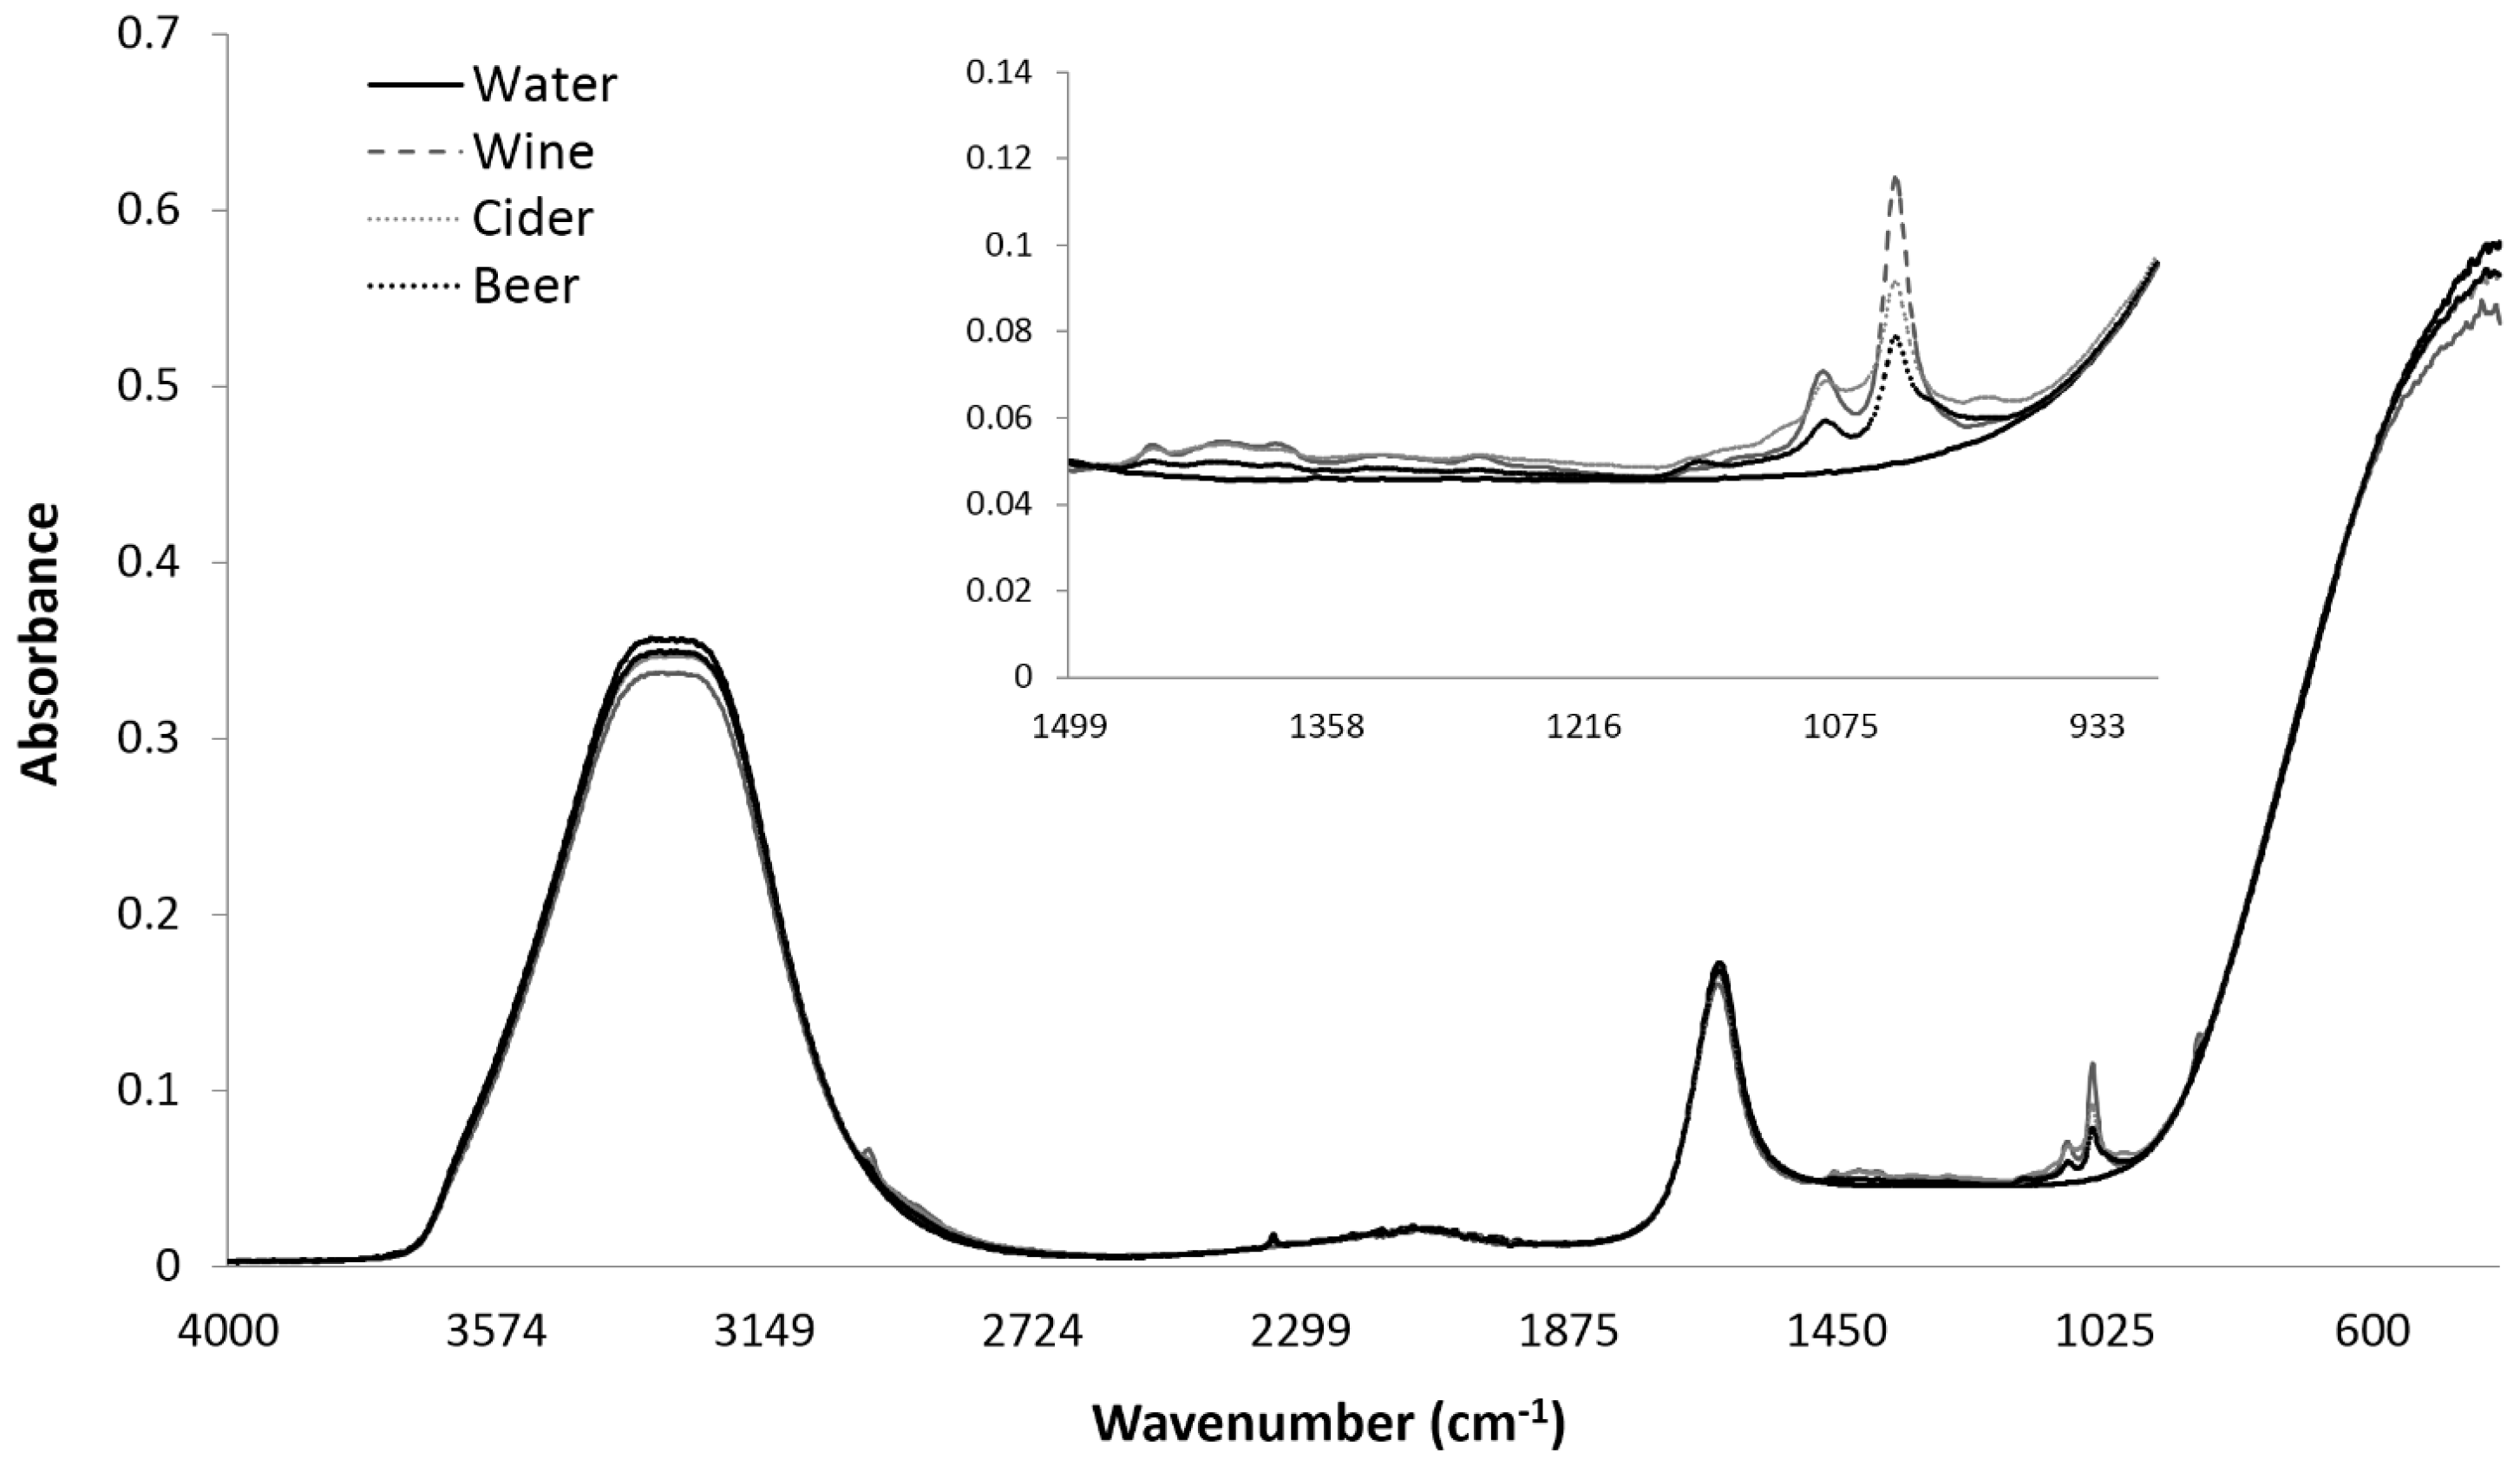
Figure 1. Average ATR-MIR spectra (4000–400 cm−1) for each degassed carbonated beverage: sparkling water (n = 1), sparkling wine (n = 1), beer (n = 4), and cider (n = 4); ten replicates of each.
Beverages 02 00026 g001
Figure 2. Score plot of the first two PCs derived from the MIR fingerprint region (1500–900 cm−1) of fresh degassed carbonated beverages (ten replicates of each).
Beverages 02 00026 g002
Figure 3. Score plots of the first two PCs derived from the MIR fingerprint region (1500–900 cm−1) of (a) sparkling water; (b) sparkling wine; (c) ciders; and (d) beers prior to storage (i.e., fresh and degassed) and following long-term (6 week) freezing.
Beverages 02 00026 g003
Figure 4. Score plot of the first two PCs derived from the MIR fingerprint region (1500–900 cm−1) of beers and ciders, following long-term (6 week) freezing.
Beverages 02 00026 g004
Figure 5. Loadings for the first PC for the MIR fingerprint region (1500–900 cm−1) of carbonated beverages prior to storage (i.e., fresh and degassed) and following long-term (6 week) freezing.
Beverages 02 00026 g005
Figure 6. Loadings for the second PC for the MIR fingerprint region (1500–900 cm−1) of carbonated beverages prior to storage (i.e., fresh and degassed) and following long-term (6 week) freezing.
Beverages 02 00026 g006
Table 1. pH, titratable acidity, sugar, alcohol content, total phenolics, and color of the carbonated beverages after sonication and refrigeration or freezing.
Carbonated BeveragespHTA (g/L)Sugar (g/L)Alcohol (% abv)Total phenolics (au)Color (au)
Sparkling waterMean a6.10.5ndndndnd
Range5.9–6.10.1–0.9----
Sparkling wineMean a3.16.612.711.73.60.1
Range3.0–3.26.0–7.310.4–14.411.4–12.02.6–4.20.1–0.1
Beer AMean a4.12.00.24.511.18.8
Range4.1–4.21.6–2.80.1–0.53.9–4.67.5–12.67.5–9.6
Beer BMean a4.12.00.14.514.110
Range4.1–4.11.6–2.70.0–0.44.0–4.610.7–15.29.8–10.9
Beer CMean a4.11.80.23.411.09.0
Range4.0–4.11.3–2.40.1–0.53.0–3.47.1–12.49.0–10.8
Beer DMean a4.11.20.22.49.010.9
Range4.0–4.11.1–1.40.1–0.51.4–2.83.4–11.07.9–12.2
Cider AMean a3.36.820.55.017.01.5
Range3.3–3.36.5–7.017.5-22.84.9–5.015.5–18.21.5–1.5
Cider BMean a3.66.421.74.729.73.0
Range3.6–3.66.2–6.618.1–24.14.4–4.825.8–31.12.5–3.5
Cider CMean a3.57.121.74.918.12.0
Range3.5–3.65.7–8.117.2–23.94.7–5.013.9–19.61.5–2.5
Cider DMean a3.15.411.04.914.71.5
Range3.1–3.44.1–6.66.3–13.23.3–5.112.6–16.21.5–1.5
% abv, alcohol by volume. au, absorbance units. a Values are the means from ten experimental replicates (n = 10) per treatment. nd = not detected. TA was measured as tartaric acid equivalents for sparkling wine and as malic acid equivalents for beer and cider, to endpoints of 8.2. Total phenolics were measured at A280. Color was measured at A420 for sparkling wine and at A430 for beer and cider.