3.1. Sensory Analysis
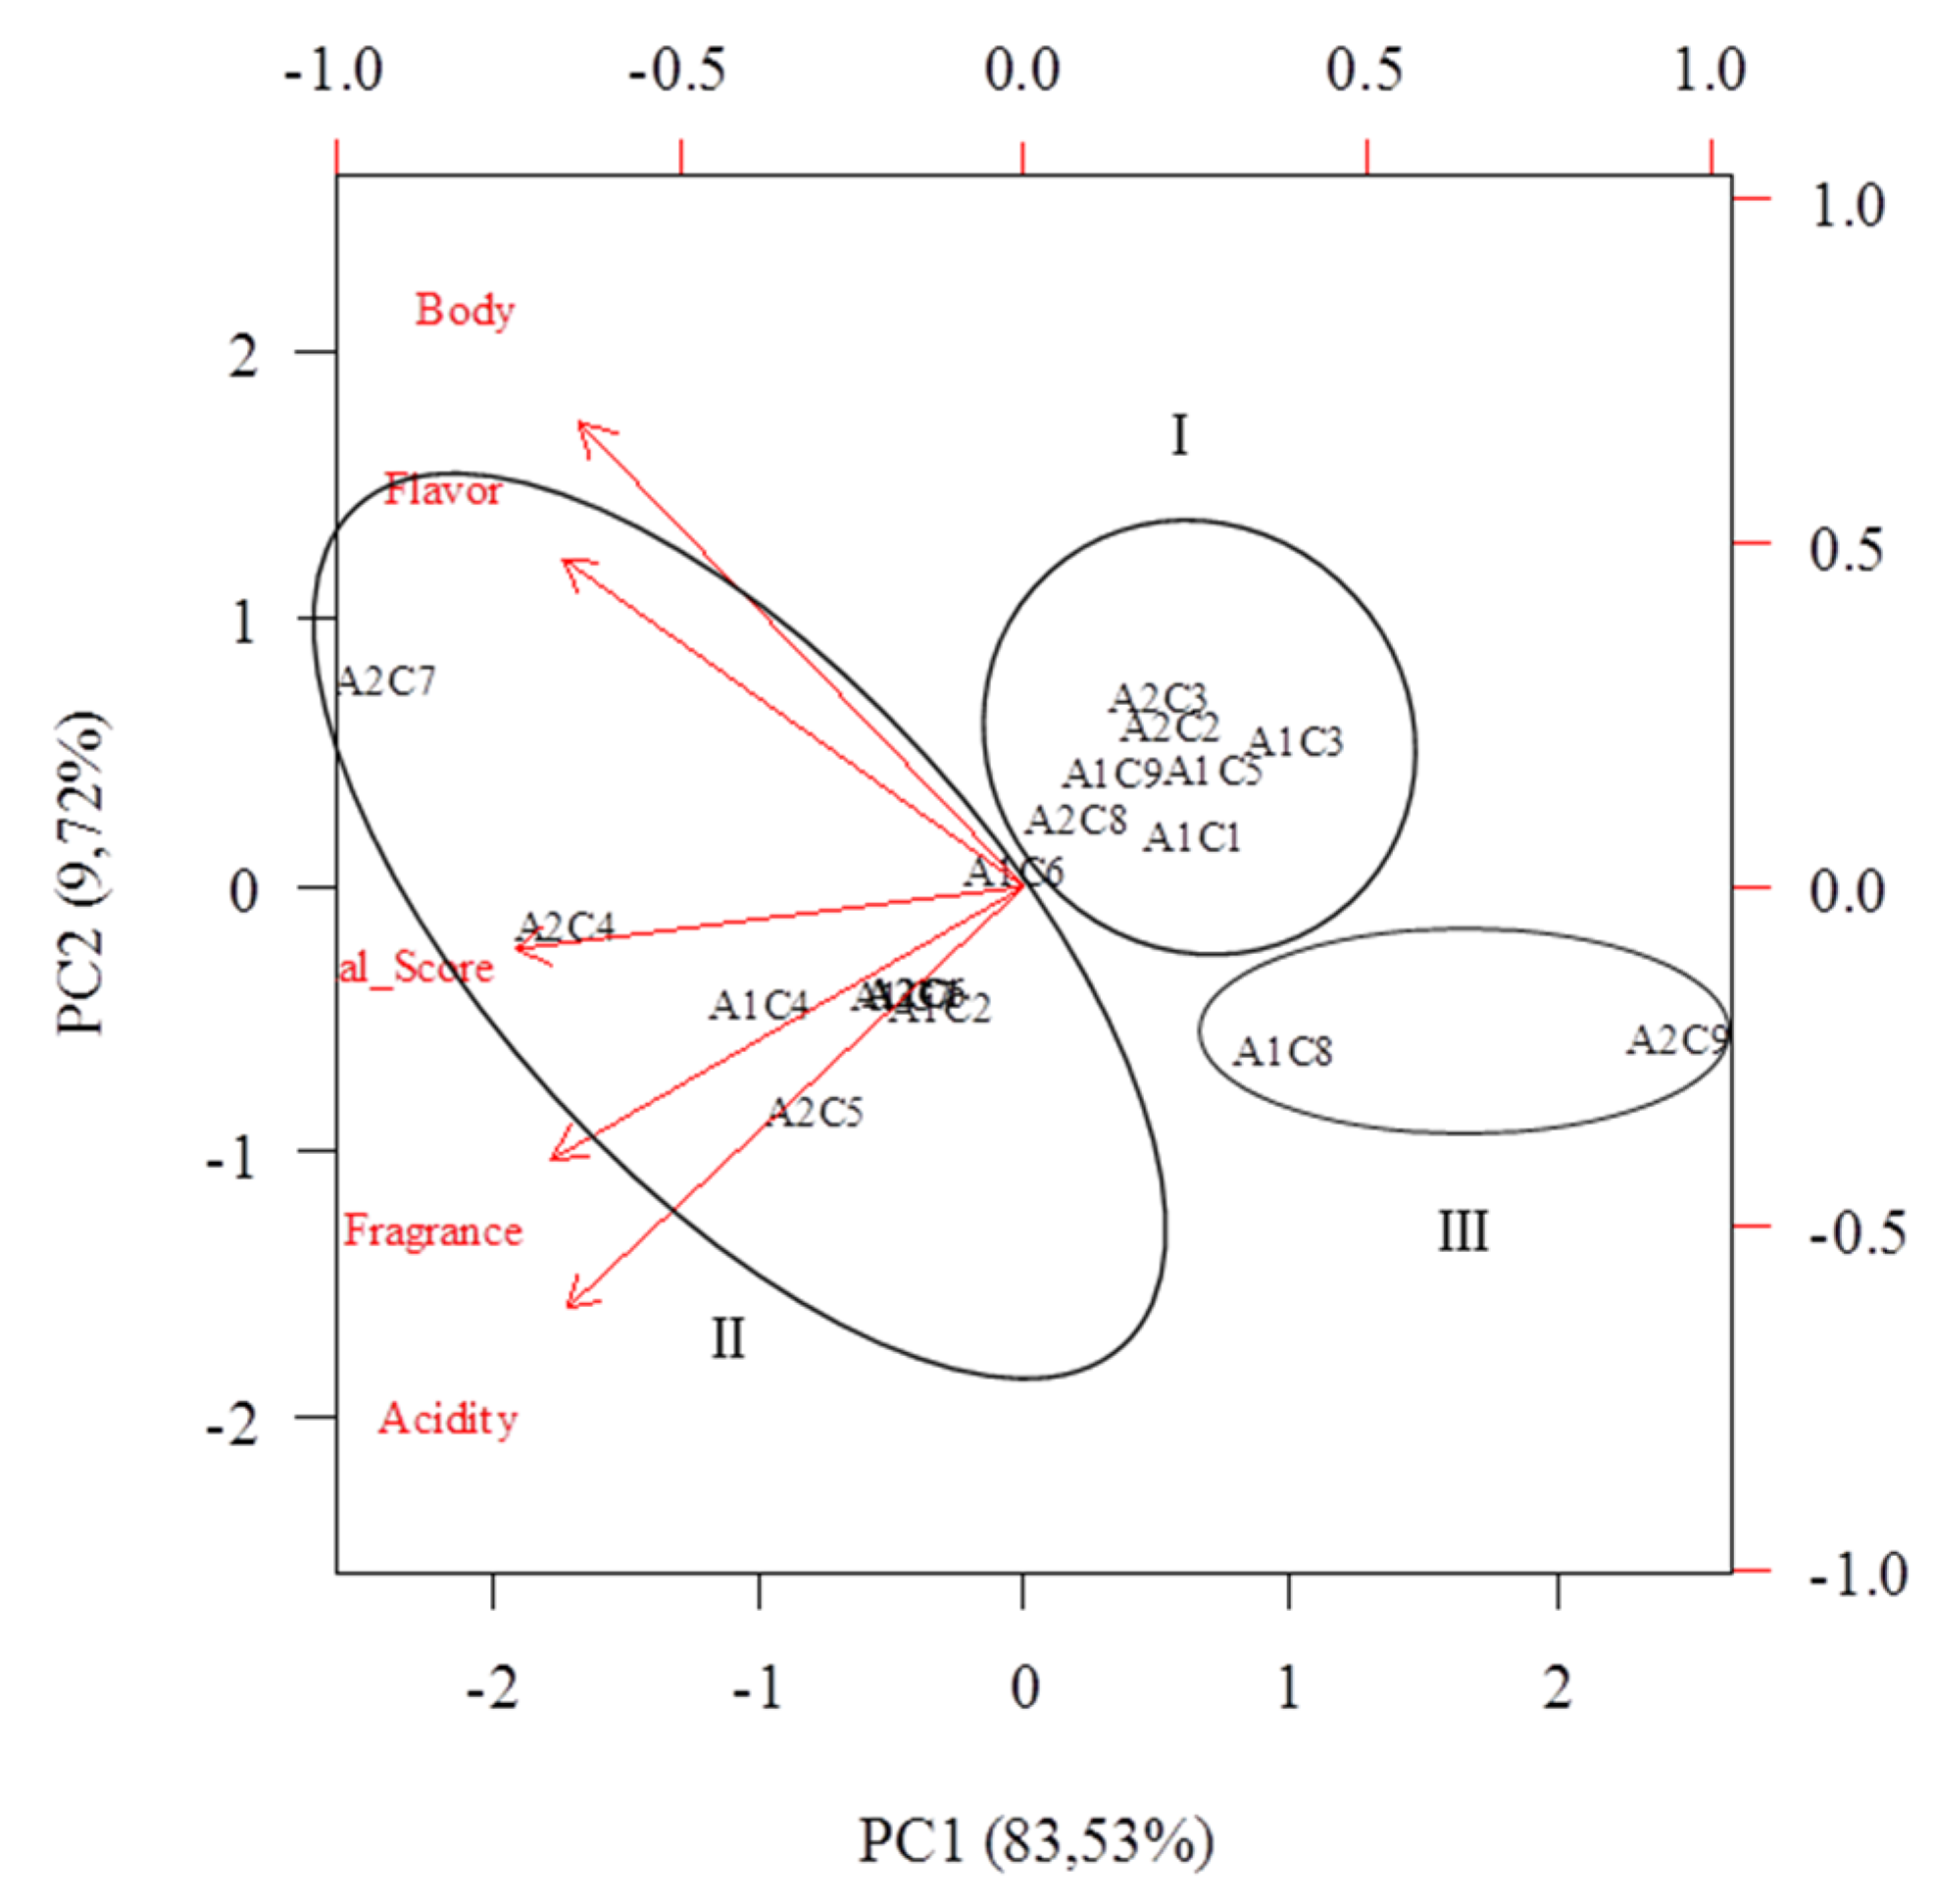
The two first principal components explained 93.25% of the variability in responses, showing satisfactory explanation of the variation seen among samples in relation to sensory parameters (
Figure 1). The first principal component suggests similarity among points, forming three distinct cultivar
x environment groups: the first group (I), with points allocated in the central area of the biplot (A1C1, A1C3, A1C5, A1C9, A2C2, A2C3, and A2C8); the second group (II) with the points allocated in the left portion of the biplot (A1C2, A1C4, A2C1, A2C4, A2C5, A1C7, A2C7, A1C6, and A2C6) and a third group positioned in the lower right portion of the biplot (A1C8 and A2C9).
It can be seen that the coffees belonging to Group III (Bourbon Amarelo and Topázio MG1190, in Lavras and Patrocinio environments, respectively) had low correlation with fragrance, taste, acidity, and body and also lower final scores when compared to Group II. These cultivars used as controls for the standard drink and for being cultivars susceptible to rust, showed low correlation with the evaluated sensory attributes, always placing in Group I and III, regardless of the environment studied. Figueiredo
et al. [
12], from multivariate analysis, also found that the Bourbon genotypes are expressed differently from a sensory point of view, even though the Bourbon cultivar is known worldwide for the production of specialty coffees. For Ferreira
et al. [
13] not every Bourbon coffee genotype has the same potential for producing special coffee.
Chalfoun
et al. [
14], on evaluating the sensory characteristics of different Arabica coffee cultivars, also found a superiority of cultivars resistant to rust, compared to the Topázio MG1190 cultivar in Patrocinio.
Figure 1.
Biplot of the first two axes of the principal component analysis for data from nine cultivars (C) and two environments (A), as a function of the attributes and the final sensory score. C1 = Pau Brasil MG1; C2 = Paraíso MGH419-1; C3 = Sacramento; C4 = Araponga MG1; C5 = Oeiras MG6851; C6 = Catigua MG1; C7 = Catigua MG2; C8 = Topázio MG1190; and C9 = Bourbon Amarelo; A1 = Patrocinio, and A2 = Lavras.
It can be seen that the coffees grouped to the left of the biplot (Group II) showed greater intensity of fragrance, flavor, acidity, and body (
Figure 1) and also higher final scores (
Table 2). All cultivars allocated in this group had scores above 84 points and, therefore, have potential for production of specialty coffees in the study sites, highlighting the cultivar C7 (Catigua MG2) in Lavras (A2), which had 86.92 points.
Based on Group II, was observed that the cultivars C4, C6, and C7 (Araponga MG1, Catigua MG1, and CatiguaMG2, respectively) had good sensory expression, regardless of the culture environment, in the sense that these cultivars appear all in a group associated with sensory attributes. As for the C1 and C5 cultivars (Pau Brasil MG1 and Oeiras MG6851) they are expressed best when grown in Lavras and the cultivar Paraíso MGH419-1 (C2) in Patrocinio.
The separation of the points of cultivars and environments into the three distinct groups was considered based on the fact that the genetics of the plant and the environment where it is grown are directly related to the definition of the sensory drink quality [
10].
The chemical composition and the drink quality of traditional and hybrid cultivars of
C. arabica in different countries of Central America were evaluated by Bertrand
et al. [
15], and the authors also noted that, depending on the planting site, some cultivars, sensorially, had better results than others, whether they are hybrid or not. According to Scholz
et al. [
16] the same cultivar has different behaviors in different locations, it not being possible to associate specific sensory characteristics for each cultivar.
Table 2.
Results of the sensory attributes and values of trigonelline, 5-CQA, and caffeine of different Arabica coffee cultivars and their interactions with two environments: mean and probability of significance (F) determined by analysis of variance (ANOVA) of two environments and nine cultivars.
Table 2.
Results of the sensory attributes and values of trigonelline, 5-CQA, and caffeine of different Arabica coffee cultivars and their interactions with two environments: mean and probability of significance (F) determined by analysis of variance (ANOVA) of two environments and nine cultivars.
| Cultivar/Environment | Fragrance * | Flavor * | Acidity * | Body * | Final Score * | Trigonelline * | 5-CQA * | Caffeine * |
|---|
| A1 | xC1 | 7.67 | 7.92 | 7.42 | 7.92 | 83.00 | 1.75 | 4.32 c | 1.21 b |
| xC2 | 8.00 | 8.08 | 7.67 | 7.92 | 84.58 | 1.77 | 5.45 b | 1.51 a |
| xC3 | 7.50 | 7.92 | 7.33 | 7.92 | 82.17 | 1.64 | 6.12 a | 1.45 a |
| xC4 | 8.00 | 8.50 | 7.92 | 7.92 | 85.08 | 1.37 | 3.40 d | 1.05 c |
| xC5 | 7.67 | 8.00 | 7.33 | 7.92 | 82.67 | 1.51 | 3.43 d | 1.30 b |
| xC6 | 8.00 | 8.00 | 7.50 | 8.00 | 83.50 | 1.82 | 4.67 c | 1.36 b |
| xC7 | 8.00 | 8.00 | 7.75 | 8.00 | 84.50 | 1.78 | 4.45 c | 1.36 b |
| xC8 | 7.67 | 7.67 | 7.58 | 7.83 | 82.17 | 1.66 | 4.47 c | 1.36 b |
| xC9 | 7.67 | 8.00 | 7.50 | 8.00 | 83.17 | 1.58 | 3.97 c | 1.24 b |
| F | | 0.93 | 0.60 | 0.35 | 0.89 | 0.80 | 0.25 | 0.00 | 0.04 |
| A2 | xC1 | 8.00 | 8.00 b | 7.75 a | 8.00 | 84.25 a | 1.48 | 3.98 b | 1.35 b |
| xC2 | 7.50 | 8.00 b | 7.50 b | 8.00 | 83.00 b | 1.44 | 4.66 b | 1.22 b |
| xC3 | 7.67 | 8.00 b | 7.33 b | 8.00 | 82.75 b | 1.50 | 5.37 a | 1.48 a |
| xC4 | 8.33 | 8.33 b | 7.92 a | 8.17 | 85.83 a | 1.67 | 4.36 b | 1.52 a |
| xC5 | 8.00 | 8.00 b | 8.00 a | 8.00 | 85.00 a | 1.16 | 3.02 c | 1.15 b |
| xC6 | 8.00 | 8.00 b | 7.75 a | 8.00 | 84.17 a | 1.58 | 4.23 b | 1.62 a |
| xC7 | 8.17 | 8.67 a | 8.00 a | 8.33 | 86.92 a | 1.53 | 3.31 c | 1.27 b |
| xC8 | 7.83 | 8.00 b | 7.50 b | 8.00 | 83.00 b | 1.37 | 3.20 c | 1.31 b |
| xC9 | 7.83 | 7.33 c | 7.25 b | 7.67 | 80.50 c | 1.71 | 4.36 b | 1.65 a |
| F | | 0.06 | 0.01 | 0.00 | 0.37 | 0.00 | 0.27 | 0.00 | 0.04 |
The sensory scores of three jugdes showed that the cultivar Sacramento MG1 (C3), even obtaining scores above 80 (
Table 2), did not show positive correlation with the sensory attributes fragrance, flavor, body, and acidity in both studied environments, always being allocated in Group I. This behavior was also observed by Scholz
et al. [
16], though with different cultivars. The authors report that the IPR 100 and IPR 104 cultivars had lower correlation with the aroma and body attributes in the two environments. This shows that genetics is one of the factors that determine the drink quality of Arabica coffee [
17]. Thus, special care is recommended in conducting this cultivar, Sacramento MG1, in both coffee regions studied, to better express its sensory attributes.
The attributes fragrance, flavor, acidity, and body were important in the discrimination of coffees, thus characterizing the first principal component (
Table 3) and all of them are correlated between them (
Table 4). It is possible to verify the behavior of cultivars, from a sensory point of view, by means of the scores of each sample point, which is formed by the cultivar
x environment interaction. Moreover, it can be seen in
Table 3 that the first principal component, which has highest proportion of variance explained by data, has the final score with the highest standard deviation and high correlation between another attributes (
Table 4). This means that the first component is viewed as a quality coffee indicator according to its sensorial attributes.
Table 3.
Descriptive statistics and correlations between the parameters assessed (final score and sensory attributes) with the first two principal components and the respective coefficients of each parameter with the main component.
Table 3.
Descriptive statistics and correlations between the parameters assessed (final score and sensory attributes) with the first two principal components and the respective coefficients of each parameter with the main component.
| Parameters | Mean | Standard Deviation | PC1 | PC2 |
|---|
| Coefficients | Correlation * | Coefficients | Correlation * |
|---|
| Fragrance | 7.833 | 0.262 | −0.450 | −0.9192 | −0.359 | −0.2506 |
| Flavor | 8.023 | 0.284 | −0.441 | −0.9015 | 0.427 | 0.2980 |
| Acidity | 7.611 | 0.243 | −0.435 | −0.8894 | −0.558 | −0.3893 |
| Body | 7.977 | 0.133 | −0.423 | −0.8642 | 0.608 | 0.4237 |
| Final Score | 83.68 | 1.517 | −0.485 | −0.9904 | 0.000 | −0.0587 |
Table 4.
Correlations between each parameter assessed (final score and sensory attributes) and results of the Student’s t-test when population correlation is different from zero.
Table 4.
Correlations between each parameter assessed (final score and sensory attributes) and results of the Student’s t-test when population correlation is different from zero.
| Parameters | Fragrance | Flavor | Acidity | Body | Final Score |
|---|
| Fragrance | 1.000 | 0724 * | 0.849 * | 0.701 * | 0.915 * |
| Flavor | 0.724 * | 1.000 | 0.690 * | 0.823 * | 0.881 * |
| Acidity | 0.845 * | 0.690 * | 1.000 | 0.614 * | 0.901 * |
| Body | 0.701 * | 0.823 * | 0.614 * | 1.000 | 0.821 * |
| Final Score | 0.915 * | 0.881 * | 0.901 * | 0.821 * | 1.000 |
The fact of all variables are correlated is an important aspect in principal component analysis, however, is necessary to be checked if the correlation matrix is significantly different from zero by the Bartlett test [
18]. Then, using the correlation matrix in
Table 4, it has showed that the null hypothesis that the correlation matrix is an identity was rejected (
p < 0.05).
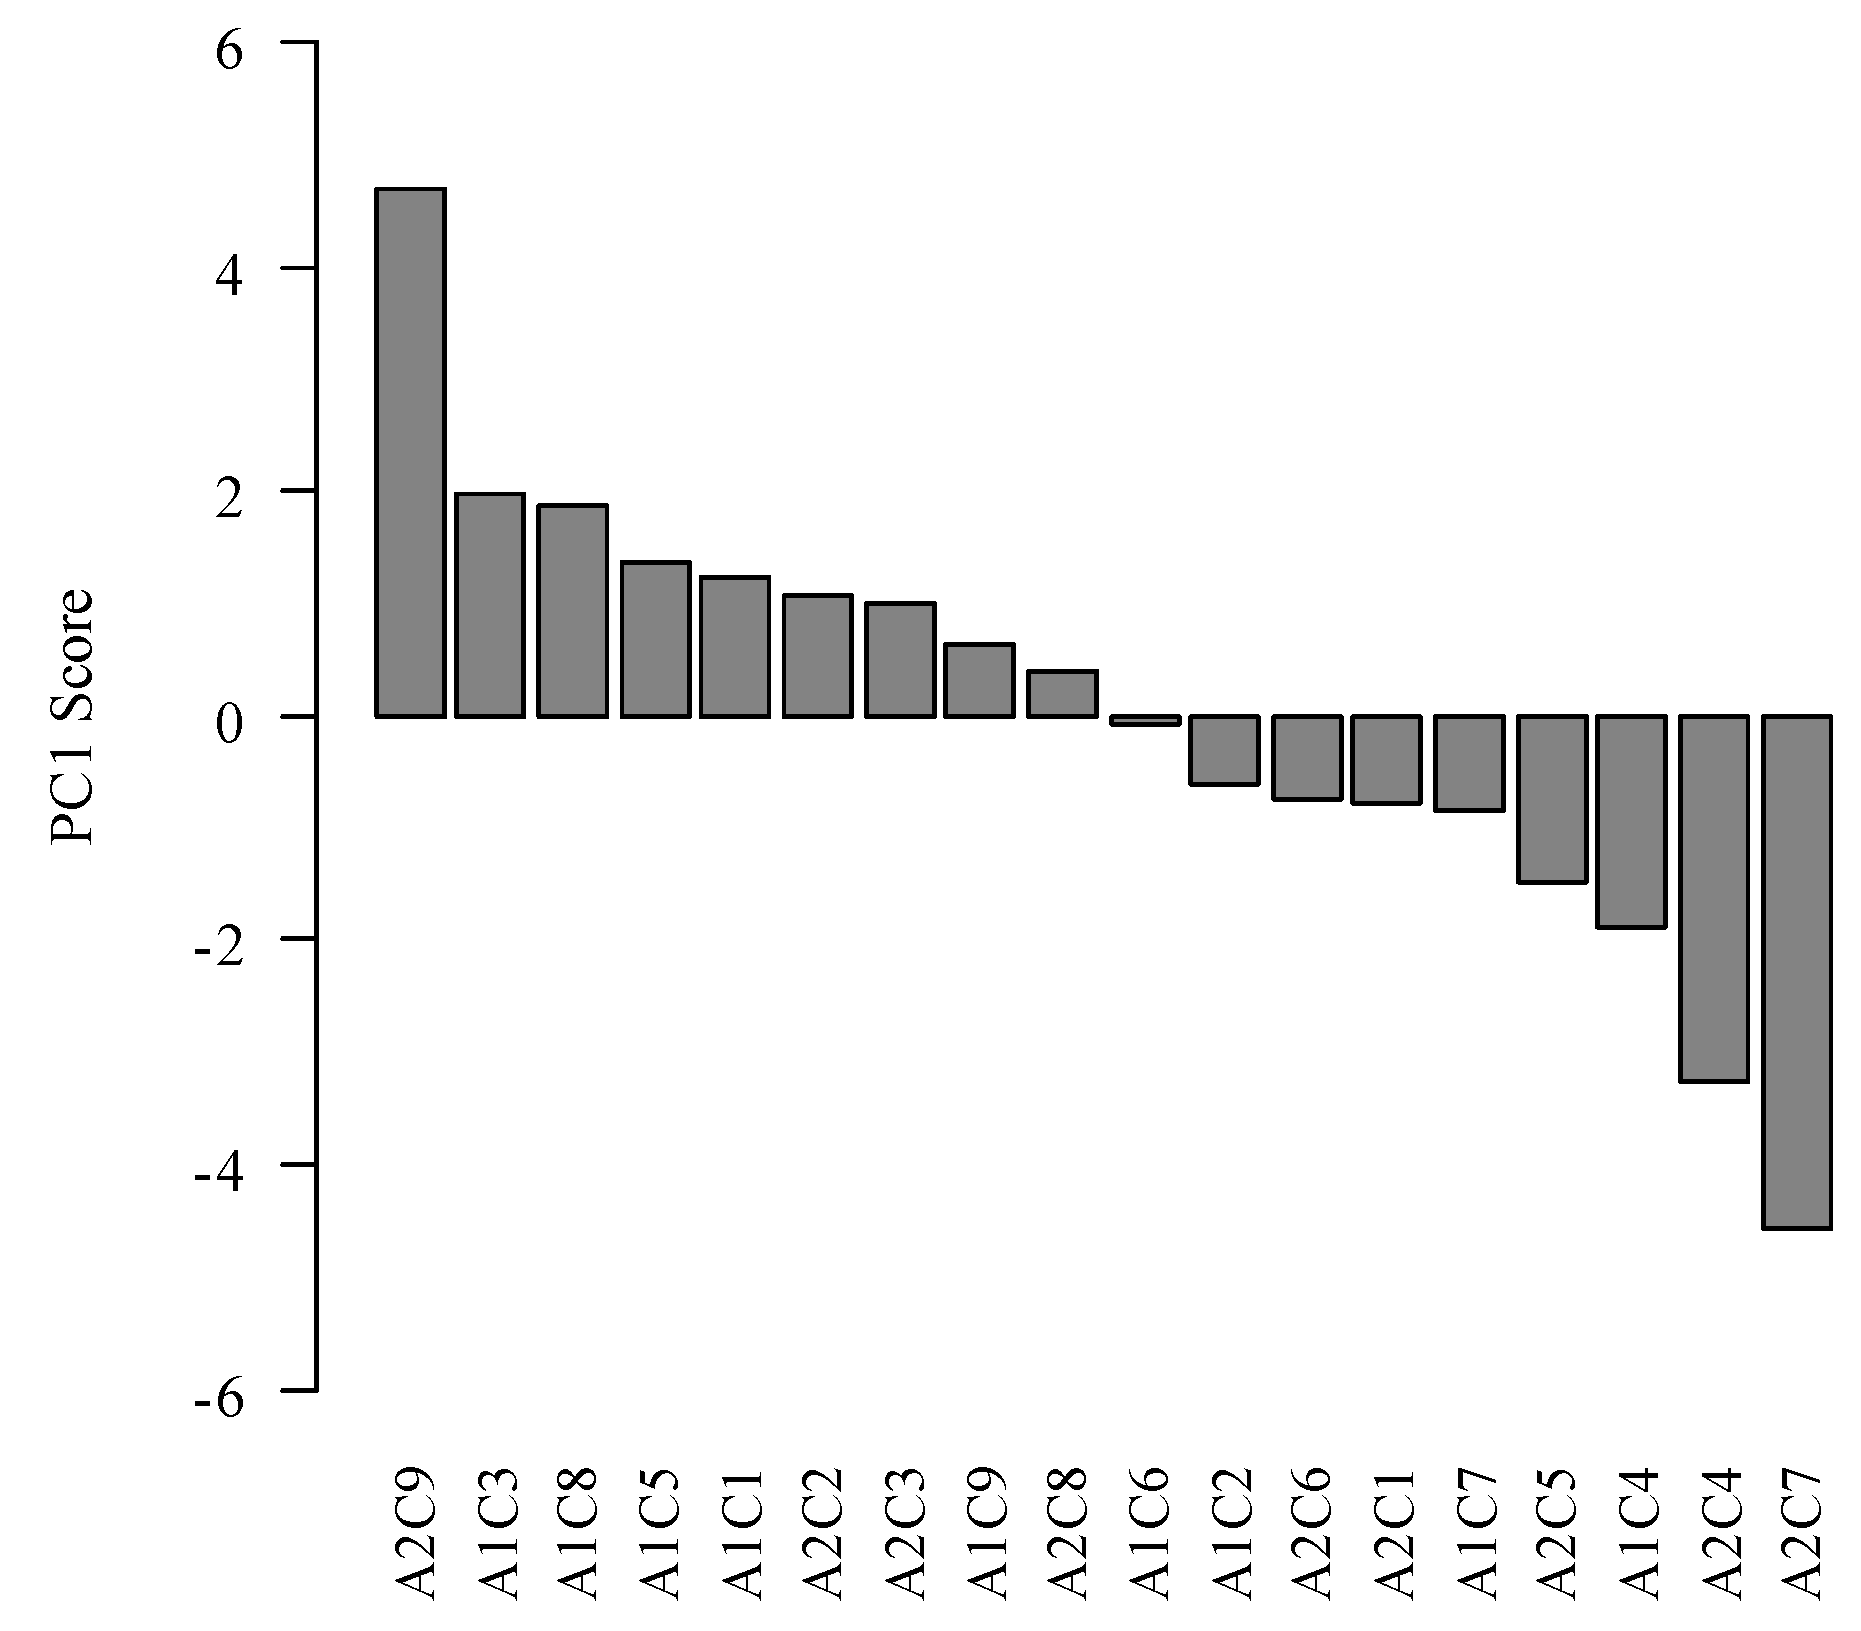
Figure 2 and
Figure 3 present the scores of genotype
x environment interactions for the first (PC1) and second principal component (PC2), respectively.
For PC1, the A2C7 coffee (Catigua MG2/Lavras) showed a higher negative score, therefore being the coffee with the better sensory attribute and final scores, followed by A2C4 (Araponga/Lavras) coffee. In this case, the Lavras environment, when combined with Catigua MG2 and Araponga MG1 cultivars, stands out for the production of specialty coffees. According to results demonstrated presented by Chagas, Malta and Pereira [
19] based on data from 22 cities, the southern region of Minas Gerais has favorable soil and climatic characteristics for the production of top quality coffees.
The A2C8 (Topázio/Lavras), A1C6 (Catigua MG1/Patrocinio) and A1C2 (Paraíso/Patrocinio) coffees can be considered as intermediate coffees, because their scores showed values close to zero.
Furthermore, according to
Figure 2, cultivar A2C9 (Bourbon/Lavras) had the highest positive score, and is thus the coffee with the worst sensory and final scores.
Figure 2.
PC1 scores for data from nine cultivars (C) and two environments (A), as a function of the attributes and the final sensory score. C1 = Pau Brasil MG1; C2 = Paraíso MGH419-1; C3 = Sacramento; C4 = Araponga MG1; C5 = Oeiras MG6851; C6 = Catigua MG1; C7 = Catigua MG2; C8 = Topázio MG1190; and C9 = Bourbon Amarelo; A1 = Patrocinio, A2 = Lavras.
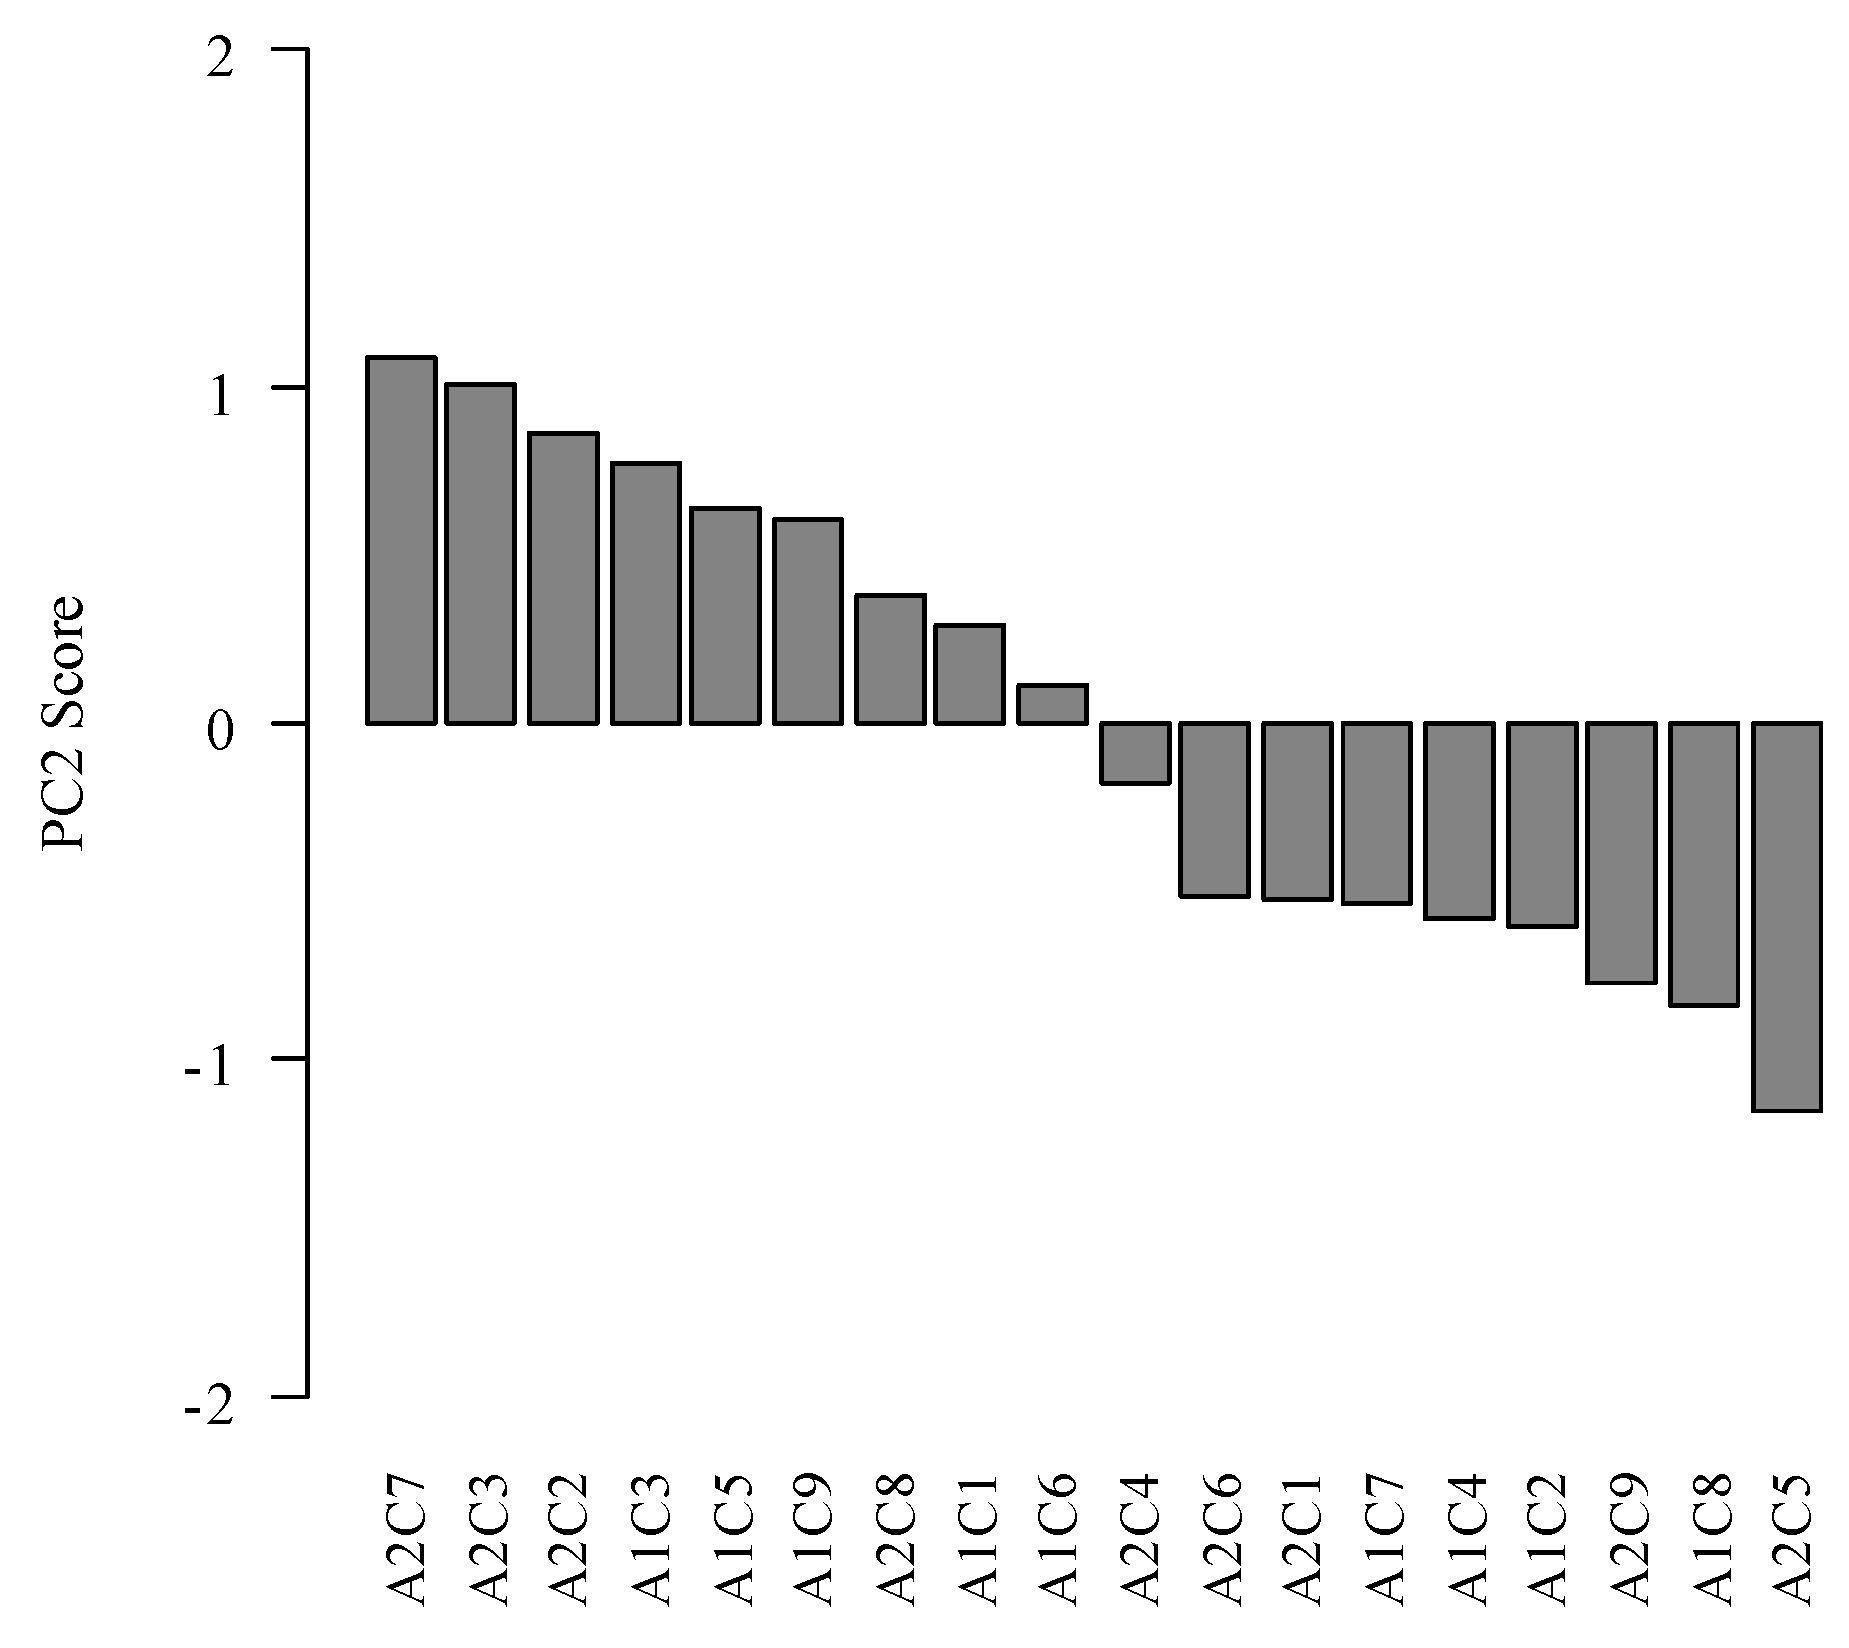
The second principal component can be viewed as a comparison of fragrance and acidity scores with the flavor and body scores, because the correlations between these attributes has shown opposite magnitudes and signals. This means that high scores of the first pair imply low scores for the second pair, according to the adjusted coefficients of the second major component (
Table 3 and
Figure 3). Thus, coffees which received similar scores for all four parameters have scores near zero and can be described as coffees with balanced scores. The A1C6 coffees (Catigua MG1/Patrocinio) and A2C4 (Araponga MG1/Lavras) have this characteristic. The A2C7 coffee (Catigua MG2/Lavras) had high values for flavor and body while the A2C5 coffee (Oeiras MG6851/Lavras) showed higher values for the fragrance and acidity attributes (
Figure 3).
Figure 3.
Scores of PC2 for data from nine cultivars (C) and two environments (A), as a function of the attributes and the final sensory score. C1 = Pau Brasil MG1; C2 = Paraíso MGH419-1; C3 = Sacramento; C4 = Araponga MG1; C5 = Oeiras MG6851; C6 = Catigua MG1; C7 = Catigua MG2; C8 = Topázio MG1190; and C9 = Bourbon Amarelo; A1 = Patrocinio, A2 = Lavras.
The cultivar A2C7 (Catigua MG2/Lavras) was described by the three judges as a great coffee, sweet, pleasant, with a sweet caramel aroma, and slight acidity with creamy and velvety body, very sweet fruity flavor, reminiscent of honey and dried fruit. The cultivar A2C4 (Araponga MG1/Lavras) was described as a balanced coffee with floral aromas, lively acidic, and sweet with a soft, velvety body and caramel and milk chocolate flavor.
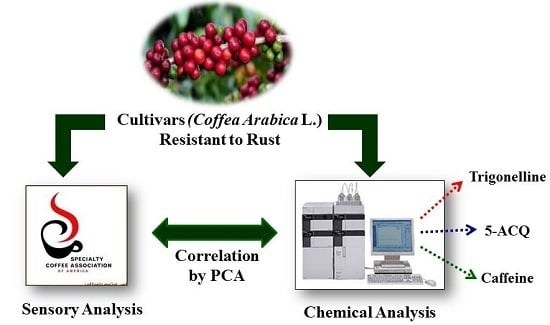
3.2. Sensory and Chemical Analysis
As a next step, this work aimed to relate sensory attributes with chemical characteristics. Thus, it has proceeded to principal component analysis by adding other variables related to bioactive compound results for coffee types analyzed.
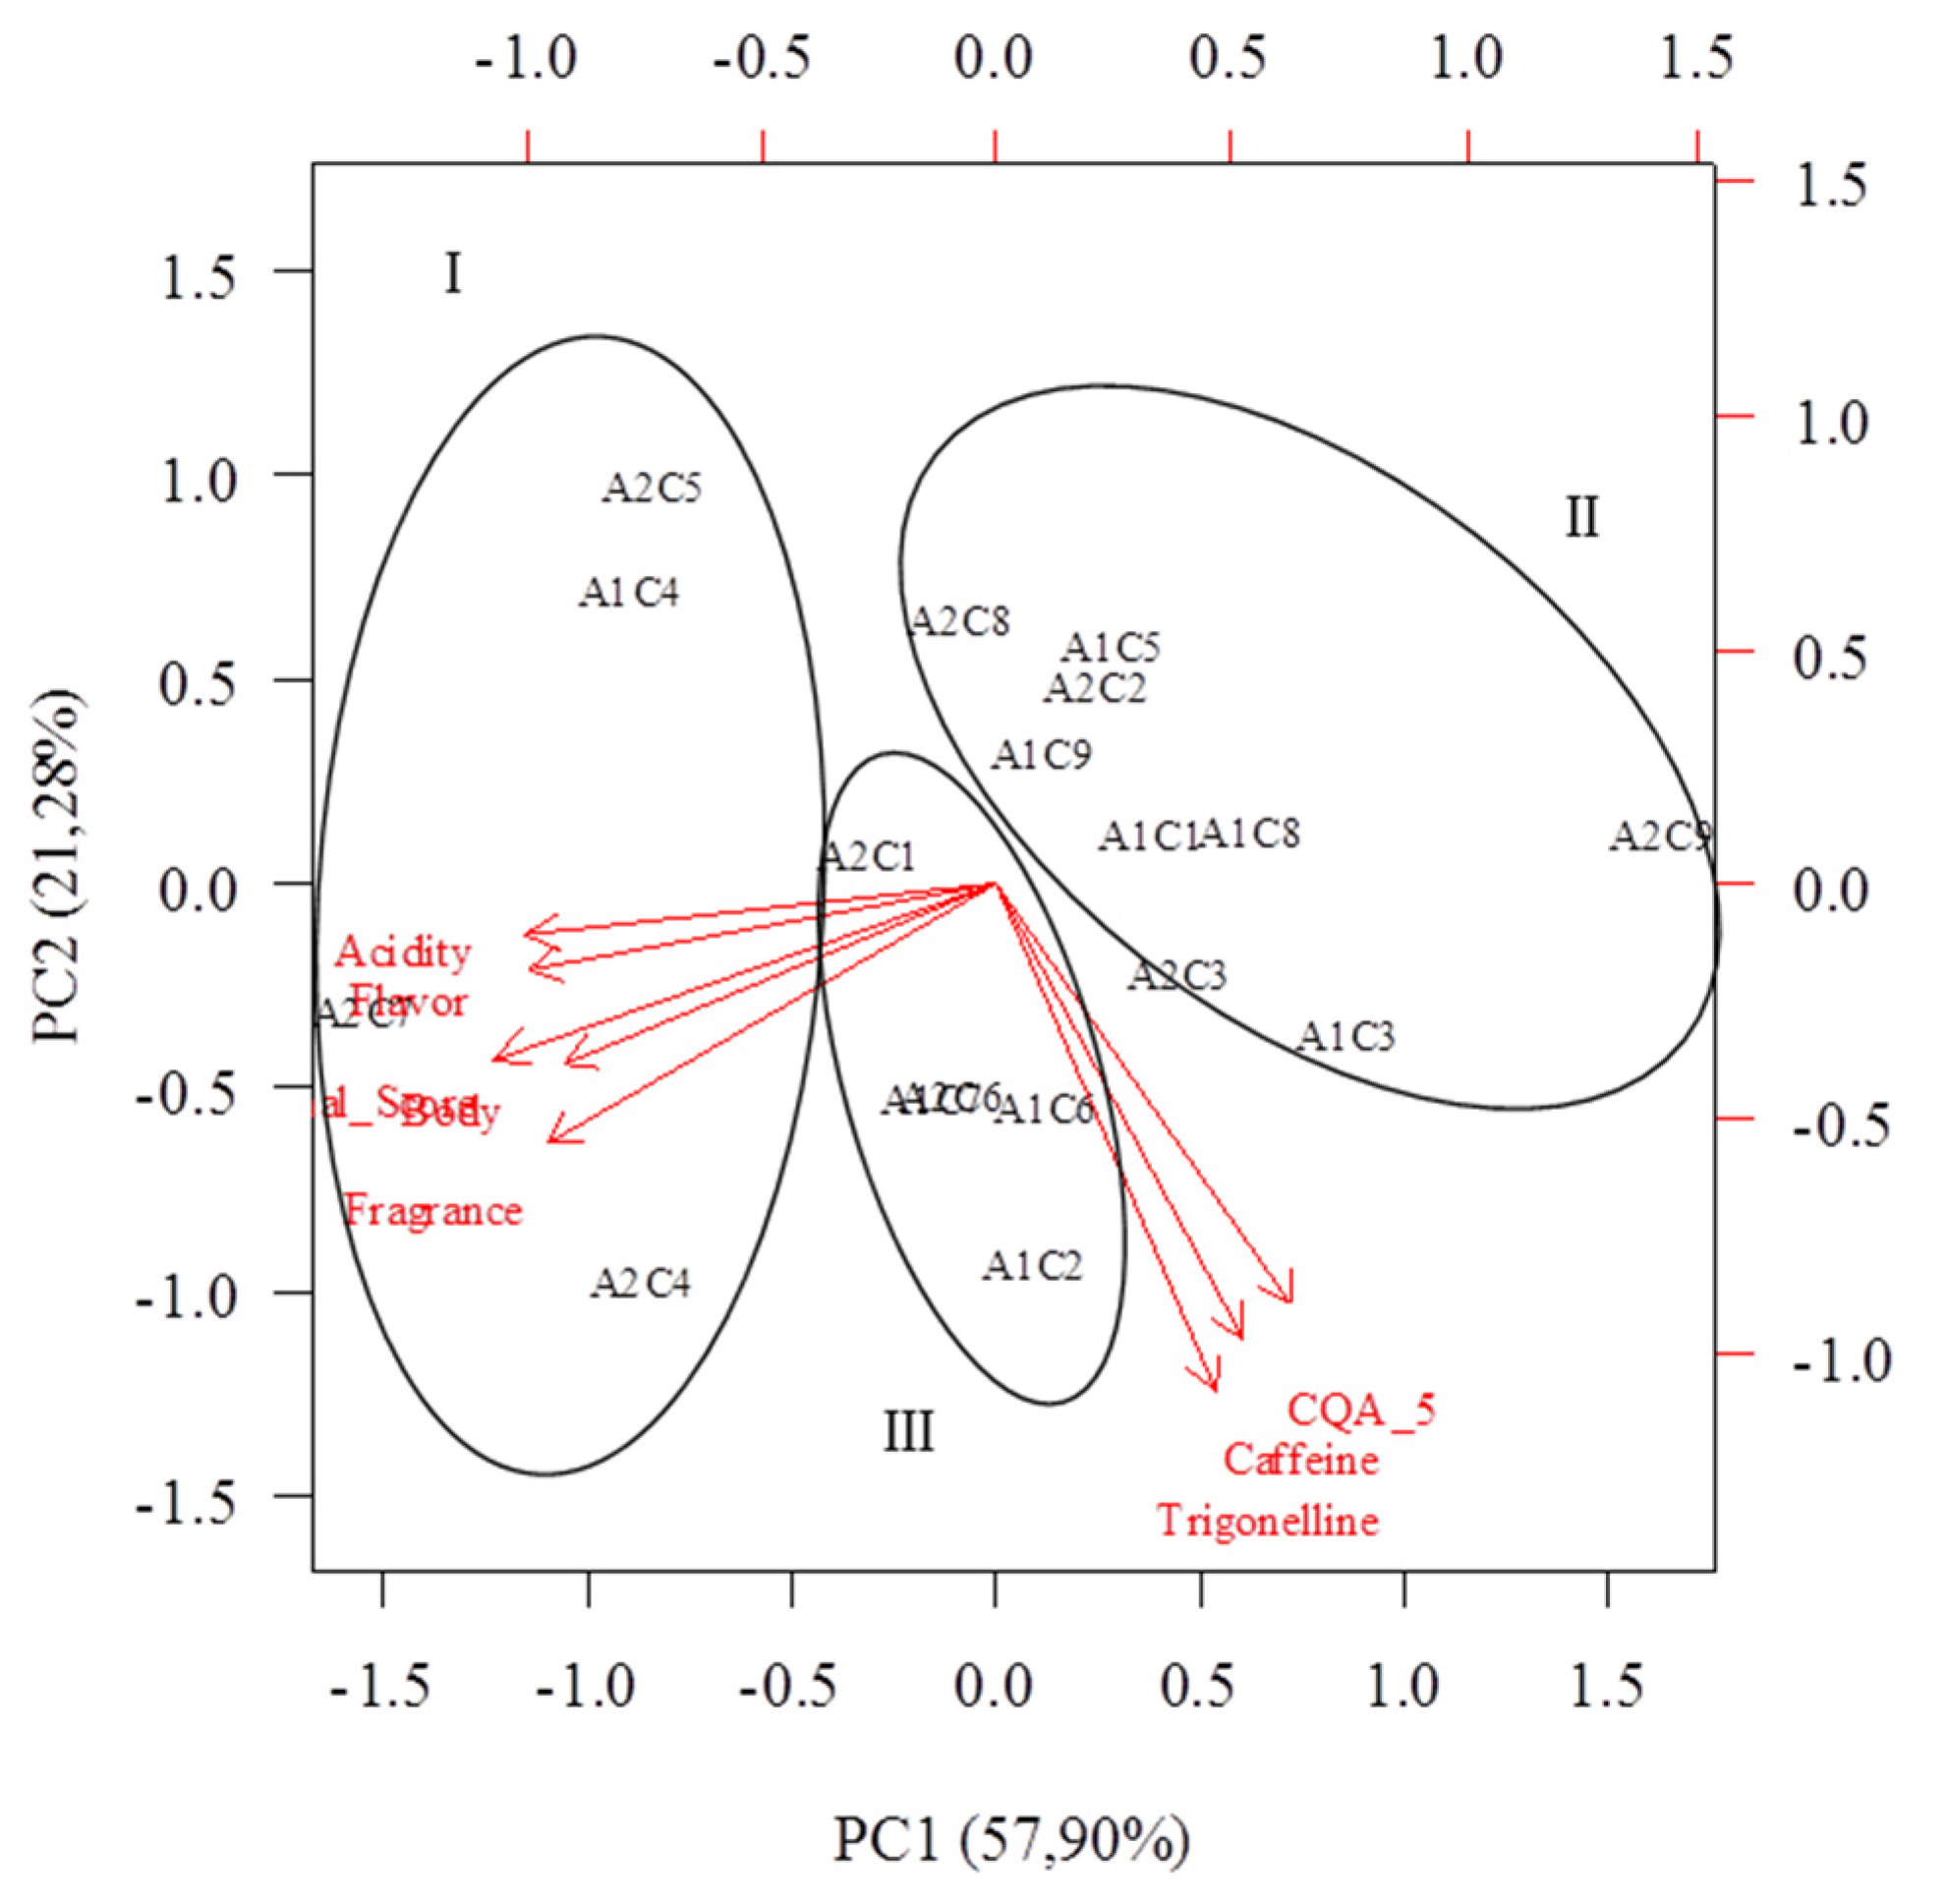
The first principal component suggests similarity between points, forming three distinct cultivar and environment groups (
Figure 4). The first group (I), with points allocated in the left area of the biplot (A1C4, A2C4, A2C5, and A2C7); the second group (II) with the points allocated in the right areas of the biplot (A1C1, A1C3, A2C3, A1C5, A1C8, A2C8, A1C9, A2C9, and A2C2) and a third allocated group in central area (A2C1, A1C2, A1C6 , A2C6, and A1C7).
The principal component analysis shows that there was counter correlation between the sensory attributes and final sensory score with bioactive compounds caffeine, trigonelline, and 5-CQA. The coffees placed in Group I correlated better with the sensory attributes and final sensory score, and coffees placed in Group III showed intermediary correlation with both parameters. However, the coffees belonging to Group II did not show good correlation with the two parameters evaluated in this study.
Figure 4.
Biplot of the first two axes of the principal component analysis for data from nine cultivars (C) and two environments (A), as a function of the attributes and the final sensory score and of caffeine, trigonelline and 5-CQA.C1 = Pau Brasil MG1; C2 = Paraíso MGH419-1; C3 = Sacramento; C4 = Araponga MG1; C5 = Oeiras MG6851; C6 = Catigua MG1; C7 = Catigua MG2; C8 = Topázio MG1190; and C9 = Bourbon Amarelo; A1 = Patrocinio, A2 = Lavras.
Avelino
et al. [
20], in studies of quality coffees of two Costa Rica
terroirs also report, from the principal component analysis, that it is not possible to correlate these chemical compounds with sensory attributes, and perhaps other chemical compounds, such as amino acids and proteins, would be better related to the attributes in question. Corroborating with the results observed, Franca, Mendonça, and Oliveira [
21], analyzing the sensory quality of coffee drinks and Bertrand
et al. [
15], studying different varieties of
C. arabica with bioactive compounds, also found no significant relationship between trigonelline and 5-CQA levels and coffee quality. Barbosa
et al. (2012) found a negative correlation of caffeine, trigonelline, and 5-CQA, especially the 5-CQA, with the drink quality in work with coffees in the state of Minas Gerais.
Table 5.
Descriptive statistics and correlations between the parameters evaluated (final note, sensory attributes, and bioactive compounds) with the first two main components and the respective coefficients for each parameter with the main component.
Table 5.
Descriptive statistics and correlations between the parameters evaluated (final note, sensory attributes, and bioactive compounds) with the first two main components and the respective coefficients for each parameter with the main component.
| Parameters | Mean | Standard Deviation | PC1 | PC2 |
|---|
| Coefficients | Correlations * | Coefficients | Correlations * |
|---|
| Fragrance | 7.833 | 0.262 | −0.398 | −0.8565 | −0.293 | −0.3822 |
| Flavor | 8.023 | 0.284 | −0.415 | −0.8936 | 0.000 | −0.1267 |
| Acidity | 7.611 | 0.243 | −0.417 | −0.8972 | 0.000 | −0.0753 |
| Body | 7.977 | 0.133 | −0.383 | −0.8240 | −0.202 | −0.2639 |
| Final Score | 83.68 | 1.517 | −0.444 | −0.9558 | −0.197 | −0.2577 |
| Trigonelline | 1.573 | 0.171 | 0.193 | 0.4160 | −0.574 | −0.7487 |
| 5-CQA | 4.264 | 0.829 | 0.260 | 0.5596 | −0.476 | −0.6212 |
| Caffeine | 1.355 | 0.160 | 0.216 | 0.4650 | −0.515 | −0.6726 |
The correlations of each characteristic (PC1) and chemical (PC2) are negative (
Table 5), indicating that high values of these parameters imply low values of the predicted scores. In the same way that has been seen in sensory analysis, the final score presented the highest standard deviation and high correlation between another sensory attribute. However, the sensory attributes presented poor correlation with bioactive compounds (
Table 6) and high correlation with the second principal component (
Table 5). As in the first case, the first component is viewed as a quality coffee indicator according to its sensorial attributes and the second component is viewed as a chemical compounds coffee indicator.
Table 6.
Correlations between each parameter assessed (final score, sensory attributes and bioactive compounds) and results of the Student’s t-test that population correlation is different from zero.
Table 6.
Correlations between each parameter assessed (final score, sensory attributes and bioactive compounds) and results of the Student’s t-test that population correlation is different from zero.
| Parameters | Fragrance | Flavor | Acidity | Body | Final Score | Trigonelline | 5-CQA | Caffeine |
|---|
| Fragrance | 1.000 | 0724 * | 0.849* | 0.701 * | 0.915 * | −0.057 | −0.331 | −0.089 |
| Flavor | 0.724 * | 1.000 | 0.690* | 0.823 * | 0.881 * | −0.266 | −0.308 | −0.436 |
| Acidity | 0.845 * | 0.690 * | 1.000 | 0.614 * | 0.901 * | −0.339 | −0.476* | −0.303 |
| Body | 0.701 * | 0.823 * | 0.614 * | 1.000 | 0.821 * | −0.187 | −0.259 | −0.214 |
| Final Score | 0.915 * | 0.881 * | 0.901 * | 0.821 * | 1.000 | −0.208 | −0.358 | −0.278 |
| Trigonelline | −0.057 | −0.266 | −0.339 | −0.187 | −0.208 | 1.000 | 0.589 * | 0.511 * |
| 5-CQA | −0.331 | −0.308 | −0.476* | −0.259 | −0.358 | 0.589 * | 1.000 | 0.531 * |
| Caffeine | −0.089 | −0.436 | −0.303 | −0.214 | −0.278 | 0.511 * | 0.531 * | 1.000 |
Using the correlation matrix in
Table 6, it has showed that the null hypothesis that the correlation matrix is an identity was rejected (
p < 0.05).
It can be seen that sometimes coffees with high sensory scores exhibited lower, as well higher, values of these chemical compounds (
Figure 5 and
Figure 6). For example, cultivar C4 (Araponga MG1) exhibits this behavior, and when combined with environment A1 it has lower values of these chemicals and in the environment A2, higher values. However, for the two environments studied it presents higher sensory scores. This behavior was also observed for the C2 cultivar (Paraíso MGH419-1); however, in both environments evaluated, the sensory scores were lower, which denotes the interaction between genes and the environment.
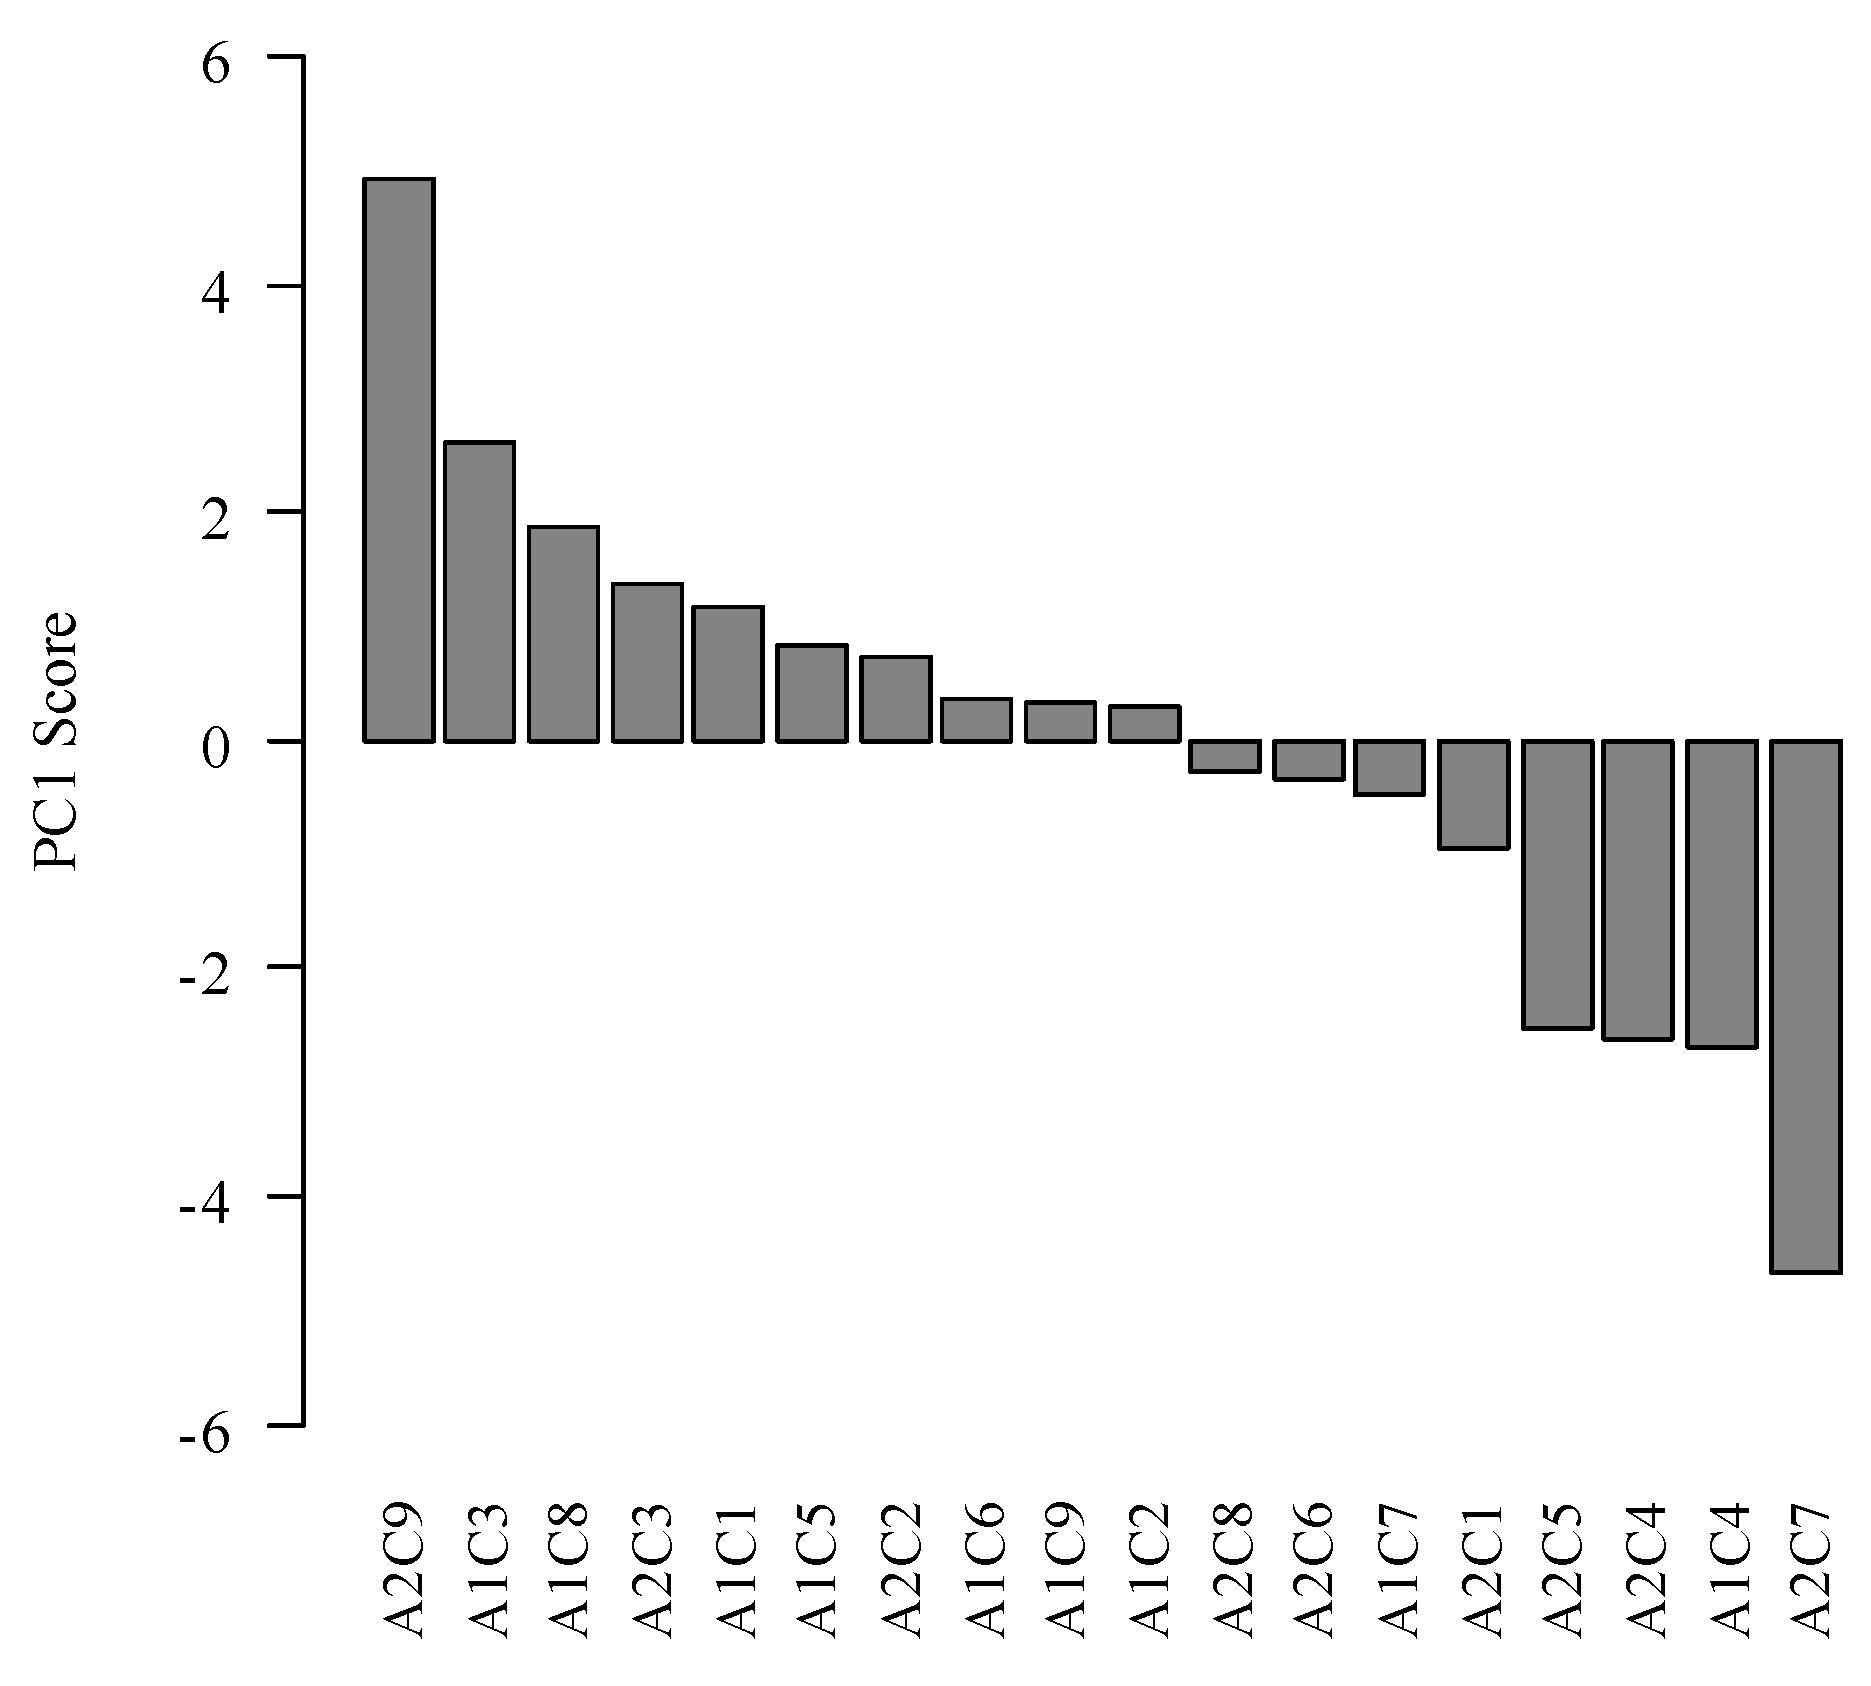
Figure 5.
PC1 scores for data from nine cultivars (C) and two environments (A), as a function of the sensory attributes and the final sensory score and of caffeine, trigonelline, and 5-CQA. C1 = Pau Brasil MG1; C2 = Paraíso MGH419-1; C3 = Sacramento; C4 = Araponga MG1; C5 = Oeiras MG6851; C6 = Catigua MG1; C7 = Catigua MG2; C8 = Topázio MG1190; and C9 = Bourbon Amarelo; A1 = Patrocinio, A2 = Lavras.
Figure 6.
Scores of PC2 for data from nine cultivars (C) and two environments (A), as a function of the sensory attributes and the final sensory score and of caffeine, trigonelline, and 5-CQA. C1 = Pau Brasil MG1; C2 = Paraíso MGH419-1; C3 = Sacramento; C4 = Araponga MG1; C5 = Oeiras MG6851; C6 = Catigua MG1; C7 = Catigua MG2; C8 = Topázio MG1190; and C9 = Bourbon Amarelo; A1 = Patrocinio, A2 = Lavras.
The cultivar C7 (Catigua MG2), identified as one of the cultivars with better characteristics for the production of specialty coffees from both environments, showed higher values (negative direction of the graph) for the compounds caffeine, trigonelline, and 5-CQA, and higher values for the sensory attributes and final sensory score (
Figure 5 and
Figure 6), indicating the possibility of a positive relation between the variables studied.
Farah
et al. [
22] reported the relationship between the quality of the beverage and trigonelline content of the raw fruit. The authors found that a reduction of trigonelline levels resulted in reduced beverage quality. However, Figueiredo
et al. [
12] report that the relationship between sensory quality of coffees and trigonelline, caffeine, and 5-CQA content is still quite contradictory and that further studies on these compounds and their relation with cup quality are required.
It was also observed that there was a distancing between points when considering the variables jointly, i.e., interactions evaluated did not show good similarity. The A1C9 and A2C9 points, A1C8 and A2C8, A1C3 and A2C3 (Group II), and A1C4 and A2C4 points (Group I) presented this characteristic, since even with being allocated the same groups, they remained far apart. Therefore, these data indicate that the chemical compounds caffeine, trigonelline, and 5-CQA were appropriate discriminators of the environments evaluated, but were not been able to distinguish among genotypes.
As observed in the present study, the caffeine, trigonelline, and chlorogenic acid content allowed the discrimination of Santa Maria de Dota and Orosi environments in Costa Rica [
20] and Naranjal, Paraguaicito, and Rosário in Colombia [
23].


