Article

The Role of Visual Impressions in Perceived Naturalness and Natural Wine Categorization

1
Department of Business Administration, Faculty of Commerce, Seinan Gakuin University, 6-2-92 Nishijin, Sawara-ku, Fukuoka 814-8511, Japan
2
Department of Management and Business, Faculty of Humanity-Oriented Science and Engineering, Kindai University, 11-6 Kayanomori, Iizuka 820-8555, Japan
Beverages 2026, 12(9), 103; https://doi.org/10.3390/beverages12090103
Submission received: 30 July 2026 / Revised: 27 August 2026 / Accepted: 28 August 2026 / Published: 1 September 2026

Highlights

What are the main findings?
  • Wine-label impressions were summarized by Classicness and Delicateness.
  • Perceived naturalness was associated with higher Delicateness.
  • Natural wine categorization was linked to lower Classicness, but evidence was preliminary.
What are the implications of the main findings?
  • Naturalness perception may arise from wine-label impressions.
  • Natural wine categorization may involve more than formal definitions.

Abstract

Natural wine is a highly contested category lacking universally accepted definitions and certification standards, yet consumers and wine professionals routinely judge whether a wine appears to be a natural wine. This study examined how visual impressions of wine labels relate to perceived naturalness and natural wine categorization in the absence of formal natural-wine certification cues. Seven wine labels were evaluated in two studies conducted in Japan. Study 1 involved novice consumers who rated label impressions and perceived naturalness, whereas Study 2 involved experienced wine consumers and wine professionals who additionally evaluated whether each wine appeared to be a natural wine. A participant-level exploratory factor analysis conducted in Study 1 identified two perceptual dimensions of wine-label impressions, termed Classicness and Delicateness. The resulting factor structure was subsequently applied to Study 2. Across both studies, perceived naturalness showed a consistent positive association with Delicateness. In contrast, natural wine categorization was associated with lower Classicness in wine-level analyses, although this relationship was not supported by participant-level mixed-effects analyses and therefore remained exploratory. Perceived naturalness and natural wine categorization showed a weak positive association, but the relationship did not reach statistical significance. These findings suggest that wine-label impressions contribute to perceived naturalness and provide preliminary evidence that they may also contribute to natural wine categorization. More broadly, the results indicate that perceptions of naturalness and natural wine categorization may be shaped not only by technical criteria and formal definitions but also by shared perceptual expectations and category representations.

1. Introduction

Natural wine has attracted increasing attention from consumers, wine professionals, researchers, and food-service operators over the past two decades [1,2,3]. This growing interest has been attributed in part to the association of natural wine with sustainability, environmental responsibility, authenticity, and minimal-intervention production practices [3].
Natural wine is commonly defined as wine produced from organically or biodynamically managed grapes using minimal-intervention winemaking practices, such as spontaneous fermentation with native yeasts and limited use of additives, including added sulfites, in the cellar [4]. Such practices are often accompanied by restrictions on technological interventions, including processes such as filtration, stabilization, clarification, and reverse osmosis [4]. However, despite broad agreement regarding these general principles, no universally accepted definition of natural wine exists, and proposed standards vary across countries, organizations, and producer groups [2,4]. Natural wine certification systems remain fragmented and their legitimacy is frequently debated within the natural wine community itself [2]. Moreover, several producers commonly associated with the natural wine movement have expressed reservations about formal certification schemes and instead emphasize broader commitments relating to viticulture, vinification, producer autonomy, and alternative market relations [4,5]. As a result, natural wine is often understood not merely as a technical production category but also as a socio-cultural movement and an expression of particular values and philosophies [4,5].
Yet despite these definitional uncertainties, consumers and wine professionals routinely make judgements about whether a wine appears to be a natural wine. Previous research suggests that people nevertheless develop relatively coherent representations of natural wine and related categories. Consumers commonly associate natural wine with concepts such as naturalness, health, authenticity, environmental friendliness, and minimal intervention, whereas wine professionals often refer to production practices, technical characteristics, and wine faults [6,7,8]. These findings suggest that even in the absence of universally accepted definitions, individuals may rely on shared beliefs and representations when evaluating whether a wine belongs to a particular category.
This observation raises an important question. If natural wine cannot be reliably identified through universally accepted definitions or certification systems, on what basis do people nevertheless infer that a wine belongs to this category? Understanding the perceptual basis of such judgements therefore represents an important challenge for research on wine authenticity and consumer perception.
Wine provides a particularly relevant context for examining this issue because it is characterized by substantial information asymmetry. Many attributes relevant to wine quality and authenticity, including production methods and sensory properties, cannot be directly verified by consumers before purchase. Consequently, consumers often experience uncertainty and rely on extrinsic cues to reduce perceived risk and infer product characteristics [2,9]. Among these cues, wine labels constitute one of the most important sources of information available at the point of purchase [9]. Previous research has shown that consumers frequently consult wine labels when making purchasing decisions. For example, Charters et al. [10] reported that more than half of respondents regularly read wine back labels when selecting wines. Similarly, Mueller et al. [9] argued that front and back labels represent one of the principal communication channels through which wineries convey information about wines to consumers. Wine labels therefore function not only as sources of factual information but also as cues through which consumers infer quality, style, authenticity, and expected consumption experiences.
Existing research on wine labeling has primarily focused on the effects of explicit information presented on labels. Studies have examined how consumers respond to sensory descriptions, production-method information, ingredient disclosures, environmental claims, country- and region-of-origin information, and certification cues [1,2,9,10,11]. In the context of sustainable and natural wine, consumers’ willingness to pay has been linked to information about production methods, ingredient content, and sensory characteristics. Galati et al. [11] found that consumers willing to pay a premium for natural wine attached particular importance to information on ingredients, production techniques, and sensory attributes displayed on labels. Similarly, Migliore et al. [12] reported that positive attitudes toward healthy eating and environmental protection were associated with a greater willingness to pay for natural wine. More broadly, research on natural, organic, and sustainable wines has emphasized the role of certifications, sustainability claims, environmental information, and production-related disclosures in shaping consumer evaluations [1,2,11,13]. Recent evidence further suggests that consumers often do not clearly distinguish between natural and organic wine categories, despite substantial differences in certification requirements and regulatory oversight [14,15].
Collectively, these studies have substantially advanced understanding of how consumers respond to what labels explicitly communicate. However, they have paid considerably less attention to the possibility that consumers may also infer naturalness and authenticity from the overall visual impressions evoked by a label itself, even in the absence of explicit information.
Beyond the wine literature, research in the broader food domain suggests that perceptions of naturalness are often inferential rather than direct. Evans et al. [16] demonstrated that consumers perceived foods as less natural when they involved greater processing, particularly when transformations were described as chemical rather than physical. They also found that products described using E-number designations were perceived as less natural than equivalent products described using common ingredient names. These findings suggest that naturalness judgements are not based solely on objective product characteristics but are instead constructed from cues that consumers associate with perceived production processes and human intervention.
More recent research indicates that visual design characteristics themselves can shape such inferences. Marckhgott and Kamleitner [17] found that food products presented in matte packaging were perceived as more natural than identical products presented in glossy packaging, despite the packaging surface having no direct relationship to product composition. Importantly, this effect emerged primarily for products otherwise perceived as relatively artificial, suggesting that consumers rely on visual cues particularly when stronger naturalness signals are absent. Increased perceived naturalness subsequently enhanced expected tastiness and purchase intention. Similarly, recent evidence indicates that minimalist food packaging can increase perceived naturalness by fostering inferences regarding product uniqueness, production methods, and expected taste quality [18]. Together, these findings suggest that consumers frequently use visual heuristics as signals of naturalness and authenticity, even when explicit information about products is limited.
However, these insights have been developed almost exclusively in research on food products and food packaging [16,17,18]. Whether similar mechanisms operate in wine remains largely unknown. This question may be especially important for natural wine because the category itself lacks universally accepted boundaries and authenticity markers [1,2]. In such circumstances, consumers and professionals may be particularly likely to rely on visual impressions when forming category judgements. Yet, to our knowledge, no study has directly examined which visual impressions make a wine appear to be a natural wine.
Importantly, the existing literature has focused primarily on perceived naturalness itself [16,17,18]. Although visual cues have been shown to influence naturalness judgements, far less attention has been paid to whether these same visual cues also influence category-based judgements. In the context of wine, perceiving a wine as natural and categorizing it as a natural wine may constitute related but distinct forms of judgement. A wine may appear natural without necessarily being categorized as a natural wine, and conversely, a wine may be categorized as a natural wine because it conforms to visual conventions associated with the category rather than because it appears intrinsically natural. Understanding the relationship between these judgements may therefore contribute not only to research on naturalness perception but also to discussions of authenticity and category recognition in domains where categorical boundaries remain contested [1,2].
The present research had two objectives. First, Study 1 examined which dimensions of wine-label impressions are associated with perceived naturalness among young adults with little wine-consumption experience. Importantly, none of the wine labels used in the present research displayed formal certification marks relating to organic production, biodynamic practices, natural wine, or sustainability. Participants therefore could not rely on formal certification-based authenticity signals and instead formed judgements based on the visual and textual information available on the labels.
Second, Study 2 provided an exploratory examination of the relationship between perceived naturalness and natural wine categorization among experienced wine consumers and wine professionals. Specifically, Study 2 investigated whether these judgements were associated with similar or different patterns of wine-label impressions and sought preliminary evidence regarding the label-impression dimensions associated with natural wine categorization. In doing so, the study also contributes to ongoing discussions concerning authenticity and legitimacy in a category whose boundaries remain contested.

2. Materials and Methods

2.1. Participants

2.1.1. Study 1

Study 1 involved 38 undergraduate students recruited from the authors’ university in Japan. Participants had a mean age of 20.79 years (SD = 2.63), and the sample comprised 30 males (78.9%) and 8 females (21.1%).
Participants reported very limited experience with wine consumption. Approximately three-quarters of the sample (76.3%) reported never drinking wine, while 13.2% reported drinking wine once a month and 10.5% reported drinking wine several times a month. No participant reported drinking wine more frequently than several times a month. Given their limited wine consumption experience, this sample was treated as representing novice consumers.

2.1.2. Study 2

Study 2 involved 11 experienced wine consumers recruited through wine-related professional networks. Participants had a mean age of 35.73 years (SD = 3.82), and the sample comprised 7 males (63.6%) and 4 females (36.4%).
Participants reported frequent wine consumption, with 5 participants drinking wine daily, 4 drinking wine several times per week, and 2 drinking wine several times per month. Ten participants held at least one wine-related qualification, including Japan Sommelier Association (J.S.A.) Sommelier, J.S.A. Wine Expert, and WSET Level 3 certifications. In addition, nine participants were employed in the wine industry, primarily in hospitality/service and wine sales.
Given their high level of involvement with wine, professional qualifications, and industry experience, this sample was treated as representing experienced wine consumers and wine professionals.

2.2. Stimuli

Seven images of commercially available wine bottles showing their front labels were selected as experimental stimuli. The stimulus set was designed to represent a broad range of visual and informational characteristics, including differences in the amount of textual information, the presence of illustrations and symbolic elements, and the prominence of geographic, varietal, and vintage information. The visual and informational elements available in each stimulus are summarized in Table 1.
The labels were selected to include diverse visual styles and wine-production contexts rather than to represent predefined categories of natural, organic, or conventional wines. Accordingly, the stimuli included labels ranging from text-centered and highly formal designs to illustration-based and minimalist designs. The study was not intended to evaluate whether participants could accurately identify natural wines. Instead, it examined how impressions formed from the visual and textual information available on wine labels were associated with perceived naturalness and natural wine categorization.
Only the front side of the wine bottles was presented to participants. Back labels were not shown. Detailed information regarding the commercial wines used as stimuli is provided in Table A1.
Images of the wine bottles were standardized before presentation. All stimuli were displayed against a uniform gray background and positioned centrally within the image frame. Although the original bottles differed slightly in shape and proportions, image sizes were adjusted so that the bottles occupied approximately the same vertical space across stimuli.

2.3. Procedure

2.3.1. Impression Ratings

In both Studies 1 and 2, participants completed the experiment individually using a 23.8-inch touchscreen monitor (Dell P2424HT (Dell Inc., Round Rock, TX, USA); 1920 × 1080 pixels, IPS panel, 99% sRGB color coverage), which was used for both stimulus presentation and response collection. Participants were seated approximately 50–60 cm from the display. Wine-bottle images were presented at a size that occupied most of the display height while preserving their original aspect ratio, allowing the labels and bottle shapes to remain clearly visible throughout the evaluation task and approximating the visual experience of viewing an actual wine bottle at a typical viewing distance.
Each evaluation page displayed a single wine-bottle image at the top of the screen, followed by the evaluation items. Participants viewed the image while completing the rating tasks described below. After completing the ratings, they proceeded to the next page, where a different wine-bottle image was presented. The presentation order of the stimuli was randomized across participants.
Participants evaluated their overall impressions using 13 semantic differential (SD) scales [19,20]. The scale pairs were Subdued–Gorgeous, Cloudy–Pure, Soft–Hard, Cheap–Luxury, Light–Heavy, Delicate–Bold, Childlike–Grownup, Light-bodied–Dense, Casual–Formal, Young–Old, Masculine–Feminine, Rough–Smooth, and Cheerful–Gloomy. Participants completed all evaluations using the original Japanese expressions. Each impression item was evaluated on a 6-point scale, with higher scores corresponding to the adjective presented on the right side of the scale.
The SD scales were adopted from a previous research project conducted by the author that investigated the relationship between visual impressions evoked by typefaces and sensory impressions evoked by wine tasting. In that study, adjective pairs were selected on the basis of previous research on typeface impressions and food-design impressions and were chosen because they were applicable to both visual and wine-related stimuli. Since the present study was also concerned with visual impressions associated with wine, the same set of adjective pairs was employed to enable a comprehensive assessment of wine-label impressions.
Participants also evaluated the extent to which each wine appeared to be environmentally friendly and health conscious using a 6-point scale ranging from 1 (“strongly disagree”) to 6 (“strongly agree”). This measure was used as a proxy indicator of perceived naturalness.
In Study 1, the term “natural wine” itself was not used because the participants had relatively limited wine experience. Instead, perceived naturalness was assessed through attributes commonly associated with natural wine, namely environmental friendliness and health consciousness [1,6,12,21]. Other characteristics often associated with natural wine production, such as minimal intervention in the winemaking process and the limited use of additives, were not directly assessed because these technical aspects were unlikely to be familiar to novice consumers. Accordingly, the resulting measure should be interpreted as reflecting consumer representations associated with natural wine rather than direct evaluations of natural winemaking practices or objective indicators of natural wine production.

2.3.2. Wine Style Judgement

In Study 2, participants were additionally asked to judge the style of each wine label. Specifically, they indicated whether each wine appeared to be (a) traditional/classic, (b) modern, and/or (c) natural. Multiple responses were allowed.
For each wine label, a natural wine categorization rate was calculated as the proportion of participants who selected the “natural” category. This measure was used as an indicator of the extent to which a wine was perceived as a legitimate example of a natural wine. Because the participants in Study 2 were experienced wine consumers and wine professionals, the term “natural” was presented explicitly as a wine-style category.

2.4. Statistical Analysis

2.4.1. Dimensional Reduction in Label Impressions

To obtain a parsimonious representation of wine-label impressions, exploratory factor analysis was conducted on participant-level SD ratings obtained in Study 1 (38 participants × 7 wine labels; N = 266 observations). Prior to factor extraction, sampling adequacy was assessed using the Kaiser–Meyer–Olkin (KMO) measure and Bartlett’s test of sphericity. Inter-rater reliability was also examined using intraclass correlation coefficients (ICCs) to evaluate the consistency of participant ratings and the reliability of aggregated wine-level scores.
The analysis was performed using the minimum residual method with oblimin rotation. The number of factors was determined based on parallel analysis and interpretability. Because the purpose of the present study was to summarize wine-label impressions into a small number of interpretable dimensions for subsequent analyses, rather than to establish the latent psychological structure of the rating items, a two-factor solution was retained. Factor scores were then calculated for each observation in Study 1. The factor structure derived from Study 1 was then applied to the corresponding SD ratings in Study 2 to calculate comparable factor scores. Participant-level factor scores were averaged for each wine label to obtain wine-level scores for the extracted impression dimensions. These wine-level scores were used in the descriptive, correlation, and regression analyses reported below.

2.4.2. Correlation and Regression Analyses

Pearson correlation coefficients were calculated to examine the relationships among the extracted impression dimensions and perceived naturalness. In Studies 1 and 2, correlations between the impression dimensions and perceived naturalness were examined. In Study 2, Spearman’s rank correlation coefficients were used when examining associations involving natural wine categorization. This approach was adopted because natural wine categorization rates were derived from a small number of binary responses (0–11 participants).
To further assess the relative contributions of the extracted impression dimensions, regression analyses were conducted at the wine-label level. In both studies, perceived naturalness was regressed on the extracted impression dimensions. In Study 2, natural wine categorization was analyzed using a binomial generalized linear model based on the number of participants who categorized each wine as a natural wine relative to the total number of participants.
To address concerns regarding analyses based solely on wine-level averages, supplementary participant-level analyses were conducted using linear mixed-effects models [22]. Perceived naturalness was analyzed using linear mixed-effects models, whereas natural wine categorization was analyzed using a binomial generalized linear mixed-effects model. In all models, the extracted impression dimensions were entered as fixed effects, and random intercepts were specified for both participants and wine labels. These analyses retained participant-level observations while accounting for variability attributable to individual participants and stimuli.
All statistical analyses were conducted using R 4.5.1 [23].

3. Results

3.1. Perceptual Dimensions of Wine Labels

The participant-level SD ratings obtained in Study 1 were suitable for factor analysis, with a KMO measure of 0.87 indicating good sampling adequacy and a significant Bartlett’s test of sphericity, χ2(78) = 1192.48, p < 0.001. Parallel analysis supported the extraction of two factors. Although agreement at the individual-rater level was modest (ICC(2,1) = 0.27), the reliability of aggregated wine-label ratings was high (ICC(2,k) = 0.93, 95% CI [0.83, 0.99]). These results indicate that while individual participants differed in their evaluations, the aggregated wine-label impressions were highly reliable.
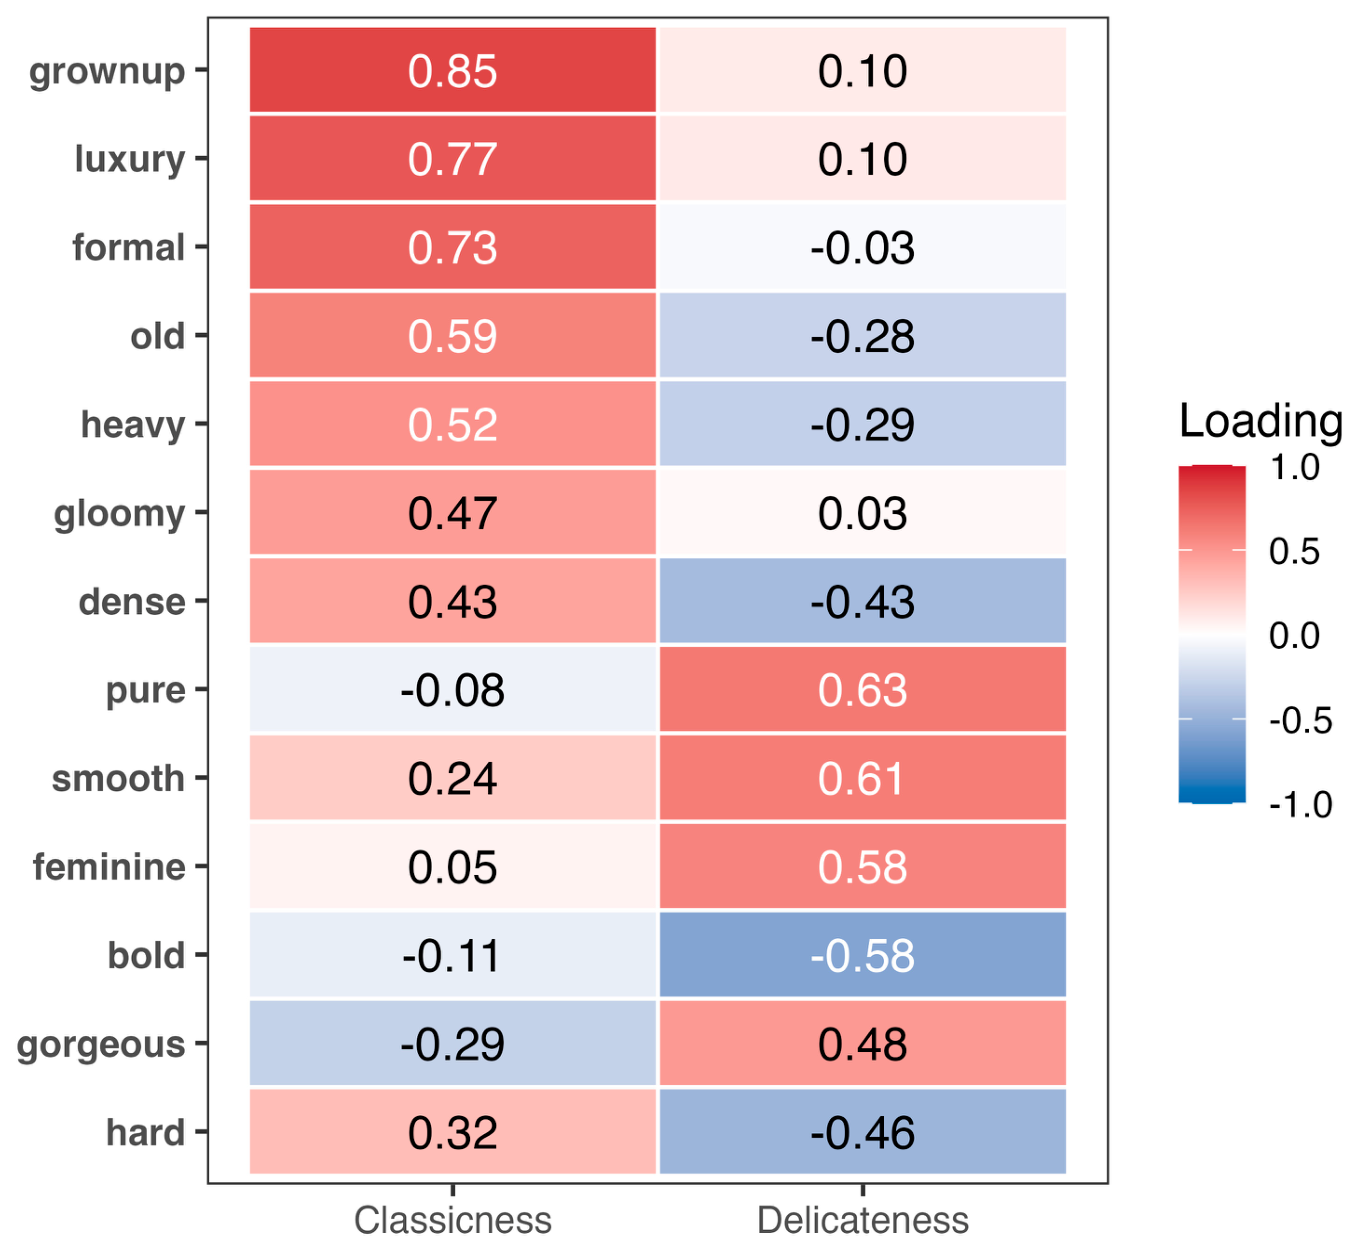
The first factor was primarily characterized by high loadings for Formal, Grownup, Luxury, and Old and was interpreted as representing a Classicness dimension. The second factor was characterized by high loadings for Pure, Smooth, and Feminine together with a negative loading for Bold and was interpreted as representing a Delicateness dimension. The pattern of factor loadings is visualized in Figure 1, and complete numerical loadings are reported in Table A2. The two-factor solution accounted for 44% of the total variance in the SD ratings and provided an interpretable summary of wine-label impressions.
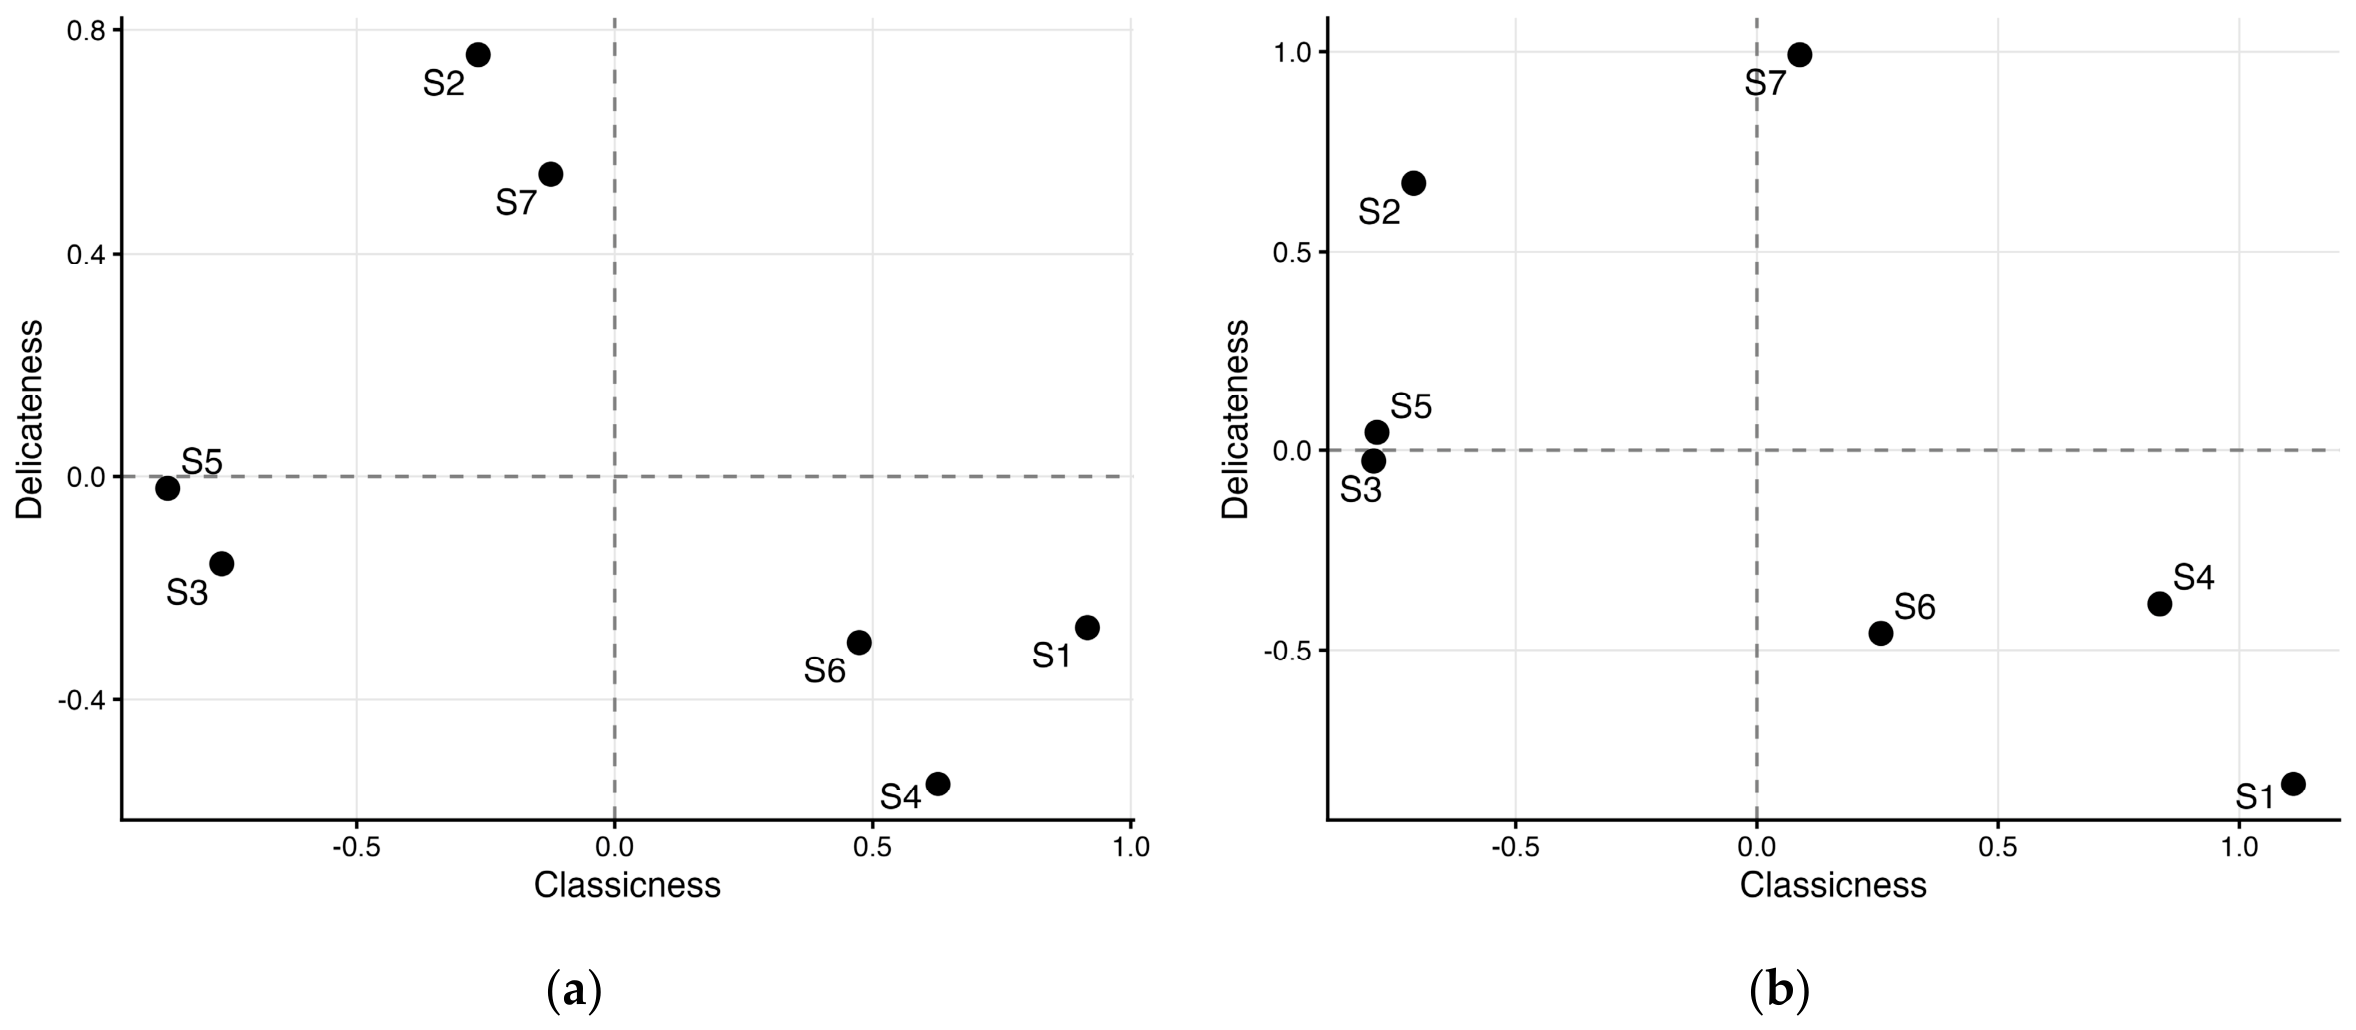
Factor scores derived from this solution were subsequently calculated for all observations in Study 1 and averaged for each wine label. The positions of the seven wine labels in this two-dimensional perceptual space are shown in Figure 2a. The same factor structure was then applied to the Study 2 ratings in order to obtain comparable scores for Classicness and Delicateness across the two studies. These factor scores were likewise averaged for each wine label, and the resulting distribution of wine labels is shown in Figure 2b. Several wine labels occupied broadly similar positions across the two studies, although some shifts in their relative locations were also observed.

3.2. Study 1: Perceived Naturalness Among Novice Consumers

3.2.1. Wine-Level Analyses

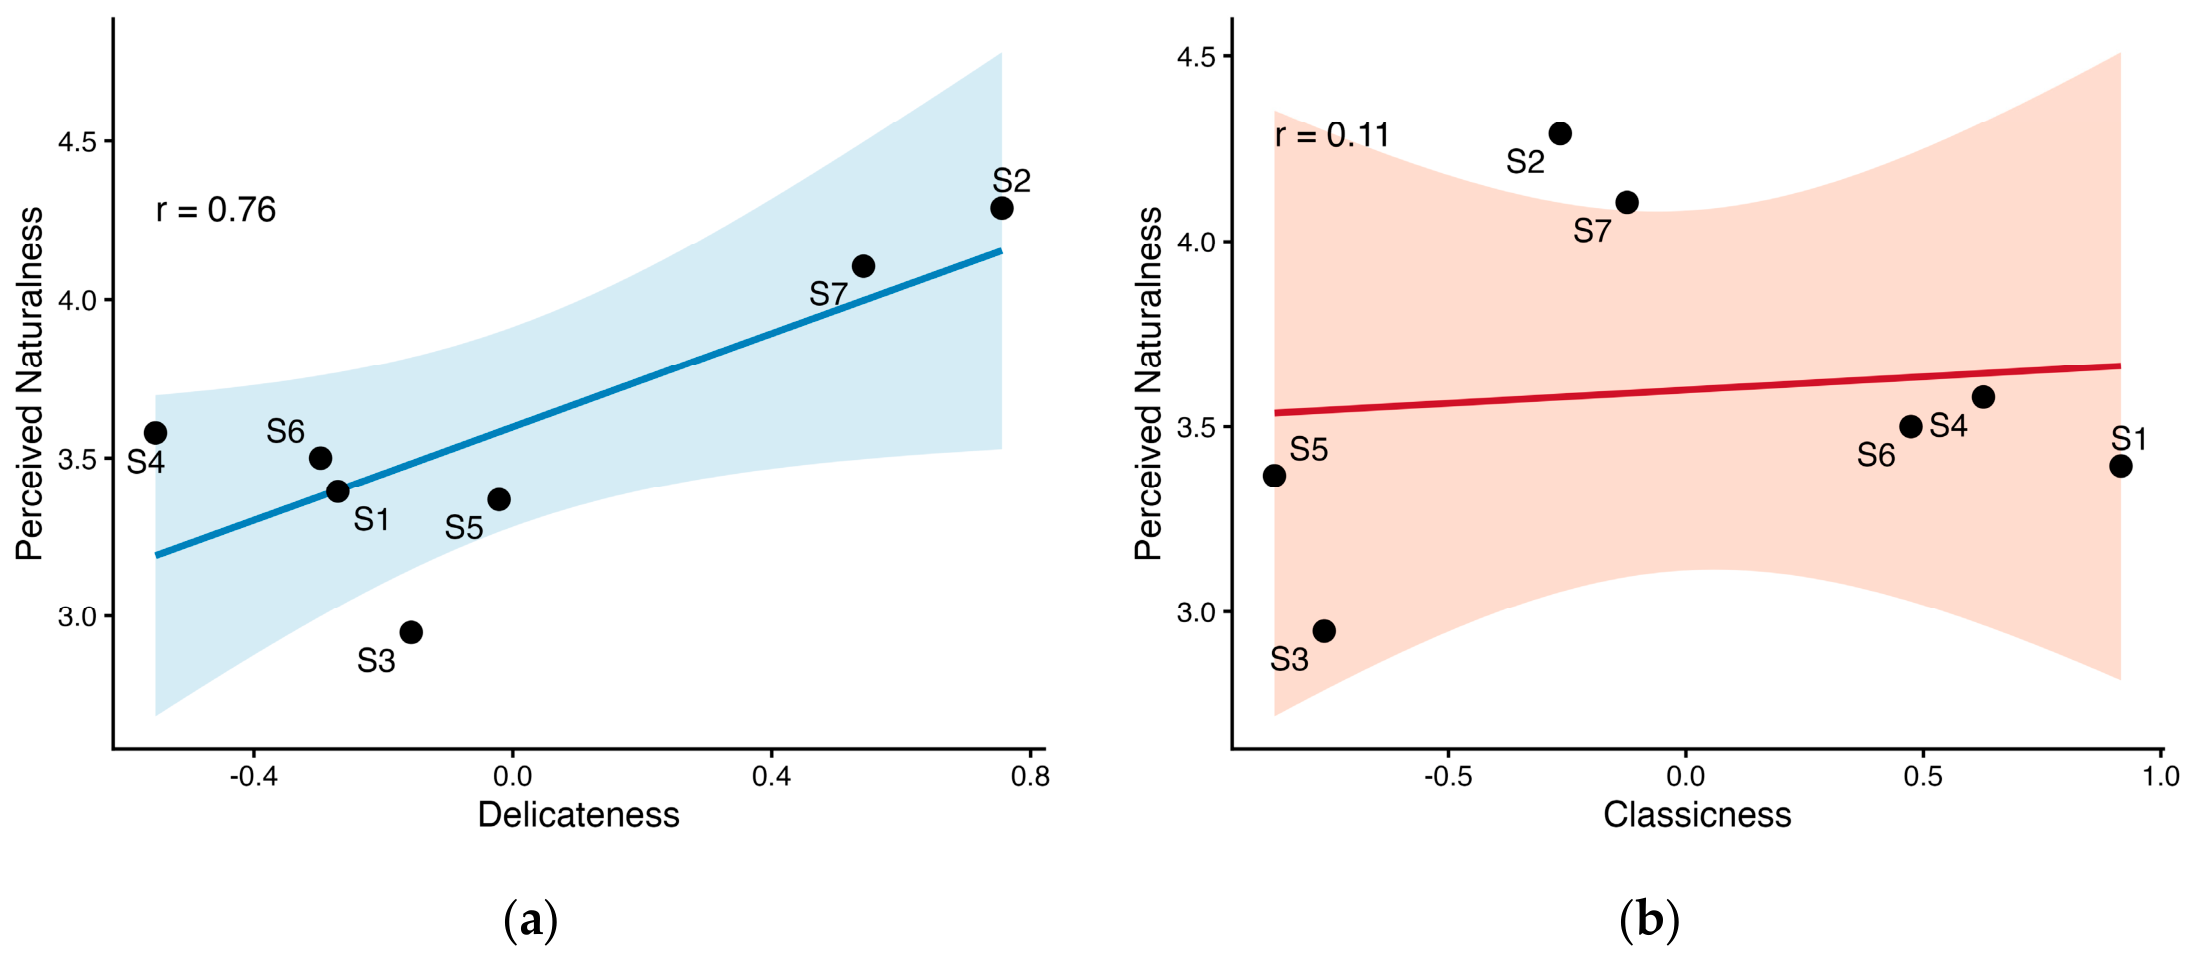
Correlation analyses revealed a strong positive association between Delicateness and perceived naturalness (r = 0.76, p = 0.046; Figure 3a). In contrast, Classicness was not significantly associated with perceived naturalness (r = 0.11, p = 0.819; Figure 3b).
To assess the relative contributions of the two impression dimensions, a multiple regression analysis was performed (Table 2). The model was significant, F(2, 4) = 9.34, p = 0.031, explaining 82.4% of the variance in perceived naturalness (R2 = 0.824). Delicateness positively predicted perceived naturalness (B = 0.97, p = 0.013), whereas Classicness showed a positive but non-significant contribution to the model (B = 0.36, p = 0.080).
Taken together, these wine-level analyses indicated that perceived naturalness among novice consumers was more strongly associated with the Delicateness dimension than with the Classicness dimension of wine-label impressions.
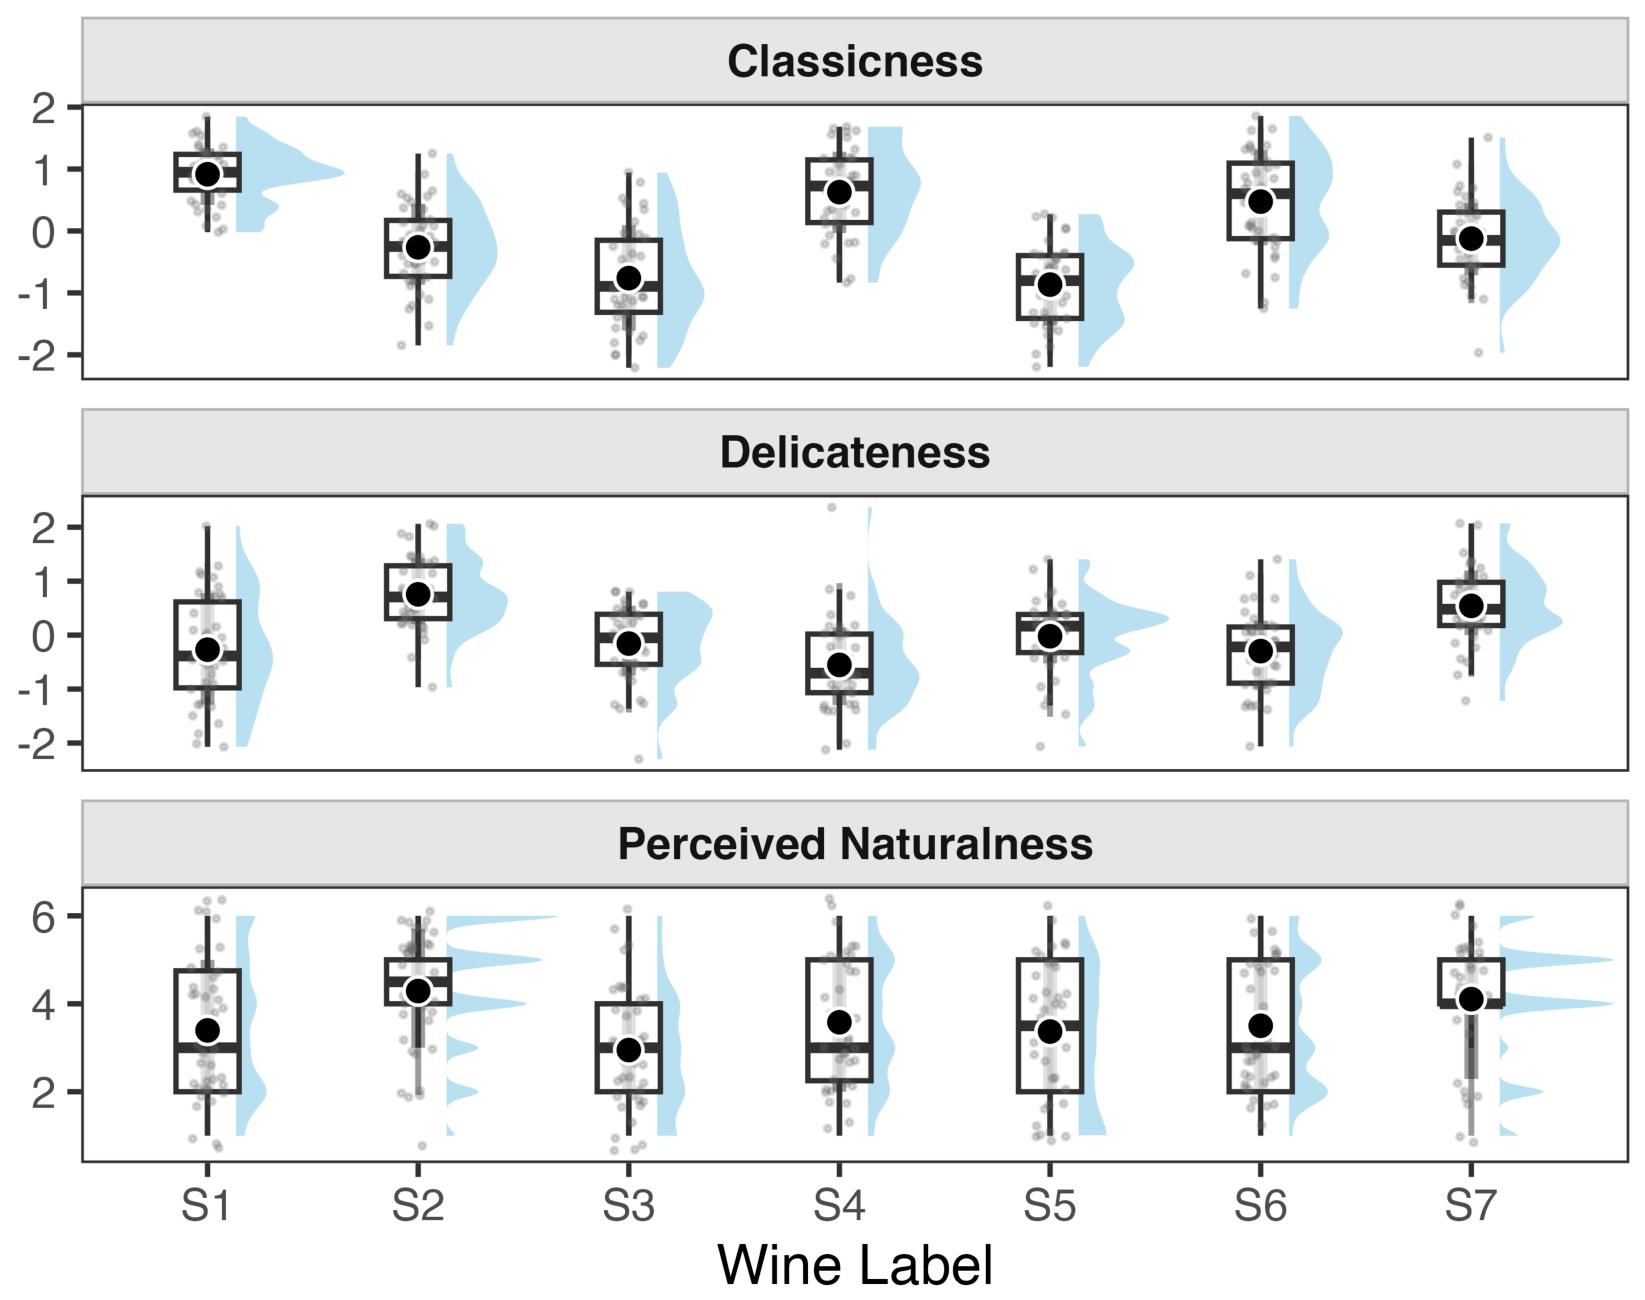
To provide a more detailed description of participant-level variability underlying these wine-level means, Figure 4 presents the distributions of Classicness, Delicateness, and perceived naturalness for each wine label. Considerable within-label variability was observed across participants, although the relative differences among wine labels remained broadly consistent with the wine-level patterns described above.

3.2.2. Participant-Level Mixed-Effects Analysis

To account for variability across both participants and wine labels, a linear mixed-effects model was fitted using participant-level observations, with random intercepts specified for participants and wine labels (Table 3). The analysis revealed significant positive effects of both Classicness (B = 0.27, p = 0.007) and Delicateness (B = 0.67, p < 0.001) on perceived naturalness. Participants tended to judge wine labels as more natural when they were perceived as both more classic and more delicate.
Compared with the wine-level analyses, the mixed-effects model indicated a stronger role for Classicness when participant-level variability was retained in the analysis. Delicateness remained the strongest predictor of perceived naturalness.

3.3. Study 2: Perceived Naturalness Among Experienced Consumers and Professionals

3.3.1. Wine-Level Analyses

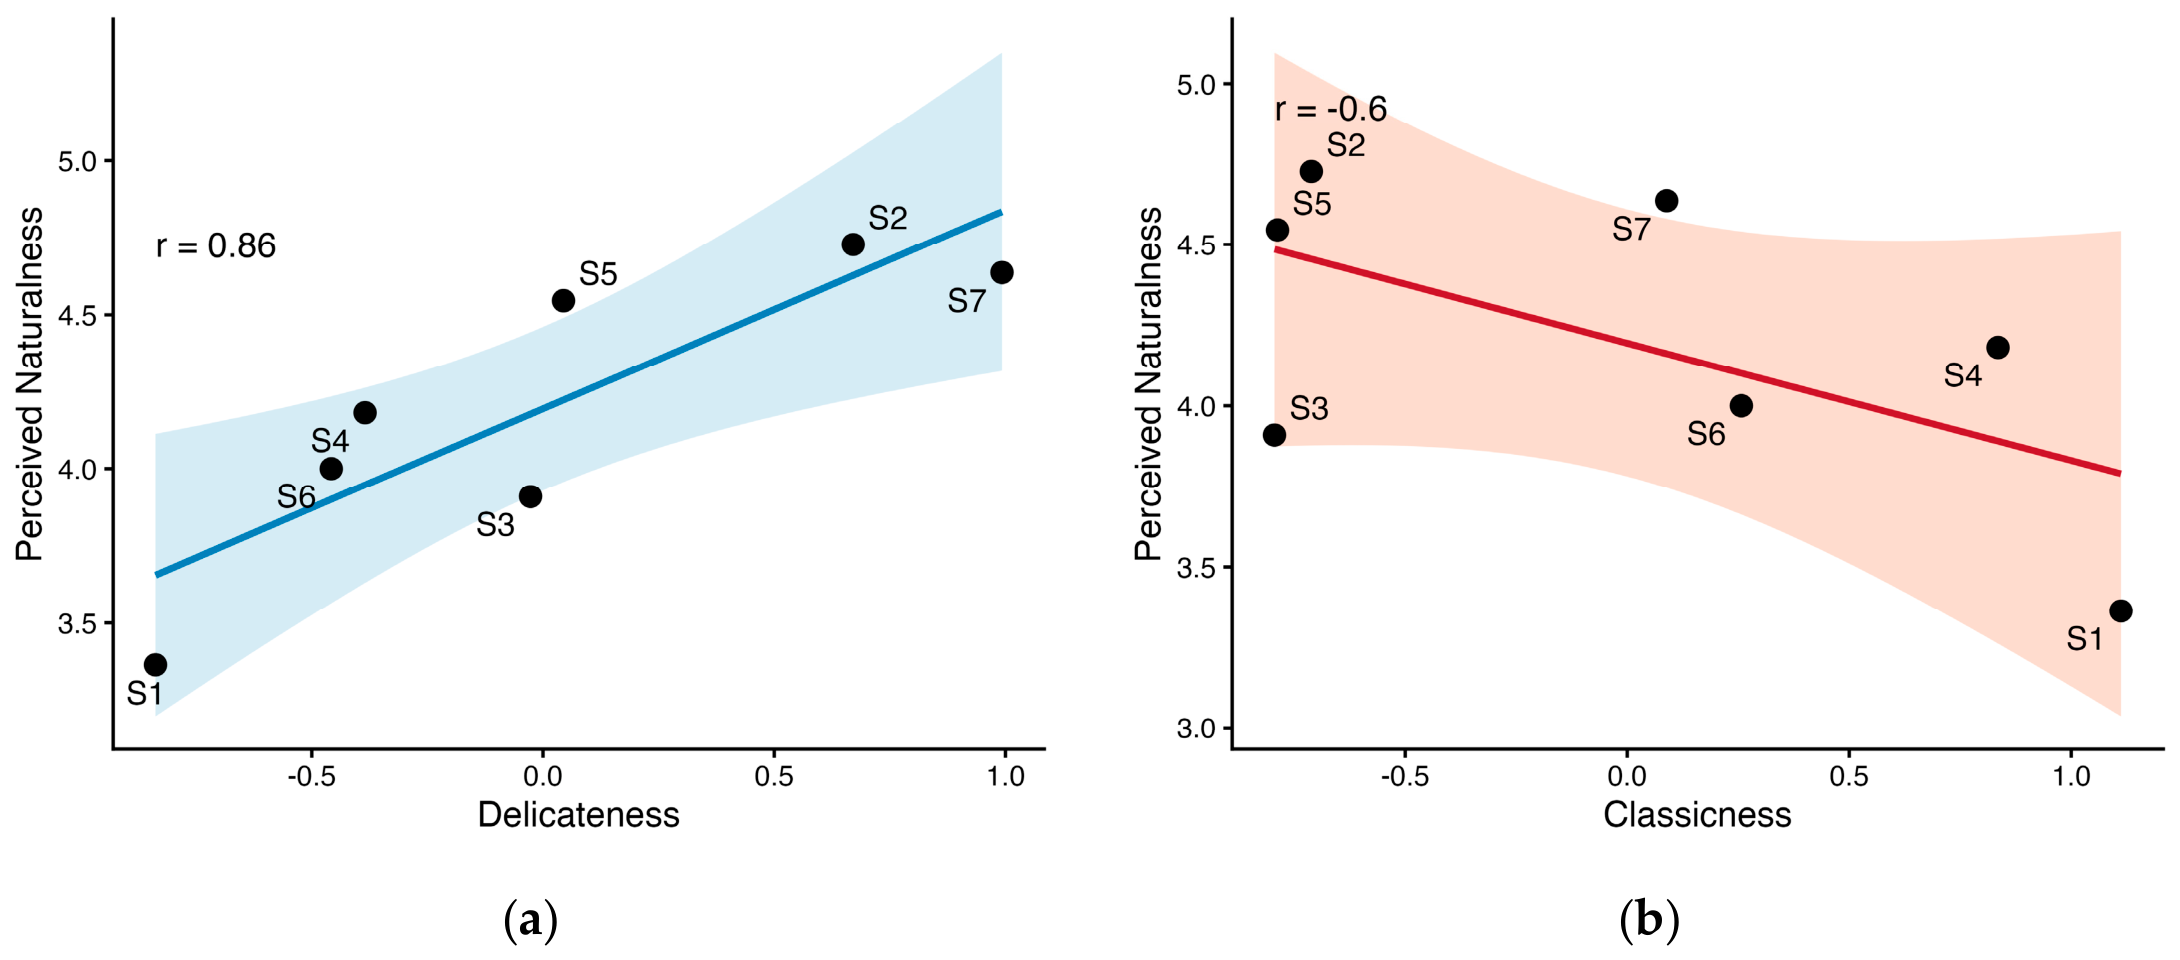
Correlation analyses revealed a significant positive association between Delicateness and perceived naturalness (r = 0.86, p = 0.014; Figure 5a). In contrast, the association between Classicness and perceived naturalness did not reach statistical significance (r = −0.60, p = 0.158; Figure 5b).
To assess the relative contributions of the two impression dimensions, a multiple regression analysis was conducted (Table 2). The model explained 75.0% of the variance in perceived naturalness (R2 = 0.750), although the overall model did not reach conventional levels of statistical significance, F(2, 4) = 5.98, p = 0.063. Delicateness showed a positive association with perceived naturalness (B = 0.58, p = 0.066), whereas Classicness did not contribute significantly to the model (B = −0.09, p = 0.649).
Taken together, these wine-level analyses suggest that perceived naturalness among experienced wine consumers and professionals was more strongly associated with the Delicateness dimension than with the Classicness dimension of wine-label impressions, although the evidence from the multiple regression analysis was limited.
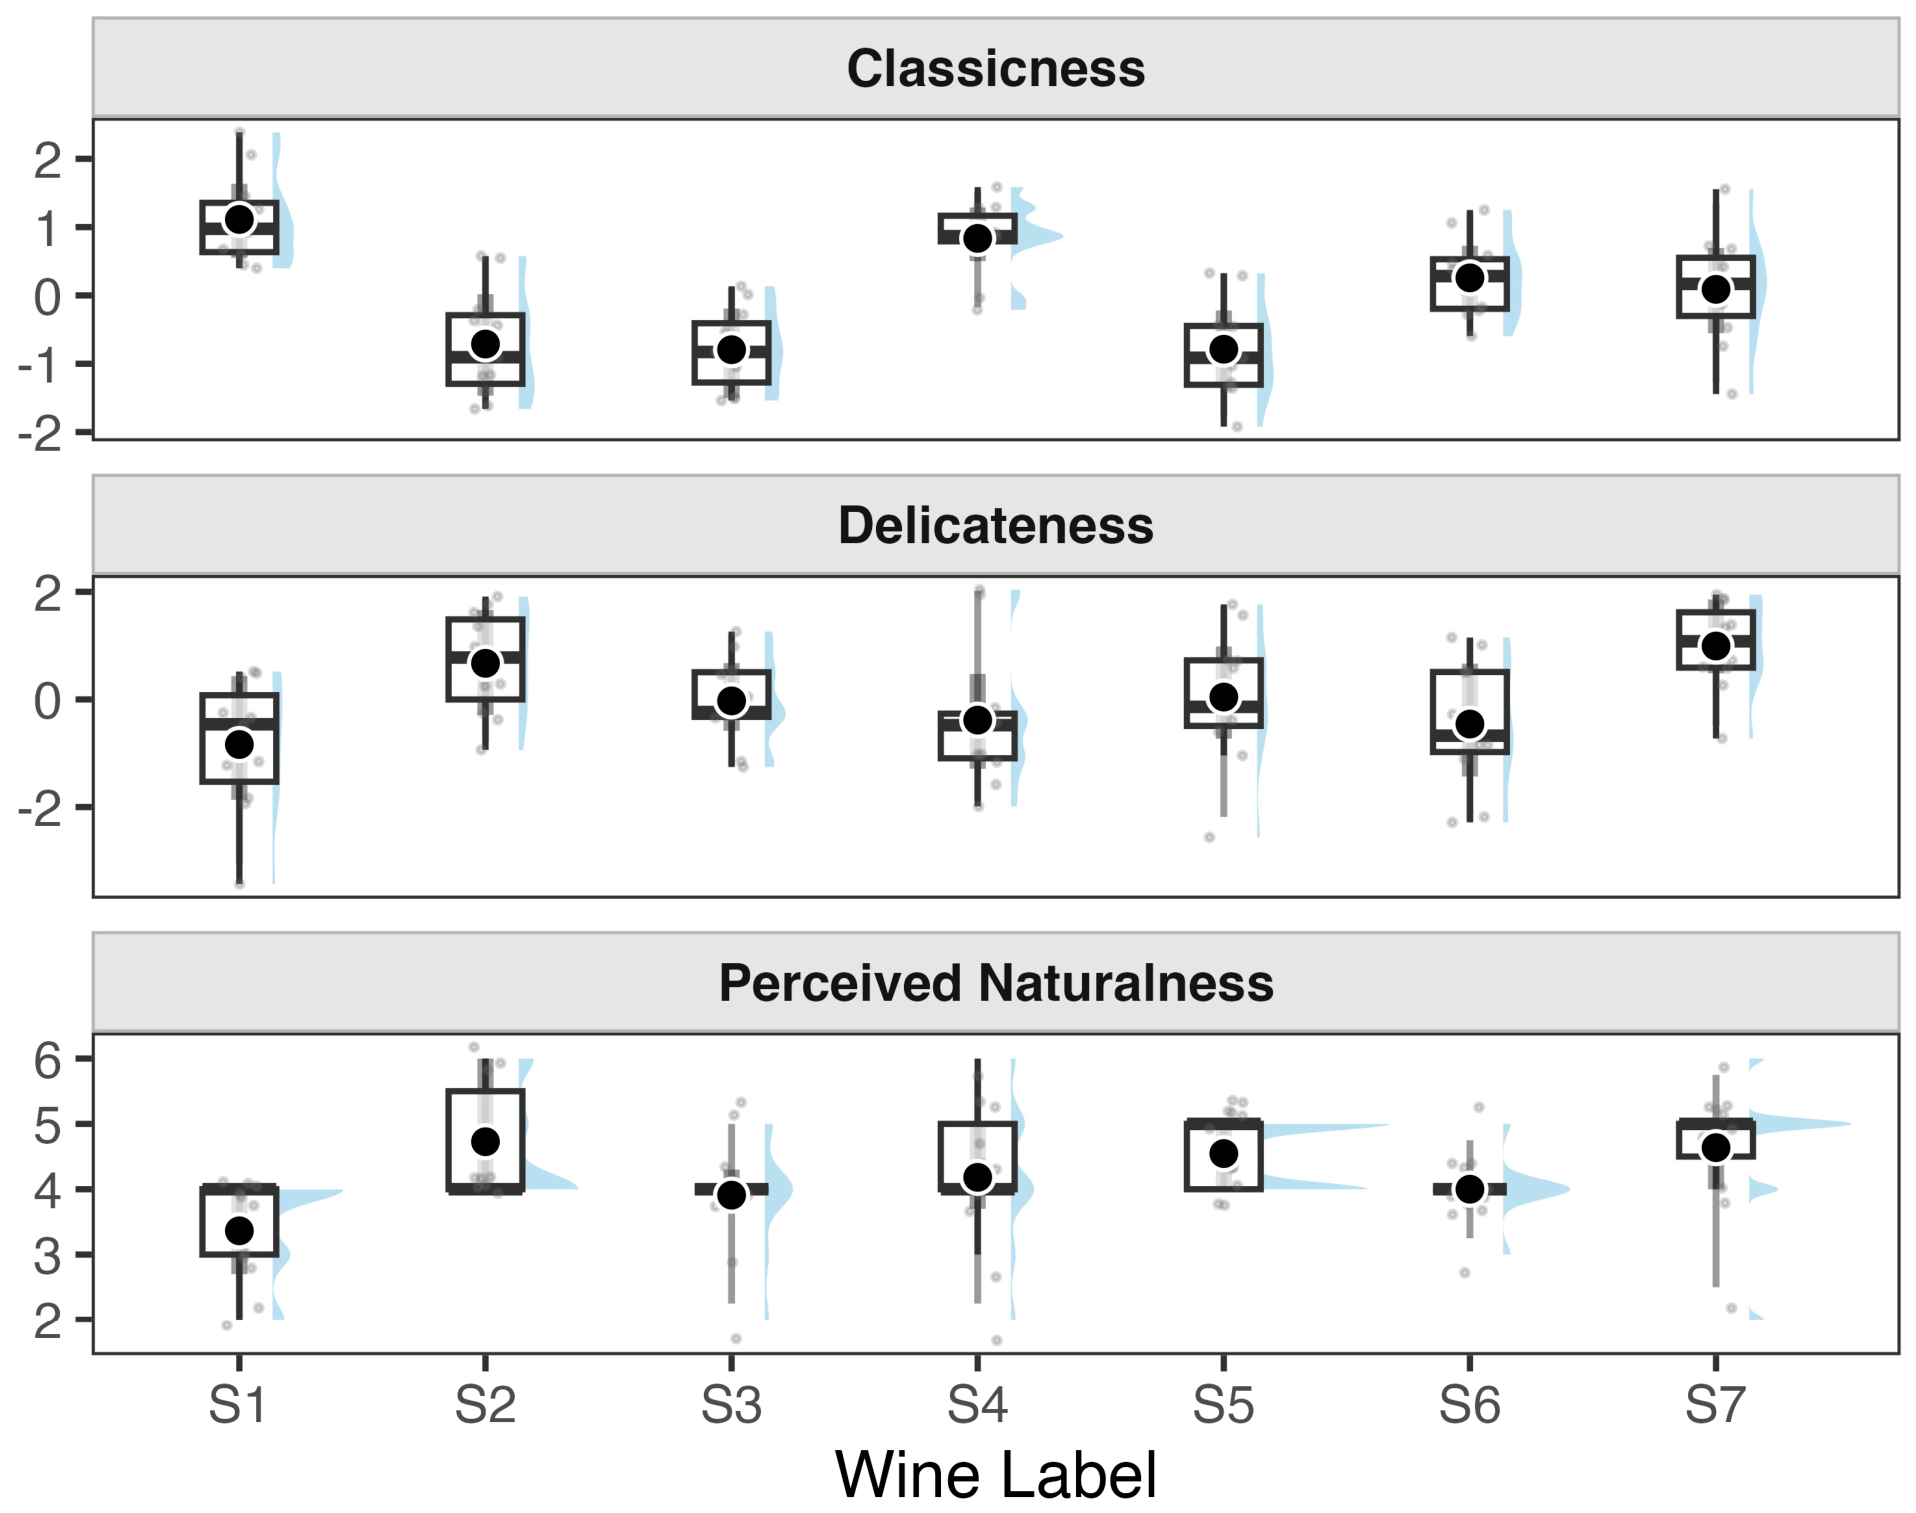
Figure 6 presents the participant-level distributions of Classicness, Delicateness, and perceived naturalness for each wine label in Study 2. As in Study 1, variability across participants was observed, although the smaller sample size resulted in less stable distributions.

3.3.2. Participant-Level Mixed-Effects Analysis

Using the same modeling approach, a linear mixed-effects model was fitted to participant-level perceived naturalness ratings (Table 3). Neither Classicness (B = −0.05, p = 0.684) nor Delicateness (B = 0.15, p = 0.112) significantly predicted perceived naturalness. Although Delicateness showed a positive coefficient, the effect did not reach statistical significance.
Compared with the wine-level analyses, the participant-level mixed-effects model provided limited evidence that the extracted impression dimensions systematically influenced perceived naturalness judgements among experienced wine consumers and professionals.

3.4. Study 2: Natural Wine Categorization

3.4.1. Wine-Level Analyses

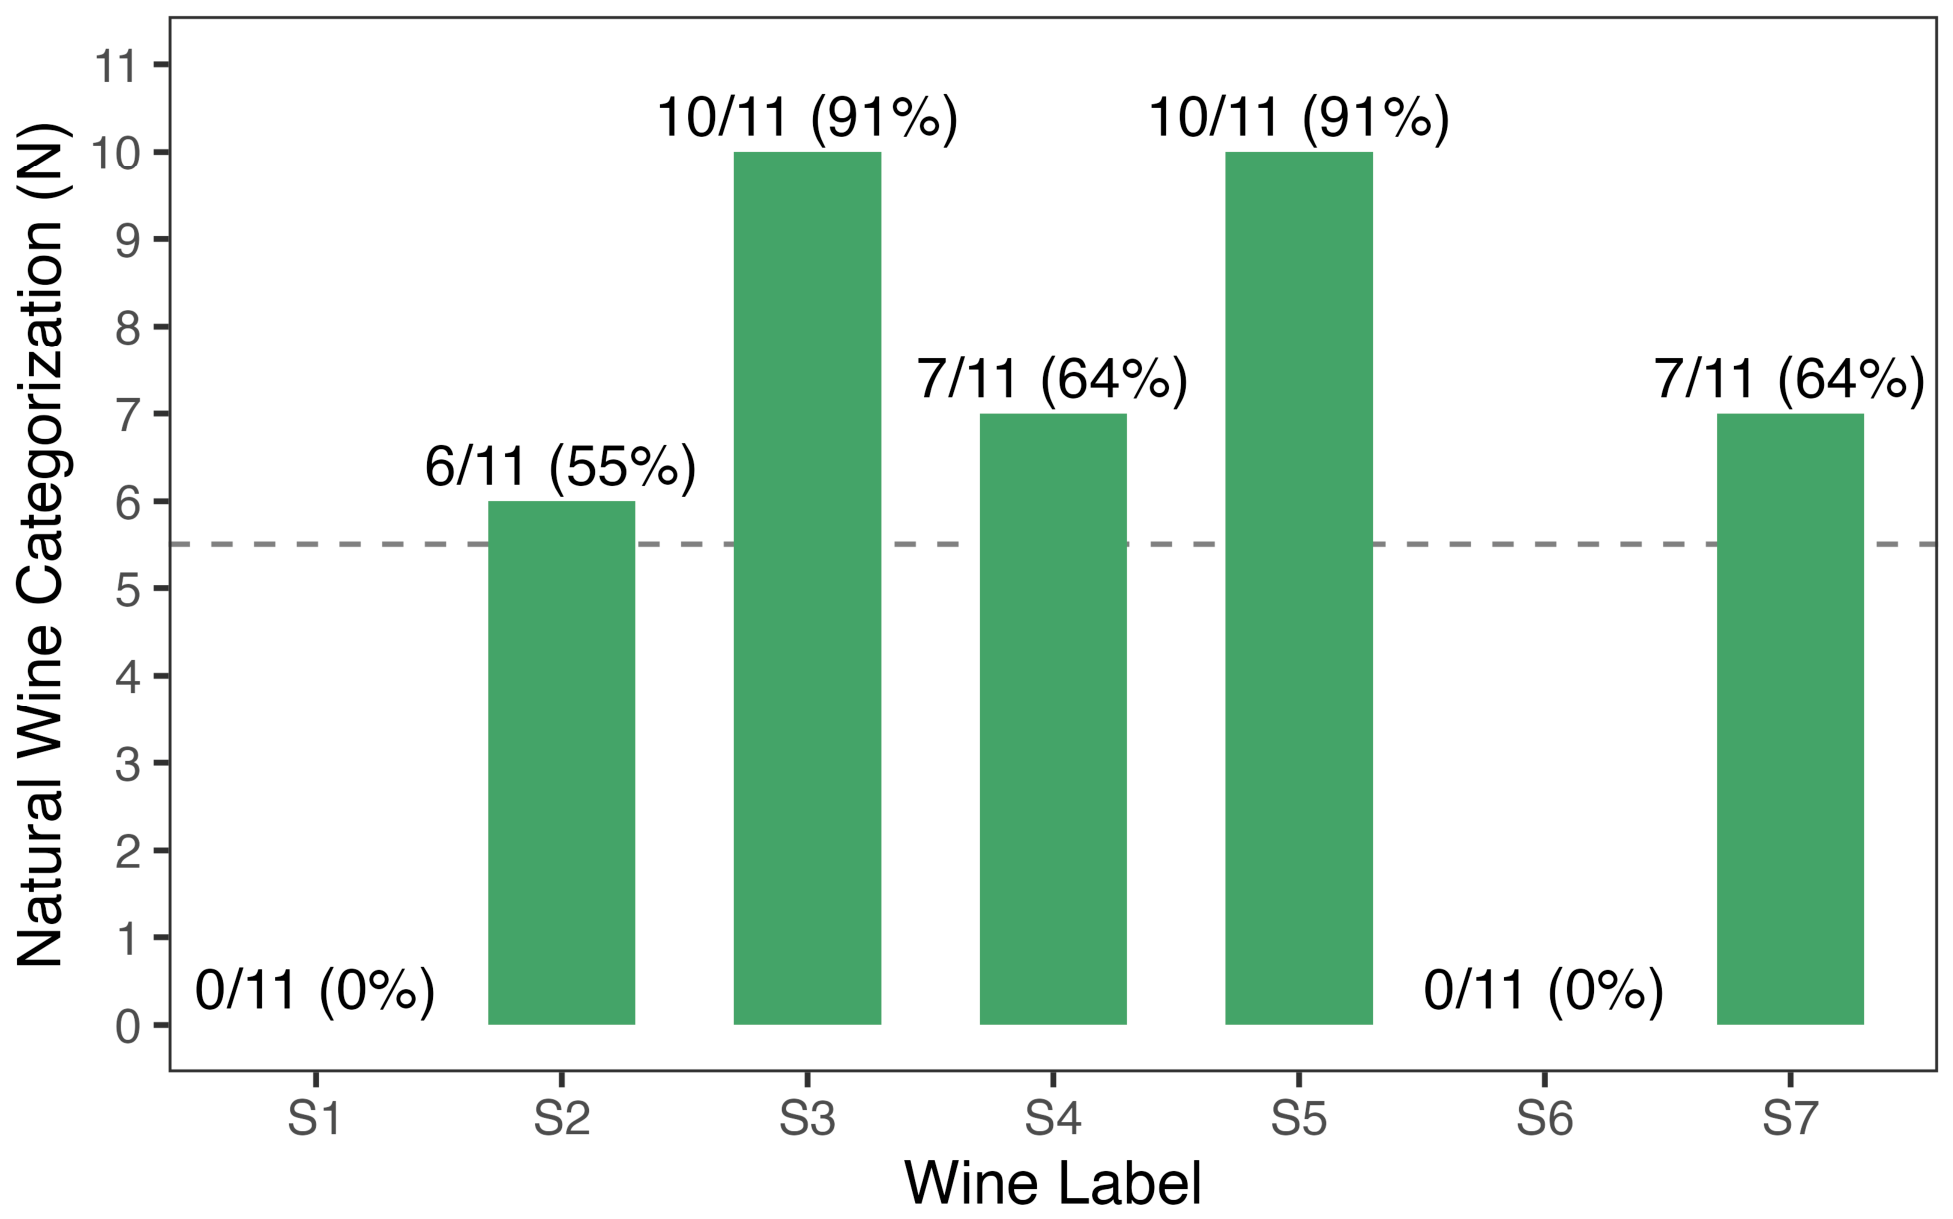
Whereas the preceding analyses focused on perceived naturalness, Study 2 additionally examined whether experienced wine consumers and professionals categorized the wine labels as natural wines, and how this categorization related to perceived naturalness. To illustrate the underlying response frequencies, Figure 7 shows the number of participants who categorized each wine label as a natural wine. The figure indicates that the observed categorization rates were derived from discrete response counts ranging from 0 to 10 participants out of 11.
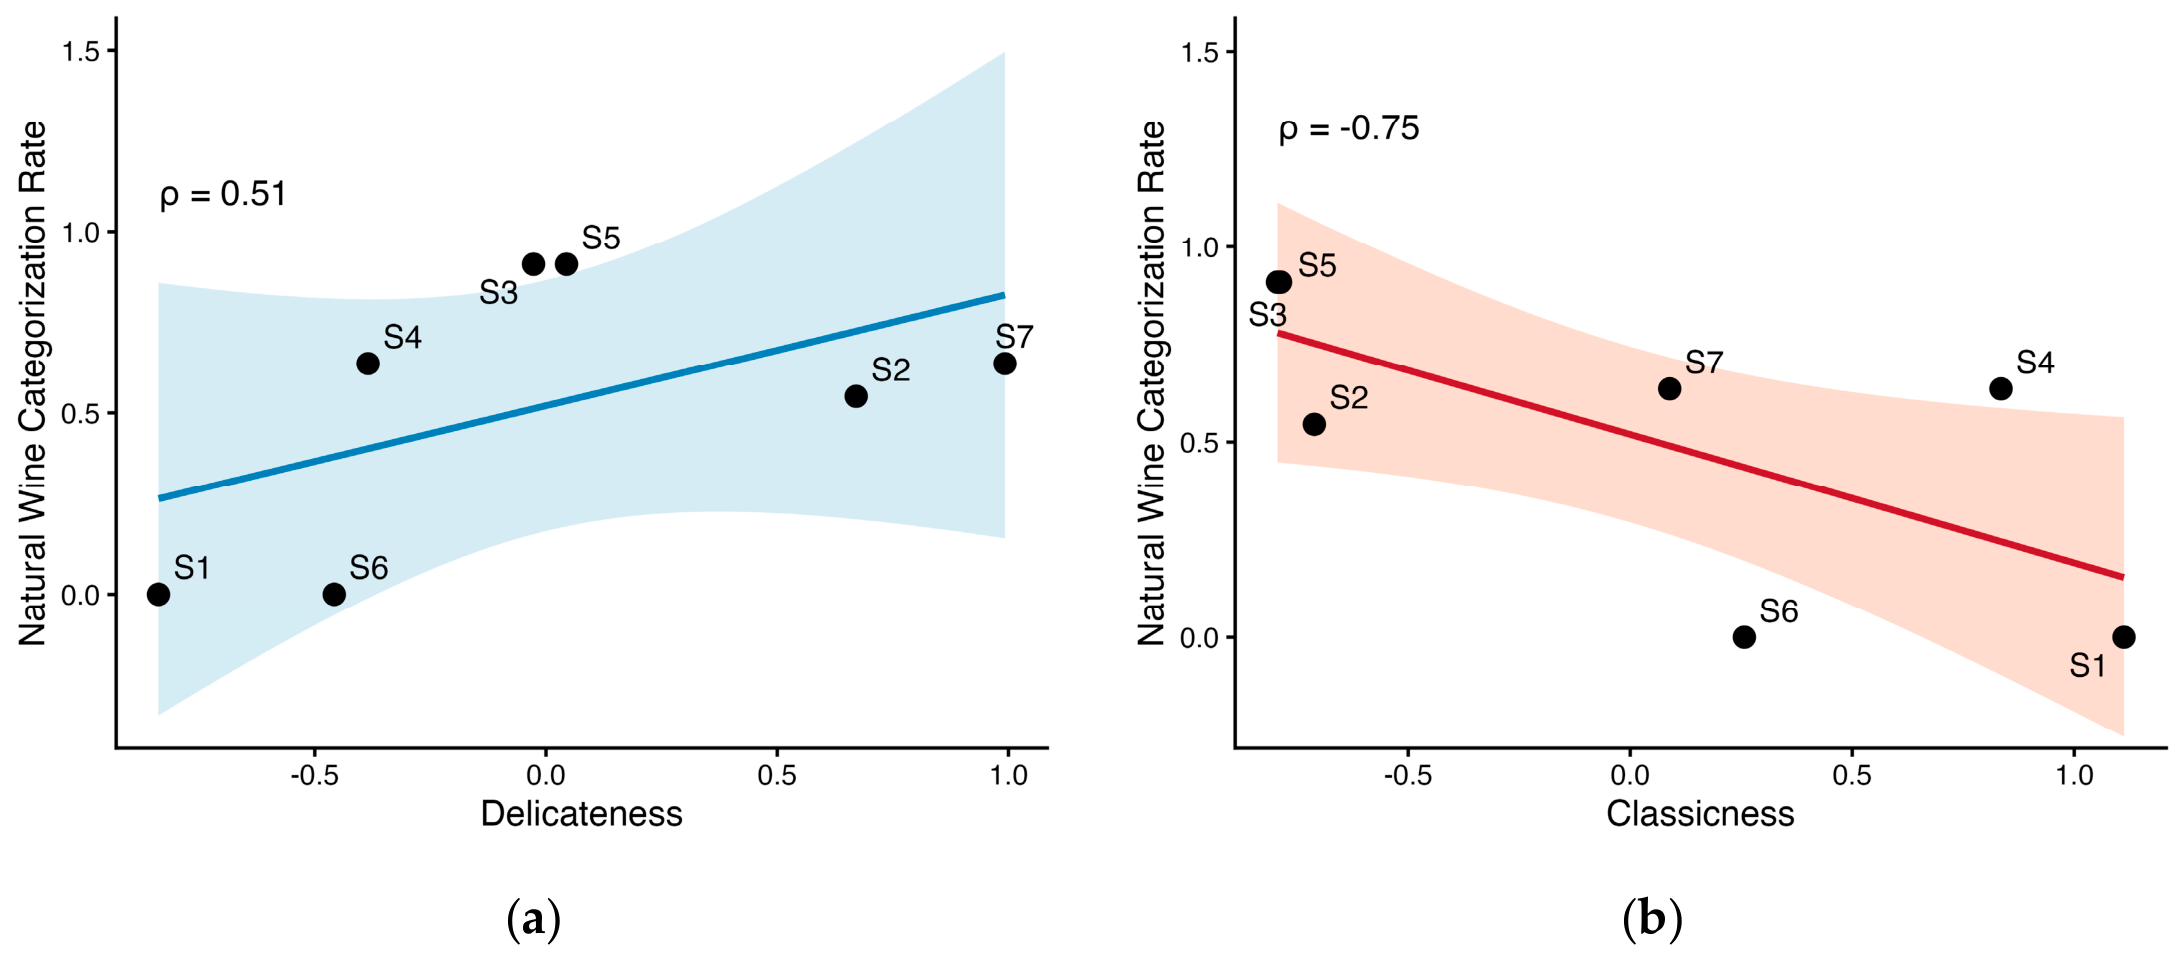
Spearman’s rank correlation analyses revealed a moderate positive association between Delicateness and the natural wine categorization, although this relationship was not statistically significant (ρ = 0.51, p = 0.238; Figure 8a). In contrast, Classicness showed a relatively strong negative association with the natural wine categorization (ρ = −0.75, p = 0.051; Figure 8b), suggesting that labels perceived as less classic tended to be categorized as natural wines more frequently.
To assess the relative contributions of the two impression dimensions, a binomial generalized linear model was applied using the number of participants who categorized each wine as a natural wine (Table 2). The analysis revealed a significant negative effect of Classicness (B = −1.28, p = 0.004), indicating that wines perceived as less classic were more likely to be categorized as natural wines. In contrast, Delicateness did not significantly predict natural wine categorization (B = 0.51, p = 0.307). Together with the Spearman correlation analysis, these wine-level results suggest that lower Classicness was associated with a higher likelihood of natural wine categorization.
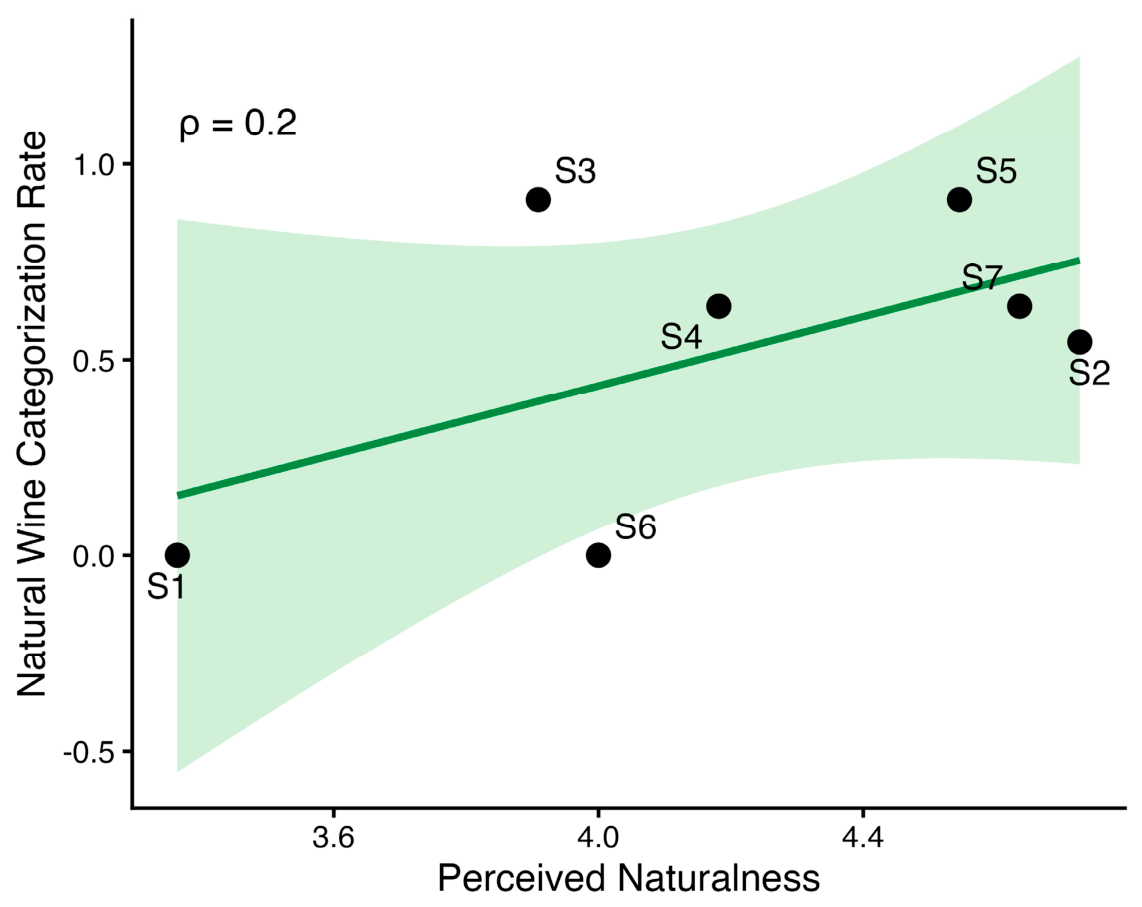
To further examine the relationship between natural wine categorization and perceived naturalness, Spearman’s rank correlation analysis was conducted between perceived naturalness ratings and the natural wine categorization rates (Figure 9). A weak positive association was observed (ρ = 0.20, p = 0.664). Although wine labels perceived as more natural tended to be categorized as natural wines slightly more frequently, the relationship was small and did not reach statistical significance. Wine-level mean factor scores, perceived naturalness ratings, and the natural wine categorization rates are reported in Table A3.

3.4.2. Participant-Level Mixed-Effects Analysis

Using the same modeling framework, a binomial generalized linear mixed-effects model was fitted to participant-level natural wine categorization judgements (Table 3). Neither Classicness (B = −0.32, p = 0.490) nor Delicateness (B = 0.14, p = 0.664) significantly predicted natural wine categorization. Therefore, the negative association between Classicness and natural wine categorization observed in the wine-level analysis was not supported when participant-level variability was retained in the model.

4. Discussion

4.1. Visual Impressions as Cues for Perceived Naturalness

The present study examined how visual impressions of wine labels contribute to perceived naturalness and natural wine categorization. Across the studies, wine-label impressions were summarized by two perceptual dimensions. The first dimension, Classicness, was characterized by impressions such as formality, maturity, luxury, and oldness, whereas the second dimension, Delicateness, was characterized by impressions such as purity, smoothness, and femininity. Among both novice consumers and experienced wine consumers and professionals, wine labels characterized by higher Delicateness tended to be perceived as more natural. This tendency was observed in the wine-level analyses of both studies, although participant-level mixed-effects analyses provided stronger support for this relationship in Study 1 than in Study 2.
These findings are consistent with previous research suggesting that perceptions of naturalness are inferential rather than direct evaluations of objective product characteristics. Evans et al. [16] argued that judgements of naturalness are often constructed from cues that consumers associate with production processes and human intervention. In the present study, participants were unable to directly observe how the wines were produced and were not provided with formal certification marks or detailed production information, although some labels (e.g., S2) contained textual elements potentially associated with production practices. Consequently, judgements of naturalness were necessarily based, at least in part, on inferences derived from the visual and textual characteristics of the labels themselves.
The positive association between Delicateness and perceived naturalness is also consistent with previous findings that visual design characteristics can influence perceptions of naturalness. Delicateness was associated with impressions such as purity, smoothness, femininity, and reduced boldness. Such impressions may evoke assumptions of lower levels of industrial intervention or manipulation and therefore encourage perceptions of naturalness. This interpretation is broadly consistent with findings that matte packaging increases perceived naturalness [17] and that minimalist packaging promotes inferences regarding natural production practices and authenticity [18]. Together, these studies suggest that consumers frequently rely on visual heuristics when forming judgements about product naturalness.
An additional noteworthy finding is the broad similarity observed across participant groups. Despite substantial differences in wine knowledge and consumption experience, Delicateness showed positive associations with perceived naturalness in both studies. This cross-study consistency suggests that broadly similar label impressions may have contributed to naturalness judgements among both novice and experienced participants, even though the strength of these relationships differed across analyses. Taken together, these findings support the first objective of the present study by suggesting that perceived naturalness is associated with identifiable dimensions of wine-label impressions, particularly Delicateness.

4.2. Natural Wine Categorization and the Role of Low Classicness

A more exploratory finding concerned natural wine categorization among experienced wine consumers and professionals. Whereas perceived naturalness was consistently associated with Delicateness, natural wine categorization showed a recurring tendency to be associated with lower Classicness in the wine-level analyses. Specifically, Spearman correlation analyses revealed a relatively strong negative association between Classicness and natural wine categorization, and the binomial generalized linear model identified Classicness as a significant negative predictor of categorization. In contrast, these relationships were not supported by the participant-level mixed-effects analysis. Taken together, these findings suggest that impressions captured by the Classicness dimension may contribute to natural wine category judgements, although the evidence remains preliminary.
The Classicness dimension was characterized by impressions such as maturity, luxury, formality, oldness and heaviness. Labels scoring highly on this dimension often corresponded to visually conventional wine designs that emphasized textual information, geographical references, and traditional symbolic elements. For example, as described in Table 1, S1 and S6 consisted primarily of formal, information-rich label designs and received relatively high Classicness scores while exhibiting natural wine categorization rates of 0.00. In contrast, labels such as S3 and S5 that contained unconventional illustrations and less formal visual structures received lower Classicness scores, and were among the labels most frequently categorized as natural wines. These observations are consistent with the possibility that participants may have partly relied on departures from conventional wine-label aesthetics when judging whether a wine appeared to belong to the natural wine category.
At the same time, the relationship was not absolute. For example, S4 received a relatively high Classicness score while also receiving a comparatively high natural wine categorization rate (Table A3). This pattern suggests that low Classicness was not a necessary condition for natural wine categorization. Rather, Classicness may represent one of several factors contributing to category judgements.
One possible explanation is that natural wine categorization does not depend solely on perceptions of naturalness, but also on recognition of visual conventions associated with the natural wine category itself. Because natural wine lacks universally accepted definitions and authenticity markers [1,2], consumers and professionals may learn to associate the category with particular aesthetic styles that differentiate it from conventional wine. Under such conditions, categorization may involve recognizing what appears atypical of traditional wine rather than identifying objective indicators of natural production.
This interpretation is broadly consistent with sociological discussions of natural wine as an alternative movement that distinguishes itself from dominant institutions and conventions within the wine industry [4,5]. From this perspective, visually unconventional labels may serve not only as marketing devices but also as symbolic markers of distance from established wine culture.
At the same time, category judgements among experienced participants may not have been based solely on label impressions. Some participants may have been familiar with wines or producers strongly associated with natural wine (e.g., S4 and S5), and such prior knowledge could have contributed to categorization judgements. Accordingly, the present findings should be interpreted as preliminary evidence rather than as a definitive account of how natural wine categories are recognized.

4.3. Perceived Naturalness and Natural Wine Categorization

The second objective of the present study was to explore the relationship between perceived naturalness and natural wine categorization among experienced wine consumers and wine professionals. Previous research on food products and packaging has focused primarily on factors that influence perceptions of naturalness [16,17,18]. In contrast, the present study examined not only whether a wine appeared natural but also whether it was categorized as a natural wine. The findings provide preliminary evidence that perceived naturalness and natural wine categorization may not rely on identical label-impression patterns.
One observation consistent with this interpretation was the weak positive association between perceived naturalness and natural wine categorization. Wines perceived as more natural tended to be categorized as natural wines slightly more frequently, although the relationship did not reach statistical significance. In addition, different label-impression dimensions appeared to show different patterns of association with the two judgements. Perceived naturalness was most consistently associated with Delicateness, whereas natural wine categorization showed a recurring tendency to be associated with lower Classicness in the wine-level analyses.
Taken together, the results suggest that perceived naturalness and natural wine categorization may be associated with partially different label-impression dimensions. However, evidence concerning natural wine categorization remained substantially weaker than evidence concerning perceived naturalness. In particular, the participant-level mixed-effects analyses provided little support for systematic relationships between the extracted impression dimensions and natural wine categorization. Accordingly, interpretations regarding category judgements should be regarded as exploratory.
One possible interpretation is that perceived naturalness and natural wine categorization operate at different levels of evaluation. Perceived naturalness may reflect broad inferences regarding production methods and human intervention [16]. Natural wine categorization, in contrast, may also involve recognition of visual conventions associated with natural wine as a social and market category [4,5], as well as prior familiarity with wines, brands, and producers. In such circumstances, consumers and professionals may categorize a wine as a natural wine not only because it appears natural, but also because it resembles other wines that they have learned to associate with the category.
Taken together, the present findings provide preliminary evidence that wine-label impressions may contribute to both perceived naturalness and natural wine categorization, while suggesting that these judgements may not rely on identical perceptual cues. However, this interpretation remains tentative and requires confirmation using larger stimulus sets, direct assessments of familiarity, and independent validation studies.

4.4. Implications for Authenticity and Legitimacy in Natural Wine

The present findings have implications for ongoing discussions concerning authenticity and legitimacy in the natural wine sector. Previous research has highlighted persistent controversies regarding natural wine definitions, certification systems, and the risk of consumer confusion arising from fragmented standards and information asymmetries [1,2,4]. These concerns provide important motivations for efforts to improve transparency and establish clearer criteria for natural wine.
At the same time, the present study provides evidence that consumers and wine professionals form systematic judgements regarding perceived naturalness even when detailed information about production methods and certifications is unavailable. This finding suggests that natural wine is not recognized solely through formal definitions or regulatory markers. This interpretation is also compatible with recent evidence suggesting that consumers often do not clearly distinguish between products framed as “natural” and those framed as “organic,” despite substantial differences in certification and regulatory standards [15].
Importantly, the present findings should not be interpreted as showing that visual impressions accurately reflect actual production practices. Rather, they indicate that consumers and professionals develop representations of naturalness and authenticity that can be activated by label appearances and related cues. More broadly, previous research has suggested that consumers and professionals develop fairly coherent representations of emerging wine categories even when category boundaries remain contested [6,7,8]. The present findings extend this perspective by suggesting that visual impressions may constitute one of the perceptual foundations through which such category representations are formed and applied.
Taken together, these findings suggest that judgements of authenticity in the natural wine market are shaped not only by technical and regulatory considerations but also by socio-cultural processes. Consequently, future discussions concerning natural wine legitimacy may benefit not only from addressing how natural wine should be defined and certified, but also from understanding how consumers and professionals actually recognize and interpret the category.

5. Limitations

The present findings should be interpreted in light of several limitations. First, the number of wine labels included in the study was limited. The analyses examined label impressions at both the stimulus level and the participant level; however, the stimulus set itself remained restricted to seven wine labels. Future studies employing a larger and more diverse set of wine labels are needed to determine the robustness and generalizability of the observed associations. This limitation is particularly important for the findings concerning natural wine categorization, which should be regarded as exploratory.
Second, familiarity with individual wines, brands, and producers was not directly assessed. Although the stimuli were selected to represent diverse visual styles, some participants—particularly those in Study 2—may have been familiar with certain wines or producers. In particular, some wine professionals may have recognized producers strongly associated with natural wine, such as Domaine Takahiko (S4) or Marcel Lapierre (S5). Consequently, the possibility that prior knowledge influenced some evaluations, especially natural wine categorization judgements, cannot be excluded. Future studies should therefore assess familiarity directly, employ stimuli with lower producer recognition, or use fictional brands specifically designed to isolate the effects of visual label impressions from prior knowledge.
Third, although the selected labels did not display formal certifications for natural wine, some labels contained textual information potentially associated with production practices (e.g., the term “Organic” on S2). Future research should therefore more strictly control authenticity-related cues while also investigating the relationship between perceived authenticity and objective indicators of wine production.
Fourth, the present study focused on overall label impressions rather than specific visual design elements. The analyses identified broad perceptual dimensions associated with perceived naturalness and natural wine categorization, but they do not reveal which concrete design features generated these impressions. Future research should therefore examine how specific visual elements, such as typography, color, illustration style, layout, and information density, contribute to perceptions of naturalness and natural-wine authenticity. Furthermore, six of the seven stimuli were red wines, whereas one stimulus was a white wine (S7). Consequently, some evaluations may have been influenced by differences in bottle appearance associated with wine type rather than label design alone. Future studies should therefore examine label impressions while controlling more systematically for bottle characteristics.
Fifth, the participant samples were drawn exclusively from Japan. Although the two studies intentionally contrasted novice consumers with experienced wine consumers and wine professionals, perceptions of wine labels and natural wine may vary across countries and wine cultures. Visual conventions associated with natural wine are likely influenced by local market environments, wine traditions, and consumer knowledge. Therefore, the present findings should not be assumed to generalize directly to consumers and professionals in other cultural contexts. Moreover, visual representations associated with natural wine may themselves differ across cultural settings. For example, the visual cues linked to natural wine in Japan may not fully correspond to those found in European or North American wine markets. Future cross-cultural research is therefore needed to examine the extent to which the present findings reflect culturally specific versus more general patterns of natural-wine perception.
Sixth, Study 1 was characterized by a substantial gender imbalance. Because wine-related preferences and evaluations may vary across demographic groups, future studies should examine whether the present findings generalize to more demographically balanced samples. Future research should also investigate the extent to which perceptions of natural wine labels vary according to demographic and consumer characteristics, including gender, age, occupation, income, wine consumption frequency, and wine involvement.
Lastly, perceived naturalness was operationalized using evaluations of environmental friendliness and health consciousness. Although these attributes are commonly associated with natural wine in previous research [1,6,12,21], they should be interpreted as reflecting consumer representations of naturalness rather than direct assessments of natural winemaking practices.
Despite these limitations, the present study provides an initial exploration of how visual impressions of wine labels contribute to perceived naturalness and provides preliminary insights into natural wine categorization.


6. Conclusions

The present study examined how visual impressions of wine labels relate to perceived naturalness and natural wine categorization. Across the studies, wine-label impressions were summarized by two dimensions, Classicness and Delicateness. Perceived naturalness was consistently associated with Delicateness, suggesting that labels perceived as purer, smoother, and more feminine tended to be judged as more natural. In contrast, natural wine categorization was associated with lower Classicness in the wine-level analyses, although this relationship was not supported by the participant-level mixed-effects analysis and should therefore be regarded as preliminary.
These findings suggest that wine-label impressions may contribute to perceptions of naturalness and, potentially, to natural wine categorization. Exploratory findings from Study 2 further raise the possibility that perceived naturalness and natural wine categorization may not rely on identical perceptual cues. More broadly, the results indicate that judgements concerning natural wine may be shaped not only by technical information and regulatory frameworks, but also by socially shared visual expectations and category representations that emerge even when category boundaries remain contested. The present study therefore contributes to ongoing discussions concerning authenticity and legitimacy in the natural wine sector while providing a foundation for future research on the perceptual processes underlying natural-wine evaluation and categorization.

Funding

This research was funded by the Osake-no-Kagaku Foundation.

Institutional Review Board Statement

The study was conducted in accordance with the Declaration of Helsinki and approved by the Ethics Committee of the Faculty of Humanity-Oriented Science and Engineering, Kindai University (protocol code 2025-04 and date of approval: 11 March 2025).

Informed Consent Statement

Informed consent was obtained from all participants involved in the study.

Data Availability Statement

The data are not publicly available due to ethical and privacy restrictions but are available from the corresponding author upon reasonable request.

Acknowledgments

The data collection for this study was conducted while the author was affiliated with Kindai University. During the preparation of this manuscript, the author used Microsoft Copilot (GPT-5-based version available in 2026) to assist with language editing, manuscript organization, and discussion of statistical analyses. The author has reviewed and edited the output and takes full responsibility for the content of this publication.

Conflicts of Interest

The author declares no conflicts of interest.

Abbreviations

The following abbreviations are used in this manuscript:
J.S.A.Japan Sommelier Association
WSETWine & Spirit Education Trust
SDSemantic differential
KMOKaiser–Meyer–Olkin
ICCsIntraclass Correlation Coefficients

Appendix A

Table A1. Commercial wines used as experimental stimuli.
StimulusProducerProduct NameCountry of OriginTypeVintage
S1Clos du CaillouLa Réserve,
Châteauneuf-du-Pape
FranceRedNot visible on label image
S2Cono SurOrganic Pinot NoirChileRed2022
S3El Mozo WinesParaje 601SpainRedNot visible on label image
S4Domaine Takahiko SogaNana-Tsu-Mori
Pinot Noir
JapanRed2022
S5Marcel LapierreRaisin Gaulois,
Vin de France
FranceRed2022
S6Shaw + SmithShiraz, Adelaide HillsAustraliaRed2016
S7YuraLe Silence
et le Résonance
FranceWhite2022
Note: The table provides information regarding the commercial wines from which the stimulus images were obtained. Stimuli were anonymized and referred to as S1–S7 throughout the study. Bottle images were prepared from either publicly available producer materials or photographs taken by the author and were subsequently standardized prior to presentation.
Table A2. Factor loadings for the two-factor solution obtained in Study 1.
DescriptorClassicness (MR1)Delicateness (MR2)
Grownup0.850.10
Luxury0.770.10
Formal0.73−0.03
Old0.59−0.28
Heavy0.52−0.29
Gloomy0.470.03
Dense0.43−0.43
Pure−0.080.63
Smooth0.240.61
Feminine0.050.58
Bold−0.11−0.58
Gorgeous−0.290.48
Hard0.32−0.46
SS Loadings3.282.40
Proportion Var0.250.18
Cumulative Var0.250.44
Note: Factor loadings were obtained using the minimum residual method with oblimin rotation. Primary loadings greater than |0.50| are shown in bold. The two factors were moderately correlated (r = −0.32).
Table A3. Wine-level means (SDs) for factor scores, perceived naturalness ratings, and natural wine categorization rates.
StimulusStudy 1Study 2
ClassicnessDelicatenessPerceived NaturalnessClassicnessDelicatenessPerceived NaturalnessNatural Wine Categorization Rate
S10.92 (0.46)−0.27 (1.01)3.39 (1.57)1.11 (0.64)−0.84 (1.23)3.36 (0.81)0.00
S2−0.27 (0.69)0.76 (0.67)4.29 (1.33)−0.71 (0.80)0.67 (0.95)4.73 (0.91)0.55
S3−0.76 (0.83)−0.16 (0.72)2.95 (1.33)−0.79 (0.59)−0.03 (0.80)3.91 (0.83)0.91
S40.63 (0.68)−0.55 (0.85)3.58 (1.43)0.84 (0.54)−0.39 (1.30)4.18 (1.08)0.64
S5−0.87 (0.65)−0.02 (0.72)3.37 (1.53)−0.79 (0.70)0.04 (1.23)4.55 (0.52)0.91
S60.47 (0.80)−0.30 (0.75)3.50 (1.45)0.26 (0.57)−0.46 (1.17)4.00 (0.45)0.00
S7−0.12 (0.67)0.54 (0.71)4.11 (1.35)0.09 (0.80)0.99 (0.81)4.64 (1.03)0.64
Note: Values for factor scores and perceived naturalness are reported as means (SDs). Factor scores were derived from the participant-level factor structure reported in Table A2. Study 2 factor scores were calculated using the factor structure obtained in Study 1. Natural wine categorization rate represents the proportion of Study 2 participants who classified each stimulus as a natural wine.

References

  1. Vecchio, R.; Parga-Dans, E.; Alonso González, P.; Annunziata, A. Why Consumers Drink Natural Wine? Consumer Perception and Information about Natural Wine. Agric. Food Econ. 2021, 9, 22. [Google Scholar] [CrossRef] [Scilit]
  2. Parga-Dans, E.; Vecchio, R.; Annunziata, A.; Alonso González, P.; Otero Enríquez, R. A Certification for Natural Wine? Comparative Analysis of Consumer Drivers in Italy and Spain. Wine Econ. Policy 2023, 12, 23–35. [Google Scholar] [CrossRef] [Scilit]
  3. Gazzola, P.; Pavione, E.; Grechi, D.; Scavarda, F. Natural Wine as an Expression of Sustainability: An Exploratory Analysis of Italy’s Restaurant Industry. Br. Food J. 2023, 125, 390–409. [Google Scholar] [CrossRef] [Scilit]
  4. Alonso González, P.; Parga-Dans, E.; Fuentes Fernández, R. Certification of Natural Wine: Policy Controversies and Future Prospects. Front. Sustain. Food Syst. 2022, 6, 875427. [Google Scholar] [CrossRef] [Scilit]
  5. Alonso González, P.; Parga-Dans, E. The Natural Wine Phenomenon and the Promise of Sustainability: Institutionalization or Radicalization? Cult. Agric. Food Environ. 2023, 45, 45–54. [Google Scholar] [CrossRef] [Scilit]
  6. Fabbrizzi, S.; Sottini, V.A.; Cipollaro, M.; Menghini, S. Sustainability and Natural Wines: An Exploratory Analysis on Consumers. Sustainability 2021, 13, 7645. [Google Scholar] [CrossRef] [Scilit]
  7. Urdapilleta, I.; Demarchi, S.; Parr, W. Influence of Culture on Social Representation of Wines Produced by Various Methods: Natural, Organic and Conventional. Food Qual. Prefer. 2021, 87, 104034. [Google Scholar] [CrossRef] [Scilit]
  8. Honoré-Chedozeau, C.; Pouzalgues, N.; Symoneaux, R. Less Is More: Towards a Discrepancy in the Representation of ‘No Added Sulphite’ Wines among French Professionals and Consumers. OENO One 2025, 59, 1. [Google Scholar] [CrossRef] [Scilit]
  9. Mueller, S.; Lockshin, L.; Saltman, Y.; Blanford, J. Message on a Bottle: The Relative Influence of Wine Back Label Information on Wine Choice. Food Qual. Prefer. 2010, 21, 22–32. [Google Scholar] [CrossRef] [Scilit]
  10. Charters, S.; Lockshin, L.; Unwin, T. Consumer Responses to Wine Bottle Back Labels. J. Wine Res. 1999, 10, 183–195. [Google Scholar] [CrossRef] [Scilit]
  11. Galati, A.; Schifani, G.; Crescimanno, M.; Migliore, G. “Natural Wine” Consumers and Interest in Label Information: An Analysis of Willingness to Pay in a New Italian Wine Market Segment. J. Clean. Prod. 2019, 227, 405–413. [Google Scholar] [CrossRef] [Scilit]
  12. Migliore, G.; Thrassou, A.; Crescimanno, M.; Schifani, G.; Galati, A. Factors Affecting Consumer Preferences for “Natural Wine”: An Exploratory Study in the Italian Market. Br. Food J. 2020, 122, 2463–2479. [Google Scholar] [CrossRef] [Scilit]
  13. Fuentes, R.; Lanero, A.; Luis Vázquez, J. Are Official Certifications a Relevant Aspect in the Consumption of Natural Wines? A Prospective Study among Spanish Producers/Consumers. Trakia J. Sci. 2021, 19, 393–398. [Google Scholar] [CrossRef] [Scilit]
  14. Vecchio, R.; Toccaceli, D.; Pacciani, A.; Cavallo, C.; Caso, G. Shrinking the Market Space: Consumer (Overlapping) Preferences for Organic Wines and Three Alternative Competitors. Int. J. Wine Bus. Res. 2023, 35, 467–486. [Google Scholar] [CrossRef] [Scilit]
  15. Minetti, F.; Quercia, S. Natural or Organic? How Framing Impacts Choices of Sustainable Food and Wine Products. Br. Food J. 2024, 126, 559–572. [Google Scholar] [CrossRef] [Scilit]
  16. Evans, G.; de Challemaison, B.; Cox, D.N. Consumers’ Ratings of the Natural and Unnatural Qualities of Foods. Appetite 2010, 54, 557–563. [Google Scholar] [CrossRef] [Scilit] [PubMed]
  17. Marckhgott, E.; Kamleitner, B. Matte Matters: When Matte Packaging Increases Perceptions of Food Naturalness. Mark. Lett. 2019, 30, 167–178. [Google Scholar] [CrossRef] [Scilit]
  18. Saintives, C.; Méral, H. Is It Really Natural? How Minimalist Food Packaging Influences Consumers’ Perception of Product Naturalness. Br. Food J. 2024, 126, 3888–3905. [Google Scholar] [CrossRef] [Scilit]
  19. Osgood, C.E. Semantic Differential Technique in the Comparative Study of Cultures. Am. Anthropol. 1964, 66, 171–200. [Google Scholar] [CrossRef] [Scilit]
  20. Stoklasa, J.; Talášek, T.; Stoklasová, J. Semantic Differential for the Twenty-First Century: Scale Relevance and Uncertainty Entering the Semantic Space. Qual. Quant. 2019, 53, 435–448. [Google Scholar] [CrossRef] [Scilit]
  21. Vecchio, R.; Annunziata, A.; Parga Dans, E.; Alonso González, P. Drivers of Consumer Willingness to Pay for Sustainable Wines: Natural, Biodynamic, and Organic. Org. Agric. 2023, 13, 247–260. [Google Scholar] [CrossRef] [Scilit]
  22. Judd, C.M.; Westfall, J.; Kenny, D.A. Experiments with More Than One Random Factor: Designs, Analytic Models, and Statistical Power. Annu. Rev. Psychol. 2017, 68, 601–625. [Google Scholar] [CrossRef] [Scilit] [PubMed]
  23. R Core Team. R: A Language and Environment for Statistical Computing; R Foundation for Statistical Computing: Vienna, Austria, 2025. [Google Scholar]
Figure 1. Heatmap of factor loadings for the two-factor solution obtained from the participant-level exploratory factor analysis. Colors indicate the magnitude and direction of factor loadings, and values displayed within cells represent the corresponding loading coefficients. White text is used for loadings with an absolute value greater than 0.50 to highlight primary loadings. The factor labeled Classicness was characterized primarily by Formal, Grownup, Luxury, and Old, whereas the factor labeled Delicateness was characterized primarily by Pure, Smooth, Feminine, and low Boldness. Complete numerical loadings are reported in Table A2.
Beverages 12 00103 g001
Figure 2. Perceptual maps of the seven wine labels based on the Classicness and Delicateness dimensions. (a) Study 1 (novice consumers). (b) Study 2 (experienced wine consumers and wine professionals). Wine-label positions are based on wine-level mean factor scores derived from the participant-level factor structure obtained in Study 1. The figure illustrates the relative positions of the wine labels within the two-dimensional perceptual space in each study.
Beverages 12 00103 g002
Figure 3. Relationships between wine-level mean factor scores and perceived naturalness among novice consumers in Study 1: (a) Association between Delicateness and perceived naturalness. (b) Association between Classicness and perceived naturalness. Solid lines indicate fitted regression lines, and shaded areas indicate 95% confidence intervals.
Beverages 12 00103 g003
Figure 4. Participant-level distributions of Classicness, Delicateness, and perceived naturalness for each wine label in Study 1. Violin densities and boxplots summarize the distributions of participant-level observations. Individual participant ratings are shown as small gray points, whereas large black points indicate wine-level mean values.
Beverages 12 00103 g004
Figure 5. Relationships between wine-level mean factor scores and perceived naturalness among experienced wine consumers and professionals in Study 2: (a) Association between Delicateness and perceived naturalness. (b) Association between Classicness and perceived naturalness. Solid lines indicate fitted regression lines, and shaded areas indicate 95% confidence intervals.
Beverages 12 00103 g005
Figure 6. Participant-level distributions of Classicness, Delicateness, and perceived naturalness for each wine label in Study 2. Violin densities and boxplots summarize the distributions of participant-level observations. Individual participant ratings are shown as small gray points, whereas large black points indicate wine-level mean values.
Beverages 12 00103 g006
Figure 7. Number of participants classifying each wine label as a natural wine in Study 2. Labels above bars indicate both the observed frequency and the corresponding proportion. The dashed line indicates the 50% response threshold (5.5 of 11 participants). The figure shows the underlying discrete response counts on which the natural wine categorization rates were based.
Beverages 12 00103 g007
Figure 8. Relationships between wine-level mean factor scores and natural wine categorization among experienced wine consumers and professionals in Study 2: (a) Association between Delicateness and natural wine categorization. (b) Association between Classicness and natural wine categorization. Solid lines indicate fitted regression lines, and shaded areas indicate 95% confidence intervals.
Beverages 12 00103 g008
Figure 9. Relationship between perceived naturalness and natural wine categorization among experienced wine consumers and professionals in Study 2. Solid lines indicate fitted regression lines, and shaded areas indicate 95% confidence intervals.
Beverages 12 00103 g009
Table 1. Visual and informational elements of the wine labels used as stimuli.
StimulusGeographic
Information
VintageGrape VarietyIllustrationLogo/EmblemDominant Visual Characteristics
S1Chateauneuf-du-PapeNot
indicated
Not
indicated
AbsentCrestText-centered, formal, information-rich
S2Chile2022“Organic”
Pinot Noir
Bicycle, flowers, and butterfliesAbsentIllustration-centered, decorative
S3Not indicatedNot
indicated
Not
indicated
Astronaut
holding a hoe
AbsentLarge illustration, minimal product information
S4Yoichi-Nobori, Hokkaido, Japan2022Pinot NoirAbsentCrestText-centered,
formal
S5Vin de France2022Not
indicated
Pop-style figure squeezing grapes and drinking the juiceAbsentCasual illustration-centered
S6Adelaide Hills2016ShirazAbsentAbsentText-centered,
formal
S7Not indicated2022Not
indicated
AbsentProducer logoMinimalist,
logo-centered
Note: None of the labels displayed explicit certification marks related to organic, biodynamic, natural wine, or sustainability claims. One label (S2) included the textual descriptor “Organic”, which may have functioned as an explicit production-related cue.
Table 2. Summary of wine-level regression models.
OutcomeStudyPredictorEstimateSE95% CIp
Perceived
Naturalness
Study 1Classicness0.360.15[−0.07, 0.79]0.080
Delicateness0.970.23[0.34, 1.59]0.013
Study 2Classicness−0.090.19[−0.61, 0.43]0.649
Delicateness0.580.23[−0.06, 1.22]0.066
Natural Wine
Categorization
Study 2Classicness−1.280.44[−2.18, −0.44]0.004
Delicateness0.510.50[−0.46, 1.54]0.307
Note: Study 1 perceived naturalness model: F(2, 4) = 9.34, p = 0.031, R2 = 0.824, Adjusted R2 = 0.735. Study 2 perceived naturalness model: F(2, 4) = 5.98, p = 0.063, R2 = 0.750, Adjusted R2 = 0.624. The Study 2 natural wine categorization model was estimated using a binomial generalized linear model because categorization was derived from discrete response counts. Null deviance = 49.22, residual deviance = 29.06, AIC = 47.41.
Table 3. Summary of participant-level mixed-effects models.
OutcomeStudyPredictorEstimateSE95% CIpParticipant Var.Wine Var.Residual Var.
Perceived
Naturalness
Study 1Classicness0.270.10[0.08, 0.46]0.0070.6030.0261.252
Delicateness0.670.09[0.49, 0.85]<0.001
Study 2Classicness−0.050.13[−0.31, 0.20]0.6840.1290.1070.565
Delicateness0.150.09[−0.03, 0.33]0.112
Natural Wine
Categorization
Study 2Classicness−0.320.47[−1.24, 0.59]0.4900.0224.593
Delicateness0.140.32[−0.48, 0.75]0.664
Note. Estimates and standard errors are taken from participant-level mixed-effects models with random intercepts specified for participants and wine labels. Confidence intervals are Wald 95% confidence intervals. Participant Var., Wine Var., and Residual Var. indicate variance components for the corresponding model. Residual variance is reported for linear mixed-effects models only and is not estimated for the binomial generalized linear mixed-effects model used for natural wine categorization.
Disclaimer/Publisher’s Note: The statements, opinions and data contained in all publications are solely those of the individual author(s) and contributor(s) and not of MDPI and/or the editor(s). MDPI and/or the editor(s) disclaim responsibility for any injury to people or property resulting from any ideas, methods, instructions or products referred to in the content.