Article

Photodegradation of Retsina Wine: Does Pine Resin Protect Against Light-Induced Changes?

1
Department of Wine, Vine and Beverage Sciences, School of Food Science, University of West Attica, Ag. Spyridonos str, Egaleo, 12243 Athens, Greece
2
Metabolomics Unit, Research and Innovation Centre, Fondazione Edmund Mach, via E. Mach 1, 38010 San Michele all’Adige, Italy
*
Author to whom correspondence should be addressed.
Beverages 2025, 11(5), 139; https://doi.org/10.3390/beverages11050139
Submission received: 5 August 2025 / Revised: 11 September 2025 / Accepted: 15 September 2025 / Published: 22 September 2025
(This article belongs to the Special Issue Recent Research in Wine Aroma)

Abstract

Retsina is a wine deeply rooted in Greek tradition, often misunderstood, and exclusively produced in Greece by adding pine resin to the must. Typically, it is bottled in flint glass bottles, although it is known that light can damage wine aroma compounds. However, the effect of light exposure in Retsina wines has never been studied. It remains unknown whether the enrichment with resin-derived compounds can protect Retsina from photodegradation. The main aim of this work was to study the behavior of Retsina’s volatile components when stored in flint glass bottles, and so 12 Retsina wines, prepared with three levels of resin addition, were stored for four weeks under light exposure in flint (clear) glass bottles or protected by light in a box, and then they were analyzed by a GC-MS/MS method. Some compounds were influenced by resin addition, others by light exposure and a few by both conditions. Several terpenes increased with resin addition but decreased due to light exposure, while norisoprenoids decreased under light exposure. Some esters were reduced due to resin addition, and 2-aminoacetophenone was increased by light exposure. The study demonstrated that flint glass bottles should be avoided, as resin does not provide sufficient protection against photodegradation.

Graphical Abstract

1. Introduction

Retsina is one of Greece’s most distinctive wines, with a history spanning over 4000 years. Archeological and historical evidence suggests that the use of pine resin (Pinus halepensis) in winemaking dates back to antiquity, primarily as a preservation method [1,2,3]. Retsina is produced using a distinct winemaking process that involves the controlled addition of Aleppo pine resin (Pinus halepensis) to the fermenting must. This occurs before the sugar content depletes to two-thirds of its initial concentration, and after fermentation the resin and other solids are meticulously removed, and the wine is clarified and stabilized following conventional white or rosé winemaking protocols. The resin infusion imparts the characteristic balsamic aroma and contributes to the wine’s oxidation stability [4,5,6]. Retsina holds Traditional Specialty Guaranteed (TSG) status within the European Union (EU), protecting its unique production process and regional identity [7]. According to Greek legislation, Retsina must be produced exclusively within Greece from grape must infused with pine resin [8,9].
Retsina wines have a distinctive and complex aroma profile that is dominated by pine, fir, balsamic, and resinous notes, with subtle citrus, floral, and herbal undertones. Their volatile composition is shaped by both the grape variety and the resin-derived terpenes, with the key aroma compounds including linear and cyclic terpenes (e.g., linalool, limonene, 1,4-cineole, α-terpineol, terpinen-4-ol and p-cymene), ethyl and acetyl esters, and volatile phenols. Next to the volatile compounds, resin enriches the wine with several phenols (e.g., flavan-3-ols, phenolic acids, and flavonols) with sensory and antioxidant properties [5,10,11,12,13,14,15].
Although it is known that light can damage wine aroma compounds, Retsina wines are typically bottled in flint glass bottles. In fact, light exposure significantly affects the chemical stability and aromatic profile of wines, particularly those in flint glass, which provides minimal protection against ultraviolet (UV) and visible light. This phenomenon, known as light-strike, triggers a series of photochemical reactions that degrade key aroma compounds, leading to undesirable sensory changes [16,17,18,19]. Terpenes, norisoprenoids, and esters, which are responsible for fruity and floral notes in wines, are among the most vulnerable to photodegradation [20]. The behavior of numerous white wines bottled in flint glass without resin has already been reported in detail [20]. On the other hand, some studies have suggested using antioxidants, such as phenolic compounds, as potential protection against light-strike [19,21,22,23]. Therefore, it remains unclear whether enriching the wine with resin-derived phenolic compounds (antioxidants) and terpenes can safeguard it from photodegradation.
To address this gap, this project aimed to study the behavior of Retsina’s volatile components when stored in flint glass bottles. To achieve this goal, 12 Retsina wines were used as a sample set, which had different amounts of resin added. For the analysis of the samples after the light exposure a state-of-the-art fast GC-MS/MS protocol that enables the absolute concentration of 74 volatile compounds [24].

2. Materials and Methods

2.1. Experimental Design

The sample set of the study was based on 12 wines prepared with different resin additions. Four wines were prepared with 0.1 g/L of resin, three with 0.3 g/L, four with 0.5 g/L and one wine with 0.7 g/L. The initial Assyrtiko grape must, and the resin used were the same for all the wines; the wines with the same resin addition were biological replicates, and for statistical purposes, the wines with 0.5 and 0.7 g/L resin addition were considered as one group. The winemaking was made in semi-industrial scale in the winery of Nikolou. The basic enological analysis of the wines can be found in Supplementary Table S1. From each batch of wine two flint glass bottles (clear glass, 100 mL bottles with screw cap) were filled, until their maximum capacity. One bottle was exposed to artificial and natural light during storage, and the other was stored in the same room but inside a box to protect it from light. The storage room had natural daylight through a window (no curtain) and artificial lamps that were switched on daily from 9:00 to 19:00. During this period the wines were stored at room temperature (25 ± 3 °C). After four weeks of these storage conditions, the samples were directly prepared and analyzed.

2.2. Sample Preparation and Extraction

Sample preparation and extraction of the free aroma compounds were performed according to the method described in Carlin et al. [24]. Solid-phase extraction was performed using Isolute® ENV+ (Biotage, Uppsala, Sweden) cartridges filled with 200 mg of stationary phase and pre-conditioned with 4 mL of dichloromethane, followed by 4 mL of methanol and 4 mL of model wine (12% vol of ethanol, 3 g/L tartaric acid, and pH 3.5). A total of 50 mL of wine was mixed with 100 μL of internal standard (n-heptanol 250 mg/L) and loaded onto the cartridge, which was then washed with 3 mL of water. The cartridges were dried for 10 min and eluted with 2 mL of dichloromethane directly into the injection vials. For resin characterization, 20 mg of the pine resin used in winemaking were dissolved in 50 mL of a model wine solution. The solution was left overnight and subsequently processed following the same extraction protocol as applied to the wine samples. All chemicals were purchased from Sigma-Aldrich (St. Luis, MO, USA).

2.3. GC-MS/MS Analysis

Analysis was performed using an Agilent Intuvo 9000 Gas Chromatography (GC) system coupled to an Agilent 7010B triple quadrupole mass spectrometer (Agilent Technology, Santa Clara, CA, USA). The system, from Agilent Technologies (Santa Clara, CA, USA), was equipped with an electron ionization (EI) source operating at 70 eV.
Chromatographic separation was achieved by injecting 1 μL of sample in split mode (1:10) into a DB-Wax Ultra Inert column (30 m × 0.25 mm i.d., 0.25 μm film thickness). The GC oven temperature was programmed as follows: an initial temperature of 40 °C was held for 2 min, then ramped up at 10 °C/min to 55 °C. The temperature then increased at 20 °C/min to 165 °C, followed by a 40 °C/min ramp to 240 °C, which was held for 1.5 min. Finally, the temperature was ramped at 50 °C/min to 250 °C and held for an additional 4 min, for a total runtime of 16 min.
Helium was used as the carrier gas at a flow rate of 1.2 mL/min. The transfer line and ion source temperatures were set at 250 °C and 230 °C, respectively. Mass spectra were acquired in Multiple Reaction Monitoring (MRM) mode. Nitrogen was used as the collision gas at a flow of 1.5 mL/min, with helium as the quench gas at 4.0 mL/min.
The Multiple Reaction Monitoring (MRM) parameters can be found in Supplementary Material Table S2. The data acquisition and subsequent quantification analyses were performed using the MassHunter Workstation software v10 (Agilent Technologies, Santa Clara, CA, USA) as previously described [24]. Each sample was analyzed twice.

2.4. Colorimetric Analysis

CIELAB color parameters (L* = lightness, a* = red–green, b* = yellow–blue, C* = chroma, h = hue) were measured using a Minolta Spectrophotometer CM 3500b (Konica Minolta, Osaka, Japan). For the analysis the undiluted wine was filtered with a 0.45 µm PTFE filter (Millipore, Darmstadt, Germany) and analyzed according to the OIV-MA-AS2-11 method with a 2 cm cuvette [25].

2.5. Statistical Analysis

Statistical analyses were performed using SPSS v19 (IBM Statistics). One-way ANOVA with post hoc Tukey’s Honest Significant Difference (HSD) test was used to evaluate differences among treatments within each factor. In addition, two-way ANOVA (full factorial model) was applied to assess the main effects of light exposure (Storage: light vs. dark), resin concentration (0.1 ≥ 0.5 g/L), and their interaction. Hypotheses with p-values < 0.05 were considered statistically significant.

3. Results

The targeted analytical protocol used was able to absolutely quantify 72 volatile compounds, which included terpenoids (linear and cyclic), norisoprenoids, ethyl and acetyl esters, acids, alcohols, aldehydes, lactones, volatile phenols, sulfur compounds and pyrazines. Only four analytes were below the method’s limit of detection. The remaining compounds could be grouped into five categories: (i) those that increased under light exposure, (ii) those that decreased under light exposure, (iii) those that increased with resin addition, (iv) those that decreased with resin addition, and (v) those that showed no statistically significant variation within the experimental design. The data from all statistical analyses (one-way and two-way Anova analysis) are presented in Supplementary Tables S3 and S4. The results of the resin analysis can be found in Supplementary Table S5.
Figure 1 shows two PCA plots, where Figure 1A (based on the PC1 and PC2) demonstrates the separation of the wines due to resin addition and Figure 1B (based on the PC1 and PC2) demonstrates separation due to light exposure. In fact, the PC3 explains the grouping of samples exposed to light on the bottom and those protected on top. The loading plot of the two PCA plots can be found as Supplementary Figures S1 and S2, and the Component Matrix of PC1-3 as Supplementary Table S6.
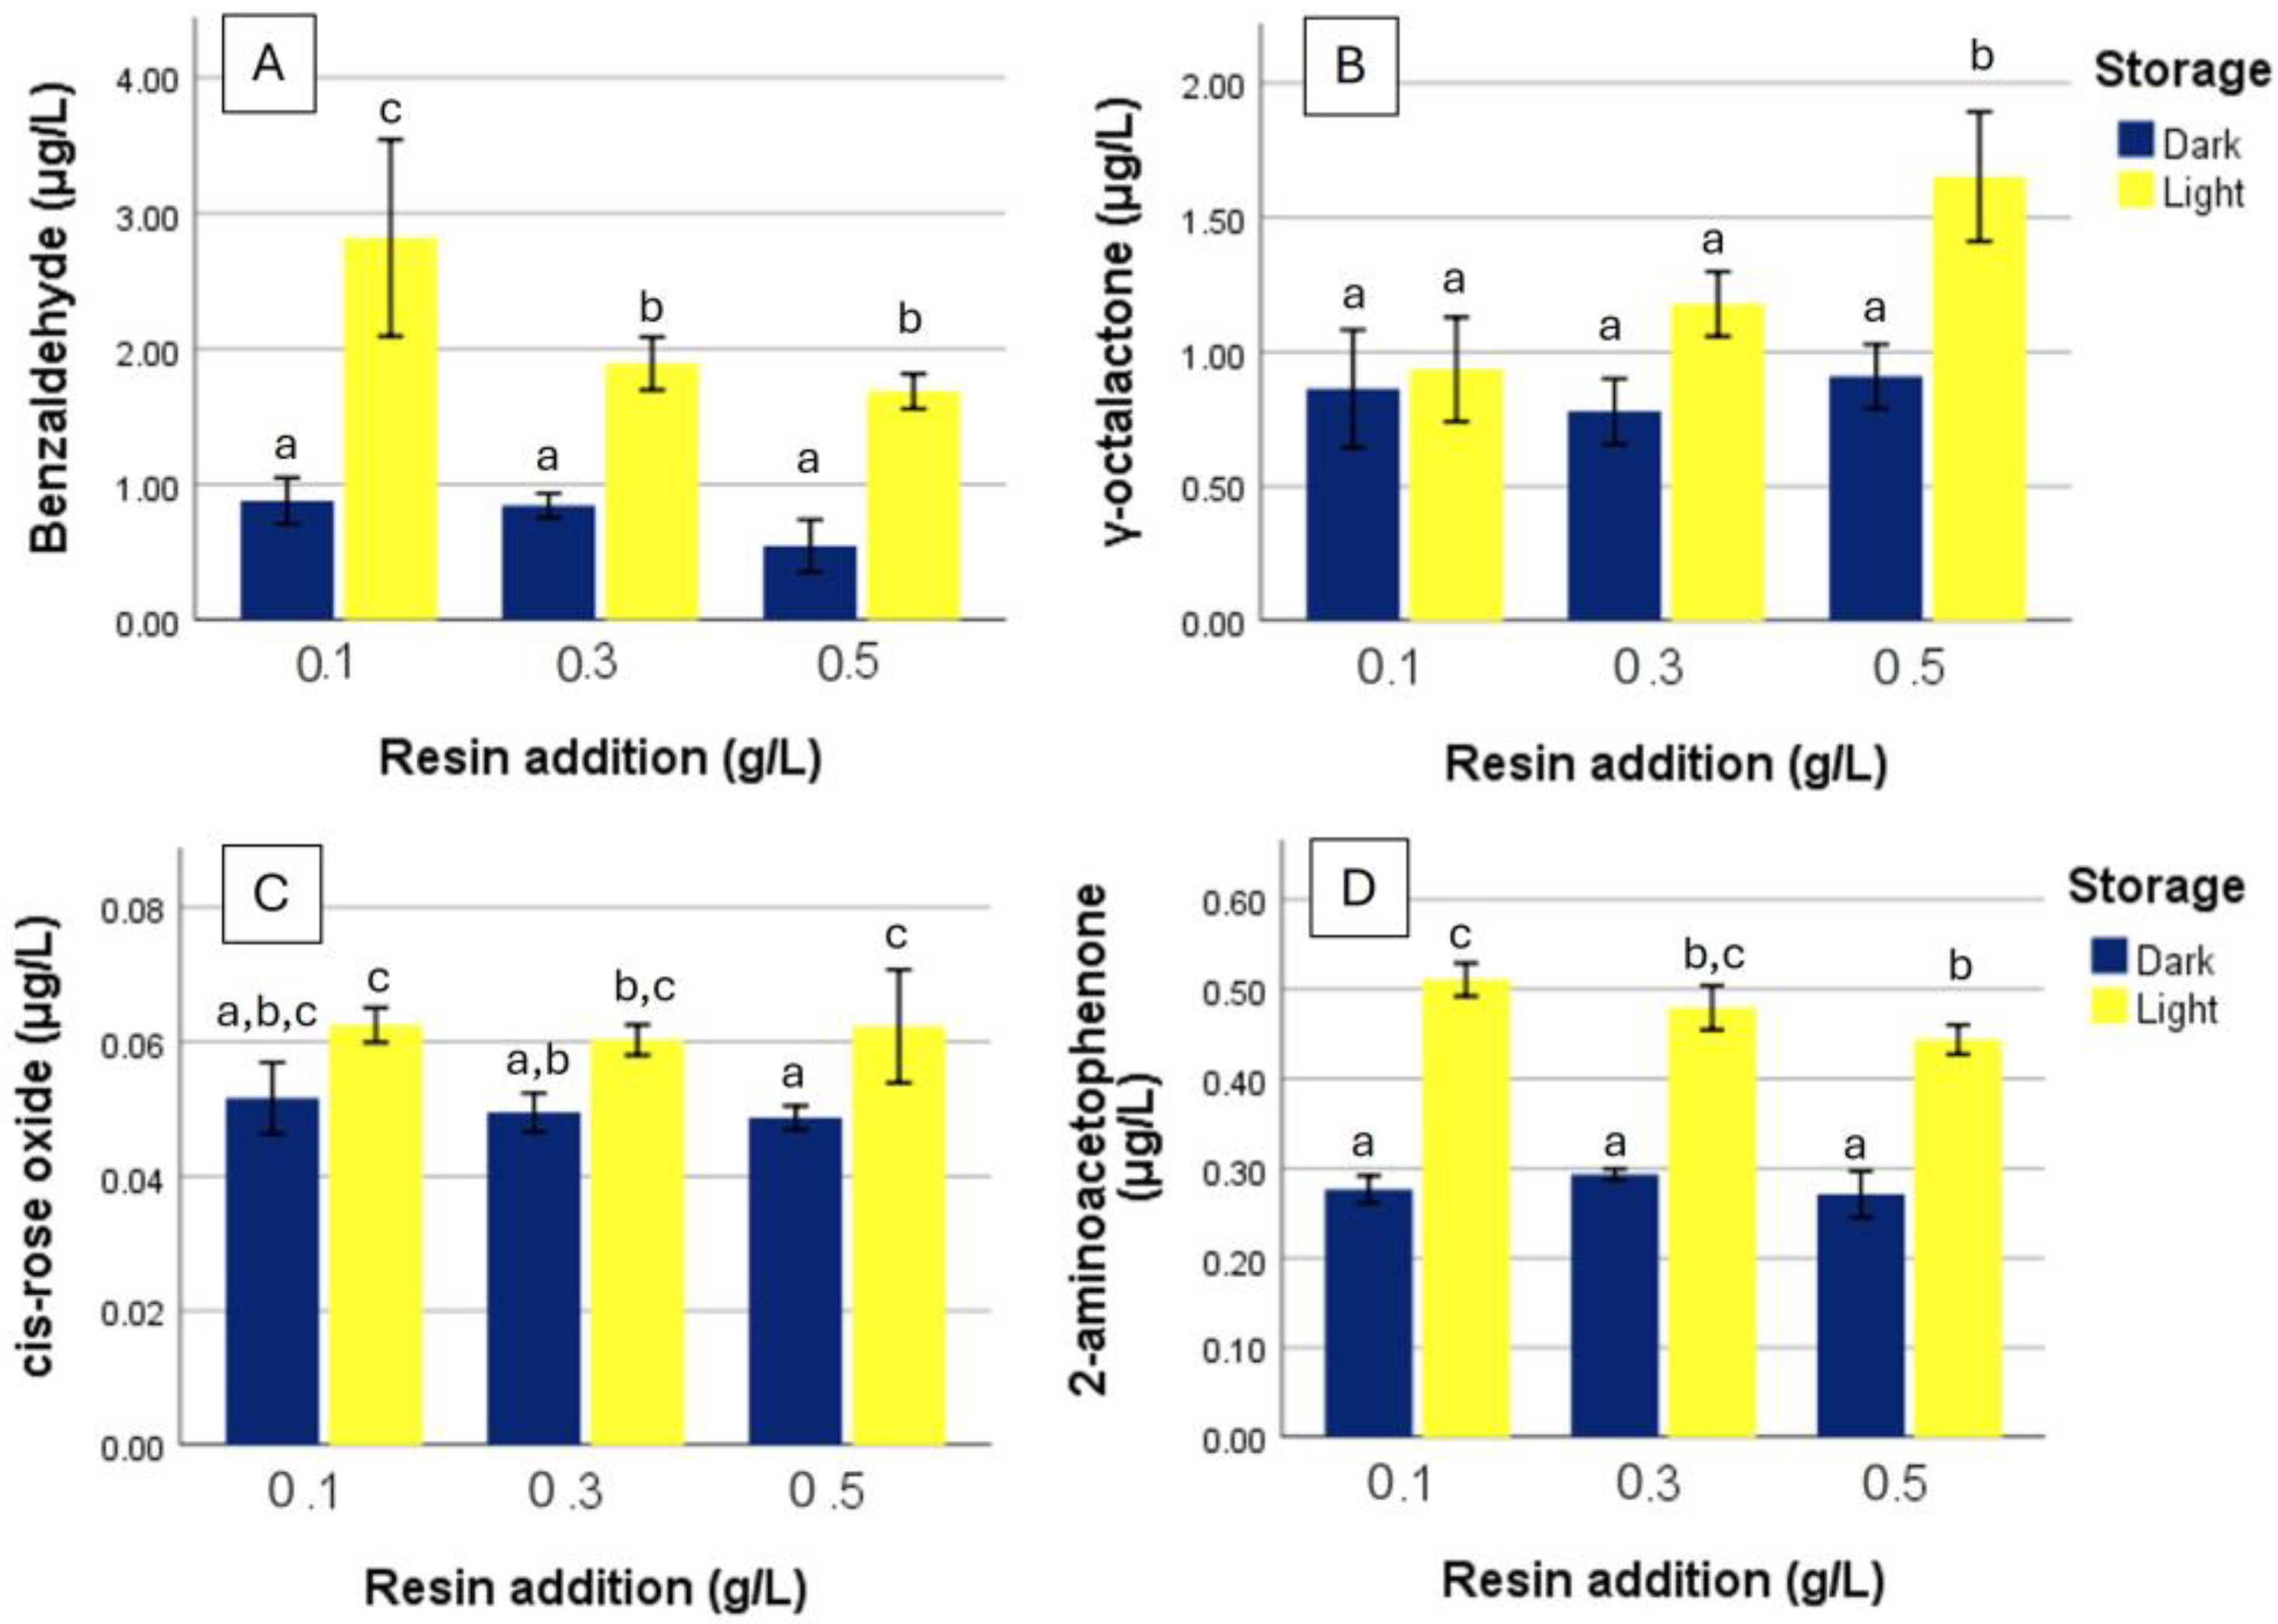
According to the loading plot of Figure 1B, the third principal component, which shows the separation between the samples exposed to light and the protected samples, was mainly dependent on 2-aminoacetophenone, benzaldehyde, cis-rose oxide, safranal, vitispiranes, 4-vinylguaiacol, and β-damascenone. The first three metabolites were increased due to the light exposure, and the others were decreased. The bar graphs of Figure 2, demonstrate in detail the behavior of metabolites that statistically significantly increased their concentration after the light exposure.
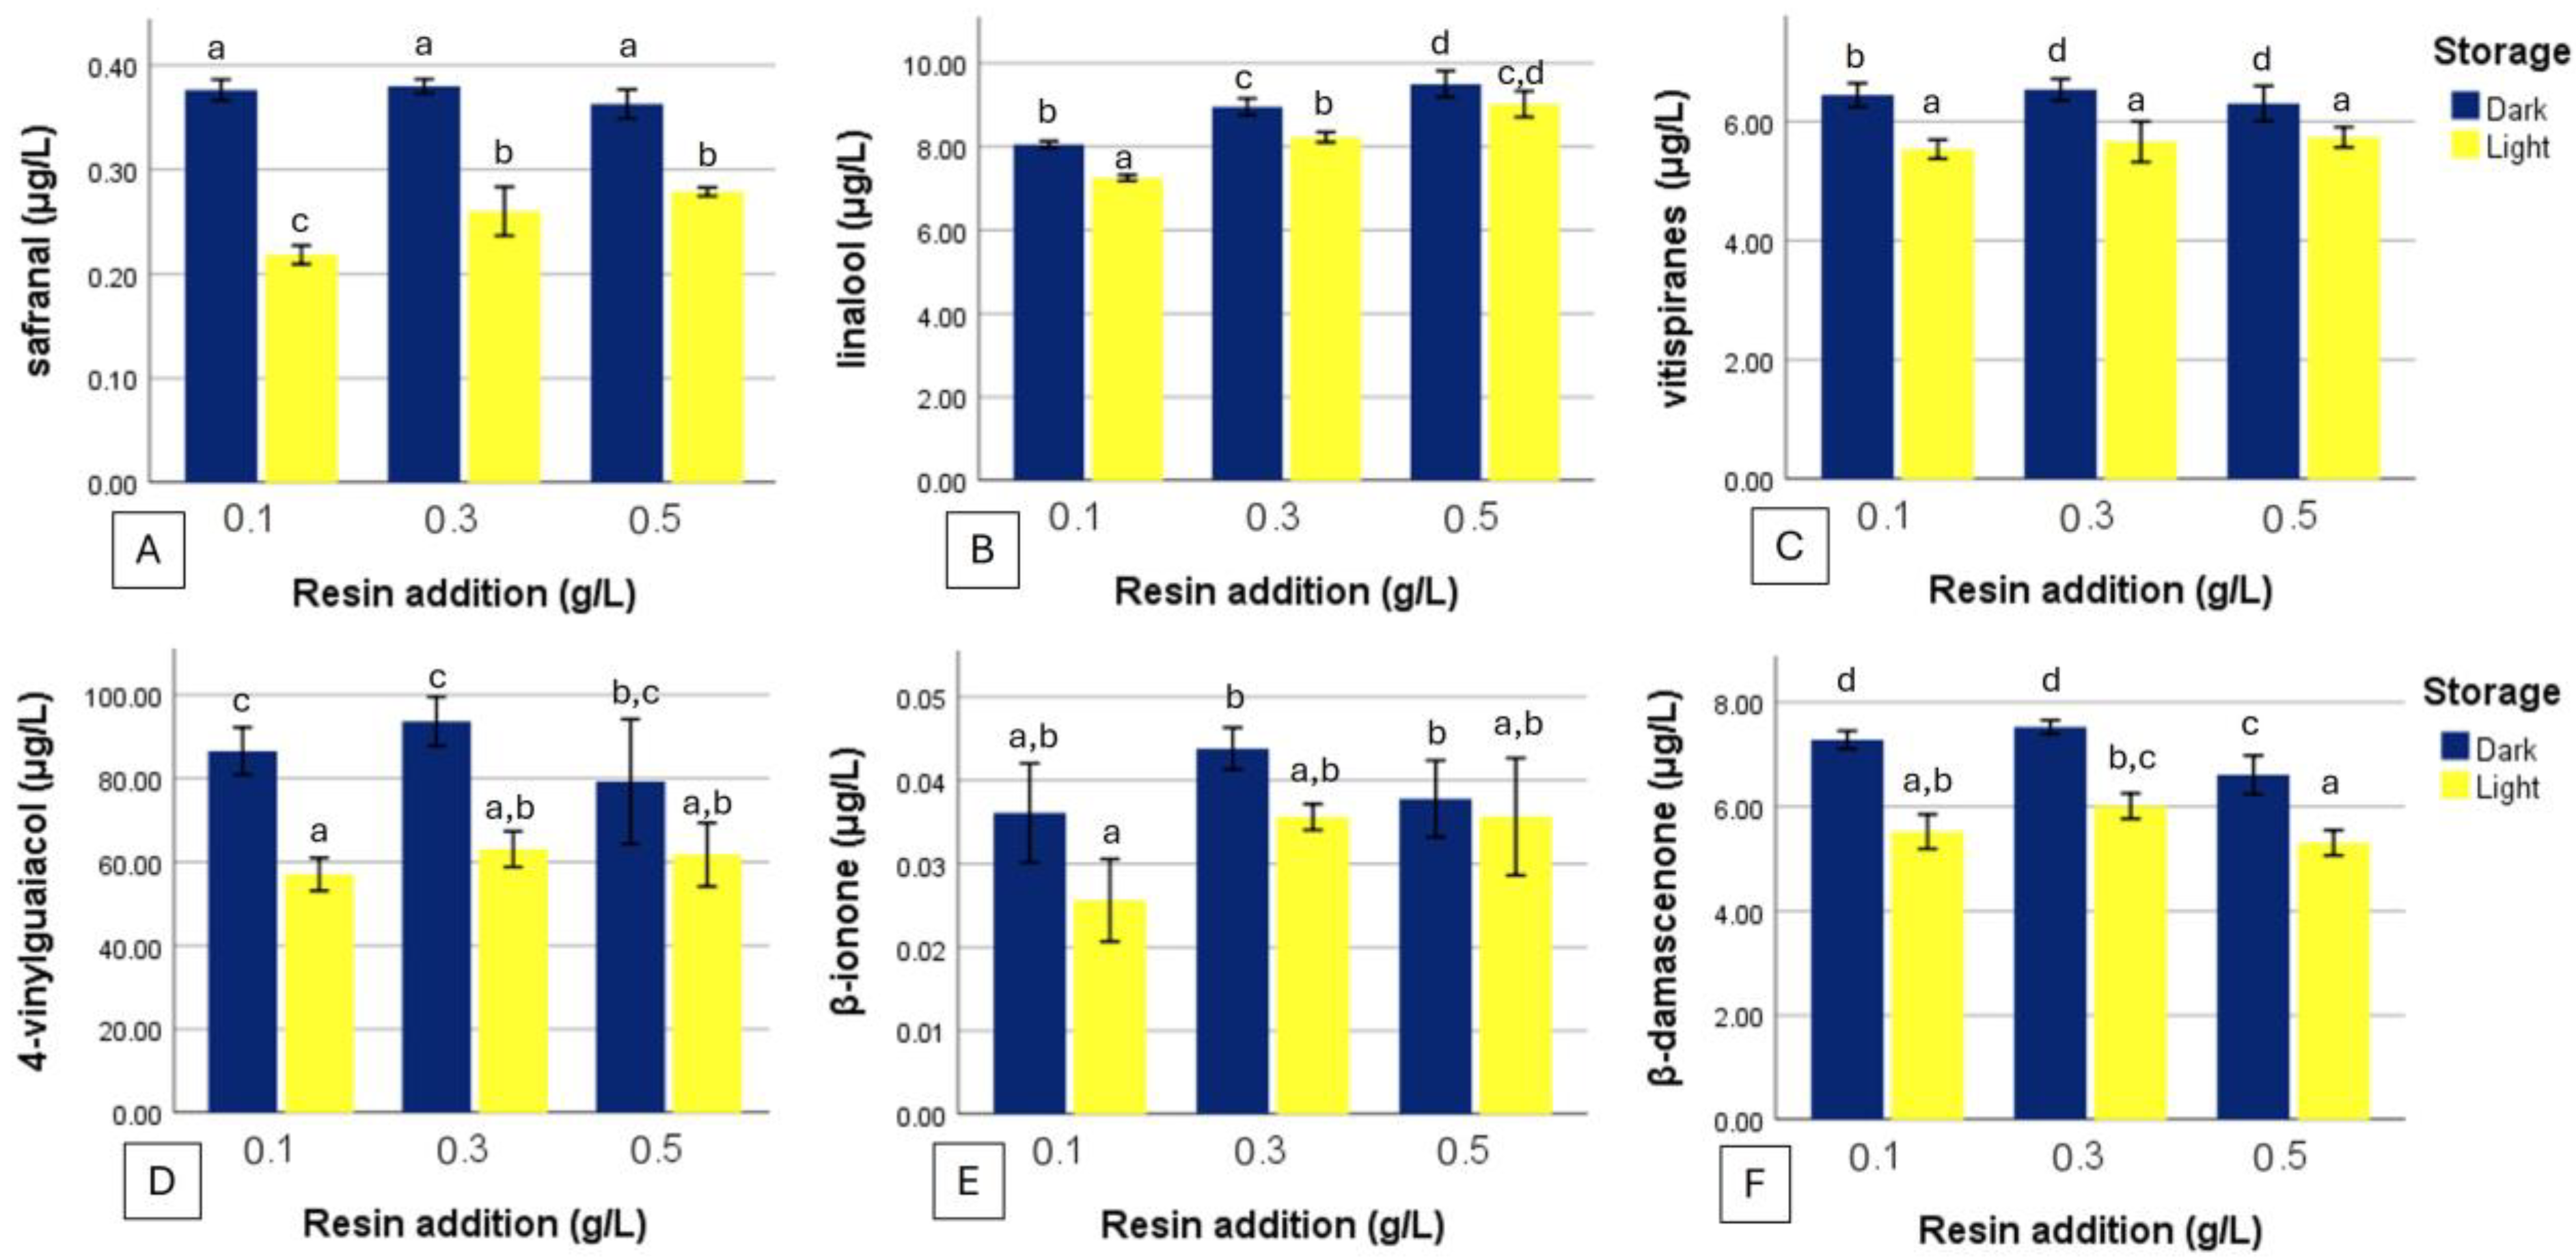
On the other hand, Figure 3 shows aroma compounds that decreased in concentration due to light exposure. The major chemical group was the norisoprenoids, which are known to be influenced by light exposure most probably due to their multiple double bonds [20,26].
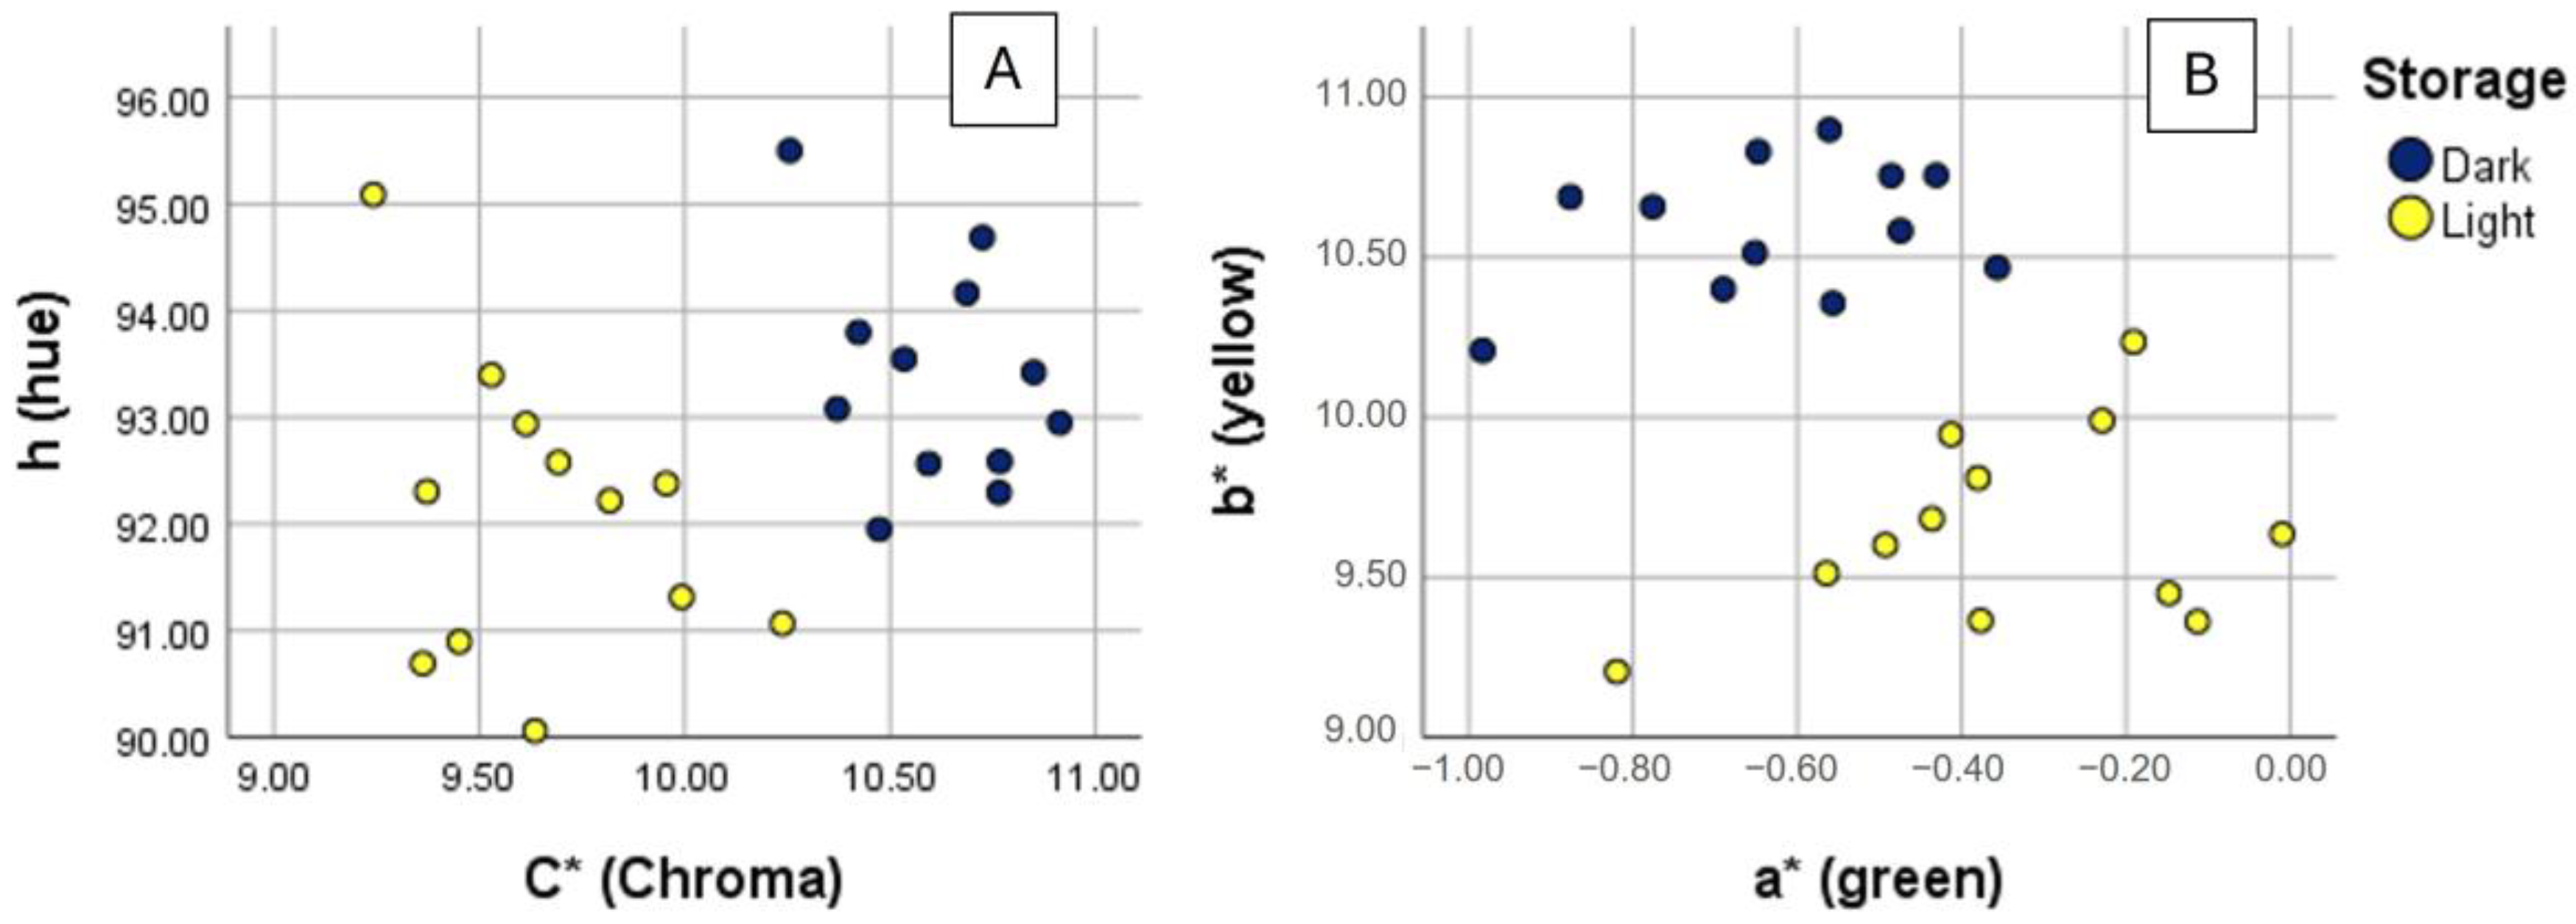
Next to the aroma compounds, the color of the samples was also influenced by light exposure. As shown in Figure 4, the wine samples stored under the light exposure were less yellow and their color was less intense. This difference in yellow color (b*) and color intensity/Chroma (C*) was statistically significant as shown in Table 1.
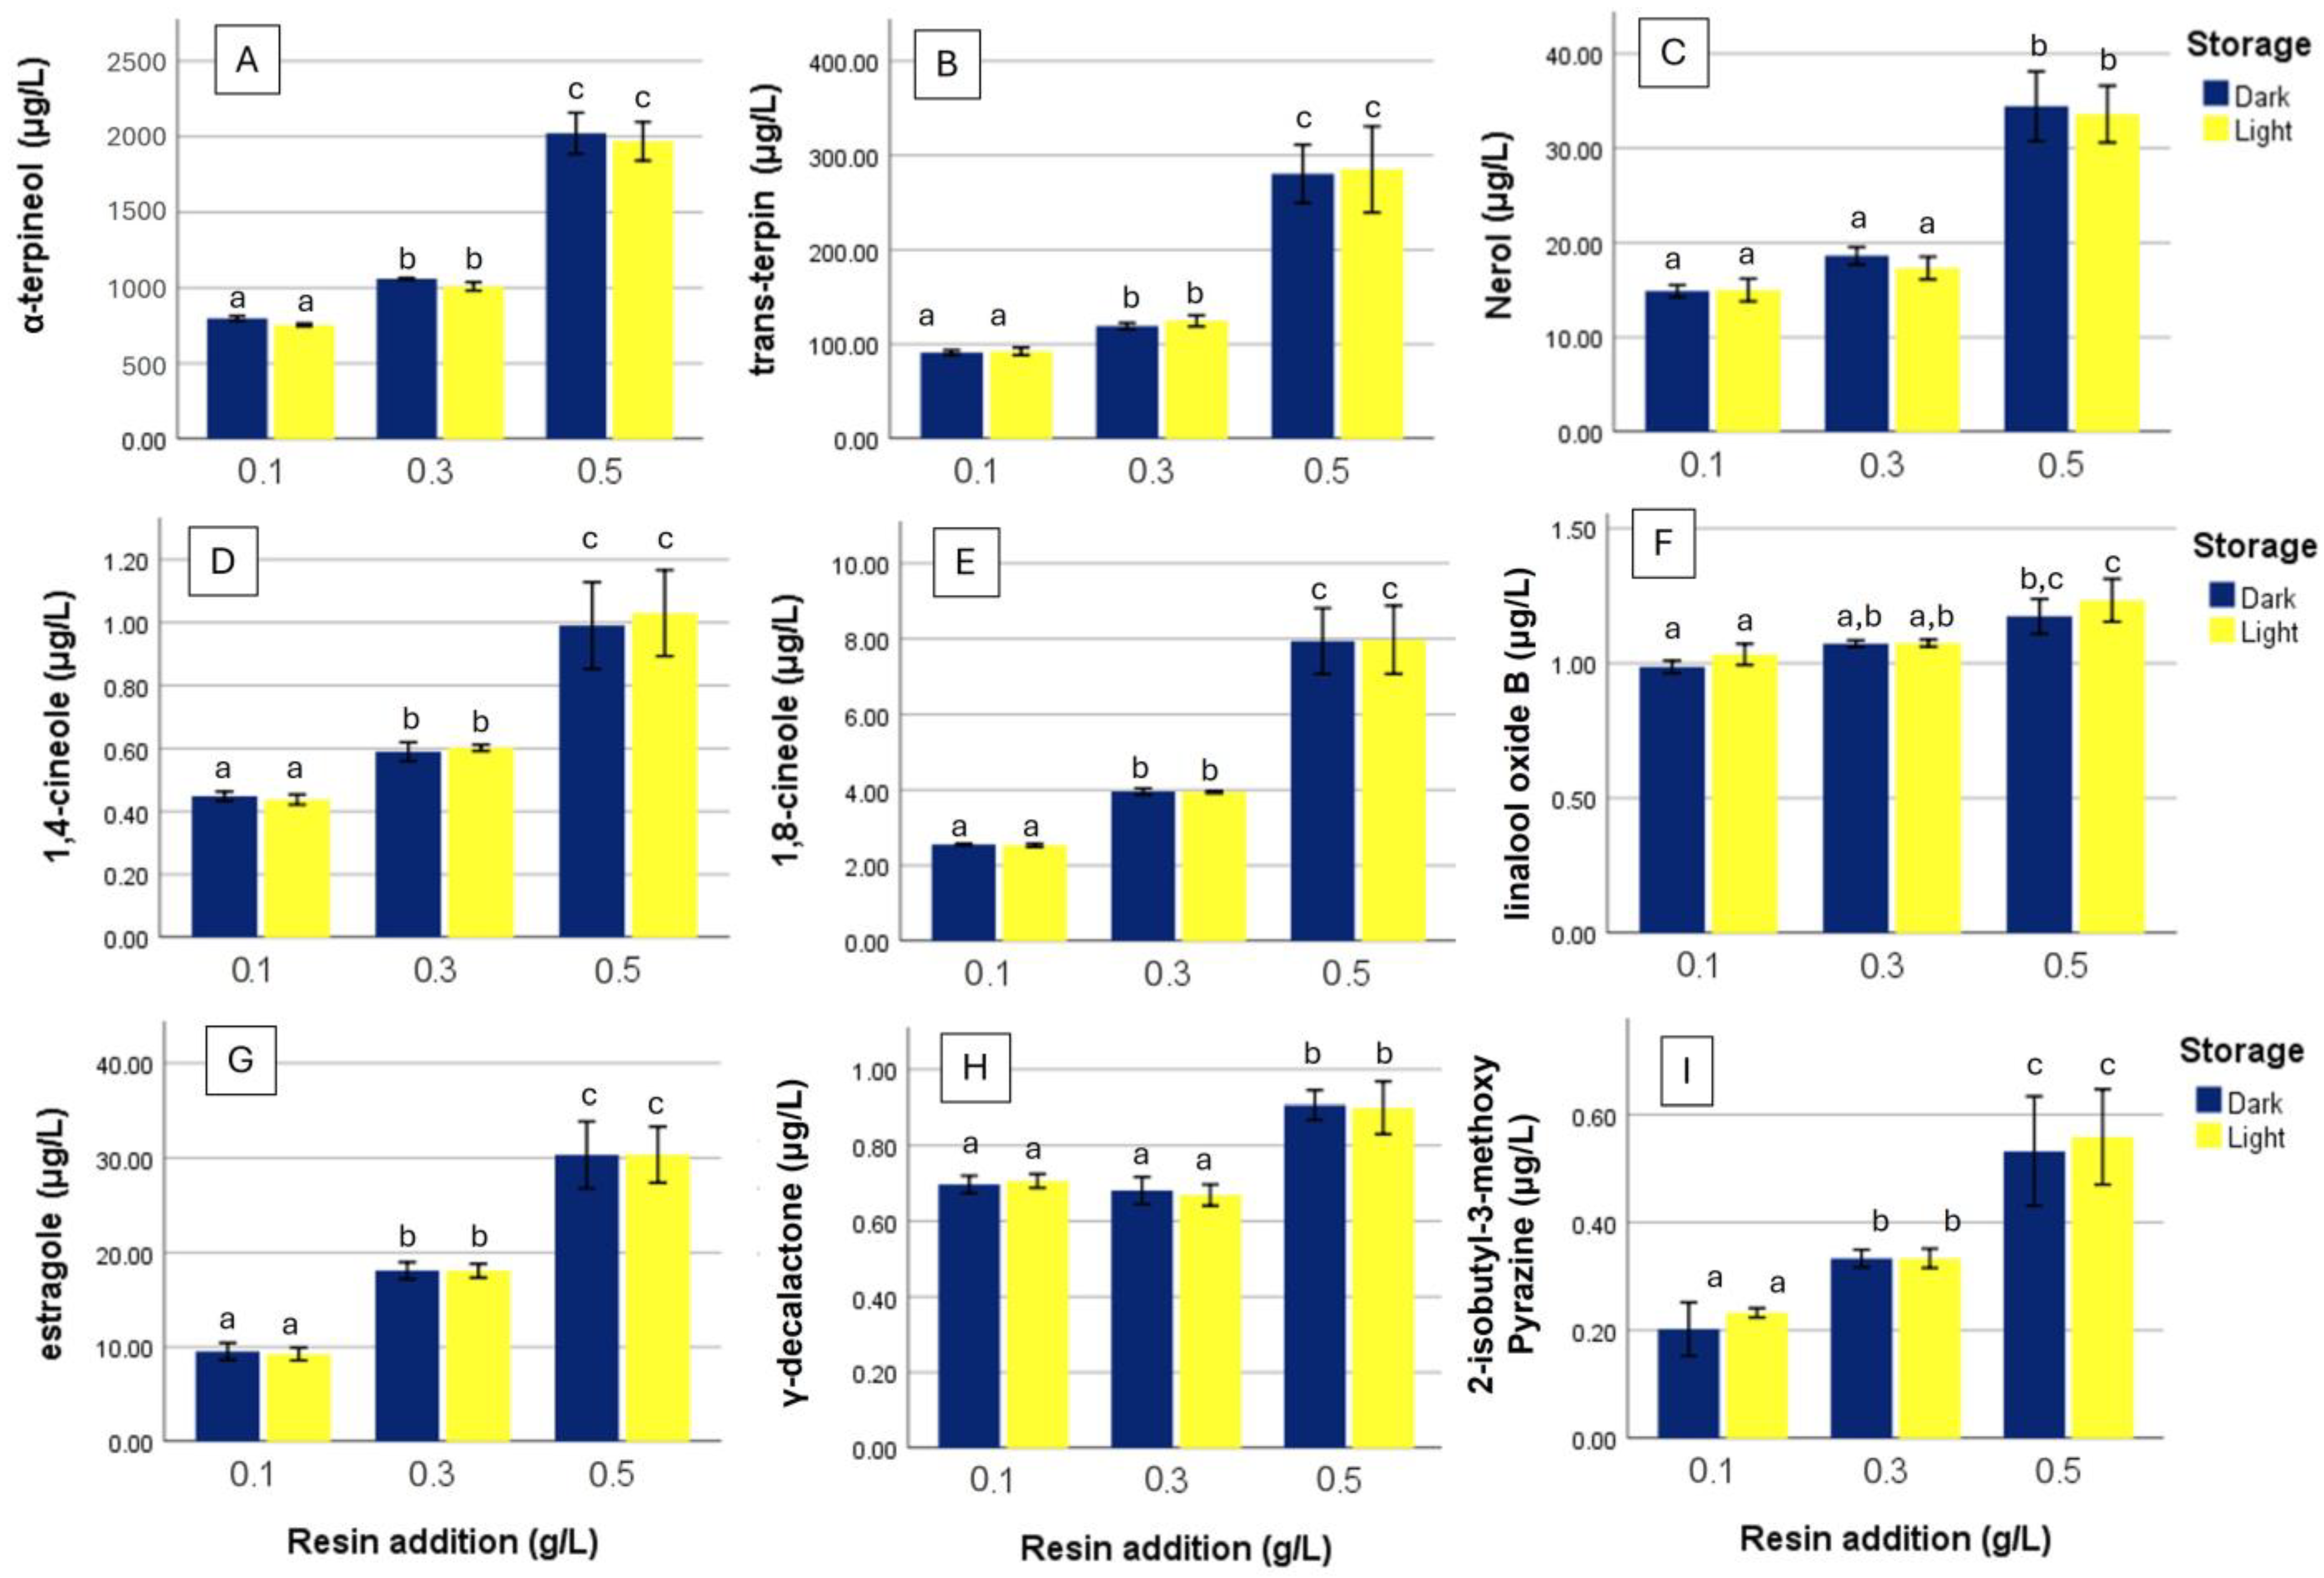
Since the wines that were the object of this study were also differentiated by resin addition, it was only possible to extract a few results regarding the influence of resin on the volatile profile of the samples. In fact, as shown in the PCA plot of Figure 1A, the wines were clustered according to their resin addition. The statistical analysis pointed out that this variation was due to the behavior of the terpenoids, such as α-terpineol, trans-terpin, nerol, 1,8-cineole, 1,4-cineole, linalool, linalool oxide B and p-cymene (Supplementary Table S3 and Figure 5).
As shown in Figure 5, the concentration of all these terpenoids increased as resin addition increased. Next to the terpenoids, between the aroma compounds, whose concentration increased due to the resin addition, were the volatile phenol estragole, γ-octalactone, and two pyrazines (Figure 5 and Supplementary Table S3). The opposite effect had few ethyl and acetyl esters, since their concentration decreased as the amount of resin addition increased (Figure 6 and Supplementary Table S3)

4. Discussion

As previously pointed out, the metabolites can be divided in different groups based on their behavior.

4.1. Light-Induced Compositional Changes

The first group includes compounds whose concentrations increased upon light exposure (Figure 2). Light can induce and catalyze several reactions, particularly in photosensitive compounds containing carbon–carbon double bonds. Terpenes, norisoprenoids, and phenols, which often contain one or more C=C bonds, are especially susceptible to photo-chemical reactions such as photo-oxidation, isomerization, hydrogen abstraction, addition, cycloaddition, and polymerization [26].
Benzaldehyde, a carbonyl compound with a perception threshold of 2 mg/L, is associated with marzipan or cherry aromas and can indicate contamination from epoxy-resin tanks or carbonic maceration [16]. In our experiment, benzaldehyde concentrations increased by approximately 311% (±112%) in light-exposed samples, suggesting its potential as a marker of photo-oxidative degradation in wines packaged in flint glass bottles. Two-way ANOVA further indicated a significant Packaging × Resin addition interaction, showing that the magnitude of this light-induced increase depended on resin concentration. This suggests that resin-derived antioxidants may partially modulate the oxidative pathway leading to benzaldehyde formation.
The aroma compound 2-aminoacetophenone was suggested to be formed by an oxidative pathway from indole-acetic acid, as it is the major factor responsible for the off-flavor of atypical aging (corn tortilla, mothball or acacia aroma) and has a detection threshold in wine of around 0.5 µg/L [16,27]. On average, 2-aminoacetophenone increased from 0.28 ± 0.02 µg/L to 0.47 ± 0.03 µg/L (about +170%) due to the light exposure. Previous studies have found that 2-aminoacetophenone can be positively influenced by light exposure and high temperature storage [20]. Two-way ANOVA revealed a significant Packaging × Resin addition interaction, suggesting that resin concentration modulated the extent of light-induced 2-aminoacetophenone formation. This effect may be linked to the antioxidant properties of resin phenolics, which could partially suppress the oxidative pathway leading to this off-flavor compound.
The monoterpenoid compound cis-Rose oxide is known for its distinctive lychee and geranium aromas. In our study, light exposure led to an increase in cis-rose oxide concentrations across all samples stored in flint glass bottles (Figure 2C), although levels remained below the sensory threshold of 0.2 µg/L [16]. Despite being relatively stable in wine stored at high temperatures [28], it has been demonstrated that it can be produced by the photooxidation of citronellol [29,30]. In our study, the concentration of pine resin used had no statistically significant impact on rose oxide, suggesting that light-induced formation or precursor release played a dominant role.
A particularly interesting result is the increase in γ-octalactone in light-exposed samples, especially at the highest resin dose (Figure 2B). This lactone, formed via intramolecular esterification of hydroxycarboxylic acids under acidic conditions, may also result from photo-oxidation-promoted transformations [16,31]. Resin addition may enhance the lipid content of the wine, increasing precursor availability for lactone formation, as also supported by the significant packaging × resin addition interaction.

4.2. Degradation of Sensitive Aroma Compounds Under Light Exposure

The second group comprises compounds whose concentrations decreased upon light exposure (Figure 3). This group consists primarily of norisoprenoids such as safranal (saffron aroma), β-damascenone (aroma enhancer), β-ionone (violet aroma), and vitispiranes (camphor, eucalyptus aromas). These compounds are known contributors to varietal character [16,32,33,34]. Their degradation, by up to 40%, confirms our previous findings in Chardonnay and Pinot Gris wines [20], representing a significant loss of aromatic identity. Interestingly, higher resin concentrations appeared to offer a protective effect, particularly for safranal and β-ionone, as concentration differences between light-exposed and protected wines decreased with increasing resin levels.
The volatile phenol 4-vinylguaiacol gives wheat beer a spicy note of clove aroma with a threshold at 40 μg/L [16]; this is sometimes unwanted in wines, but in small concentrations, it gives pleasant aromas for Retsina. In accordance with our previous experience [20], 4-vinylguaiacol concentration decreased by 15–20% due to light exposure, but the resin does not seem to affect it.
Finally, linalool, a crucial terpene for aromatic varieties, exhibited a small decrease (5–10%) after light exposure. However, this loss was less pronounced at higher resin doses, suggesting a protective or enhancing effect. Carlin et al. reported more severe degradation of linalool in Pinot Gris and Chardonnay [20], while in our study, the Assyrtiko cultivar—also neutral in aroma [34,35]—showed relatively smaller losses, likely due to matrix differences or resin mitigation.

4.3. Compounds Enhanced by Resin Addition

The third group belonged to the aroma compounds whose concentration increased due to the resin addition. As shown in Figure 5, most of these volatile metabolites belonged to the class of linear, cyclic and bicyclic terpenoids, like α-terpineol, trans-terpin nerol, 1,4-cineole, 1,8-cineole and linalool oxide B. For α-terpineol, which its concentration was measured in a few samples up to 2 mg/L, light-induced loss was minimal, while resin addition nearly tripled its concentration from 0.1 to 0.5 g/L. The cyclic and bicyclic trans-terpin, 1,4-cineole and 1,8-cineole, are known to be very stable terpenoids [28,36], to give to Retsina wines its characteristic balsamic, herbal, eucalyptus, and bay leaf notes [11,12], and have a relative low perception threshold [16]. Estragole is a volatile phenol with anise-like and herbaceous aroma, threshold of 16 μg/L [37], which concentration also increased due to the resin addition, passing from about 9 to over 30 μg/L. A pyrazine (2-isobutyl-3-methoxy pyrazine), was in the same behavior group, and according to our knowledge it was detected for the first time in Retsina wines.
The resin analysis confirmed the presence of several volatile compounds that also increased in the wines with resin addition, including monoterpenes such as trans-terpin, linalool, linalool oxide B, α-terpineol, nerol, D-limonene, estragole, and terpinen-4-ol. This indicates that resin is a direct source of these metabolites (Table S5).

4.4. Compounds Reduced by Resin Addition

The last group included metabolites that were negatively affected by resin addition (Figure 6). Interestingly, this group have metabolites produced by the yeasts during the alcoholic fermentation, such as the acetyl ester of phenylethanol, the ethyl ester of heptanoic acid, and the alcohol 4-ethylphenol. Esters are known to contribute to the fruity secondary aroma of wines, and it has been previously reported that alcoholic fermentation in the presence of pine resin or herbs influence their biosynthesis [2,15,38]. The decrease of 4-ethylphenol concentration could be an indication of antimicrobial activity of the resin against the microorganisms that can produce it, a hypothesis further supported by the significant Resin effect detected in the two-way ANOVA.
Interaction terms (packaging × resin addition) were generally not significant, confirming that light exposure was the dominant factor across resin levels. Only a few compounds (benzaldehyde, γ-octalactone, 2-aminoacetophenone, 4-ethylphenol, and safranal) showed significant interactions, indicating that resin concentration modulated their light response (Table S4). These effects may reflect different mechanisms, including antioxidant and antiradical activity of resin metabolome, antimicrobial effects against 4-ethylphenol–producing microorganisms, and increased precursor availability for lactone formation.
Finally, the CIELab color analysis confirmed that white wines exposed to light exhibited a measurable loss of yellow intensity and chroma, likely resulting from the degradation of yellow compounds containing conjugated double bonds, like riboflavin [17,18,20,39]. This trend contrasts with wines stored at elevated temperatures, where browning reactions typically lead to an increase in yellow coloration. Therefore, the observed color shift provides additional support for light-induced photodegradation as the primary mechanism of quality deterioration in flint glass-packaged wines.

5. Conclusions

This study is the first to systematically investigate the effects of light exposure and resin addition on the volatile composition and color of Retsina wine. Using a targeted GC-MS/MS method, we were able to quantify 72 volatile compounds and observe significant variations depending on both packaging and winemaking practices.
Our findings clearly demonstrate that light exposure through flint glass bottles leads to the substantial degradation of key aroma compounds, particularly norisoprenoids, terpenes, and certain esters, which are essential for the aromatic identity of Retsina. Several compounds, such as benzaldehyde, 2-aminoacetophenone, and cis-rose oxide, significantly increased due to photochemical reactions, confirming that photo-oxidation alters the wine’s sensory profile. Notably, γ-octalactone also increased under light, suggesting lipid-derived lactone formation may be enhanced by both light and resin interactions.
Although pine resin addition increased the concentration of several terpenoids (e.g., α-terpineol, cineoles, linalool oxide B) and enriched the wine with balsamic, herbal, and eucalyptus aromas, it did not provide sufficient protection against photodegradation. Furthermore, some fermentation-derived esters and volatile phenols decreased with higher resin levels, potentially due to inhibition of microbial activity or altered ester biosynthesis pathways.
Colorimetric data supported these observations, as wines stored under light exposure showed reduced yellow intensity and chroma, indicating both visual and aromatic deterioration.
Finally, while pine resin shapes Retsina’s aromatic character, it does not mitigate the damaging effects of light exposure. Therefore, we strongly recommend that Retsina be bottled in darker (e.g., green or amber) glass to preserve its volatile composition and ensure sensory quality. These results highlight the need for modern enological practices and packaging strategies to support the evolution of Retsina from a traditional product to a wine with broader global recognition and appeal.

Supplementary Materials

The following supporting information can be downloaded at https://www.mdpi.com/article/10.3390/beverages11050139/s1, Figure S1. Loading plots of PCA Plot of Figure 1A; Figure S2. Loading plots of PCA Plot of Figure 1B; Figure S3. Three-dimensional PCA plot; Table S1. Basic enological parameters of the wines measured according to OIV’s protocols; Table S2. Parameters quantified by GC-MS/MS; Table S3. Descriptive and one-way Anova Statistical Analysis; Table S4. Two-way ANOVA results showing the effects of light exposure, resin concentration, and their interaction on Retsina wine composition; Table S5. Resin extract GC-MS/MS analysis results; Table S6. Component Matrix of the three principal components.

Author Contributions

Conceptualization, P.A.; methodology, P.A., S.C., F.R. and E.N.; formal analysis, G.P., E.N., F.R. and P.A.; investigation, G.P. and F.R.; resources, P.A., E.N., V.N. and U.V.; data curation, G.P. and P.A.; writing—original draft preparation, P.A., G.P. and S.C.; writing—review and editing, P.A., G.P. and S.C.; visualization, G.P. and P.A.; supervision, P.A.; project administration, U.V.; funding acquisition, U.V. All authors have read and agreed to the published version of the manuscript.

Funding

The research was funded by the ERDF 2014–2020 Program of the Autonomous Province of Trento (Italy) with EU co-financing (Fruitomics).

Institutional Review Board Statement

Not applicable.

Informed Consent Statement

Not applicable.

Data Availability Statement

Data will be made available on request.

Conflicts of Interest

The authors declare no conflicts of interest.

References

  1. Mc Govern, P.E.; Glusker, D.L.; Exner, L.J.; Mc Govern, P.E. Neolithic Resinated Wine. Nature 1996, 381, 480–481. [Google Scholar] [CrossRef]
  2. Liang, Z.; Zhang, P.; Zeng, X.A.; Fang, Z. The Art of Flavored Wine: Tradition and Future. Trends Food Sci. Technol. 2021, 116, 130–145. [Google Scholar] [CrossRef]
  3. Alonso González, P.; Parga-Dans, E. Vino de Tea (pine heartwood wine) from La Palma (Spain): Ethnographic and physic-chemical characterization. J. Ethn. Foods 2020, 7, 14. [Google Scholar] [CrossRef]
  4. Assimopoulou, A.N.; Zlatanos, S.N.; Papageorgiou, V.P. Antioxidant Activity of Natural Resins and Bioactive Triterpenes in Oil Substrates. Food Chem. 2005, 92, 721–727. [Google Scholar] [CrossRef]
  5. Roussis, V.; Tsoukatou, M.; Petrakis, P.V.; Chinou, I. Volatile constituents of needles of five Pinus species grown in Greece. Phytochemistry 1995, 39, 357–361. [Google Scholar] [CrossRef]
  6. Proestos, C.; Chorianopoulos, N.; Nychas, G.-J.E.; Komaitis, M. HPLC analysis of phenolic substances in Greek wines. Food Control. 2005, 16, 319–323. [Google Scholar] [CrossRef]
  7. EU Regulation (EU) No 251/2014 of the European Parliament and of the Council on the Definition, Description, Presentation, Labelling and the Protection of Geographical Indications of Aromatised Wine Products and Repealing Council Regulation (EEC) No 1601/91. In Official Journal of the European Union; Publications Office of the European Union: Luxembourg, 2014.
  8. EU Regulation (EU) No 1308/2013 of the European Parliament and of the Council on Establishing a Common Organisation of the Markets in Agricultural Products and Repealing Council Regulations (EEC) No 922/72, (EEC) No 234/79, (EC) No 1037/2001 and (EC) No 1234/2007. Available online: https://eur-lex.europa.eu/legal-content/EN/TXT/?uri=CELEX%3A32013R1308 (accessed on 16 July 2025).
  9. EU EAmbrosia—Ρετσίνα Αττικής. Available online: https://ec.europa.eu/agriculture/eambrosia/geographical-indications-register/details/EUGI00000007205 (accessed on 16 July 2025).
  10. Μπέτζιος. Βασίλειος Συμβολή Εις Την Μελέτην Του Ρητινίτου Οίνου: Διάκρισις Ρητινίτου Από Αρητινώτου Οίνου. Ph.D. Thesis, Agricultural University of Athens, Attica, Greece, 1978. [CrossRef]
  11. Nakas, A.; Virgiliou, C.; Samara, D.; Kechri, E.; Assimopoulou, A.N. Exploring the Effect of Pinus Halepensis Resin Quality on the Vinification of Retsina by Untargeted Profile Analysis. Open Explor. 2024, 2, 497–524. [Google Scholar] [CrossRef]
  12. Natskoulis, P.I.; Miliordos, D.E.; Koutsouris, A.N.; Tarantilis, P.A.; Pappas, C.S.; Kallithraka, S.; Kotseridis, Y.; Metafa, M. Optimisation of Retsina Wine Quality: Effects of Resin Concentration, Yeast Strain, and Oak Chip Type. Foods 2024, 13, 3376. [Google Scholar] [CrossRef] [PubMed]
  13. Hamzaoui, E.; Zallez, O.B.Y.; Buñay, J.; Leremboure, M.; Argui, H.; Baron, S.; Said, H.; Lobaccaro, J.M.A.; Akriche, S. Comparative Study of Essential Oils from Tunisian Pinus Halepensis Mill. by Hydrodistillation and Microwave-Assisted Processes: Chemical Composition and Antioxidant and Cytotoxic Potential against Prostate and Cervical Cancer Cells. ACS Omega 2024, 9, 34128–34139. [Google Scholar] [CrossRef]
  14. Alonso González, P.; Parga Dans, E.; Ballester, J. Volatile composition of light red wines aged in Canary pine barrels from La Palma (Canary Islands, Spain). OENO One 2022, 56, 29–40. [Google Scholar] [CrossRef]
  15. Chatzistavridi, M.M.; Christofi, S.; Kallithraka, S. Fortification of White Wines with Antioxidants and Se: Impacts on Browning Development and Phenolic Content. Beverages 2024, 10, 31. [Google Scholar] [CrossRef]
  16. Waterhouse, A.L.; Sacks, G.L.; Jeffery, D.W. Understanding Wine Chemistry; Wiley Online Library: Hoboken, NJ, USA, 2016; pp. 179–193. [Google Scholar] [CrossRef]
  17. Furet, A.; Sicello, A.; Guillemat, B.; Absalon, C.; Langleron, E.; Bassani, D.M. Revisiting the mechanism responsible for the light-struck flavor in white wines and Champagnes. Food Chem. 2022, 372, 131281. [Google Scholar] [CrossRef]
  18. Fracassetti, D.; Ballabio, D.; Mastro, M.; Tirelli, A.; Jeffery, D.W. Response Surface Methodology Approach to Evaluate the Effect of Transition Metals and Oxygen on Photo-Degradation of Methionine in a Model Wine System Containing Riboflavin. J. Agric. Food Chem. 2022, 70, 16347–16357. [Google Scholar] [CrossRef]
  19. Fracassetti, D.; Limbo, S.; Messina, N.; Pellegrino, L.; Tirelli, A. Light-Struck Taste in White Wine: Protective Role of Glutathione, Sulfur Dioxide and Hydrolysable Tannins. Molecules 2021, 26, 5297. [Google Scholar] [CrossRef]
  20. Carlin, S.; Mattivi, F.; Durantini, V.; Dalledonne, S.; Arapitsas, P. Flint Glass Bottles Cause White Wine Aroma Identity Degradation. Proc. Natl. Acad. Sci. USA 2022, 119, e2121940119. [Google Scholar] [CrossRef]
  21. Fracassetti, D.; Di Canito, A.; Bodon, R.; Messina, N.; Vigentini, I.; Foschino, R.; Tirelli, A. Light-Struck Taste in White Wine: Reaction Mechanisms, Preventive Strategies and Future Perspectives to Preserve Wine Quality. Trends Food Sci. Technol. 2021, 112, 547–558. [Google Scholar] [CrossRef]
  22. Fracassetti, D.; Limbo, S.; Pellegrino, L.; Tirelli, A. Light-Induced Reactions of Methionine and Riboflavin in Model Wine: Effects of Hydrolysable Tannins and Sulfur Dioxide. Food Chem. 2019, 298, 124952. [Google Scholar] [CrossRef] [PubMed]
  23. Fracassetti, D.; Saligari, A.; Messina, N.; Bodon, R.; Mazzini, S.; Borgonovo, G.; Tirelli, A. Insight into the characterization of commercial oenological tannins. Food Chem. Adv. 2023, 2, 100205. [Google Scholar] [CrossRef]
  24. Carlin, S.; Lotti, C.; Correggi, L.; Mattivi, F.; Arapitsas, P.; Vrhovšek, U. Measurement of the Effect of Accelerated Aging on the Aromatic Compounds of Gewurztraminer and Teroldego Wines, Using a SPE-GC-MS/MS Protocol. Metabolites 2022, 12, 180. [Google Scholar] [CrossRef] [PubMed]
  25. OIV Chromatic Characteristics (Type-I)|OIV. Available online: https://www.oiv.int/standards/compendium-of-international-methods-of-wine-and-must-analysis/annex-a-methods-of-analysis-of-wines-and-musts/section-2-physical-analysis/chromatic-characteristics-%28type-i%29 (accessed on 16 July 2025).
  26. Mattay, J.; Griesbeck Vch, A.G. Photochemical Key Steps in Organic Synthesis. In Photochemical Key Steps in Organic Synthesis; Wiley Online Library: Hoboken, NJ, USA, 1994. [Google Scholar] [CrossRef]
  27. Delaiti, S.; Nardin, T.; Roman, T.; Cappello, N.; Larcher, R.; Pedò, S. Exploring the relationship between field available water capacity (AWC) and atypical aging (ATA) development in base wines. J. Food Sci. 2024, 89, 9515–9528. [Google Scholar] [CrossRef] [PubMed]
  28. Arapitsas, P.; Carlin, S.; Mattivi, F.; Rapaccioli, A.; Vrhovsek, U.; Guella, G. Monoterpenoids Isomerization and Cyclization Processes in Gewürztraminer Wines: A Kinetic Investigation at Different PH and Temperatures. Food Res. Int. 2024, 196, 115017. [Google Scholar] [CrossRef]
  29. Wau, J.S.; Robertson, M.J.; Oelgemöller, M. Solar Photooxygenations for the Manufacturing of Fine Chemicals—Technologies and Applications. Molecules 2021, 26, 1685. [Google Scholar] [CrossRef]
  30. Dincalp, H.; Içli, S. Photosynthesis of Rose Oxide by Concentrated Sunlight in the Absence of Singlet Oxygen. J. Photochem. Photobiol. A Chem. 2001, 141, 147–151. [Google Scholar] [CrossRef]
  31. Cabua, M.C.; Velichko, V.; Pilia, L.; Moi, D.; Secci, F. Low-Impact Synthesis of γ-Lactones through Photoinduced Baeyer-Villiger Oxidation of Cyclic Ketones. Eur. J. Org. Chem. 2024, 27, e202400226. [Google Scholar] [CrossRef]
  32. Pineau, B.; Barbe, J.C.; Van Leeuwen, C.; Dubourdieu, D. Which Impact for β-Damascenone on Red Wines Aroma? J. Agric. Food Chem. 2007, 55, 4103–4108. [Google Scholar] [CrossRef]
  33. Tomasino, E.; Bolman, S. The Potential Effect of β-Ionone and β-Damascenone on Sensory Perception of Pinot Noir Wine Aroma. Molecules 2021, 26, 1288. [Google Scholar] [CrossRef] [PubMed]
  34. Marinaki, M.; Sampsonidis, I.; Lioupi, A.; Arapitsas, P.; Thomaidis, N.; Zinoviadou, K.; Theodoridis, G. Development of Two-Level Design of Experiments for the Optimization of a HS-SPME-GC-MS Method to Study Greek Monovarietal PDO and PGI Wines. Talanta 2023, 253, 123987. [Google Scholar] [CrossRef]
  35. Tzamourani, A.; Lytra, G.; Goulioti, E.; Gammacurta, M.; Marchal, A.; Evangelou, A.; Arapitsas, P.; Kotseridis, Y.; Paraskevopoulos, I.; Dimopoulou, M. Profound Analysis of the Impact of Indigenous Saccharomyces cerevisiae Strains on the Chemical and Sensorial Profile of Assyrtiko Wine. ACS Food Sci. Technol. 2025, 5, 2286–2295. [Google Scholar] [CrossRef]
  36. Luzzini, G.; Slaghenaufi, D.; Ugliano, M. Approaches to the classification of wine aroma ageing potential. Applications to the case of terpenoids in Valpolicella red wines. OENO One 2022, 56, 231–242. [Google Scholar] [CrossRef]
  37. Zeller, A.; Rychlik, M. Impact of Estragole and Other Odorants on the Flavour of Anise and Tarragon. Flavour Fragr. J. 2007, 22, 105–113. [Google Scholar] [CrossRef]
  38. Roufa, P.; Evangelou, A.; Beris, E.; Dourtoglou, T.; Carlin, S.; Lotti, C.; Vrhovšek, U.; Chatzilazarou, A.; Shehadeh, A. Volatile composition of Muscat of samos wine after pre- and postfermentation addition of the herbs Salvia officinalis, Melissa officinalis and Cannabis sativa. Int. J. Agric. Biosci. 2025, 14, 1–8. Available online: https://www.ijagbio.com/pdf-files/25-256.pdf (accessed on 16 July 2025).
  39. Mattivi, F.; Monetti, A.; Vrhovšek, U.; Tonon, D.; Andrés-Lacueva, C. High-Performance Liquid Chromatographic Determination of the Riboflavin Concentration in White Wines for Predicting Their Resistance to Light. J. Chromatogr. A 2000, 888, 121–127. [Google Scholar] [CrossRef] [PubMed]
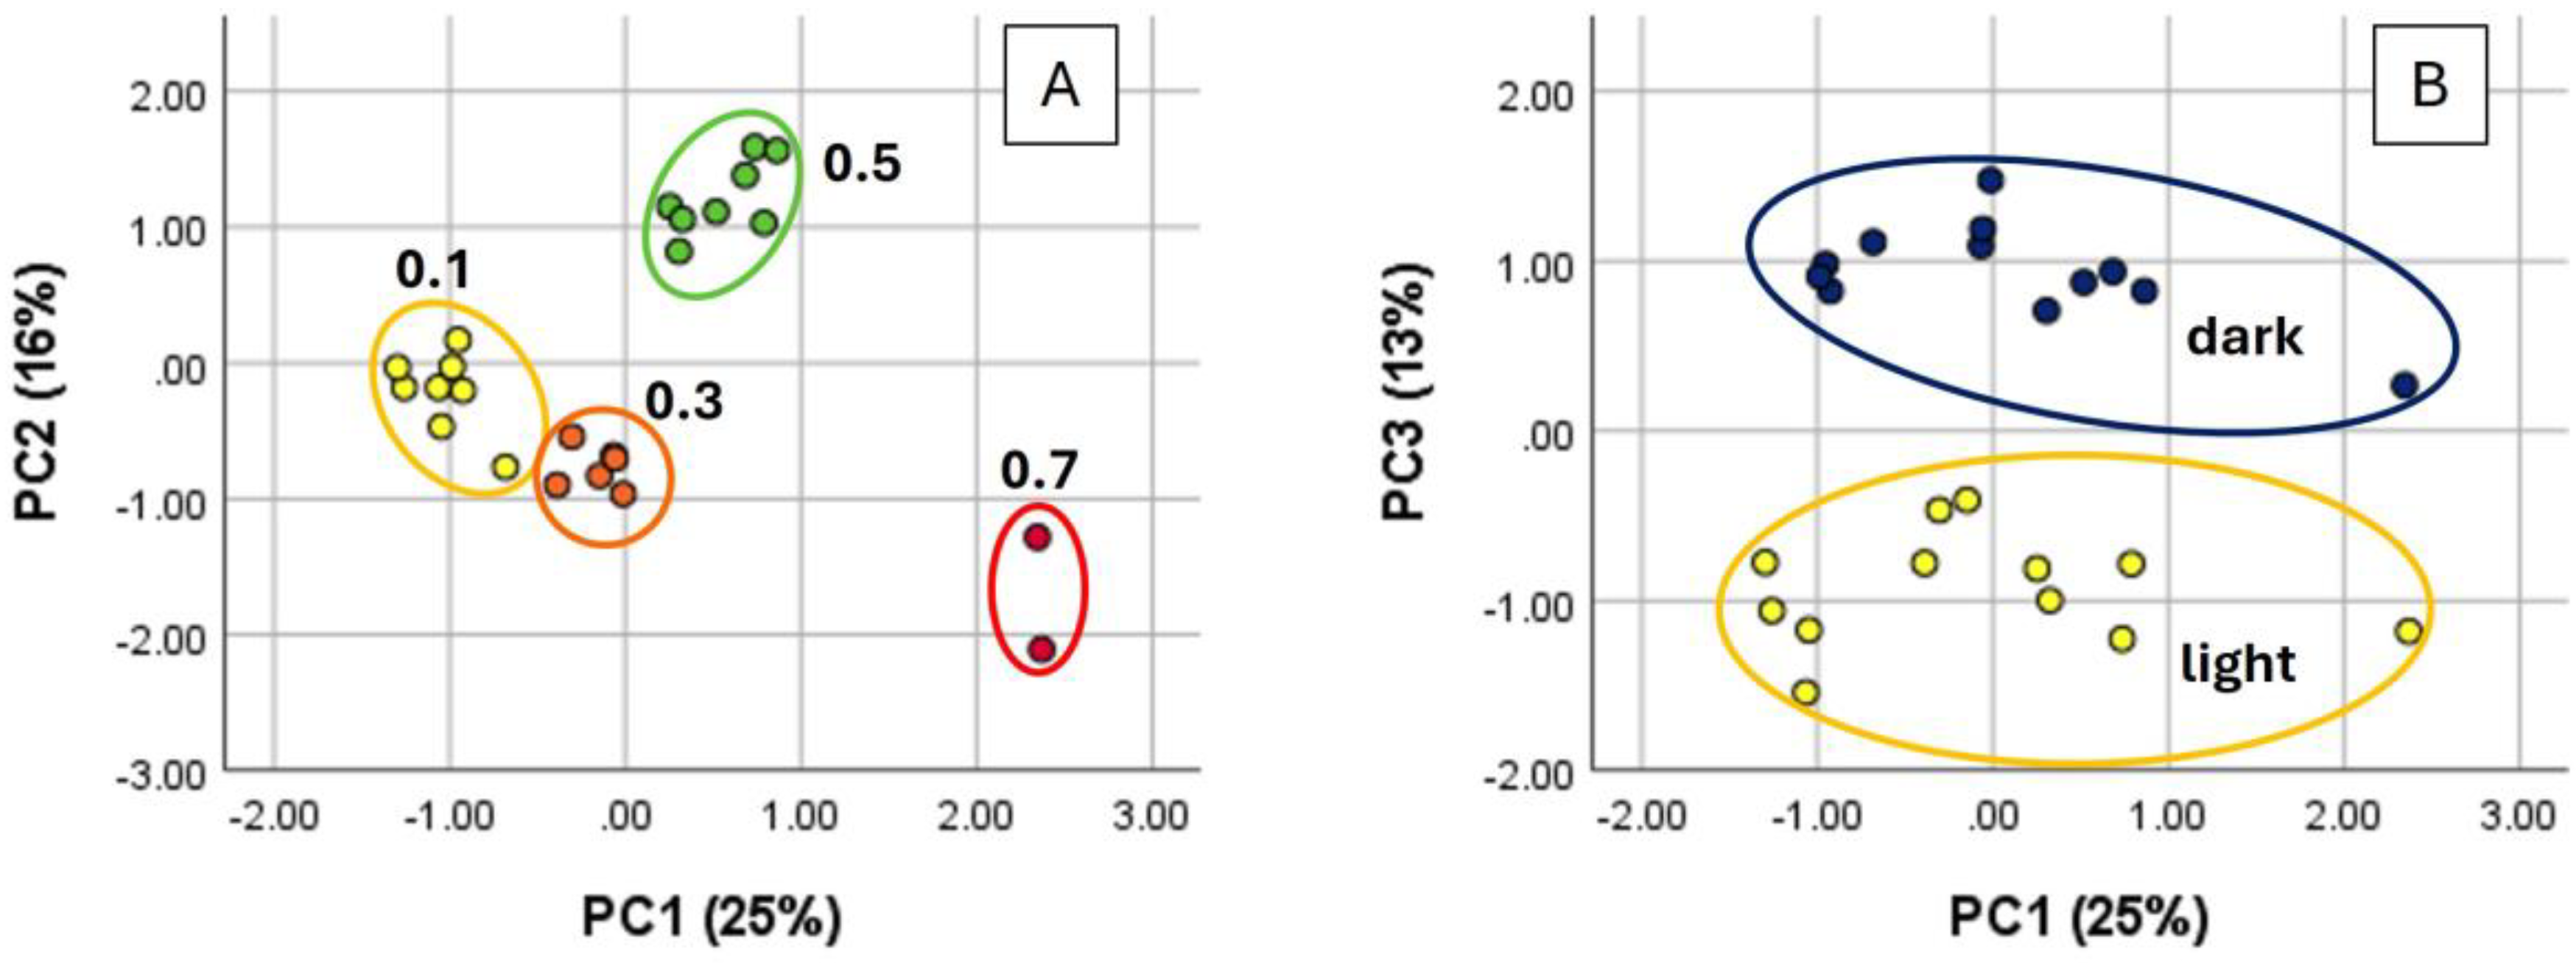
Figure 1. PCA plots of the samples where (A) shows the grouping of the samples due to resin addition (yellow = 0.1 g/L, orange = 0.3 g/L, green = 0.5 g/L, red = 0.7 g/L) and (B) shows grouping due to light exposure (blue = dark, yellow = light). The 3D PCA plot can be found in Supplementary Figure S3.
Beverages 11 00139 g001
Figure 2. Bar graphs of aroma compounds that were influenced positively by the light. The samples are separated by their resin addition quantity during winemaking. The small letters on the top of the bars indicate a statistically significant difference if two bars do not share the same letter (p-value < 0.05). Subfigures show: (A) benzaldehyde, (B) γ-octalactone, (C) cis-rose oxide, and (D) 2-aminoacetophenone.
Beverages 11 00139 g002
Figure 3. Bar graphs of aroma compounds that were influenced negatively by the light. The samples are separated by their resin addition quantity during winemaking. The small letters on the top of the bars indicate a statistically significant difference if two bars do not share the same letter (p-value < 0.05). Subfigures show: (A) safranal, (B) linalool, (C) vitispiranes, (D) 4-vinylguaiacol, (E) β-ionone, and (F) β-damascenone.
Beverages 11 00139 g003
Figure 4. CIELab Chroma-hue (A) and green-yellow (B) graphs of the samples stored under light exposure or protected in the dark.
Beverages 11 00139 g004
Figure 5. Bar graphs of aroma compounds were influenced positively by resin addition. The samples are separated by the quantity of resin added during winemaking and the storage conditions. The small letters on the top of the bars indicate a statistically significant difference if two bars do not share the same letter (p-value < 0.05). Subfigures show: (A) α-terpineol, (B) trans-terpin, (C) nerol, (D) 1,4-cineole, (E) 1,8-cineole, (F) linalool oxide, (G) estragole, (H) γ-decalactone, and (I) 2-isobutyl-3-methoxy-pyrazine.
Beverages 11 00139 g005
Figure 6. Bar graphs of aroma compounds were influenced negatively by resin addition. The samples are separated by the quantity of resin added during winemaking and the storage conditions. The small letters on the top of the bars indicate a statistically significant difference if two bars do not share the same letter (p-value < 0.05). Subfigures show: (A) phenylethyl acetate, (B) 4-ethyl-phenol, and (C) ethyl heptanoate.
Beverages 11 00139 g006
Table 1. Mean values and statistical analysis of the CIELab measurements.
Light
Resin 0.1 g/L
Dark
Resin 0.1 g/L
Light
Resin 0.3 g/L
Dark
Resin 0.3 g/L
Light
Resin > 0.5 g/L
Dark
Resin > 0.5 g/L
Mean ± Std.dev 1
L*96.45 ± 0.36 a96.68 ± 0.27 a,b96.76 ± 0.15 a,b96.88 ± 0.17 a,b97.06 ± 0.26 a,b97.03 ± 0.24 b
A*−0.12 ± 0.077 c−0.45 ± 0.084 b−0.34 ± 0.1 b,c−0.57 ± 0.08 a,b−0.54 ± 0.17 a,b−0.79 ± 0.14 a
B*9.67 ± 0.39 a10.54 ± 0.17 b9.92 ± 0.094 a10.72 ± 0.19 b9.47 ± 0.19 a10.56 ± 0.25 b
C*9.67 ± 0.39 a10.55 ± 0.17 b9.92 ± 0.092 a10.73 ± 0.19 b9.49 ± 0.18 a10.59 ± 0.24 b
h90.68 ± 0.44 a92.47 ± 0.48 b91.97 ± 0.57 a,b93.03 ± 0.48 b,c93.26 ± 1.10 b,c94.31 ± 0.81 c
1 Mean values that do not share a letter are significantly different (p-value < 0.05).
Disclaimer/Publisher’s Note: The statements, opinions and data contained in all publications are solely those of the individual author(s) and contributor(s) and not of MDPI and/or the editor(s). MDPI and/or the editor(s) disclaim responsibility for any injury to people or property resulting from any ideas, methods, instructions or products referred to in the content.