Article

Ripening Kinetics and Grape Chemistry of Virginia Petit Manseng

1
Winemakers Research Exchange, Charlottesville, VA 22902, USA
2
Department of Biological Sciences, Virginia Polytechnic Institute and State University, Blacksburg, VA 24061, USA
3
Department of Food Science and Human Nutrition, Michigan State University, East Lansing, MI 48824, USA
4
Department of Food Science and Technology, Virginia Polytechnic Institute and State University, Blacksburg, VA 24060, USA
5
Department of Food Science, Cornell University, Ithaca, NY 14850, USA
6
Department of Human Nutrition, Foods, and Exercise, Virginia Polytechnic Institute and State University, Blacksburg, VA 24061, USA
*
Author to whom correspondence should be addressed.
Beverages 2025, 11(4), 108; https://doi.org/10.3390/beverages11040108
Submission received: 30 April 2025 / Revised: 14 June 2025 / Accepted: 26 June 2025 / Published: 30 July 2025

Abstract

Petit Manseng is a variety of Vitis vinifera gaining popularity in Virginia, USA because it consistently produces high quality grapes under variable growing conditions. However, its high sugar and acid levels complicate dry wine production. The goal of this study was to characterize Petit Manseng ripening kinetics from veraison to harvest to identify optimal harvest timing for producing dry white wines, using Chardonnay as a comparator because of its popularity in Virginia, well-known ripening kinetics, and ability to produce high quality dry white wines. A total of 74 samples of Petit Manseng and Chardonnay grapes were collected from five commercial sites over 2 years and evaluated for berry weight, pH, titratable acidity (TA), malic acid, total soluble solids (TSS), glucose, and fructose, with ripening kinetics modeled using segmented regressions. Results indicated that harvest timing and grape variety were the primary factors influencing ripening kinetics. In contrast, growing location and vintage had limited impact. In Chardonnay grapes, TA declined from 21 to 7.1 g/L and TSS increased from 6.1 to 19.5 g/L. In Petit Manseng, TA declined from 25 to 10.8 g/L and TSS increased from 8.0 to 23.6 g/L. Acid depletion plateaued ~2 weeks after sugar accumulation plateaued in Petit Manseng grapes, though the plateaus were similar in Chardonnay grapes. Linear discriminant analysis (LDA) completely separated grapes based on pH or TA vs. sugars, but not malic acid vs. sugars, suggesting that tartaric acid is driving acidity differences between cultivars. These data indicate that regardless of when grapes are harvested, winemakers may need to employ targeted acid management strategies with Petit Manseng because of its ripening kinetics.

1. Introduction

Wine is enjoyed by many around the world. There are many different styles of wines that are popular with consumers, including sweet, dry, sparkling, and dessert style wines. In winemaking, the sugars and acids from the wine grapes determine the wine style, quality, and sensory profile [1]. However, sugars and acids change at different rates as grapes ripen and can vary widely amongst different cultivars [2]. Understanding the dynamic changes in the sugar and acid content of grapes during ripening (i.e., the ripening kinetics of the grapes) can help winemakers make informed decisions regarding when to harvest grapes to create wines in various styles that meet quality standards and are sought after by consumers [3]. As new wine grape cultivars emerge in different regions around the world, characterizing their ripening kinetics will aid winemakers in leveraging these emerging cultivars to make specific wine styles that appeal to consumers.

1.1. Grape Ripening Kinetics

Wine grapes mature from bloom to harvest in two stages separated by a lag phase. Between bloom and veraison, grapes form and develop as small, hard fruits with high acidity. At veraison, grape berries begin to change color and soften, marking the transition from berry growth to berry ripening. Between veraison and harvest, sugars accumulate while the acidity of the grapes declines [4,5]. These key chemical constituents are monitored by growers throughout the ripening process, as both the total and relative amounts of acids and sugars heavily influence the finished wine.
The acidity of wine grapes is characterized by pH, TA, and individual organic acids. The pH of ripe grapes suitable for making a palatable, microbially stable white wine is ~3.0–3.5, though the optimal pH value differs based on the desired finished wine style [6]. TA is, by definition, the concentration of titratable protons in solution, and, more importantly from a wine production standpoint, the acidity measurement most correlated with the sensory perception of tartness [7,8]. Grapes contain several organic acids that contribute to pH and TA, with the most important acids for wine quality being tartaric and malic acid. Both are formed early in berry development and decrease after veraison, though the depletion rate of each acid is contingent upon different processes [9,10]. Determining the balance of these acids in each grape cultivar aids winemakers in adopting targeted strategies to manage the high acid content of some cultivars.
Glucose and fructose are the primary contributors to wine grape sugar composition. They are the key energy sources utilized by yeast during fermentation, and their initial concentrations are the primary determinant of ethanol concentration in the finished wine [11]. In the vineyard, TSS are measured to monitor ripening and sugar development. Most white wine grapes are harvested after sugar accumulation ceases, which is defined as physiological ripeness [12]. However, high initial concentrations of sugar lead to finished wines with correspondingly high ethanol content. This abundance of ethanol can strain yeast metabolism, resulting in stuck fermentations, production of volatile acidity and unwanted residual sugar, and produce a finished wine with an unbalanced sensory profile due to the excessive alcohol [11].
The ripening kinetics of acids and sugars in each grape variety is different. Thus, as new grape varieties gain popularity amongst growers and consumers, there is a need to characterize the unique ripening kinetics of each variety to aid winemakers in producing marketable wines.

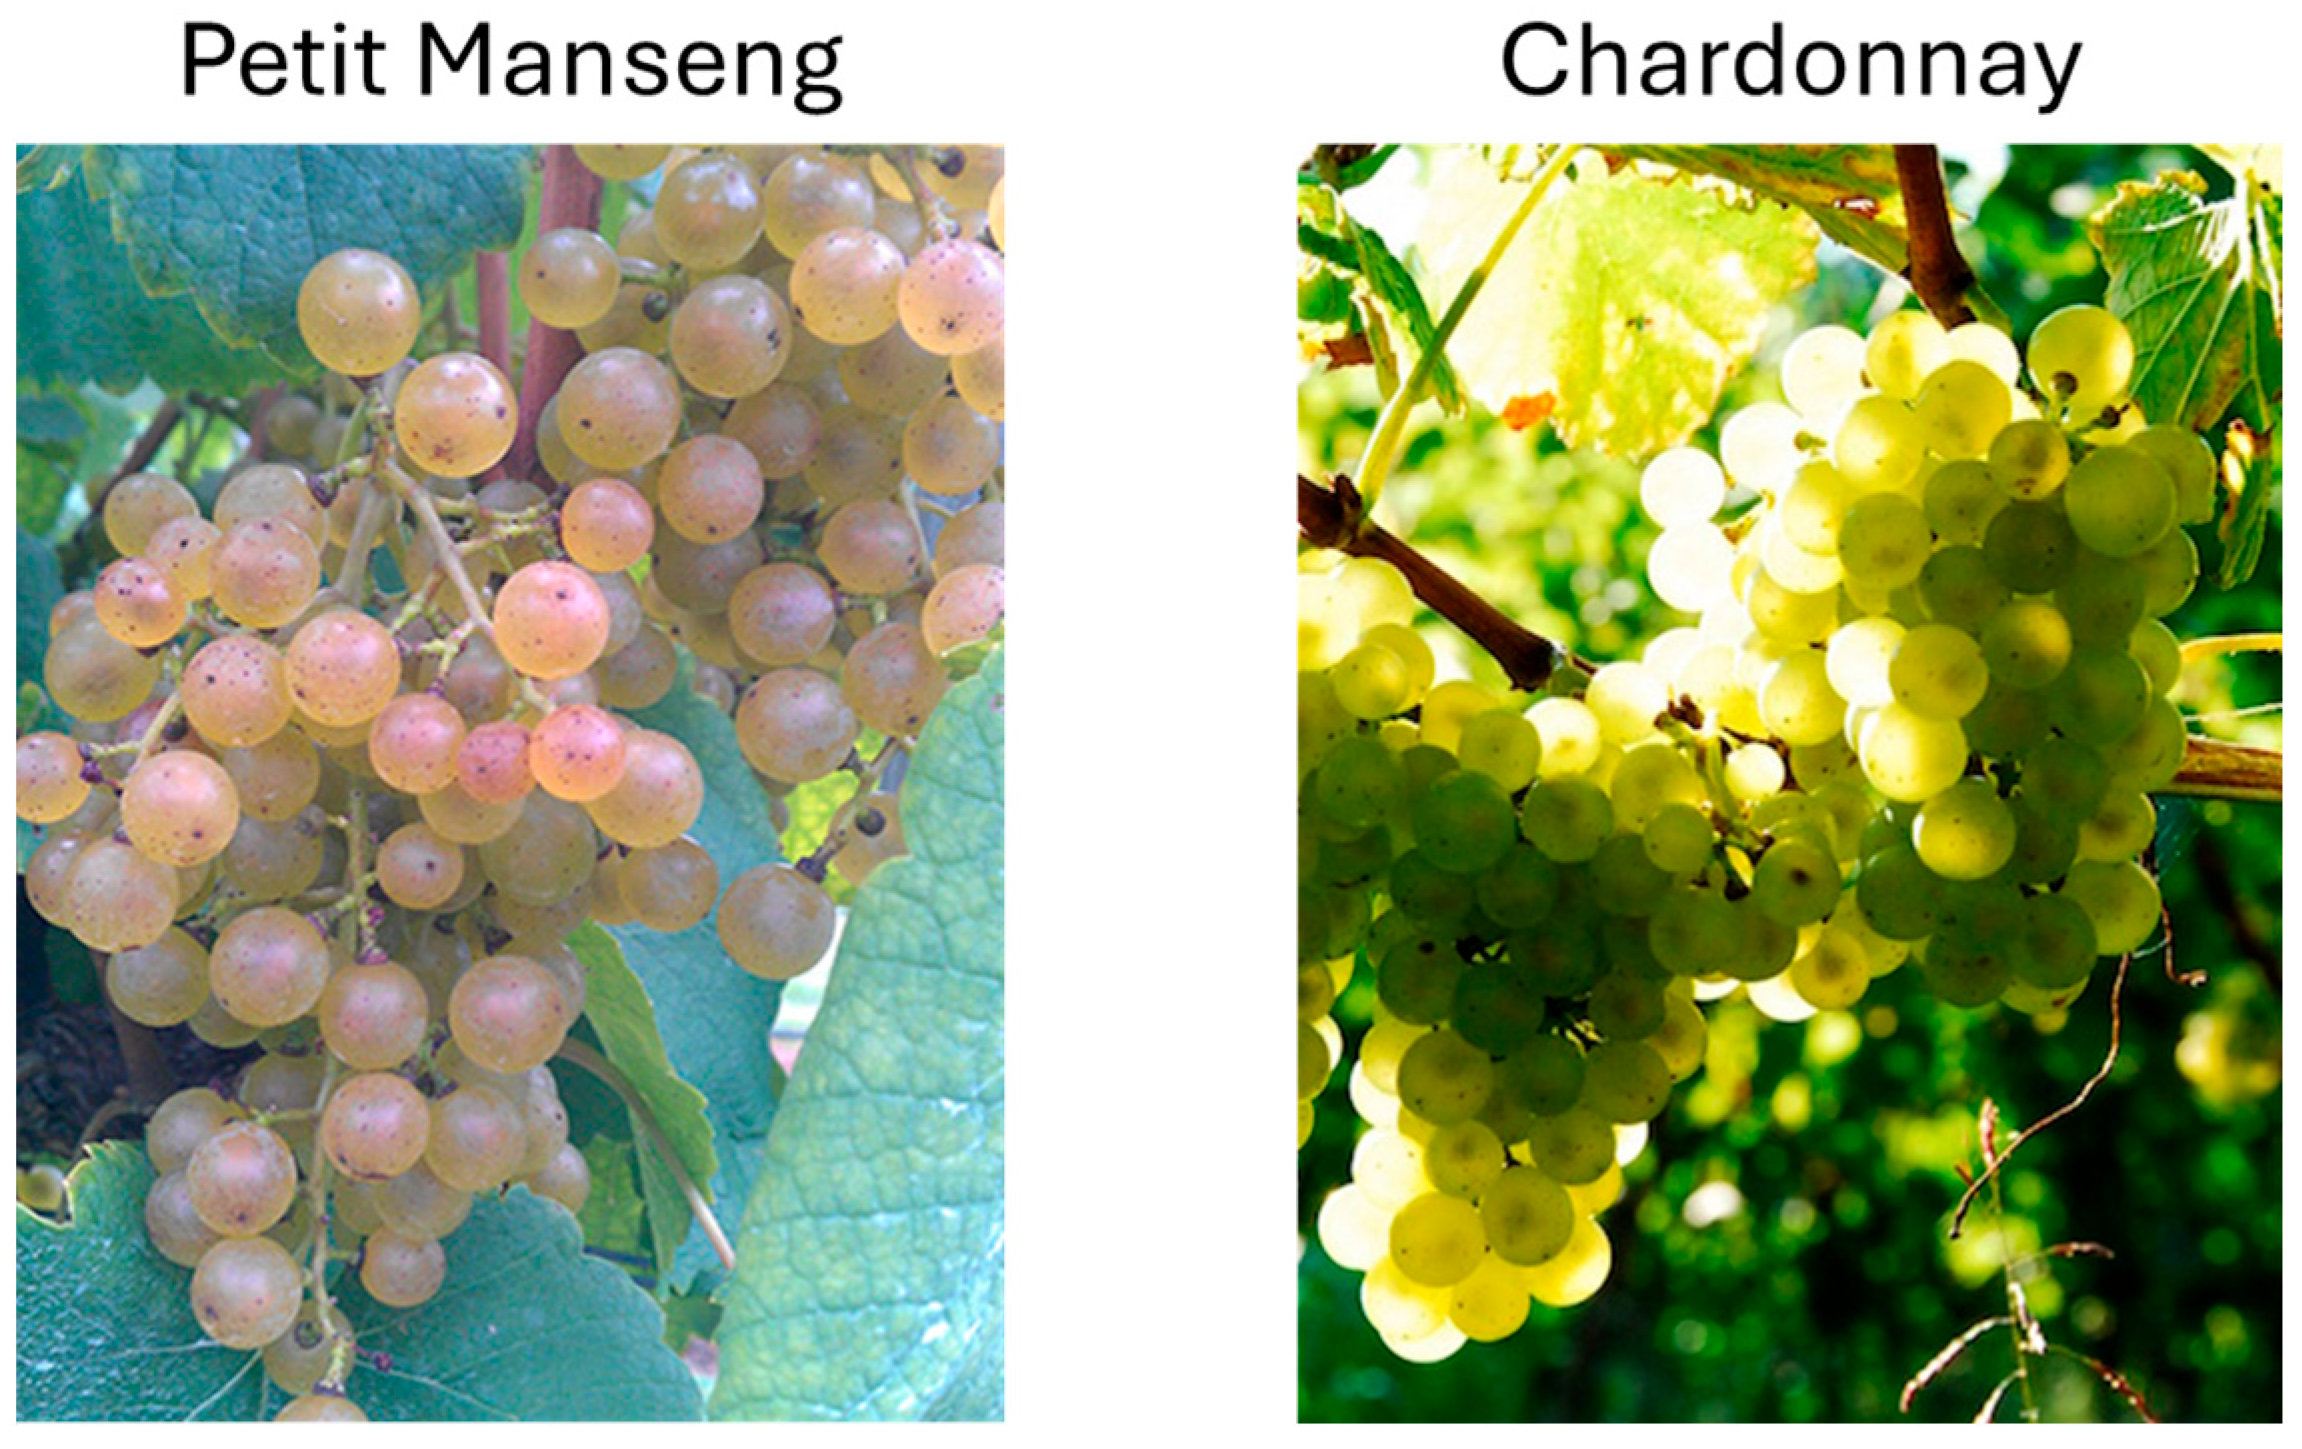
1.2. Petit Manseng Grapes

Petit Manseng (Vitis vinifera), originally cultivated in southwest France, has gained popularity amongst growers in the United States. Specifically, in Virginia, Petit Manseng has become popular among grape growers for its loose clusters and thick skins, both of which make it more sustainable in warm, humid climates, more resistant to bunch rots, and less in need of labor and cost intensive spray programs (Figure 1) [13]. In fact, over the last 30 years, the popularity of this variety has grown such that Virginia now perhaps has the second largest planting of Petit Manseng in the world with more than 200 acres of Petit Manseng planted across the state, though due to underreporting, the true acreage is likely much higher [14,15].
In its home region of the Jurançon in southwestern France, Petit Manseng is primarily used to produce off dry or dessert wines [16]. In Virginia, dessert wines and off-dry versions are marketable, though dessert wine sales account for less than 12% of overall wine sales in the US with rates declining each year [17,18]. Consequently, there is growing interest amongst winemakers in making a dry style table wine with Petit Manseng, as this variety consistently produces high quality grapes even in vintages with high rainfall. However, due to the ripening kinetics of this variety, it is often difficult to balance the acidity, alcohol, and strong tropical flavors to create a well-balanced, dry white wine [19].
Petit Manseng has unique ripening kinetics, characterized by high TA that persists until late in the harvest season [19]. This high level of acidity has limited the use of Petit Manseng as a cultivar to make a dry style wine because high levels of acidity impart unpleasant tartness [7], limiting consumer acceptance. Because acids decrease during ripening, moderating acidity in the production of a dry Petit Manseng may be achieved by allowing grapes to ripen longer on the vine. However, extending fruit maturation results in high sugar levels, which, as noted above, can create problematic fermentation conditions [20]. In addition, allowing the fruit to hang long past physiological maturity may lead to the development of overpowering tropical fruit aromas [10].

1.3. Project Objective

Due to the challenges of making a dry wine from Petit Manseng, a detailed understanding of its ripening kinetics is necessary to determine the optimal harvest timing based on the interplay of sugars and acids in the grapes. Systematically characterizing the ripening kinetics of Petit Manseng will enable growers and winemakers to better understand the chemistry of this unique grape variety and, in turn, enable them to make informed decisions regarding harvest timing and vinicultural techniques to produce a dry wine from these grapes. Therefore, the goal of this project was to characterize the ripening kinetics of both Petit Manseng and Chardonnay grapes grown at five locations over two vintages in Virginia, USA. Chardonnay was chosen as a comparator because it is the most widely grown white wine grape in Virginia [14], has well-defined ripening kinetics, and is recognized for its ability to consistently produce a high-quality dry white wine. We hypothesized that the ripening kinetics of Petit Manseng and Chardonnay grapes will be different, though a comprehensive description of these kinetics will inform optimal harvest timing of Petit Manseng grapes that can be used make a dry white wine. The results will provide a better understanding of the underlying chemistry of Petit Manseng, helping growers and winemakers develop practical strategies in the vineyard and at the winery.

2. Materials and Methods

2.1. Grape Sample Collection and Processing

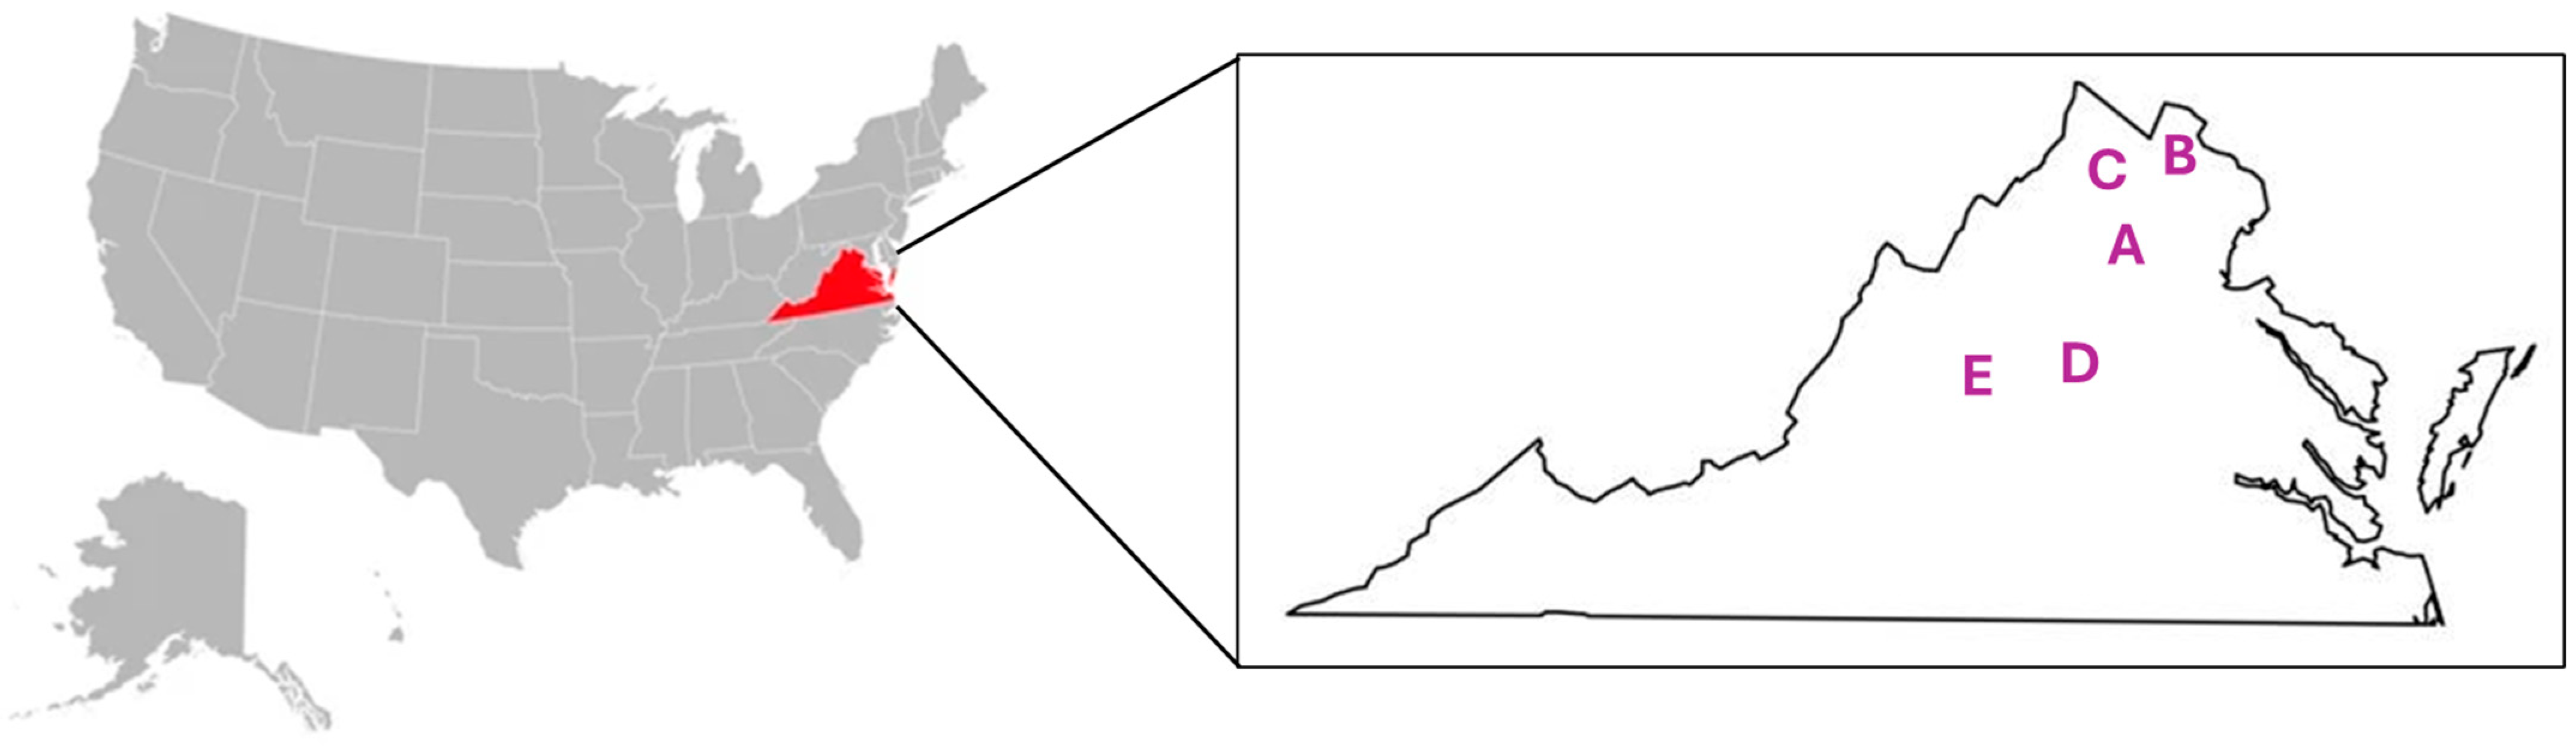
2.1.1. Grape Collection

Five vineyards, including two located in Central Virginia, one in Northern Virginia, and two in the Shenandoah Valley participated in the study; details for collection sites are shown in Table 1 and Figure 2. Grapes were sampled from vines that had been grafted onto rootstocks and were farmed with either vertical shoot positioning or a modified Smart-Dyson Ballerina. Sampling was conducted weekly from veraison through harvest in 2021 and 2022. Both years were considered normal for Virginia growing conditions, with rainfall and temperatures near the average of the last 10 years in Virginia [21,22]. Each week, a 600-berry sample was obtained from each vineyard. To obtain a representative sample, the number of passes and distribution of rows for sampling was pre-determined based on the length of rows and breadth of the block. To avoid edge effects, only interior rows of the block were included, with sampling commencing 3 panels into each row. The same individual collected all samples, anecdotally noting that berries across all vineyards sampled were similar in appearance, color, and size and were typical of grapes for each cultivar.
Grape samples were kept refrigerated in the field, during transport, and while awaiting processing. Within 24 h of sampling, all samples were sorted for processing or freezing. For each sample, berries were thoroughly mixed, and 200 berries were selected for berry weight measurement. These berries were then juiced to determine TSS, pH, and TA, with analytical replicates performed by weighing and juicing two separate sets of 100 berries. The remaining berries were frozen in two sets of 200 berries each for later analysis.

2.1.2. Grape Processing

Grape samples were thawed at room temperature for 30 min to moderately soften the grape berries. Immediately after, 100 g of berries were weighed, and the corresponding berry count was recorded. The berries were then transferred into a stomacher bag, homogenized for 30 s with a rubber mallet, and then further homogenized for 2 min at 200 rpm using a stomacher (Seward Stomacher Model 400 Circulator Lab Blender, Fisher Scientific, Hampton, NH, USA). During stomaching, the bag was removed after one minute to rearrange the berries back to an even sheet. After homogenization, the grapes remained slightly frozen, and the displaced juice from the stomacher bag was decanted into 50 mL centrifuge tubes. Decanted samples were then centrifuged at 1895× g for 5 min at 4 °C (Allegra V-15R centrifuge, Beckman Coulter, Brea, CA, USA). Clarified juice was aliquoted into separate tubes for further analysis and frozen at −20 °C until analysis.

2.2. Analysis of Grape Samples

2.2.1. Grape Acids and pH

Titratable Acidity (TA)
TA was measured on pressed juice using the AOAC 962.12 method [23]. Samples were titrated using an auto-titrator (848 Titrino plus autotitrator, Metrohm, Riverview, FL, USA). A total of 5 mL juice was added to 40 mL of distilled water and titrated with 0.1 N sodium hydroxide.
Grape pH Measurements
pH was measured on pressed juice using a pH meter (Orion 3-star pH meter, Thermo Fisher Scientific, Waltham, MA, USA) with calibration standards of pH 2, 4, 7, and 10.
Malic Acid
Clarified juice samples were thawed immediately prior to analysis. Thawed samples were vortexed and centrifuged at 1895× g for 2 min at 4 °C. Samples were diluted with 0.025 N sodium hydroxide (Fisher Scientific) to bring the pH of samples into the buffer range specified by the Megazyme kit. For analysis, dilution factors of 80 and 100 were used; dilution factors were determined by the concentration of malic acid in each sample according to the manufacturer’s directions. Samples were analyzed following the Megazyme protocol for the L-Malic acid (L-malate) liquid stable rapid format procedure according to the manufacturer’s instructions (l-malic acid (K-LMAL-58A), Megazyme, Wicklow, Ireland). Absorbance was measured using a spectrophotometer (BioTek Cytation5, Agilent Technologies, Santa Clara, CA, USA). All samples were analyzed in triplicate.

2.2.2. Grape Sugars

Total Soluble Solids (TSS)
TSS was measured on pressed juice samples using a digital refractometer (PAL-1, Atago, Bellevue, WA, USA).
Glucose and Fructose
Clarified juice samples were thawed immediately prior to analysis. Thawed samples were vortexed and centrifuged at 1895× g for 2 min at 4 °C. Samples were diluted with 0.025 N sodium hydroxide to bring the pH of samples into the buffer range specified by the Megazyme kit. For sugar analyses, samples were diluted 500-fold to ensure absorbance values were in the linear range of the calibration curve. Samples were then analyzed following the Megazyme protocol for the D-glucose and D-fructose liquid stable rapid format procedures according to the manufacturer’s instructions (d-fructose and d-glucose (K-FRUGL), Megazyme). Absorbance was measured using a spectrophotometer. All samples were analyzed in triplicate.

2.2.3. Calculations of Alcohol Content and Grape Maturity

Estimation of Alcohol Content
Glucose and fructose data were used to estimate the alcohol content of finished wines using the predictive formula from ETS [24]:
g l u c o s e + f r u c t o s e g L 16.83 = %   a l c o h o l   b y   v o l u m e   % A B V .
Grape Maturity and Wine Quality Correlation
Previous studies correlating grape chemistry with the production of wines perceived as high quality have derived equations that can be used to estimate the quality of a finished wine produced from grapes at various stages of ripeness [10,12].
° B r i x     p H 2
° B r i x T A g 100   m L
The optimal ranges for these equations, as defined in previous studies, are 220–260 for Equation (2) and 30–32 for Equation (3).

2.3. Statistics

All statistical analyses were performed with JMP Pro 18 (SAS Institute, Cary, NC, USA) unless otherwise noted.

2.3.1. Boosted Tree Models

The relationship between ripening chemistry, environmental factors, grape genetics, and time are likely nonlinear and complex; thus, a boosted tree model was used to determine the relative importance of sampling day of the year, grape cultivar, vineyard location, and vintage (grow year) to each chemistry variable. Boosted tree models produce an additive sequence of small trees in layers that combine to form a large decision tree. Each small tree splits a specified number of times to create a series of decision paths. In boosted trees, the final prediction is the sum of the predictions made over the layers [25]. This approach allowed each of the predictor variables to contribute nonlinearly to the response and provided a corresponding relative measure of variable importance.
This analysis was performed to determine whether there was evidence that data from separate years and locations could be combined for the linear plateau models described above. In other words, we sought to determine if the importance of the intrinsic relationship between chemistry variables and separate grape cultivars was greater than the importance of vineyard location or vintage within our data set. Since our data set is limited to two growing years and five locations within a relatively small geographic region, this analysis is not intended to determine whether vintage or vineyard location influence grape ripening chemistry in general; it is intended only to measure the relative importance of the variables within our data set.
All boosted tree models were fit using the same structural specifications in JMP Pro 18 (SAS Institute, Cary, NC, USA). Each model contained 132 layers. Each tree contained 2 splits and the learning rate was set to 0.06. These settings were the default settings in JMP. No further optimization was performed because the coefficient of determination for all models was high (greater than 0.95) for all chemistry variables using these settings. No out of sample model validation was performed because the results of this analysis are not intended to be generalized beyond our sample.

2.3.2. Segmented Regression

Segmented regressions are a type of regression analysis where the data are modeled using multiple linear segments instead of a single straight line. Segmented regression analyses are used when the relationship between variables changes at specific points, exhibiting different linear trends across different intervals of the data. Each interval has its own linear regression line, with each regression line connected at a breakpoint, where the slope of the line changes.
In this study, linear plateau models, a type of segmented regression, were used to explore ripening kinetics. Linear plateau models are mathematically described as follows:
y = a b ( x c ) ,               w h e n   x < c ,             y = a ,     w h e n   x c ,
where c is a timepoint at which the value of y reaches a plateau. Therefore, a represents the value of y at and after the plateau timepoint, and b represents the slope of the line prior to the plateau point. These models were fit using the nls function in the stats package in R version 4.4.1 [26]. The minpack.lm package was used alongside the nls function to implement the Levenberg–Marquradt algorithm [27]. To determine when the estimates for these parameters differed by grape cultivar, a version of this model was fit to the variables where offsets for each parameter were included. The coefficients for these offsets were set to equal 0 when the grape cultivar was Chardonnay and 1 when the cultivar was Petit Manseng. That allowed the statistical test of the offset parameters differing from 0 to serve as statistical tests of the difference between the estimates for the two cultivars.

2.3.3. Linear Discriminant Analysis (LDA)

LDA projects high-dimensional data onto a lower dimensional space, with the goal of maximizing the separation between specified classes and minimizing the variation within each class. In other words, LDA attempts to use the information within the given variables to identify the class-identity of an observation [28].
In the present study, LDA was used to determine whether the variables measured were sufficient to identify a grape at any stage of the ripening process as Petit Manseng or Chardonnay. If a grape can always be identified with certainty as belonging to one cultivar or the other at any point during the growing period, then there is not a time when the two cultivars have similar characteristics across the provided variables. LDA enables testing the degree to which a certain combination of grape chemistry variables can be used to differentiate between grape cultivars within the data set. To determine whether there were combinations of chemistry variables that were able to produce perfect differentiation of the cultivars, LDA was initially performed including all grape chemistry variables as covariates. Then, stepwise variable selection was used to reduce the original set of included variables down to the minimal sets that were able to be used to discriminate between the cultivars.

3. Results and Discussion

This study characterized the ripening kinetics of Petit Manseng, a relatively rare grape variety that has become popular in Virginia, USA because it is well suited to vineyard conditions in that state. Characterizing ripening kinetics provides insights for grape growers and winemakers regarding vineyard management, harvest timing, and winemaking techniques for producing high-quality, dry table wine. Chardonnay was selected as a reference variety due to its status as the most widely planted white grape in Virginia, with well-documented ripening characteristics familiar to growers throughout the state and around the world [14].

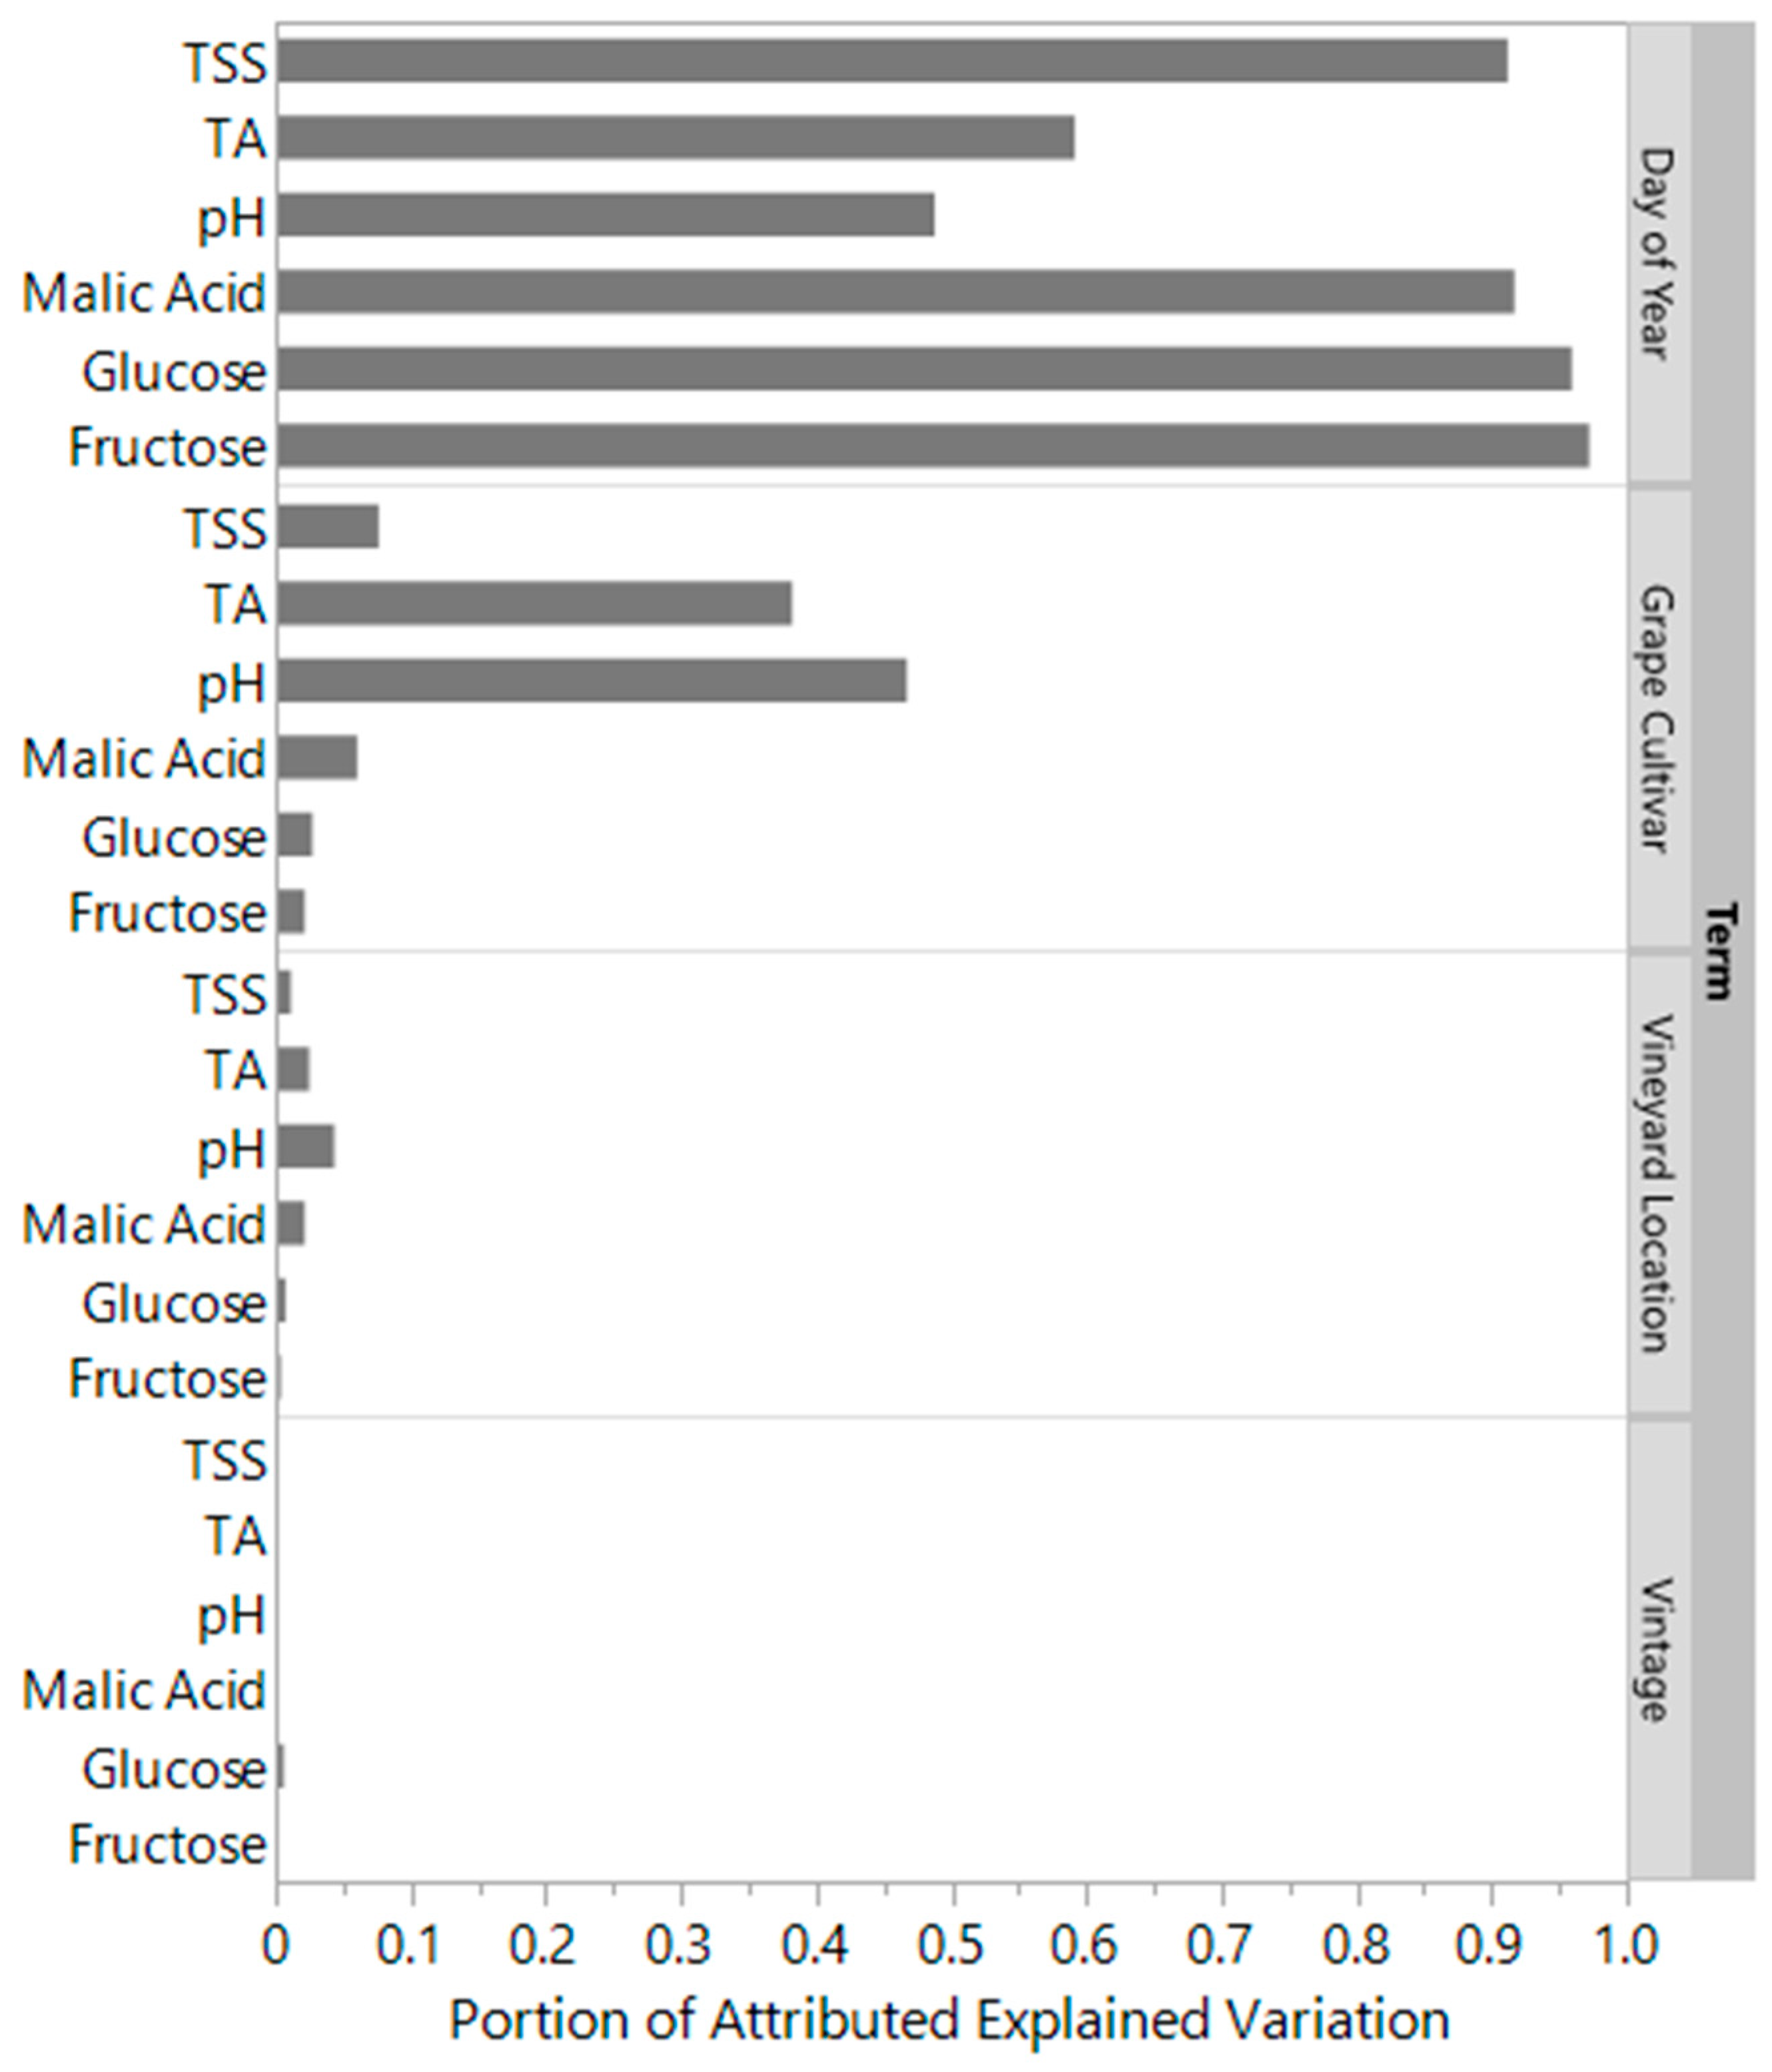
3.1. Grape Chemistry

Chardonnay and Petit Manseng grapes were characterized over two harvest seasons (2021 and 2022) across five different locations in Virginia for average berry weight, acid chemistry (including pH, TA, and malic acid), and sugar chemistry (including TSS, glucose, fructose, and glucose:fructose ratio). As expected, berry weight, pH, and sugars increased from veraison to harvest as the grapes matured, while acids decreased (Figure 3).

Boosted Tree Models

The boosted tree models explained greater than 95% of the variation in this data set across all measured variables (R2 for all models fell between 0.953 and 0.974), indicating that the models fit the data within our data set well. The day of the year (i.e., harvest timing) explained most of the variation in all models (Figure 4), suggesting a strong temporal pattern in the ripening kinetics across the variables. Grape cultivar explained the second most variation, especially for pH and TA. These results suggest that variations in ripening kinetics are most influenced by the timing of grape harvest and the cultivar harvested. Although vineyard location and vintage are important factors to consider, they explained a very small portion of the variation in ripening kinetics of grapes in the current sample set. Because of this, the data from both years and all locations were combined to further investigate the ripening kinetics of Virginia-grown Chardonnay and Petit Manseng grapes.

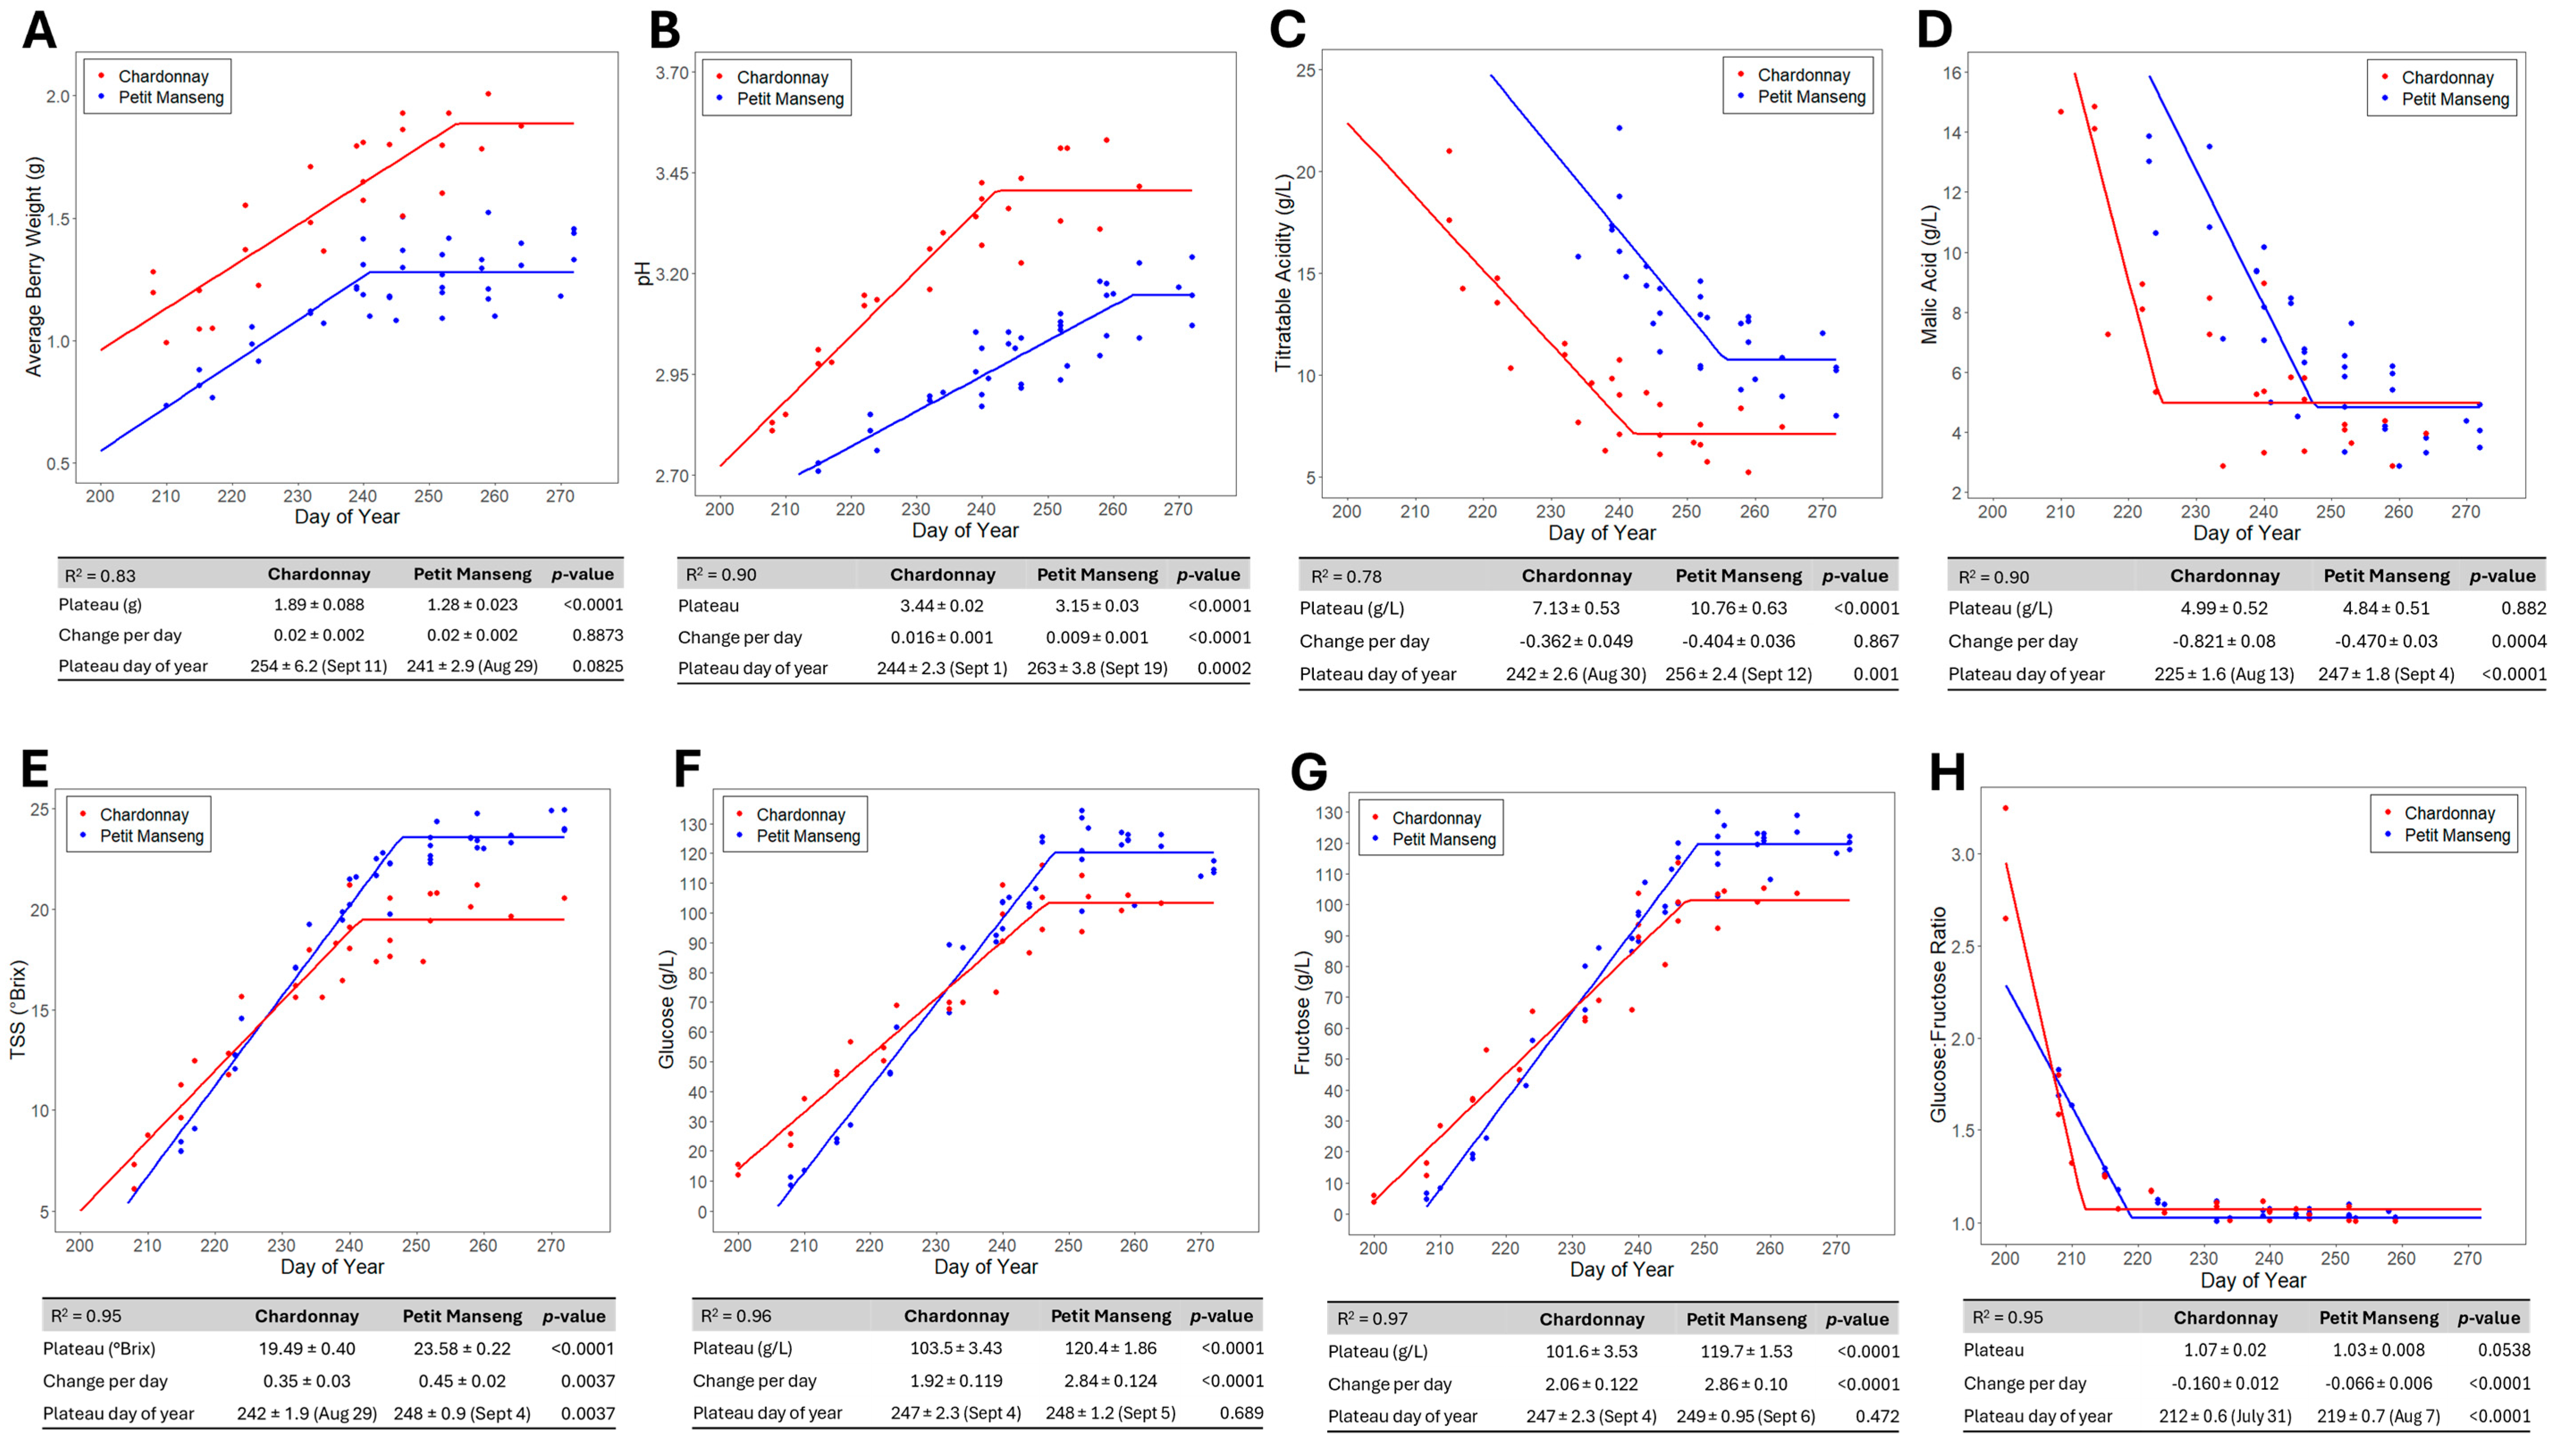
3.2. Ripening Kinetics

The ripening kinetics of Chardonnay and Petit Manseng grapes were characterized using segmented regressions, which model how a parameter changes over time by breaking the data into different segments and fitting separate regression lines to each segment of the data. In the present study, linear plateau regression (a type of segmented regression) models were used for each variable to quantify the rate of change during ripening, the day of year the grapes reached a plateau value, and the amount of each variable at and after the plateau. To unify ripening time scales across locations, all data were modeled using day of year as the time variable. The linear plateau models were a good fit for the data, as evidenced by the high R2 values for the predicted versus fitted line for each model. R2 values ranged from 0.78 to 0.97, indicating that most of the variability in the data was explained by the regressions (Figure 5).
For each parameter of grape chemistry measured, changes occurred early in the ripening process and plateaued later in the season (Figure 5), a pattern which is consistent with grape ripening among many varieties [5,9,29]. Separate models were fit to each grape cultivar to explore cultivar differences in these parameters. Taken together, these models highlight the fundamental differences in ripening kinetics between Chardonnay and Petit Manseng grapes.

3.2.1. Grape Berry Weights

As shown in Figure 5A, Petit Manseng grapes are smaller than Chardonnay grapes and plateaued at a smaller average berry weight (p < 0.0001), though the rate of increase prior to the plateau was similar between the two cultivars (p = 0.8873).

3.2.2. Grape Acid Kinetics

The acid kinetics of the grapes were characterized by pH, TA, and malic acid. For each of these variables, Petit Manseng grapes reached their plateaus later in the season than Chardonnay, with pH and malic acid changing at significantly different rates between the two grapes (p < 0.0001 and p = 0.0004, respectively; Figure 5B–D). Additionally, the significantly different plateau levels of TA and pH (p < 0.0001 and p = 0.0002, respectively) indicate that Petit Manseng grapes are significantly more acidic than Chardonnay grapes at maturity.
Both pH and TA are used as measures of acidity in wineries. Low pH (i.e., 3.0–3.5) is desired in white wine as it imparts microbial stability and amplifies the antimicrobial properties of SO2 in finished wines [6]. Though Saccharomyces yeast is generally tolerant of low pH, pH < 3.0 produces stressful conditions that may result in longer lag phase, lower overall cell mass, change in sugar conversion, and higher overall acetic acid production [30]. Petit Manseng is more likely to maintain a low pH than Chardonnay. The pH rose more rapidly in Chardonnay than Petit Manseng during ripening (p < 0.0001), with the plateaus modeled at 3.44 ± 0.02 and 3.15 ± 0.03, respectively, indicating that Petit Manseng may be more microbially stable than Chardonnay during fermentation.
While pH imparts microbial stability, TA is the measure most closely associated with the perceived tartness of the wine during consumption [7,8]. For white table wines, a harvest parameter of grape berries with TAs in the range of 7.0–9.0 g/L is desirable, as this tends to produce a balanced wine that is not overly tart [13,31]. Chardonnay grapes in this study plateaued at 7.13 ± 0.53 g/L, while Petit Manseng plateaued at 10.76 ± 0.63 g/L, which may produce a sour wine.
Grapes contain several organic acids that contribute to TA, with the most important acids for wine quality being tartaric and malic acid. Both are formed early in berry development and decrease after veraison, with depletion rates depending on different processes for each acid [9,10]. Determining which acid is driving TA kinetics aids producers in adopting targeted strategies to mitigate high acidity. In the current study, malic acid plateaued at a similar level in both cultivars (p = 0.882), indicating that other acids (e.g., tartaric) in the grapes are likely responsible for the differences in TA between these two varieties.

3.2.3. Grape Sugar Kinetics

The sugar kinetics of the grapes were described by TSS, glucose, fructose, and the glucose:fructose ratio. In contrast to the acid kinetics, the sugar kinetics show that sugars accumulate more rapidly and plateau at a higher level in Petit Manseng grapes, though this plateau is reached at a similar day of year for both varieties (Figure 5E–H). The plateau value for the glucose:fructose ratio is slightly lower in Petit Manseng (p = 0.0538), which could be related to a difference in the rate at which glucose and fructose load in Chardonnay grapes.
Sugar is produced by photosynthesis in the leaves and transported to berries as sucrose by phloem vessels [9]. Post-veraison, sugar accumulates rapidly in berries before leveling off when high levels of glucose in the berries cause the suppression of the transporters needed for sugar to enter cells, cutting off phloem vessels [9].
In this study, sugar accumulation rates were different between the grapes, with TSS, glucose, and fructose accumulating significantly faster in Petit Manseng than Chardonnay (p = 0.0037, p < 0.0001, and p < 0.0001, respectively). Additionally, the concentrations of total and individual sugars in the berries at physiological maturity was higher in Petit Manseng than Chardonnay (p < 0.0001 for TSS, glucose, and fructose). Grapes with higher sugar content result in finished wines with higher alcohol potential [11]; in the present study, finished wines made from these grapes are estimated to have alcohol concentrations of 12.2% and 14.3% ABV for Chardonnay and Petit Manseng, respectively.
This pattern of sugar loading in Petit Manseng poses several challenges for production of dry style wine as ethanol is a significant stress factor for yeast used in fermentation [31]. At concentrations above 14%, yeast activity declines and may stop completely [20]. When combined with other factors such as low pH, cell membranes become compromised, and fermentation slows or stops [20]. To achieve an ABV value < 14% in finished wines, glucose + fructose must be <230 g/L in the harvested berries [24].
Sugar accumulation also correlates with the accumulation of grape berry flavors in the aromas of finished wines. When grapes are harvested shortly after reaching physiological ripeness, they typically produce wines with fresh, citrus aromas, while grapes that are allowed to hang longer typically produce wines with strong tropical aromas [29]. Because Petit Manseng grapes reach physiological maturity relatively early in their ripening and often hang on the vines for several weeks until harvest, this may contribute to the strong tropical aromas attributed to these wines.

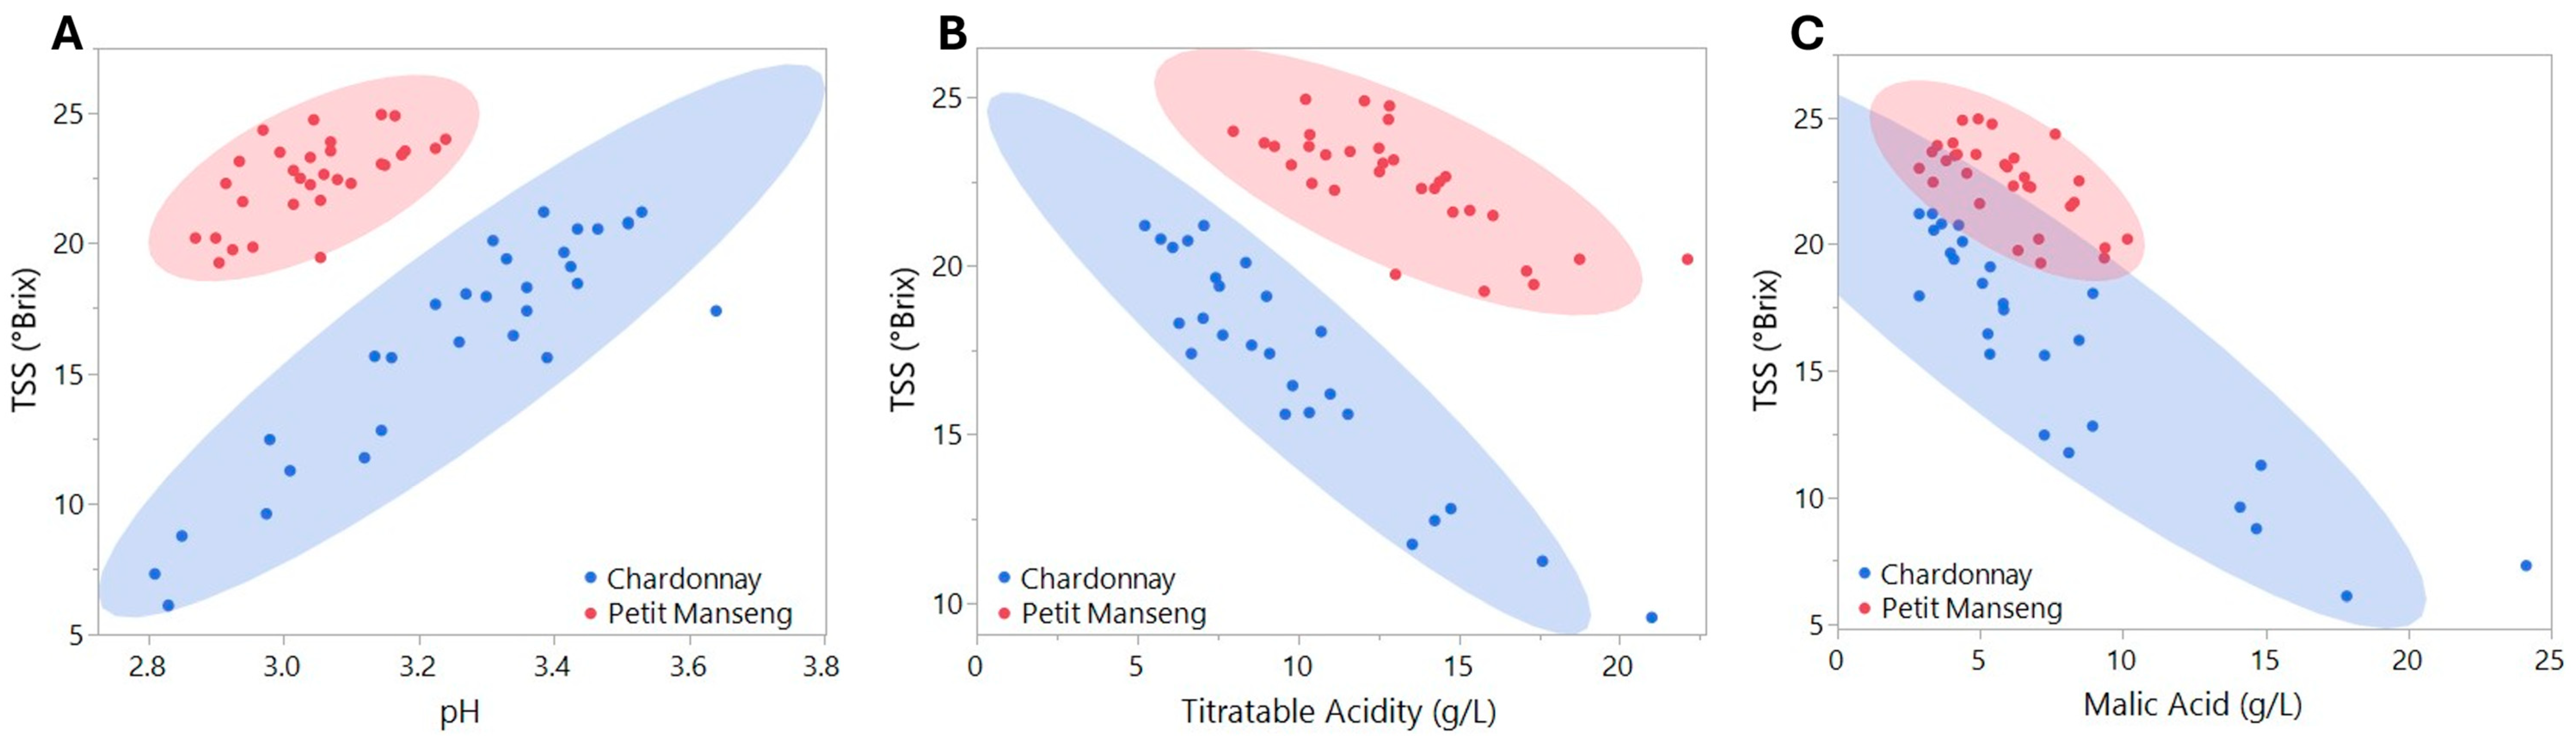
3.3. Fundamental Differences in Chardonnay and Petit Manseng Grapes

To better understand whether there is any point during ripening when the sugar and acid chemistry of Petit Manseng and Chardonnay grapes align, LDA was used (Figure 6). In this study, LDA was used to determine whether an observation could be identified as coming from a Petit Manseng or Chardonnay grape given any number of the measured chemistry variables. If the chemistry variables can be used to perfectly identify the grapes, then the two cultivars do not align on that set of chemistry variables at any point in time in the growing period.
There were several minimal sets of variables that were able to produce perfect discrimination between Petit Manseng and Chardonnay grapes. All minimal sets were a pair of one sugar variable and one acid variable. For example, the LDA plot of pH vs. TSS showed complete separation of Chardonnay and Petit Manseng grapes (Figure 6). This means that there is no point in time during the ripening period when Petit Manseng grapes have both similar sugar and acid levels to Chardonnay grapes. This perfect discrimination between grape types was also observed for the following pairs of variables: pH vs. glucose, pH vs. fructose, TA vs. fructose, and TA vs. TSS. When comparing TA vs. glucose, 5.6% of observations were misclassified.
Interestingly, the only acid variable that was unable to produce perfect discrimination between the grapes in our data set when paired with a sugar variable was malic acid. Malic acid vs. TSS, glucose, and fructose resulted in 9.2%, 19.4%, and 16.1% of observations being misclassified, respectively. This suggests that the other primary acid present, tartaric acid, is likely responsible for more of the discrepancy in acid content between the two cultivars. Although tartaric acid was not directly measured in this study, due to analytical challenges with its high precipitability [32], it is one of the two major organic acids in grapes influencing TA. Furthermore, the inference that tartaric acid is likely driving the distinction between TA and sugars in LDA aligns with observations from the segmented regression analysis (Figure 5) demonstrating that malic acid plateaued at similar levels in both varieties while TA was markedly different. Taken together, the authors consider it likely that tartaric acid is driving the acidity differences between these two varieties, though further research is needed to verify this inference. Aside from malic acid, the ability of all other acid variables to perfectly discriminate between grape varieties indicates that there is a fundamental difference in the grape chemistry of these two cultivars. Furthermore, because the LDA model included all data across the ripening period, this analysis also revealed that there is no timepoint during which the fundamental chemistry of Petit Manseng grapes is comparable to that of Chardonnay.

3.4. Implications for Winemakers

The results of the current study demonstrate the fundamental differences in both the ripening kinetics and the chemistry of Chardonnay and Petit Manseng grapes. The high sugar and acid content in Petit Manseng grapes lead to wines with high alcohol and acid contents, with the longer time between physiological ripeness and harvest likely leading to intense tropical aromas [10,27]. To make a dry-style wine, the sugars and acids must be balanced, as there is an inverse relationship between the perceptions of sweetness and acidity in finished wines [33]. During grape ripening, there is also an inverse relationship between acids and sugars, with sugars increasing and acids decreasing from veraison to harvest.

3.4.1. Grape Chemistry and Fermentation to Make Dry-Style Wine

As detailed above, to make a traditional dry white wine, grapes are harvested with pH 3.0–3.5, TA 7–9 g/L, and glucose + fructose < 230 g/L. Thus, if there is a point during the ripening process when grape chemistry fits these parameters, it may be possible to produce a dry white wine.
For Chardonnay grapes in the present study, the segmented regressions estimate that all physiologically mature grapes (i.e., after cessation of sugar loading) meet these parameters and could likely be used to make a dry white wine. The limiting factor with Chardonnay is waiting for TA to drop below 9.0 g/L; on average, this threshold was reached on the 237th day of the year (25 August) in the current sample set, implying that, chemically, any grapes harvested after this date may be suitable for producing a dry white wine. Late season harvesting of Chardonnay is possible, though the high pH (plateau = 3.44 ± 0.02) could result in microbially unstable fermentations.
For Petit Manseng grapes in the present study, there is no point during ripening that pH, TA, and glucose + fructose align to make a dry-style wine. Based on the segmented regression, pH does not rise above 3.0 until the 247th day of the year (4 September). However, this is the same day that the glucose + fructose content exceed the limit of 230 g/L. Furthermore, TA does not plateau until day 255 (12 September), and even at the plateau of 10.76 g/L, it is still well above the desired range of 7–9 g/L.
In both varieties, pH continued to rise throughout ripening, even after the cessation of sugar loading. However, if Petit Manseng grapes were picked at physiological maturity to improve the glucose:fructose ratio and preserve fresher aromas, the acidity of the grapes would be too high (pH~3.00 and TA~13.99 g/L) to make a traditional dry-style wine.

3.4.2. Predicting Wine Quality Based on Grape Chemistry

Other metrics of sugar–acid balance, based on °Brix, have also been defined as quantitative indicators of grape maturity for quality wine production [10,12]. Using the predictive equations defined in these studies, the potential to create a dry-style wine that is perceived as high quality was calculated at both physiological maturity (i.e., cessation of sugar accumulation) and the plateau of acid depletion measured in both Chardonnay and Petit Manseng grapes in this study (Table 2). While these measures provide values for sugar–acid balance that can be compared across vintages and sites, the optimal ranges defined in the initial studies are variable across regions and may not be good indicators of varietal character [12].
As shown in Table 2, calculated values for Virginia Chardonnay at both physiological maturity and plateau fall in the optimal range for the pH-based calculation but are below the TA-based calculation, which is likely due to the relatively low °Brix values measured for these grapes. In contrast, calculated values for Virginia Petit Manseng only fall in the optimal range for the pH-based calculation at plateau; all other values are well below the optimal range. This is likely driven by the high TA content in these grapes. Harvesting Petit Manseng prior to physiological maturity may reduce the alcohol content of the finished wine, but the prohibitively high acid content at earlier harvest dates further decreases the calculated values for balance.
Taken together, these data indicate that not all vintages or vineyards may be appropriate for production of a dry-style Petit Manseng that meets traditional standards of wine balance. However, throughout the sampling periods, there were nine occurrences of Chardonnay and 11 of Petit Manseng that were within the optimal range for sugar–acid balance using the pH-based calculation. For the TA-based calculation, there were only three occurrences of Chardonnay and one of Petit Manseng that were in the optimal range. Thus, to produce dry style wines from Petit Manseng, there is no optimal harvest timing for Petit Manseng, where the grapes have TA <9 g/L and glucose + fructose <230 g/L. Because of this, winemakers may need to employ cellar operations to mitigate high TA values. However, because tartaric acid is likely driving the high acidity and TA of Petit Manseng, there are limited options for reducing tartaric acid because it is microbially stable and cannot be reduced through fermentation strategies. Tartaric acid is susceptible to chemical manipulation, making it susceptible to precipitation with potassium found in grape skins [5,9,10]. By incubating destemmed grapes on skins prior to pressing and using high pressure, tartaric acid may be lowered through increased precipitation [31]. Alternatively, the juice of pressed grapes can be treated with calcium carbonate to precipitate calcium carbonate, though these operations have limits and may negatively influence the composition of the finished wine [31]. Taken together, these results suggest that it will be difficult for winemakers to achieve a high-quality dry Petit Manseng because of its high TA and high sugar content.

4. Conclusions

The ripening kinetics of Petit Manseng and Chardonnay are fundamentally different. Despite sampling from five locations over two vintages, site and vintage did not significantly influence these differences, suggesting that the sugars, acids, and ripening kinetics are intrinsic to each variety. This finding is particularly relevant for growers and winemakers aiming to produce dry-style Petit Manseng wines. When novel grape varieties are introduced, standard viticultural and winemaking practices are typically applied to establish a baseline understanding of grape and wine characteristics. However, the results of this study indicate that applying conventional approaches used for Chardonnay—such as site selection, harvest timing, yeast strain, and fermentation conditions—will yield wines with fundamentally different chemical profiles in Petit Manseng. In light of these inherent differences between these two grapes, winemakers may need to adapt their winemaking practices to achieve an acceptable dry-style Petit Manseng, though more research is needed to determine appropriate approaches to produce such a wine.

Author Contributions

Conceptualization, D.P.C., J.H.T. and E.A.C.; methodology, D.P.C., J.H.T., A.A.S. and E.A.C.; formal analysis, D.P.C., J.H.T. and A.A.S.; investigation, D.P.C., J.H.T., A.A.S., L.E.M., E.A.C. and A.M.S.; resources, D.P.C., J.H.T. and E.A.C.; data curation, D.P.C. and A.A.S.; writing—original draft preparation, D.P.C., J.H.T., A.A.S., L.E.M. and A.M.S. writing—review and editing, D.P.C., J.H.T., A.A.S., L.E.M. and A.M.S.; visualization, D.P.C. and A.A.S.; supervision, D.P.C., J.H.T. and E.A.C.; project administration, D.P.C., J.H.T. and E.A.C.; funding acquisition, D.P.C., J.H.T. and E.A.C. All authors have read and agreed to the published version of the manuscript.

Funding

This research was funded by the Virginia Wine Board (grant ID: PSDTRTJP).

Data Availability Statement

The data presented in this study are availability in the article. Upon reasonable request, additional data may be made available.

Conflicts of Interest

The authors declare no conflicts of interest.

Abbreviations

The following abbreviations are used in this manuscript:
%ABVPercent alcohol by volume
LDALinear discriminant analysis
TATitratable acidity
TSSTotal soluble solids

References

  1. Moreno-Arribas, M.V.; Polo, M.C. Wine Chemistry and Biochemistry, 1st ed.; Springer: New York, NY, USA, 2009. [Google Scholar]
  2. Kunter, B.; Unal, O.B.; Keskin, S.; Hatterman-Valenti, H.; Kaya, O. Comparison of the sugar and organic acid components of seventeen table grape varieties produced in Ankara (Türkiye): A study over two consecutive seasons. Front. Plant Sci. 2024, 15, 1321210. [Google Scholar] [CrossRef] [PubMed]
  3. Perrot, N.; Tonda, A.; Brunetti, I.; Guillemin, H.; Perret, B.; Goulet, E.; Guerin, L.; Picque, D. A decision-support system to predict grape berry quality and wine potential for a Chenin vineyard. Comput. Electron. Agric. 2022, 200, 107167. [Google Scholar] [CrossRef]
  4. Bigard, A.; Romieu, C.; Sire, Y.; Veyret, M.; Ojeda, H.; Torregrosa, L. The kinetics of grape ripening revisited through berry density sorting. OENO One 2019, 53, 709–724. [Google Scholar] [CrossRef]
  5. Kennedy, J. Understanding Grape Berry Development. Practical Winery and Vineyard. 2002. Available online: https://jcast.fresnostate.edu/ve/documents/outreach/Understanding-page%2014.pdf (accessed on 28 April 2025).
  6. Boulton, R.B.; Singleton, V.L.; Bisson, L.F.; Kunkee, R.E. Principles and Practices of Winemaking, 1st ed.; Springer: Boston, MA, USA, 1999. [Google Scholar]
  7. Plane, R.; Mattick, L.; Weirs, L. An Acidity Index For The Taste Of Wines. Am. J. Enol. Vitic. 1980, 31, 265–268. [Google Scholar] [CrossRef]
  8. Waterhouse, A.L.; Sacks, G.L.; Jeffery, D.W. Understanding Wine Chemistry, 2nd ed; Wiley: Hoboken, NJ, USA, 2024. [Google Scholar]
  9. Conde, C.; Silva, P.; Fontes, N.; Dias, A.; Tavares, R.; Sousa, M.; Agasse, A.; Delrot, S.; Geros, H. Biochemical Changes throughout Grape Berry Development and Fruit and Wine Quality. Food 2007, 1, 1–22. Available online: https://hdl.handle.net/1822/6820 (accessed on 28 April 2025).
  10. Bisson, L. In Search of Optimal Grape Maturity. Pract. Winery Vineyard J. 2001, 23, 32–43. [Google Scholar]
  11. Jordao, A.; Vilela, A.; Cosme, F. From Sugar of Grape to Alcohol of Wine: Sensorial Impact of Alcohol in Wine. Beverages 2015, 1, 292–310. [Google Scholar] [CrossRef]
  12. Du Plessis, C.S. Optimum Maturity and Quality Parameters in Grapes: A Review. S. Afr. J. Enol. Vitic. 1984, 5, 34–42. [Google Scholar] [CrossRef]
  13. Wolf, T.K. Wine Grape Production Guide for Eastern North America, 1st ed.; Plant and Life Sciences Publishing: Ithaca, NY, USA, 2008. [Google Scholar]
  14. Virginia Vineyards Association. Virginia Wine 2023 Commercial Wine Grape Report. 2024. Available online: https://virginiavineyardsassociation.org/commercial-report/ (accessed on 10 June 2025).
  15. Robinson, J. The Oxford Companion to Wine, 4th ed.; Oxford University Press: Oxford, UK, 2016. [Google Scholar]
  16. Robinson, J.; Harding, J.; Vouillamoz, J. Wine Grapes: A Complete Guide to 1368 Vine Varieties, including their Origins and Flavours, 1st ed.; Penguin Books: London, UK, 2012. [Google Scholar]
  17. U.S. Wine Market: Size, Share & Trends Analysis Report, By Product (Table Wine, Dessert Wine Sparkling Wine), By Distribution (On-Trade, Off-Trade), Competitive Landscape And Segment Forecasts, 2018–2025; Grand Review Research: San Francisco, CA, USA, 2018.
  18. McMillan, R. State of the US Wine Industry 2020. 2021. Available online: https://www.svb.com/globalassets/library/uploadedfiles/reports/svb-2020-state-of-the-wine-industry-report-final.pdf (accessed on 28 April 2025).
  19. Ting, J.H. Trial Evaluates Optimum Time To Harvest Dry Petit Manseng. 2020. Available online: https://virginiavineyardsassociation.org/wp-content/uploads/2020/12/Winter2020_GrapePress.pdf (accessed on 28 April 2025).
  20. Bisson, L. Stuck and sluggish fermentations. Am. J. Enol. Vitic. 1999, 50, 107–119. [Google Scholar] [CrossRef]
  21. Virginia Vineyards Association. Virginia Wine 2021 Commercial Wine Grape Report. 2022. Available online: https://virginiavineyardsassociation.org/commercial-reports/ (accessed on 10 June 2025).
  22. Virginia Vineyards Association. Virginia Wine 2022 Commercial Wine Grape Report. 2023. Available online: https://virginiavineyardsassociation.org/commercial-reports/ (accessed on 10 June 2025).
  23. AOAC International. Official Methods of Analysis of AOAC International, 22nd ed.; Official Method 962.12; AOAC International: Gaithersburg, MD, USA, 2023. [Google Scholar]
  24. ETS labs. Choosing Glucose + Fructose Instead of Brix. Available online: https://www.etslabs.com/publications/publication/8 (accessed on 9 April 2025).
  25. Elith, J.; Leathwick, J.; Hastie, T. A working guide to boosted regression trees. J. Anim. Ecol. 2008, 77, 802–813. [Google Scholar] [CrossRef] [PubMed]
  26. R Core Team. R: A Language and Environment for Statistical Computing; R Foundation for Statistical Computing: Vienna, Austria, 2024; Available online: https://www.R-project.org/ (accessed on 14 April 2025).
  27. Elzhov, T.V.; Mullen, K.M.; Spiess, A.; Bolker, B. minpack.lm: R Interface to the Levenberg-Marquardt Nonlinear Least-Squares Algorithm Found in MINPACK, Plus Support for Bounds_. R package Version 1.2-4. 2023. Available online: https://CRAN.R-project.org/package=minpack.lm (accessed on 14 April 2025).
  28. Xanthopoulos, P.; Pardalos, P.M.; Trafalis, T.B. Linear Discriminant Analysis. In Robust Data Mining, 1st ed.; SpringerBriefs in Optimization; Springer: New York, NY, USA, 2013; pp. 27–33. [Google Scholar]
  29. Deloire, P. The concept of berry sugar loading. WineLand Mag. 2011, 257, 93–95. [Google Scholar]
  30. Liu, X.Y.; Jia, B.; Sun, X.Y.; Ai, J.Y.; Wang, L.H.; Wang, C.; Zhao, F.; Zhan, J.C.; Huang, W.D. Effect of Initial pH on Growth Characteristics and Fermentation Properties of Saccharomyces cerevisiae. J. Food Sci. 2015, 80, M800–M808. [Google Scholar] [CrossRef] [PubMed]
  31. Ribereau-Gayon, P.; Dubourdieu, D.; Doneche, B.; Lonvaud, A. Handbook of Enology Volume 1: The Microbiology of Wine and Vinifications, 1st ed.; Wiley: West Sussex, UK, 2006. [Google Scholar]
  32. Shayanfar, S.; Bodbodak, S. Effect of different physicochemical de-tartration methods on red grape juice quality. J. Food Sci. Technol. 2014, 51, 4084–4089. [Google Scholar] [CrossRef] [PubMed]
  33. Zoecklein, B. Enology Notes #108. 2005. Available online: https://www.enology.fst.vt.edu/EN/108.html (accessed on 10 April 2025).
Figure 1. Pictures of Petit Manseng and Chardonnay grapes.
Beverages 11 00108 g001
Figure 2. Map of United States, Virginia, and locations of vineyards sampled within Virginia.
Beverages 11 00108 g002
Figure 3. Grape chemistry for Chardonnay and Petit Manseng grapes from veraison to harvest at five Virginia sites over two years (2021 and 2022). (A) average berry weight, (B) pH, (C) TA, (D) malic acid, (E) TSS, (F) glucose, (G) fructose, and (H) glucose:fructose ratio. Within each plot, different letters represent grapes collected from different vineyards and correspond to vineyards described in Table 1 and Figure 2. “Day of Year” refers to the calendar day of year (i.e., 1 January = 1, 1 September = 244).
Beverages 11 00108 g003
Figure 4. Boosted tree regression model showing relative influence of each factor (i.e., day of year, grape cultivar, vineyard location, and vintage) in the model. The boosted tree model was fit to each chemistry variable, with the factors of day of year, grape cultivar, vineyard location, and vintage (growing year) used as predictors.
Beverages 11 00108 g004
Figure 5. Ripening kinetics of Chardonnay and Petit Manseng grapes. Linear plateau models (a type of segmented regression) were fit to the chemistry variables to characterize the change per day prior to ripeness, the plateau value for each variable, and the day of the year at which the plateau occurred. (A) average berry weight, (B) pH, (C) TA, (D) malic acid, (E) TSS, (F) glucose, (G) fructose, and (H) glucose:fructose ratio. “Day of Year” refers to the calendar day of year (i.e., 1 January = 1, 1 September = 244). Grapes were sampled from veraison to harvest (i.e., day 200 (19 July) to day 272 (29 September)).
Beverages 11 00108 g005
Figure 6. LDA correlation plots with 95% confidence ellipses, for example, pairs of acid and sugar variables. LDA uses linear combinations of the variables to group them by grape cultivar. In the case of 2D LDA, correlation plots can be used to visualize this process. Ellipses that are completely separated indicate that those two variables can be used to perfectly discriminate (i.e., correctly classify) between the two grape cultivars. Conversely, when the ellipses overlap, it is not possible to perfectly discriminate between the grape cultivars using only those two variables. (A) pH vs. TSS and (B) TA vs. TSS both show perfect discrimination between grape cultivars. (C) malic acid vs. TSS cannot separate the cultivars, indicating that another variable is driving the separation observed in other LDA plots.
Beverages 11 00108 g006
Table 1. Vineyard characteristics of sites sampled.
Vineyard aRegionAVALatitudeLongitudeAcreageType
AShenendoah Valleyn/a b38.88070−78.065411.5Commercial
BNorthern VirginiaMiddleburg AVA39.17987−77.723902.0Commercial
CShenendoah ValleyShenendoah Valley AVA39.14478−78.29782<0.5Experimental
DCentral VirginiaMonticello AVA38.18495−78.144912.5Commercial
ECentral VirginiaMonticello AVA38.06244−78.728502.0Commercial
a Vineyards de-identified for publication purposes. b n/a = not applicable.
Table 2. Predictions of wine quality at physiological maturity and plateau of acid depletion.
ChardonnayPetit Manseng
Physiol. MaturityPlateauPhysiol. MaturityPlateau
Day of year a241 (29 August)244 (1 September)247 (4 September)262 (19 September)
°Brix19.519.523.623.6
pH3.333.443.003.16
TA (g/L)7.497.1313.9910.76
°Brix ∗ pH2 b224231212236
°Brix/TA c26.027.316.922.0
a Grapes were sampled from veraison to harvest (i.e., day 200 (19 July) to day 272 (29 September)). Day of year refers to plateau for sugar accumulation and acid depletion and is derived from data in Figure 5. b Optimal range: 220–260. c Optimal range: 30–32.
Disclaimer/Publisher’s Note: The statements, opinions and data contained in all publications are solely those of the individual author(s) and contributor(s) and not of MDPI and/or the editor(s). MDPI and/or the editor(s) disclaim responsibility for any injury to people or property resulting from any ideas, methods, instructions or products referred to in the content.

