Article

Accurate Determination of 24 Water-Soluble Synthetic Colorants in Premade Cocktail Using Ultra-Performance Liquid Chromatography with Diode Array Detection

1
National Institute of Metrology of China, Beijing 100029, China
2
Beijing Institute of Metrology, Beijing 100029, China
*
Author to whom correspondence should be addressed.
Beverages 2025, 11(3), 91; https://doi.org/10.3390/beverages11030091
Submission received: 29 April 2025 / Revised: 31 May 2025 / Accepted: 6 June 2025 / Published: 12 June 2025
(This article belongs to the Section Wine, Spirits and Oenological Products)

Abstract

A rapid, traceable, and highly sensitive method was developed for the simultaneous separation and quantification of 24 water-soluble synthetic colorants in premade cocktails, utilizing ultra-performance liquid chromatography coupled with diode array detection (UPLC-DAD). The purity of each colorant was individually confirmed through multi-wavelength analysis. Chromatographic conditions, including mobile phase composition and gradient elution, were meticulously optimized, achieving the separation of the 24 colorants on a BEH C18 column using a linear gradient elution within 16 min. The mobile phase consisted of an ammonium acetate solution (100 mmol/L, pH 6.25) and a mixed organic solvent of methanol and acetonitrile (2:8, v/v). The method exhibited excellent linearity across the concentration range of 0.005–10 μg/mL, with limits of detection (LODs) ranging from 0.66 to 27.78 μg/L for all 24 colorants. The method also demonstrated good precision (0.1–4.9%) at various concentration levels and recoveries ranging from 87.8% to 104.5% at spiked concentrations of 0.1, 0.5, and 1.0 μg/mL. A comparison with other published methods for colorant determination in food samples using HPLC-DAD and LC-MS (2014–2024) revealed that the proposed method offers superior performance in terms of the number of analytes detected, lower limits of detection, and reduced analytical time. Finally, the method was successfully applied to the analysis of colorants in premade cocktails from different sources.

1. Introduction

In the contemporary food industry, colorants are extensively used to enhance the aesthetic appeal of a wide range of products, including beverages and premade cocktails. These additives impart vibrant colors that significantly improve the visual attractiveness of food, which, in turn, can positively influence consumer preferences and boost sales [1]. Colorants utilized in the food industry are broadly categorized into synthetic and natural dyes. Compared to natural colorants, synthetic colorants are more cost-effective, more stable, and more accessible. Therefore, the application of synthetic food colorants has become increasingly prevalent in the food industry [2]. However, some food colorants posed a potential risk to human health, especially if they were excessively consumed. For this reason, safety data, such as the acceptable daily intake, based on toxicological studies [3,4] on experimental animals and human clinical studies, have been repeatedly determined and evaluated by the FAO and WHO [5,6].
To protect public health, many countries have established strict regulations regarding the permissible types, application ranges, and maximum allowable concentrations of food colorants [7,8,9]. Nonetheless, some food producers exceed these limits or introduce illegal colorants, which can pose significant health risks [10,11]. At the same time, all food ingredients and content including food colorants are required to be listed on the food labels, and these ingredients need be the same as those on the food labels [12]. Consequently, it is crucial to develop rapid and accurate methods for the simultaneously determination of food colorants in various samples in order to ensure compliance with food safety standards and to meet the needs of this expanding food market, particularly in China.
Various analytical methods for determining food colorants have been proposed, including spectrophotometry [13], Raman spectroscopy [14], capillary electrophoresis (CE) [15], voltammetry [16,17], fluorescence quenching method [18], ion mobility spectrometry [19], high-performance liquid chromatography (HPLC) with ultraviolet/visible (UV/Vis) or diode-array detector (DAD) detection [20,21,22,23,24,25,26,27,28,29,30], and liquid chromatography tandem mass spectrometry (LC–MS/MS) [31,32,33,34,35,36,37,38].
While voltammetry, spectrophotometry, and Raman spectroscopy were simple and rapid, they are less suitable for the simultaneous detection of multiple colorants. Capillary electrophoresis offers high resolution, short analysis time, and low sample and reagent consumption, making it effective for analyzing complex matrices, though it exhibits poorer repeatability compared to HPLC. Ion mobility spectrometry and fluorescence quenching methods are less commonly applied due to inherent limitations of their own, and research on the analysis of food colorants using these methods is in its infancy, requiring further development.
Traditional techniques such as HPLC-DAD and LC–MS/MS remain widely used for the simultaneous analysis of numerous colorants, with recent advancements in liquid chromatography high-resolution mass spectrometry (LC-HR-MS) offering better selectivity, better sensitivity, and the possibility for multi-analyte detection [38,39]. Therefore, LC-HR-MS is particularly valuable for screening colorants in food or detecting new illegal additives, such as Rhodamine 6G, for which standard reference materials are not yet available [32]. In the LC-MS/MS methods, small amounts of organic acids, such as formic acid or trifluoroacetic acid, are typically added to the mobile phase to enhance the ionization of the ESI ion source. However, the pH sensitivity of colorants during ionization can lead to the formation of multi-charged or unstable ions, often necessitating frequent cleaning of the ion source [33,34]. Despite its high initial costs and matrix interference challenges, LC–MS/MS remains indispensable for the multi-analyte analysis of food colorants.
The HPLC-DAD method benefits from the strong absorption peaks of food colorants within the visible wavelength (400–700) nm. By optimizing the gradient elution program and selecting appropriate multi wavelength monitoring mode in the DAD, this method enables effective analysis of numerous colorants [20,21,22,23,24,25,26,27,28,29,30,39]. In recent years, due to the trace level of food dyes and the complexity of food matrices, sample pretreatment has become an inevitable procedure prior to instrumental analysis in order to enhance the sensitivity through pre-concentration. Recent HPLC studies have utilized techniques like liquid–liquid extraction (LLE) [21,23,33,36,40], solid-phase extraction (SPE) [28,35], dispersive solid-phase extraction (d-SPE) [24,25,34,41], and ultrasound-assisted extraction (UAE) [30] for isolating colorants. While these methods provide excellent quantitative results, they typically permit the simultaneous analysis of fewer than ten colorants, limiting their utility for monitoring synthetic dyes in commercially available foods.
Compared to LC-MS/MS, HPLC-DAD is more cost-effective, simpler, and easier to implement in routine food analysis [22,23,24,25,26,27,28,29]. Following the introduction of GB 5009.35-2023 [39], research into the chromatographic analysis of food colorants has become a prominent focus in China. Thus, the development of methods for the simultaneous analysis of various synthetic colorants using HPLC-DAD, with low cost, simplicity, and a short analysis time, remains a promising area of research.
However, the simultaneous determination of a large number of structurally diverse colorants remains a major analytical challenge due to their differing acid–base properties, solubilities, and polarities. Therefore, the present work employed a cost-effective HPLC approach that is suitable for routine use in most analytical laboratories, while achieving an extended linear range and demonstrating improved performance in terms of LOD and LOQ compared to previously reported methods.
The present study aimed to develop a practical and versatile multiclass HPLC-DAD method, alongside optimized sample preparation, for the simultaneous determination of a diverse range of food colorants with varying acidic–basic properties, solubility, and polarities in premade cocktails samples. This study reports a rapid and efficient method for detecting 24 food colorants, including illegal ones, using UPLC-DAD, contributing to advancements in colorant analysis and facilitates colorant monitoring and regulation in the food industry. The analyzed colorants include both permitted and prohibited substances across different countries. Notably, colorants such as Ponceau SX, Ponceau S, Red 2 G, and Rhodamine B, which were once approved for use in food, are currently banned due to their toxicity [6]. The developed method was validated according to the GB2760 and FDA guidelines for chemical methods validation [8,9] and was applied to analyze approximately 100 premade cocktail samples collected from local markets in China.

2. Experimental Section

2.1. Chemicals and Reagents

The details of the 24 food colorants reference materials (RM) are presented in Table 1. Nine certified reference materials (CRM) were provided by the National Institute of Metrology, China (NIM), seven RMs were purchased from Sigma–Aldrich company (St. Louis, MO, USA), five from Toronto Research Chemicals Inc. (Toronto, ON, Canada), and three from Dr. Ehrenstorfer company (Augsburg, Germany). All colorant RMs were used as received and with purities exceeding 85%, as indicated in their respective certificates. Additionally, for all colorant RMs, except the nine CRM obtained from NIM, the purity was re-evaluated using the HPLC-DAD method, and the results are displayed in Table 1.
HPLC-grade formic acid was purchased from Acros Organics Company (Fair Lawn, New Jersey, USA). Acetic acid (HPLC grade) was obtained from CNW Technologies GmbH (Duesseldorf, Germany). Ammonium acetate, methanol, and acetonitrile (HPLC grade) were purchased from Merck Company (Darmstadt, Germany). Water was purified through a Milli-Q water purification system (Millipore, Bedford, MA, USA). Ammonia solution (Analytical pure) was obtained from Beijing Chemical Works (Beijing, China).

2.2. Standard Solution Preparation

A stock solution of 100 μg/mL, containing 17 water-soluble synthetic colorants (except for the seven CRM colorants obtained from NIM), was prepared using ultrapure water Recovery studios (18.2 MΩ·cm) from a Milli-Q system (Millipore, USA). Each synthetic colorant was accurately weighed using a balance (0.01 mg) according to the purities listed in Table 1.
Mixed standard solutions, containing 24 water-soluble synthetic colorants at a concentration of 50 μg/mL, were freshly prepared from stock solutions and the solutions from NIM. Through step-by-step dilution, a series of calibration solutions was prepared, with concentrations of 0.01, 0.05, 0.1, 1.0, 5.0, 10.0, and 20.0 μg/mL. Recovery studies were conducted on real matrix samples spiked with known concentrations of the analytes. All solutions were stored at 4 °C in the dark and remained stable for seven days. All of the above solution preparations were carried out under light-protected conditions.

2.3. Instrumentation and Conditions

The analysis was performed using a Dionex Ultimate 3000 liquid chromatography system (Waltham, MA, USA), equipped with high-pressure ternary pumps, a auto-sampler, a thermostatic column compartment, and a diode array detector. Chromeleon 7.0 software was utilized for system operation and data analysis. Separations were achieved on an ACQUITY UPLC BEH C18 column (50 mm × 2.1 mm × 1.7 μm; Waters, Milford, CT, USA).
The mobile phase system consisted of A (100 mmol/L ammonium acetate aqueous solution, adjusted pH to 6.25 with acetic acid) and B (methanol/acetronitrile, v/v, 2/8), with a gradient elution as follows: (0~12) min 4%~50% B, (12~12.1) min 50%~95% B, (12.1~16.5) min 96% B, and (16.5~17) min 96%~4% B, followed by a return to initial conditions in 0.5 min. The flow rate was set to 0.3 mL/min, with column and auto-sampler temperatures maintained at 35 °C and 10 °C, respectively. The sample injection volume was 5 μL. The column eluents were monitored at 420, 490, 520, and 620 nm, depending on the colorant, and the absorption spectra of the food colorants were recorded between 400 and 700 nm. Peak identification was performed by comparing the retention times and absorption spectra of the samples with those of the food colorants standards.

2.4. Sample Preparation

Approximately 100 premade cocktail samples from various brands were purchased from a local market in China. For premade cocktails sample preparation, 15 mL of each cocktail was transferred to a centrifuge tube and centrifuged for 5 min at 8000 rpm, and the supernatant (10 mL) was transferred to in another centrifuge tube. The samples were then evaporated in a 40 °C water-bath under a nitrogen flow for 10 min to remove the ethanol and degassed by ultrasonication for 10 min to remove the carbon dioxide. After cooling to room temperature, the evaporated volume was replenished with water. The sample solution was adjusted to pH 6.5 using ammonia solution before solid phase extraction (SPE) on an HLB cartridge (500 mg, Waters, Milford, CT, USA).
The SPE cartridges were preconditioned with 5.0 mL methanol followed by 5.0 mL acidified water (contained 0.1% (v/v) formic acid). Samples were loaded and passed through the cartridges at a rate of 1.0 mL/min. The cartridges were then rinsed with 5.0 mL of 15% (v/v) methanol/water solution (the water contained 0.1% formic acid) and were finally eluted with 3.0 mL of methanol, followed by 3.0 mL methanol containing 5% (v/v) ammonia. The eluate was dried at 40 °C under a gentle nitrogen gas flow, and the residue was reconstituted in 1 mL with water. All of the above preparations were carried out under light-protected conditions as soon as possible (Scheme 1).

2.5. Method Validation

Quantitative analysis was performed using the external standard calibration method. Calibration solutions were prepared through appropriate dilutions of standard solutions to achieve concentrations ranging from 0.01 to 50 μg/mL. The limit of detection (LOD) and the limit of quantitation (LOQ) were evaluated based on the minimum concentrations that produced signal-to-noise (S/N) ratios of 3 and 10, respectively.
Repeatability (intra-day precision) was evaluated by analyzing standard solutions at concentrations of 0.5, 5.0, and 10.0 μg/mL, each performed six times in one day, and reproducibility (inter-day precision) was assessed by independent analysis conducted three times by two analysts over five different days. Recovery experiments were performed using blank premade cocktail samples spiked with 24 colorants at concentrations of 0.1, 0.5, and 1.0 μg/mL. Each spiked sample was analyzed six times at each concentration level.

3. Results and Discussion

3.1. HPLC-DAD Method Development
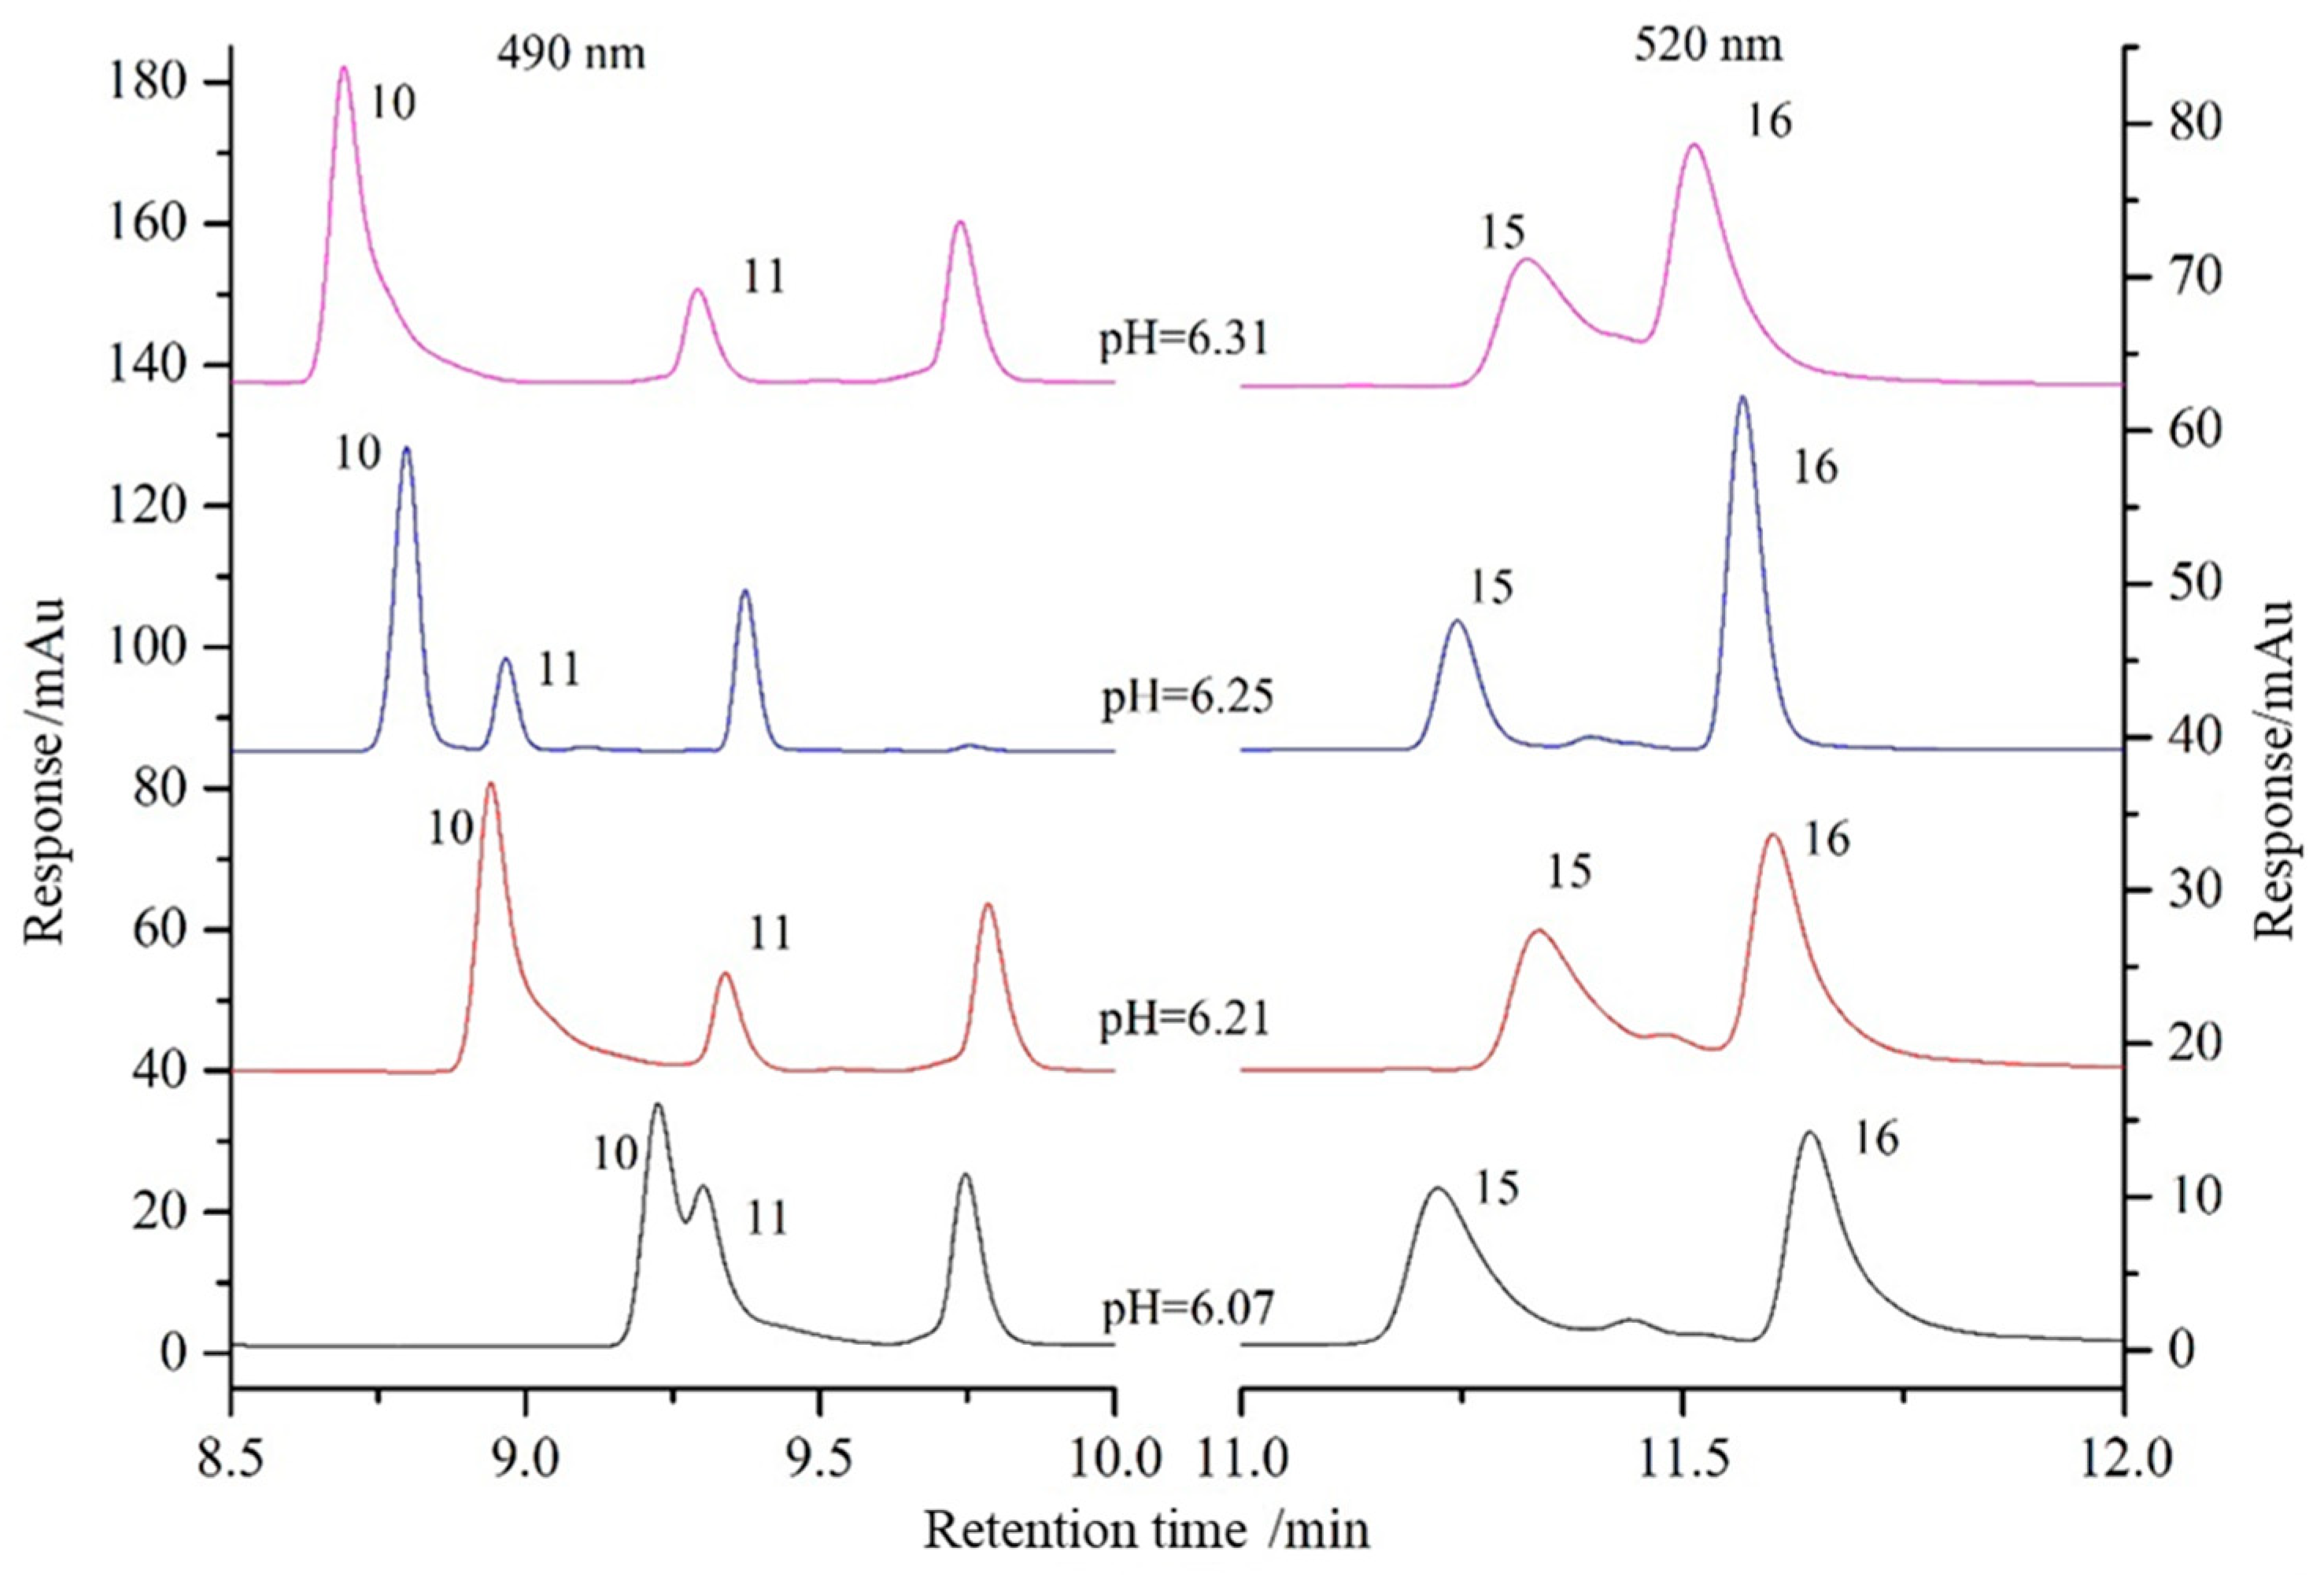
To optimize chromatographic conditions, key factors, such as column type, mobile phase composition (aqueous concentration and pH), and gradient elution program, were systematically investigated. Optimal separation conditions for the HPLC-DAD analysis were established to achieve the best resolution in the shortest analysis time. Four columns were tested, including Acquity UPLC BEH C18 columns (2.1 × 50 mm, 1.7 μm and 2.1 × 100 mm, 1.7 μm) from Waters, the Zorbax SB-C18 column (4.6 × 50 mm, 1.8 μm) from Agilent, and the Shim-pack XR-C18 column (3.0 × 75 mm, 2.2 μm) from Shimadzu. After adjusting the flow rates and gradients for each column, the ACQUITY UPLC BEH C18 column was found to effectively separate 24 synthetic colorants within 16 min, especially for challenging colorants such as Neutral Red, Erythrosine, Uranine, and Azorubine, achieved the best resolution (Supplementary Materials Table S1 and Figure S1).

3.1.1. Mobile Phase

In previous liquid chromatography (LC) analyses utilizing ammonium acetate buffer acetonitrile (ACN) as the mobile phase, acidic colorants were eluted before basic and neutral ones [18,38]. Consistent with these observations, we also observed that acidic dyes, such as Acid Red 33, were eluted earlier in this chromatographic system. Sun, H.W et al. employed a similar BEH C18 column (2.1 mm × 50 mm, 1.7 μm particle size) identical to the one employed herein to effectively separate 21 dyes over a 15 min period, with the mobile phase comprising 20 mM ammonium acetate and 0.02% acetic acid (pH 5) with CAN [27]. Other studies have also reported successful separation of dyes using ammonium acetate buffer and ACN as the mobile phase [22,25,28,38,39].
To optimize the aqueous phase, the concentration and pH of the ammonium acetate solution were varied. Three concentrations of ammonium acetate solution (50, 100, and 150 mmol/L) were tested, and the results indicated that increasing the concentration did not significantly affect the peak areas of the colorants. However, the retention times and resolutions of several colorants were notably influenced by the concentration of ammonium acetate aqueous solution (Figure 1). The resolutions of Sunset yellow, Uranine, and Neutral Red improved with increasing concentration, whereas the resolutions of Ponceau 4R, Metanil yellow orange MNO, and Rhodamine B decreased. Some colorants, such as Orange G, Red 2G, and Acid Red 52, exhibited an initial increase in resolution followed by a decrease. Consequently, the optimal concentration of ammonium acetate solution for achieving the maximum resolutions of Sunset yellow, Uranine, and Neutral Red, without compromising the resolution of other analytes, was determined to be 100 mmol/L.
The pH of ammonium acetate aqueous solution had a significant effect on the separation of Uranine, Erythrosine, and their adjacent colors. As shown on Figure 2, the retention times of Uranine and Erythrosine increases with decreasing pH values. At a pH of 6.31, Neutral Red and Erythrosine could not be completely separated. When the pH was lowered to 6.07, Neutral Red and Erythrosine were successfully separated, but Uranine and Azorubine exhibited similar retention times. Ultimately, a pH of 6.25 for mobile phase A was selected as optimal as it allowed for the complete separation of Uranine, Azorubine, Neutral Red, and Erythrosine.
The mobile phase composition of methanol/acetonitrile = 2:8 (v/v) was selected based on a comprehensive evaluation of its effects on both retention time and chromatographic resolution. An increase in methanol proportion resulted in prolonged retention times and varying impacts on resolution among different colorants, enhancing the separation of certain analytes while diminishing that of others. To balance analysis efficiency with separation performance, particularly for pigments exhibiting lower resolution or sensitivity to organic phase composition, the ratio of methanol to acetonitrile at 2/8 (v/v) was determined to be optimal and was thus employed in subsequent analyses.
For mobile phase B, common reversed-phase solvents such as methanol, acetonitrile, and a methanol–acetonitrile mixture were compared. A methanol–acetonitrile ratio of 2/8, (v/v) provided the best peak separation.

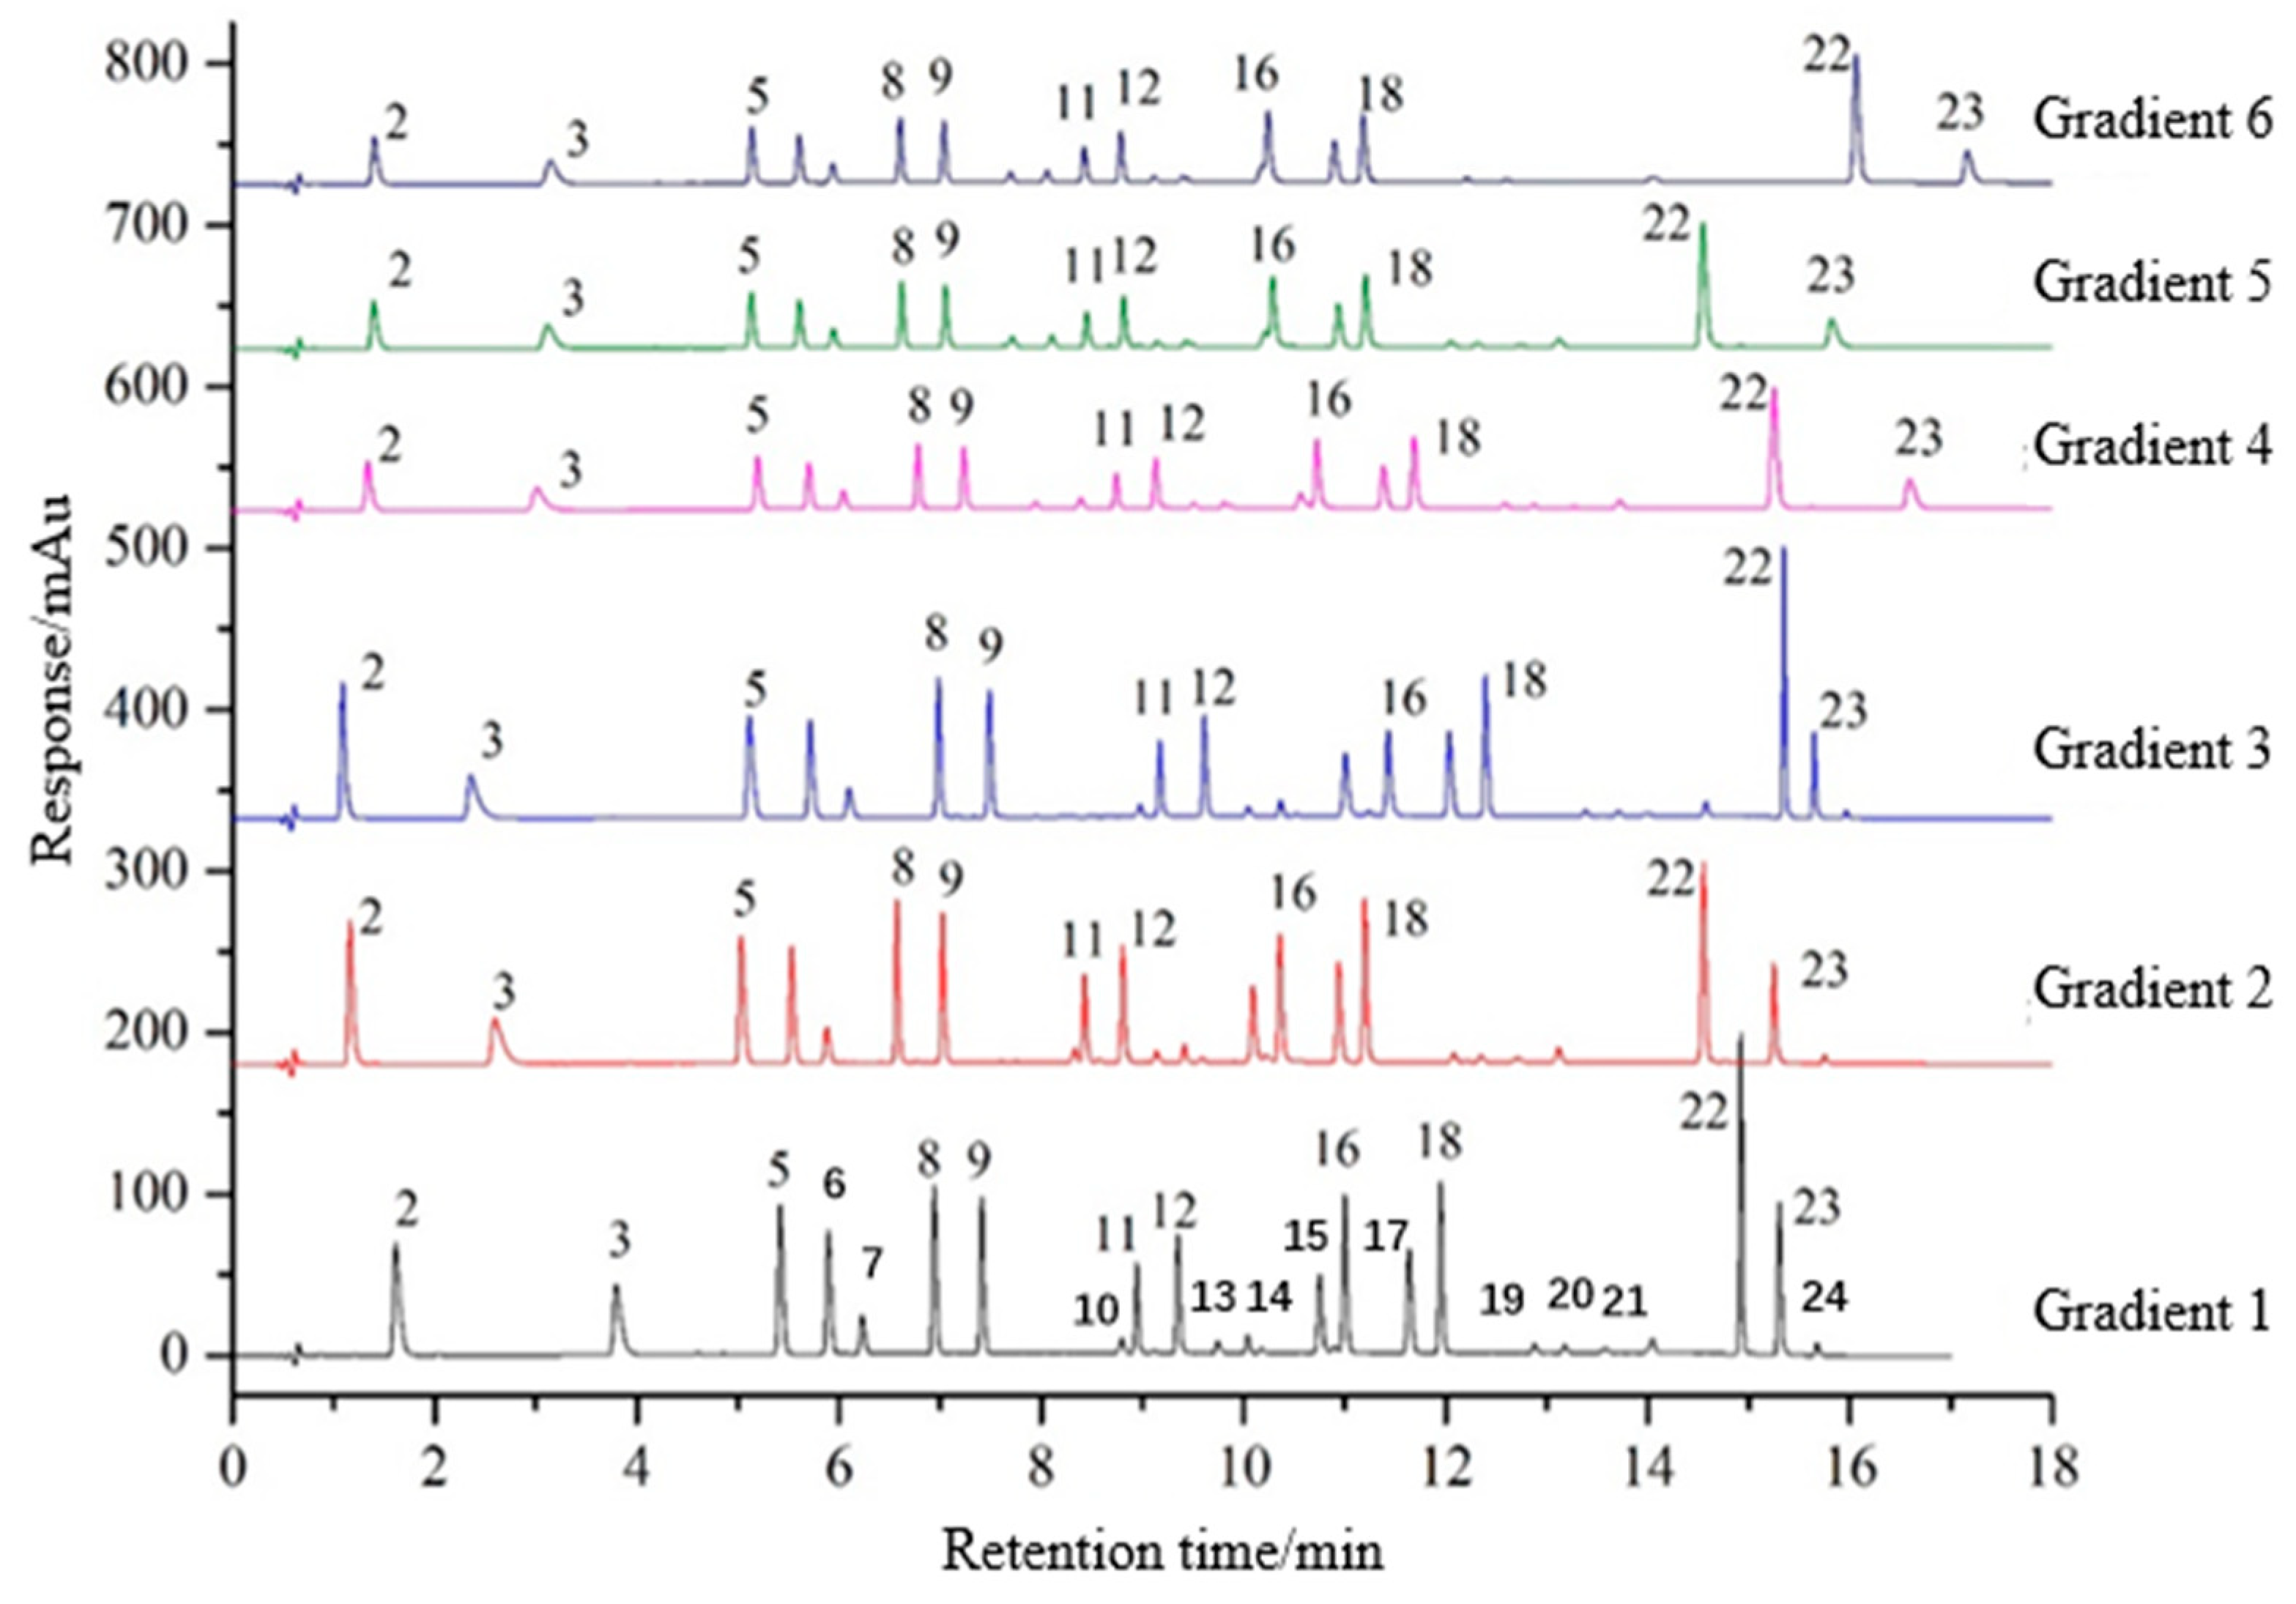
3.1.2. Gradient Program

A well-designed gradient program is essential for achieving fast and efficient separation and complex mixtures. Given the diverse nature of the colorants and their varying retention behaviors, isocratic elution was insufficient for effective separation. Therefore, gradient elution was employed to enhance separation efficiency. The chromatographic separation of 24 water-soluble synthetic pigments under six different gradient conditions (Gradient 1–6) is shown in Figure 3.
Six typical gradient elution programs were evaluated to optimize the separation conditions. These included various initial and final proportions of mobile phase B and different gradient durations. Specifically, Gradient 1 employed a linear increase from 4% to 50% B over 12 min, followed by a rapid ramp to 96% B and a hold phase and then re-equilibration. Gradient 2 started at 5% B and increased to 55% over 12 min, followed by a step to 90% B and a subsequent hold. Gradient 3 involved a transition from 5% to 47% B over 12 min, a sharp increase to 95% B, and a prolonged elution at high organic content. Gradient 4 and Gradient 5 both featured extended linear gradients to 65% and 70% B, respectively, before increasing to 95% B. Gradient 6 consisted of a multi-stage profile, beginning with a ramp from 5% to 40% B, an isocratic hold, and subsequent steps to 65% and 95% B, before returning to initial conditions. These gradient programs were systematically compared to identify the most suitable conditions for efficient and reproducible separation of the target analytes.
Each synthetic colorant exhibited a unique maximum absorption wavelength. The quantitation wavelengths for the colorants were selected based on their respective absorption maxima, with 420 nm, 490 nm, 520 nm, and 620 nm chosen for monitoring. Under these optimization conditions, baseline separation of 24 colorants was achieved within 16 min. The resolution value ranged from 2.36 to 19.32, well above the theoretical minimum value of 1.5. The peak symmetry ranged from 1.06 to 1.71, fully meeting the requirements for quantitative analysis (see Table 2).
The UPLC chromatogram of the mixed synthetic colorant standard solution is shown in Figure 4, with colorants identified by their retention times and maximum absorption wavelengths.

3.2. Method Validation Result

The linearity for each colorant was evaluated by analyzing mixed standard solutions of varying concentrations (0.01, 0.05, 0.1, 0.5, 1.0, 5.0, 8.0, 10.0, 20, and 50 μg/mL). The analyses were performed in triplicate, with quantitation being based on the peak area. As shown in Table 2, all colorants exhibited excellent correlation coefficients (R2 > 0.9980) within their respective linear range. The limits of detection (LOD) and quantitation (LOQ) were defined as three and ten times the signal-to-noise ratio, respectively. The LOD ranged from 0.66 μg/L (Brilliant blue) to 27.78 μg/L (Neutral Red). The LOD ranged from 0.66 μg/L (Brilliant blue) to 27.78 μg/L (Neutral Red). Compared to the detection limits previously reported in the literature [22,23,26,39], the sensitivity of this method was improved by a factor of three or more.
Method precision was assessed by evaluating the variation in peak areas both within a single day (intra-day precision) and across multiple days (inter-day precision). Intra-day repeatability was examined by analyzing standard solutions of 0.5 μg/mL, 5 μg/mL, and 10 μg/mL, each in seven replicates, on the same day. Inter-day reproducibility was assessed by independent analysis, performed by two analysts, across five separate days. The precision data, shown in Table 2, reveal that intra-day relative standard deviations (RSD) ranged from 0.11% to 3.33% (n = 7), while the inter-day RSD values ranged from 0.89% to 5.44% (n = 5). These results demonstrate that the method’s precision is robust and suitable for its intended purpose.
Recovery studies were conducted at dye concentrations of 0.1 μg/mL, 0.5 μg/mL, and 1.0 μg/mL (Supplementary Materials Table S2). Recoveries (n = 6) in premade mixtures ranged from 75.01% to 114.45%, with RSD values ranging from 0.19% to 5.95%. The recovery and the precision data of spiked recovery provided by the developed analytical method meet the requirements of GB 2760; Standard’s Title: National Food Safety Standard—Standards for Uses of Food Additives. Publisher: National Health Commission, Beijing, China, 2024and GB 5009.35; Standard’s Title: National Food Safety Standard—Determination of Synthetic Colour in Foods. Publisher: National Health Commission, Beijing, China, 2023. The recovery is typically required to be between 70% and 115%. The colorant detection standards for repeatability should be relative standard deviation (RSD) ≤ 10%. The intra-day precision and inter-day precision for 24 colorants see Table S3.
Notably, recoveries for Alkaline Chrysoidine Y (Peak 21), Bright green (Peak 24), and Crystal violet (Peak23) were lower and were not subjected to statistical analysis. The recoveries of these three pigments are below the requirement of GB 5009.35-2023 (70–115%), but this does not affect the applicability of the method. First, these three pigments are not contained in the list of permitted synthetic colorants specified in GB 2760-2024, which are considered illegal additives. Second, the 24 water-soluble colorants in the paper covered by include commonly synthetic colorants. The precision and LOD of the developed analytical method are superior to the requirements of the GB 5009.35-2023. This observation is likely attributable to the cationic nature of these pigments, which contain positively charged chromophores. The premade cocktails contained organic acids, such as citric acid, which are prone to generating negative charge. Consequently, the positive charged chromophores of these colorants may bind to the negatively charged citric acid molecules, potentially hindering their retention on the extraction column. This behavior is consistent with previous studies reporting the efficient adsorption of Crystal violet by sorghum straw modified with citric acid for wastewater treatment [42].
Over 100 commercially available premade cocktail samples with varying prices were analyzed using the established UPLC-DAD method. In these samples, seven synthetic colorants permitted by the GB 2760 were detected. The concentration ranges for these colorants were as follows: Allura red AC (2.05–10.62 μg/mL), Amaranth (1.82–10.77 μg/mL), Ponceau 4R (0.72–3.88 μg/mL), Tartrazine (0.04–0.87 μg/mL), Sunset yellow (1.74–9.80 μg/mL), Brilliant blue (0.12–3.48 μg/mL), and Erythrosine (0.12–2.34 μg/mL). The testing frequencies for the colorants were as follows: Allura red AC (18), Amaranth (26), Ponceau 4R (16), Tartrazine (46), Sunset yellow (20), Brilliant blue (56), and Erythrosine (10) (see Figure 5).
Among all samples, approximately 30% contained three colorants simultaneously, about 40% contained two colorants simultaneously, and roughly 30% contained one colorant. No instances of prohibited synthetic colorants or instances exceeding the allowable limits of single colorants were observed. Finally, through data analysis and comparison with the compositions listed on the product labels, some samples were found to have discrepancies between the colorant compositions listed on the product labels and those actually detected, indicating non-compliance with GB 7718 requirements.
Moreover, extensive testing and market research revealed that customers, particularly younger individuals, often judge the quality of premade cocktails based on visual impressions of color rather than actual fruit flavors. The flavor profiles of these cocktail are influenced more by added colorants than by the authentic fruit taste. Notably, the incorporation of colorants followed a consistent pattern, as demonstrated in Table 2. This highlights the necessity for enhancing the regulation of cocktail samples to ensure consumer safety.

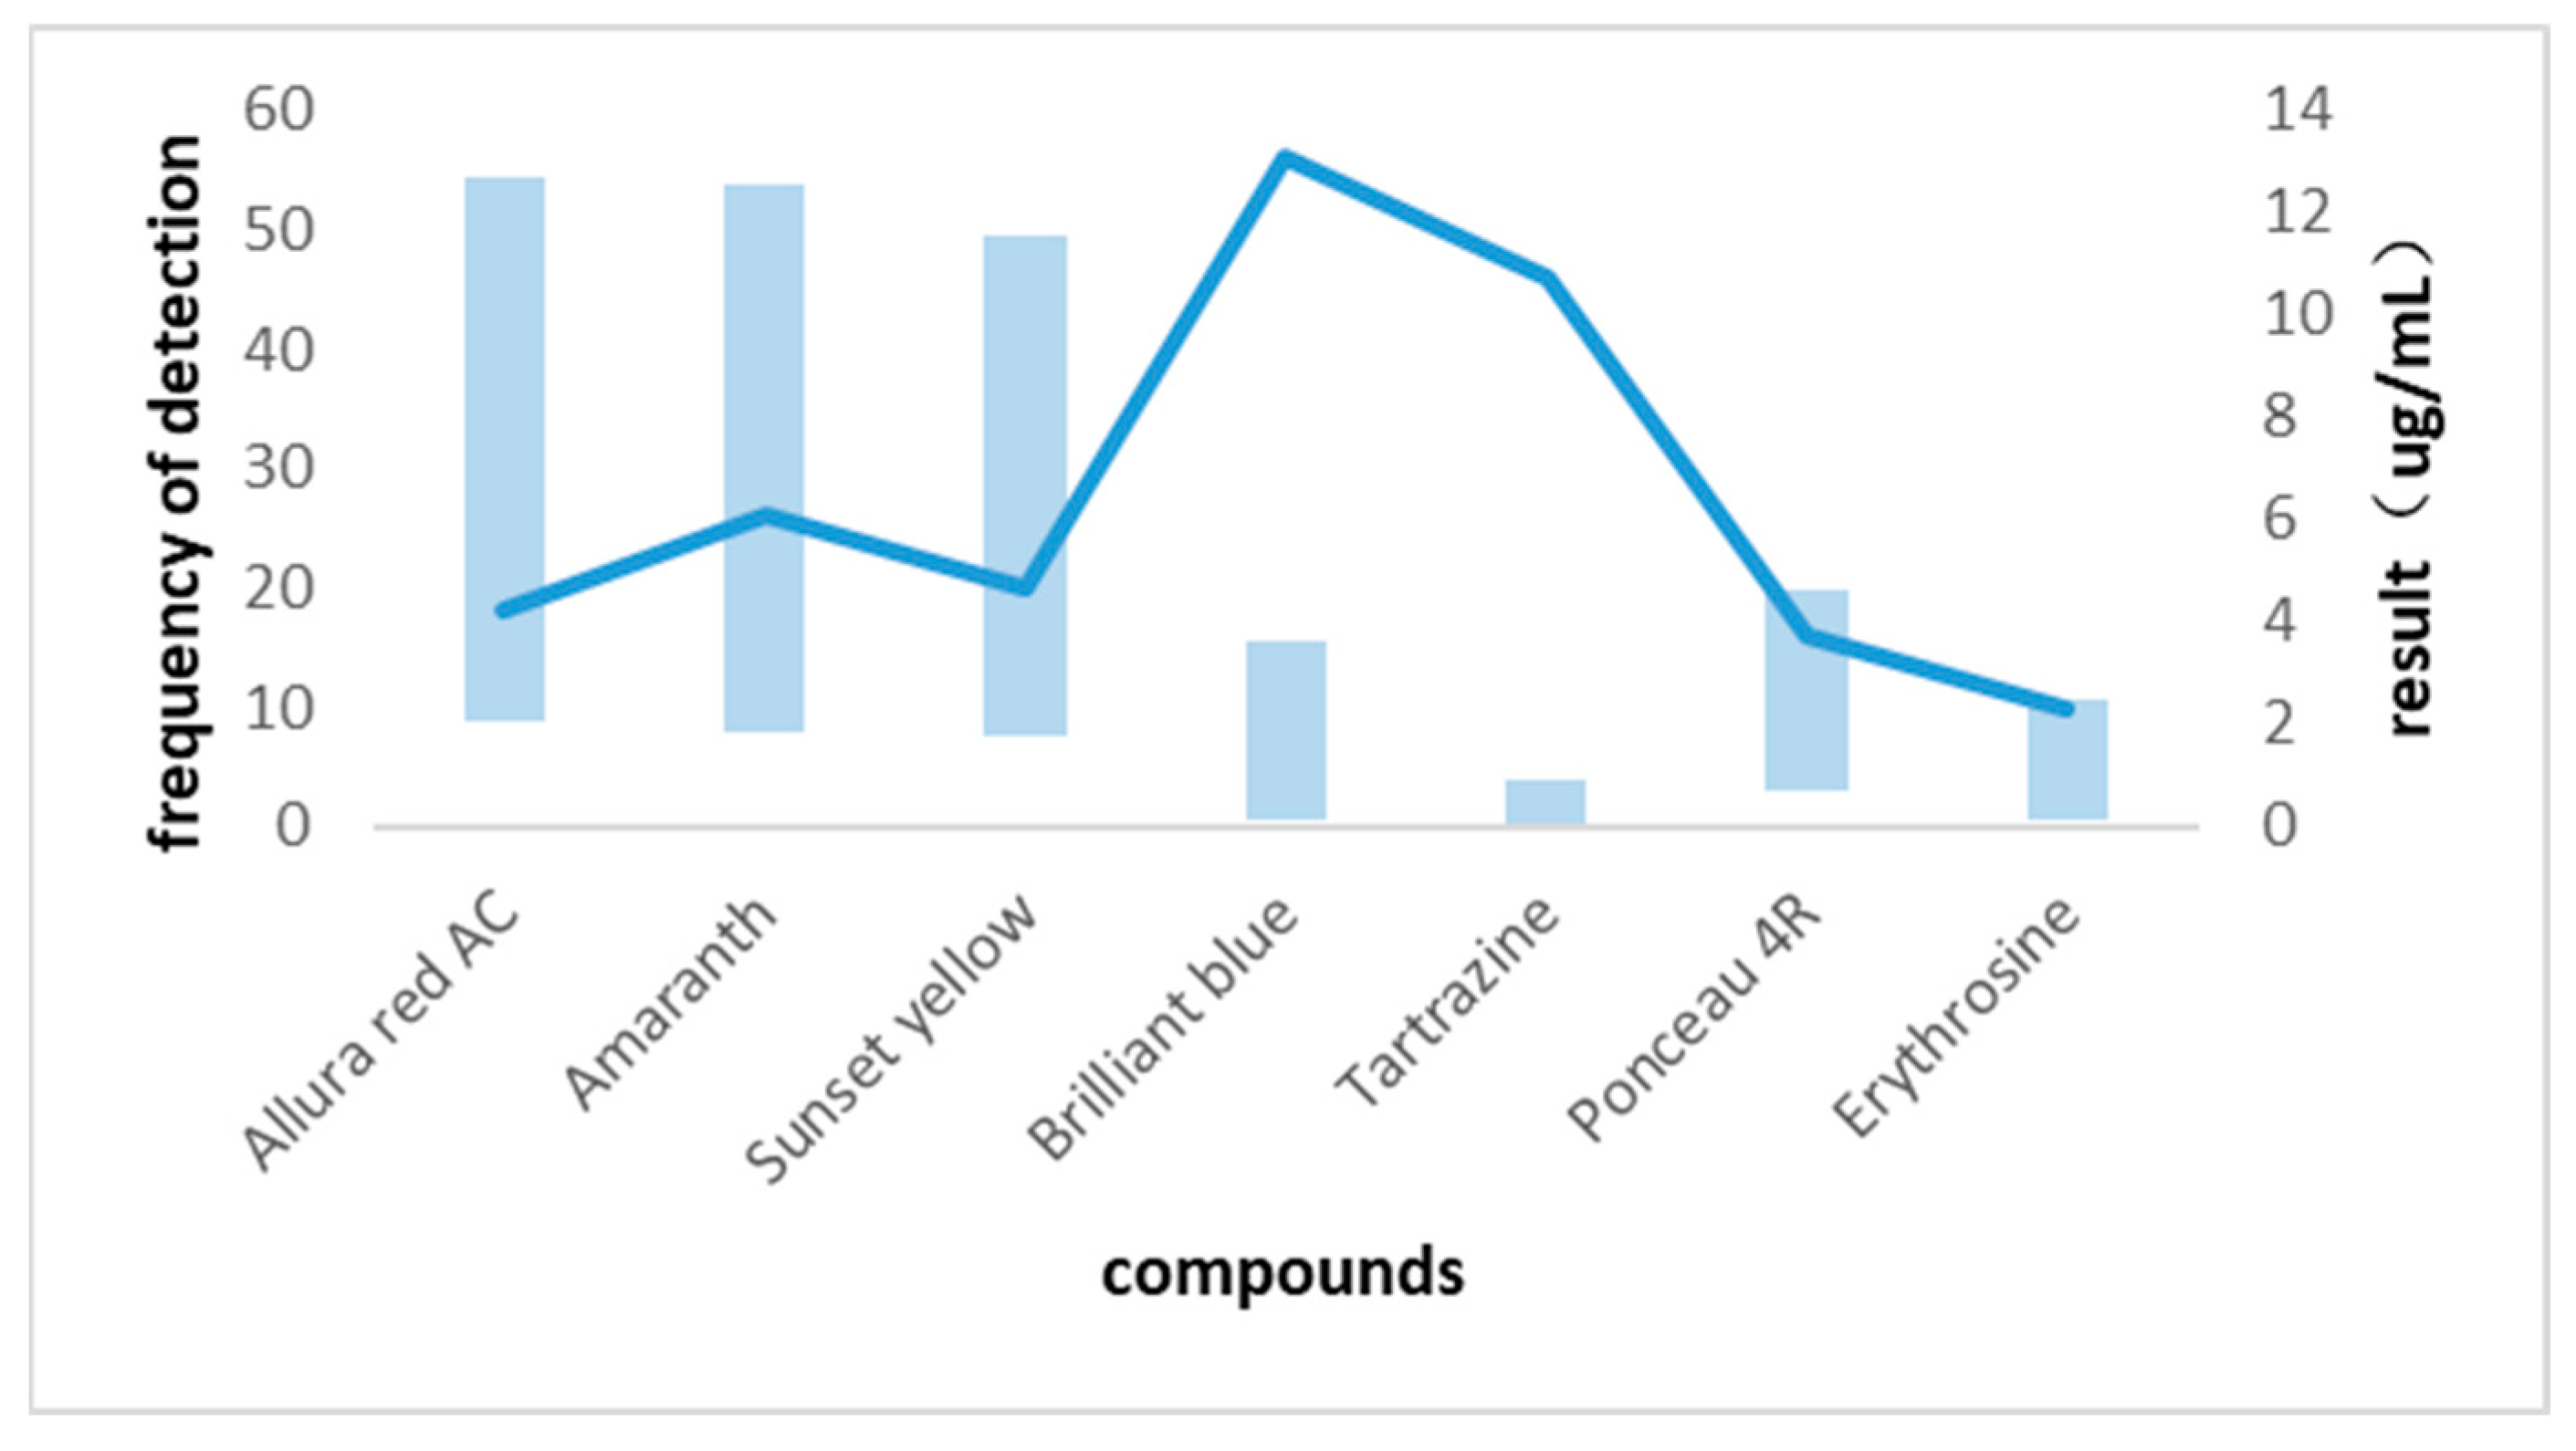
3.3. Comparison with Published Results

For comparison with published methods (Table S4 in the Supplementary Materials), Table S4 lists the papers published on colorant detection methods (2014–2024) alongside the method presented in this paper. In comparison with published methods, the limits of detection, number of colorants, precision, and recovery of the developed method exceeded those reported in the references [24,25,28,35,36,43]. Thus, the present method represents a significant advancement in the measurement of target analytes in cocktail samples, particularly for Tartrazine, Ponceau 4R, Red 2G, Azorubine, and Brilliant blue.

4. Conclusions

This study proposes a novel method for the simultaneous determination of 24 water-soluble synthetic colorants in premade cocktails, employing ultra-performance liquid chromatography coupled with diode array detection (UPLC-DAD) following a solid-phase extraction (SPE) pretreatment. The purity of each colorant was verified through multi-wavelength analysis to ensure result traceability and analytical accuracy. The method exhibited excellent linearity and low limits of detection (LODs). Compared to methods published between 2014 and 2024 (Table S4) [22,23,24,25,33,34,35,36,37,41,43], the developed approach demonstrates superior performance regarding the number of analytes, detection sensitivity, and analytical throughput.
Utilizing this method, over 100 premade cocktail samples were analyzed. Extensive sample testing combined with market research revealed that consumers primarily assess product quality based on the visual perception of color. Notably, the flavor profiles of premade cocktails were found to be influenced more by the colorants added than by the taste of natural fruits. A systematic pattern in the usage of synthetic colorants across different products was also identified.

Supplementary Materials

The following supporting information can be downloaded at https://www.mdpi.com/article/10.3390/beverages11030091/s1, Table S1: Retention time, resolution, peak symmetry, detection wavelengths, linear range, correlation coefficients (R2), LOD and LOQ, intra-day precision and Inter-day precision for 24 colorants; Table S2: The recovery and precision of water-soluble colorants spiked in Premade cocktails (n = 6); Table S3: The intra-day precision and inter-day precision for 24 colorants; Table S4: Comparison of performance with other published methods (2014–2024); Figure S1: Chromatogram for 24 pigments on four different chromatographic columns (520 nm)

Author Contributions

Conceptualization, K.M.; methodology, K.M. and T.W.; validation, K.M. and T.W.; data curation, K.M.; writing—original draft preparation, K.M.; writing—review and editing, Y.Z.; supervision, K.M.; funding acquisition, K.M. All authors have read and agreed to the published version of the manuscript.

Funding

This research was funded by the National Key R&D Program of China, Project of Research of Reference Materials for the Safety Supervision of Feed and Livestock Product Quality (No. 2023YFD1301504).

Institutional Review Board Statement

Not applicable.

Informed Consent Statement

Not applicable.

Data Availability Statement

The original contributions presented in this study are included in the article/Supplementary Material. Further inquiries can be directed to the corresponding author.

Conflicts of Interest

The authors declare no conflicts of interest. The funders had no role in the design of the study; in the collection, analyses, or interpretation of data; in the writing of the manuscript, or in the decision to publish the results.

References

  1. Carocho, M.; Barreiro, M.F.; Morales, P.; Ferreira, I.C.F.R. Adding Molecules to Food, Pros and Cons: A Review on Synthetic and Natural Food Additives. Compr. Rev. Food Sci. Food Saf. 2014, 13, 377–399. [Google Scholar] [CrossRef]
  2. Berlina, A.N.; Zherdev, A.V.; Dzantiev, B.B. ELISA and Lateral Flow Immunoassay for the Detection of Food Colorants: State of the Art. Crit. Rev. Anal. Chem. 2019, 49, 209–223. [Google Scholar] [CrossRef] [PubMed]
  3. Gosetti, F.; Chiuminatto, U.; Mazzucco, E.; Calabrese, G.; Gennaroa, M.C.; Marengo, E. Identification of photodegradation products of Allura Red AC (E129) in a beverage by ultra high performance liquid chromatography–quadrupole-time-of-flight mass spectrometry. Anal. Chim. Acta 2012, 746, 84–89. [Google Scholar] [CrossRef]
  4. Gosetti, F.; Frascarolo, P.; Mazzucco, E.; Gianotti, V.; Bottaro, M.; Gennaro, M.C. Photo degradation of E110 and E122 dyes in a commercial aperitif A high performance liquid chromatography–diode array–tandem mass spectrometry study. J. Chromatogr. A 2008, 1202, 58–63. [Google Scholar] [CrossRef] [PubMed]
  5. Perez-Ibarbia, L.; Majdanski, T.; Schubert, S.; Windhab, N.; Schubert, U.S. Safety and Regulatory Review of Dyes Commonly Used as Excipients in Pharmaceutical and Nutraceutical Applications. Eur. J. Pharm. Sci. 2016, 93, 264–273. [Google Scholar] [CrossRef]
  6. Oplatowska-Stachowiak, M.; Elliott, C.T. Food Colors: Existing and Emerging Food Safety Concerns. Crit. Rev. Food Sci. Nutr. 2017, 57, 524–548. [Google Scholar] [CrossRef]
  7. Lehto, S.; Buchweitz, M.; Klimm, A.; Straßburger, R.; Bechtold, C.; Ulberth, F. Comparison of Food Colour Regulations in the EU and the US: A Review of Current Provisions. Food Addit. Contam. Part A Chem. Anal. Control Expo. Risk Assess. 2017, 34, 335–355. [Google Scholar] [CrossRef] [PubMed]
  8. GB 2760-2024; Hygienic Standards for Uses of Food Additives. National Standards Administration: Beijing, China, 2024.
  9. FDA. Toxicological Principles for the Safety Assessment of Direct Food Additives and Color Additives Used in Food; National Technical Information Service: Springfield, VA, USA, 2019.
  10. Hwang, S.L.; Kim, M.; Lee, G.; Shin, J.-W. Dietary Exposure Assessment of Synthetic Food Colours Using Analytical Concentrations in Korea. Food Addit. Contam. Part A 2019, 36, 1453–1466. [Google Scholar]
  11. Pressman, P.; Clemens, R.; Hayes, W.C. Food Additive Safety: A Review of Toxicologic and Regulatory Issues. Toxicol. Res. Appl. 2017, 1, 2397847317723572. [Google Scholar] [CrossRef]
  12. GB 7718-2011; National Food Safety Standard General Rules for Prepackaged Food Labeling. National Standards Administration: Beijing, China, 2011.
  13. Arroz, E.; Jordan, M.; Dumancas, G.G. Development of a Direct Spectrophotometric and Chemometric Method for Determining Food Dye Concentrations. Appl. Spectrosc. 2017, 71, 1633–1639. [Google Scholar] [CrossRef]
  14. Ou, Y.; Wang, X.; Lai, K.; Huang, Y.; Rasco, B.A.; Fan, Y. Gold Nanorods as Surface-Enhanced Raman Spectroscopy (SERS) Substrates for Rapid and Sensitive Analysis of Allura Red and Sunset Yellow in Beverages. J. Agric. Food Chem. 2018, 66, 2954–2961. [Google Scholar] [CrossRef] [PubMed]
  15. Mejia, E.; Ding, Y.; Mora, M.F.; Garcia, C.D. Determination of Banned Sudan Dyes in Chili Powder by Capillary Electrophoresis. Food Chem. 2007, 102, 1027–1033. [Google Scholar] [CrossRef]
  16. Lipskikh, O.I.; Nikolaeva, A.A.; Korotkova, E.I. Voltammetric Determination of Tartrazine in Food. J. Anal. Chem. 2017, 72, 396–401. [Google Scholar] [CrossRef]
  17. Jampasa, S.; Siangproh, W.; Duangmal, K.; Chailapakul, O. Electrochemically Reduced Graphene Oxide-Modified Screen-Printed Carbon Electrodes for a Simple and Highly Sensitive Electrochemical Detection of Synthetic Colorants in Beverages. Talanta 2016, 160, 113–124. [Google Scholar] [CrossRef] [PubMed]
  18. Zhang, J.; Na, L.; Jiang, Y.; Han, D.; Lou, D.; Jin, L. A Fluorescence-Quenching Method for Quantitative Analysis of Ponceau 4R in Beverage. Food Chem. 2017, 221, 803–808. [Google Scholar] [CrossRef]
  19. Jiao, J.; Wang, J.; Li, M.; Li, J.; Li, Q.; Quan, Q.; Chen, J. Simultaneous Determination of Three Azo Dyes in Food Product by Ion Mobility Spectrometry. J. Chromatogr. B 2016, 1025, 105–109. [Google Scholar] [CrossRef]
  20. Kucharska, M.; Grabka, J. A Review of Chromatographic Methods for Determination of Synthetic Food Dyes. Talanta 2010, 80, 1045–1051. [Google Scholar] [CrossRef]
  21. De Andrade Silva, B.W.; Lima, B.P.; Paim, A.P. Simultaneous Determination of Synthetic Colorants in Yogurt by HPLC. Food Chem. 2015, 183, 154–160. [Google Scholar]
  22. Zhu, S.; Zhou, J.; Jia, H.; Zhang, H. Liquid-Liquid Microextraction of Synthetic Pigments in Beverages Using a Hydrophobic Deep Eutectic Solvent. Food Chem. 2018, 243, 351–356. [Google Scholar] [CrossRef]
  23. Tang, B.; Xi, C.; Yun, Z.; Wang, G.; Li, X.; Zhang, L.; Chen, D.; Zhang, J. Simultaneous Determination of 16 Synthetic Colorants in Hotpot Condiment by High Performance Liquid Chromatography. J. Chromatogr. B 2014, 960, 87–91. [Google Scholar] [CrossRef]
  24. Rejczak, T.; Tuzimski, T. Application of High-Performance Liquid Chromatography with Diode Array Detector for Simultaneous Determination of 11 Synthetic Dyes in Selected Beverages and Foodstuffs. Food Anal. Methods 2017, 10, 3572–3588. [Google Scholar] [CrossRef]
  25. Floriano, L.; Ribeiro, L.C.; Saibt, N.; Bandeira, N.; Prestes, O.; Zanella, R. Determination of Six Synthetic Dyes in Sports Drinks by Dispersive Solid-Phase Extraction and HPLC-UV-Vis. J. Braz. Chem. Soc. 2018, 29, 602–608. [Google Scholar] [CrossRef]
  26. Karanikolopoulos, G.; Gerakis, A.; Papadopoulou, K.; Mastrantoni, I. Determination of Synthetic Food Colorants in Fish Products by an HPLC-DAD Method. Food Chem. 2015, 177, 197–203. [Google Scholar] [CrossRef]
  27. Zhang, Y.; Zhou, H.; Wang, Y.; Wu, X.; Zhao, Y. Simultaneous Determination of Seven Synthetic Colorants in Wine by Dispersive Micro-Solid-Phase Extraction Coupled with Reversed-Phase High-Performance Liquid Chromatography. J. Chromatogr. Sci. 2015, 53, 210–218. [Google Scholar] [CrossRef]
  28. Mazdeh, F.Z.; Khorrami, A.R.; Moradi-Khatoonabadi, Z.; EsmaeiliAftabdari, F.; Ardekani, M.R.S.; Moghaddam, G.; Hajimahmoodi, M. Determination of Eight Synthetic Food Dyes by Solid Phase Extraction and Reversed-Phase High Performance Liquid Chromatography. Trop. J. Pharm. Res. 2016, 15, 173–181. [Google Scholar] [CrossRef]
  29. Sun, H.W.; Sun, N.; Li, H.; Zhang, J.X.; Yang, Y.L. Development of Multiresidue Analysis for 21 Synthetic Colorants in Meat by Microwave-Assisted Extraction-Solid Phase Extraction-Reversed-Phase Ultrahigh Performance Liquid Chromatography. Food Anal. Methods 2013, 6, 1291–1299. [Google Scholar] [CrossRef]
  30. Amorello, D.; Barreca, S.; Pensato, F.; Orecchio, S. Potentiometric analysis of fluoride in commonly consumed beverages: Method development, evaluation, and risk assessment. J. Food Compos. Anal. 2025, 137, 106836. [Google Scholar] [CrossRef]
  31. Tsai, C.F.; Kuo, C.H.; Shih, Y.C. Determination of 20 Synthetic Dyes in Chili Powders and Syrup-Preserved Fruits by Liquid Chromatography/Tandem Mass Spectrometry. J. Food Drug Anal. 2015, 23, 453–462. [Google Scholar] [CrossRef] [PubMed]
  32. Qi, P.; Zhou, Q.; Chen, G.; Lin, Z.; Zhao, J.; Xu, H.; Gao, H.; Liu, D.; Mao, X. Simultaneous Qualitative and Quantitative Determination of 104 Fat-Soluble Synthetic Dyes in Foods Using Disperse Solid-Phase Extraction and UHPLC-Q-Orbitrap HRMS Analysis. Food Chem. 2023, 427, 136665. [Google Scholar] [CrossRef]
  33. Ma, K.; Li, X.J.; Wang, H.F.; Zhao, M. Rapid and Sensitive Method for the Determination of Eight Food Additives in Red Wine by Ultra-Performance Liquid Chromatography Tandem Mass Spectrometry. Food Anal. Methods 2015, 8, 203–212. [Google Scholar] [CrossRef]
  34. Chen, X.H.; Zhao, Y.G.; Shen, H.Y.; Zhou, L.-X.; Pan, S.-D.; Jin, M.-C. Fast Determination of Seven Synthetic Pigments from Wine and Soft Drinks Using Magnetic Dispersive Solid-Phase Extraction Followed by Liquid Chromatography-Tandem Mass Spectrometry. J. Chromatogr. A 2014, 1346, 123–128. [Google Scholar] [CrossRef] [PubMed]
  35. Martin, F.; Oberson, J.M.; Meschiari, M.; Munari, C. Determination of 18 Water-Soluble Artificial Dyes by LC-MS in Selected Matrices. Food Chem. 2016, 197, 1249–1255. [Google Scholar] [CrossRef] [PubMed]
  36. Al Tamim, A.; AlRabeh, M.; Al Tamimi, A.; AlAjlan, A.; Alowaifeer, A. Fast and Simple Method for the Detection and Quantification of 15 Synthetic Dyes in Sauce, Cotton Candy, and Pickle by LC-MS/MS. Arab. J. Chem. 2019, 13, 3882–3888. [Google Scholar]
  37. Sun, X.D.; Wu, H.L.; Liu, Z.; Chen, Y.; Liu, Q.; Ding, Y.J.; Yu, R.Q. Rapid and Sensitive Detection of Multi-Class Food Additives in Beverages for Quality Control by Using HPLC-DAD and Chemometrics Methods. Food Anal. Methods 2019, 12, 381–393. [Google Scholar] [CrossRef]
  38. Gosetti, F.; Chiuminatto, U.; Mastroianni, R.; Mazzucco, E.; Manfredi, M. Retrospective analysis for the identification of 4-aminocarminic acid photo-degradation products in beverages. Food Add. Contam. A 2015, 32, 285–292. [Google Scholar] [CrossRef] [PubMed]
  39. GB 5009.35-2023; National Food Safety Standard—Determination of Synthetic Colorants in Food. National Standards Administration: Beijing, China, 2023.
  40. Hu, Z.; Qi, P.; Wang, N.; Zhou, Q.-Q.; Lin, Z.-H.; Chen, Y.-Z.; Mao, X.-W.; Jiang, J.-J.; Li, C. Simultaneous Determination of Multiclass Illegal Dyes with Different Acidic-Basic Properties in Foodstuffs by LC-MS/MS via Polarity Switching Mode. Food Chem. 2020, 309, 125745. [Google Scholar] [CrossRef]
  41. Arabkhani, P.; Sadegh, N.; Asfaram, A. Nanostructured Magnetic Graphene Oxide/UIO-66 Sorbent for Ultrasound-Assisted Dispersive Solid-Phase Microextraction of Food Colorants Prior to HPLC Analysis. Microchem. J. 2023, 184, 108149. [Google Scholar] [CrossRef]
  42. Li, F.; Wang, Y.; Wang, H.; Tang, A. Study on the Adsorption of Crystal Violet from Water Using Citric Acid-Modified Sorghum Straw. J. Wuhan Inst. Technol. 2010, 32, 47–51. [Google Scholar]
  43. Park, J.; Lee, M.H.; Cho, Y.S.; Seo, D.W.; Choi, J.Y. Rapid Identification and Quantitation of 34 Synthetic Colorants in Beverages and Candies by UPLC-PDA. J. Food Compos. Anal. 2024, 133, 106479. [Google Scholar] [CrossRef]
Scheme 1. Pretreated process for the premade cocktail.
Beverages 11 00091 sch001
Figure 1. Effect of concentration of ammonium acetate solution on resolutions of colorants.
Beverages 11 00091 g001
Figure 2. Effect of pH on the separation of Uranine, Azorubine, Neutral Red, and Erythrosine. Peaks: 10. Uranine, 11. Azorubine (λ = 490 nm); 15. Neutral Red, 16. Erythrosine (λ = 520 nm).
Beverages 11 00091 g002
Figure 3. Chromatograms of 24 colorants under a six-gradient program in 520 nm. Peaks sequences: 1. Tartrazine; 2. Amaranth; 3. Ponceau S; 4. Naphthol yellow S; 5. Ponceau 4R; 6. Sunset yellow; 7. Orange G; 8. Allura red AC; 9. Red 2G; 10. Uranine; 11. Azorubine; 12. Ponceau SX; 13. Fast green FCF; 14. Brilliant blue; 15. Neutral Red; 16. Erythrosine; 17. Orange II; 18. Acid red 52; 19. Orange IV; 20. Metanil yellow orange MNO; 21. Chrysoidine Y; 22. Rhodamine B; 23. Crystal violet; 24. Brilliant green.
Beverages 11 00091 g003
Figure 4. Chromatogram of 24 water-soluble synthetic colorants standard solutions of 5 μg/mL at maximum absorption wavelengths (λ = 420 nm, 490 nm, 520 nm, and 620 nm). Peaks sequences: 1. Tartrazine; 2. Amaranth; 3. Ponceau S; 4. Naphthol yellow S; 5. Ponceau 4R; 6. Sunset yellow; 7. Orange G; 8. Allura red AC; 9. Red 2G; 10. Uranine; 11. Azorubine; 12. Ponceau SX; 13. Fast green FCF; 14. Brilliant blue; 15. Neutral Red; 16. Erythrosine; 17. Orange II; 18. Acid red 52; 19. Orange IV; 20. Metanil yellow orange MNO; 21. Chrysoidine Y; 22. Rhodamine B; 23. Crystal violet; 24. Brilliant green.
Beverages 11 00091 g004
Figure 5. Results and frequency of colorants detected in premade cocktails.
Beverages 11 00091 g005
Table 1. The information of 24 water-soluble synthetic colorants.
NameMolecular FormulaNo. CICAS NumberMWλ (max) aDetection WavelengthPurity (g/g) bProvider/CRM Number cSolubility d
TartrazineC16H9N4Na3O9S2191401934-21-0534.36427 nm420 nm/NIM, GBW(E)100001a
0.5 mg/mL ± 1%
260 g/L
AmaranthC20H11N2Na3O10S316185915-67-3604.47521 nm520 nm/NIM, GBW(E)100002a
0.5 mg/mL ± 2%
50 g/L
Ponceau 4RC20H11N2Na3O10S3162552611-82-7604.47508 nm520 nm/NIM, GBW(E)100004a
0.5 mg/mL ± 2%
25 g/L
Sunset yellowC16H10N2Na2O7S2159852783-94-0452.37483 nm490 nm/NIM, GBW(E)100003a
0.5 mg/mL ± 1%
50–100 g/L
Allura red ACC18H14N2Na2O8S21603525956-17-6496.42509 nm520 nm/NIM, GBW(E)100192
0.5 mg/mL ± 2%
53.878 g/L
Brilliant blueC37H34N2Na2O9S3420903844-45-9792.85629 nm620 nm/NIM, GBW(E)100005a
0.5 mg/mL ± 2%
25 g/L
Crystal violetC25H30ClN342555548-62-9407.99590 nm520 nm98.1% ± 1%NIM, GBW06420 98.1% ± 1%16 g/L
ErythrosineC20H6I4Na2O545430568-63-8879.86526 nm520 nm/NIM, GBW(E)100191
0.2 mg/mL ± 2%
100 g/L
Rhodamine BC28H31ClN2O34517081-88-9479.01550 nm520 nm99.0% ± 0.4%NIM, GBW06146
99.0% ± 0.4%
10 g/L
Orange GC16H10N2Na2O7S2162301936-15-8452.37480 nm490 nm98.5% ± 0.5%Sigma–Aldrich50 g/L
Ponceau SC22H12N4Na4O13S4271956226-79-5760.57520 nm520 nm98.5% ± 0.6%Sigma–Aldrich10 g/L
Red 2GC18H13N3Na2O8S2180503734-67-6509.42532 nm520 nm98.3% ± 0.8%Sigma–Aldrich
AzorubineC20H12N2Na2O7S2147203567-69-9502.43518 nm520 nm98.8% ± 0.8%Sigma–Aldrich
Ponceau SXC18H14N2Na2O7S2147004548-53-2480.42504 nm520 nm96.6% ± 1.6%Sigma–Aldrich
Orange IIC16H11N2NaO4S15510633-96-5350.32485 nm490 nm98.6% ± 0.7%Toronto Research Chemicals116 g/L
Orange IVC18H14N3NaO3S13080554-73-4375.38428 nm420 nm98.5% ± 0.6%Toronto Research Chemicals
Metanil yellow orange MNOC18H14N3NaO3S13065587-98-4375.38420 nm420 nm98.4% ± 1.6%Toronto Research Chemicals25 g/L
Chrysoidine YC12H13ClN411270532-82-1248.71408 nm420 nm99.0% ± 0.8%Sigma–Aldrich
Fast green FCFC37H34N2O10S3Na2420532353-45-9808.86623 nm620 nm96.2% ± 2.0%Toronto Research Chemicals
Brilliant greenC27H34N2O4S42040633-03-4482.63626 nm620 nm97.2% ± 1.4%Toronto Research Chemicals100 g/L
Acid red 52C27H29N2NaO7S2451003520-42-1580.65562 nm520 nm96.0% ± 2.0%Sigma–Aldrich
Naphthol yellowC10H4N2Na2O8S10316846-70-8358.19431 nm420 nm99.3% ± 0.7%Dr. Ehrenstorfer
Neutral RedC15H17ClN450040553-24-2288.78461 nm490 nm95.8% ± 2.4%Dr. Ehrenstorfer50 g/L
UranineC20H10Na2O545350518-47-8376.27488 nm490 nm99.6% ± 0.4%Dr. Ehrenstorfer500 g/L
a The data for the maximum absorption wavelength was from Merck product manual. b For the 24 colorant RMs, except the 9 CRMs obtained from NIM, the purity was determined by UPLC-DAD at different wavelengths corresponding to the maximum absorption of colorants (420 nm, 490 nm, 520 nm, 620 nm). The purity values were expressed as the measurement result plus the standard deviation. c NIM: National Institute of Metrology for China; GBW or GBW(E): National certified reference materials in China. d Solubility refers to the solubility in water at temperature of 20–25°C.
Table 2. Summary of experience on adding colorants in premade cocktails.
Flavor in Label of Premade CocktailsColor of Premade CocktailsCommonly Detected Colorants
StrawberryRedAmaranth, Ponceau 4R, Allura red AC
PeachPinkAmaranth, Ponceau 4R,
OrangeOrange yellowTartrazine, Sunset yellow, Allura red AC
PineappleYellowTartrazine, Sunset yellow
MangoGolden yellowAmaranth, Tartrazine
GrapePurpleAmaranth, Brilliant blue
BreezerGreenTartrazine, Brilliant blue
AppleCyanTartrazine, Sunset yellow Brilliant blue
BlueberryBlueBrilliant blue
Disclaimer/Publisher’s Note: The statements, opinions and data contained in all publications are solely those of the individual author(s) and contributor(s) and not of MDPI and/or the editor(s). MDPI and/or the editor(s) disclaim responsibility for any injury to people or property resulting from any ideas, methods, instructions or products referred to in the content.

