Article

Unveiling the Regional Identity of Madeira Wine: Insights from Saccharomyces cerevisiae Strains Using Interdelta Analysis

1
CQM—Centro de Química da Madeira, Universidade da Madeira, Campus Universitário da Penteada, 9020-105 Funchal, Portugal
2
Faculdade de Ciências Exatas e da Engenharia, Universidade da Madeira, Campus Universitário da Penteada, 9020-105 Funchal, Portugal
3
Banco de Germoplasma—ISOPlexis, Universidade da Madeira, Campus Universitário da Penteada, 9020-105 Funchal, Portugal
4
Faculdade de Ciências da Vida, Universidade da Madeira, Campus Universitário da Penteada, 9020-105 Funchal, Portugal
*
Author to whom correspondence should be addressed.
Beverages 2025, 11(3), 84; https://doi.org/10.3390/beverages11030084
Submission received: 28 February 2025 / Revised: 30 April 2025 / Accepted: 30 May 2025 / Published: 6 June 2025

Abstract

:
The Demarcated Region of Madeira (DRM) is one of the oldest wine regions in Portugal, where the famous Madeira Wine (MW) is produced by spontaneous fermentation using endogenous yeasts. Several studies reported the role of endogenous Saccharomyces cerevisiae strains in the regional identity of wines, but only a few studies have been published in the DRM. The PCR-Interdelta (Polymerase Chain Reaction-Interdelta) analysis is a reliable method for S. cerevisiae strain identification. Here, we report the S. cerevisiae strains isolated from six Vitis vinifera grape varieties, namely, Tinta Negra, Boal, Sercial, Verdelho, Malvasia de São Jorge, and Complexa, which are widely used in MW production. During the 2020 campaign, eleven samples were collected from licensed vineyards and a winery, and submitted to spontaneous microfermentations and yeast isolation. Of the 1452 isolates counted, 1367 (94.2%) presented morphological characteristics of S. cerevisiae. We randomly selected 330 isolates from the positive colonies for strain identification. First, the PCR-Interdelta was optimized in ten commercial strains, using δ2–δ12 and δ12–δ21 pairs of primers, and δ2–δ12 primers were selected to screen the 330 isolates. We detected three fermentative profiles and a total of 25 PCR-Interdelta patterns were obtained, representing 7.6% of intraspecific variability, starting with the first non-official collection. The findings underscore the pivotal role of S. cerevisiae strain diversity in shaping the regional identity and quality of wines, with molecular tools like PCR-Interdelta analysis proving essential for monitoring intraspecific variability.

1. Introduction

Viticulture and winemaking are one of the few activities in which the three sectors of the economy converge, in synergy with the historical, cultural, and natural heritage of the regions. This multidimensionality takes place in the Demarcated Region of Madeira (DRM), which has been producing and marketing the famous fortified Madeira Wine (MW) for 500 years and represents one of the oldest Demarcated Regions of Portugal [1].
The island of Madeira, of volcanic origin and pronounced orography, is in the subtropical region of the Atlantic Ocean and has a climate that is mainly temperate Mediterranean, with tropical island traces on the south coast and temperate traces on the north coast [2]. Mountain-type agriculture is typically established on land parcels of less than one hectare, structured into one or more small terrace plots (poios) bordered by volcanic stone walls. The configuration of the landscape, along with the agroecosystem’s structure and scale, results in predominantly family-based agricultural practices and limited mechanization [2]. Viticulture in the DRM is characterized by vines implanted in acidic or very acidic soils [2], using the system of guidance in “pergola” regionally called “latada”, allowing the exploitation of the area, and sometimes in association with other crops. The most common grapes used for MW production are Boal, Sercial, Verdelho, and Malvasia in white and Tinta Negra in red varieties [1]. The grape variety is planted considering the orientation (north or south) and the altitude, due to the different climatic conditions [2]. On the south coast, viticulture develops on land up to 700 mts of altitude while on the north coast up to 400 mts [1]. Nevertheless, the Tinta Negra grape variety is the most significant in the DRM, representing approximately 73.2% of the total production [3].
The MW production process (before bottling) includes four main stages: manual harvesting and transport to the winery carried out in boxes between 25 and 40 kg; the spontaneous fermentation of the grape must by endogenous yeasts that live naturally on the grape skin (pruine) and winery; fortification by adding natural grape spirit (up to 18.0–22.0% v/v); and thermal aging, which can be carried out using oak casque “canteiro” or “estufagem” processes [4,5,6]. The major production of organoleptic molecules takes place during the alcoholic fermentation of the grape must, followed by thermal aging [1]. The spontaneous fermentation process is stopped by fortification, according to the sweetness level, expressed in sugar content (g/L), and grape varieties, giving rise to the main MW categories, namely, dry (49.1–64.8 g/L) attained from Sercial, medium dry (64.8–80.4 g/L) attained from Verdelho, medium sweet (80.4–96.1 g/L) attained from Boal, and sweet (96.1–150 g/L) attained from Malvazia. Tinta Negra is used to produce all categories of MW [1,6].
S. cerevisiae is the most important yeast species in winemaking worldwide [7], and many studies report on the crucial role of this species [8]. During alcoholic fermentation, it metabolizes glucose and fructose to ethanol, carbon dioxide (product of primary metabolism), and many other metabolites that result from secondary metabolism and contribute to the quality of the final product. Spontaneous fermentations show the dominance of the Saccharomyces genus at the beginning of alcoholic fermentation, showing quick growth and dominating the alcoholic fermentation process [9]. The secondary metabolism of S. cerevisiae is closely related to the strain, due to the adaptation to specific ecosystems. In fact, the agroedaphoclimatic conditions and the geographical location of the vineyards are closely linked to the indigenous strains that contribute to the specific organoleptic characteristics, integrating the regional identity of the wines [8,9]. The different abundance of S. cerevisiae is related to the Wine Demarcated Region and its unique microbial communities or microbial terroir [9]. In this regard, many wine regions worldwide have typified their S. cerevisiae strain diversity [10] and genetic stability during alcoholic fermentation [11].
The use of their own autochthonous S. cerevisiae strains as a starter in winemaking is a practice implemented by some wineries for more than a decade [7]. Other factors such as geographical location, grape variety, and agroedaphiclimatics conditions can also influence the genetic diversity of the S. cerevisiae. Autochthonous strains play a fundamental role in expressing the regional identity fingerprint of the wines [12], giving rise to the concept of microbial terroir [13].
In this sense, the Interdelta Polymorphism Fingerprint approach, commonly used to typing S. cerevisiae strains, is a reliable technique, due to its reproducibility, discriminatory power, reduce analysis time, and minimal use of reagents [7,11,14]; however, the discriminatory power decreases in genetically close strains [15]. The technique is based on the analysis of amplifications of interdelta DNA regions by PCR. δ elements are small DNA sequences, scattered throughout the S. cerevisiae genome, the position and number of which varies between strains [15].
The present work aims at typing S. cerevisiae strains from licensed vineyards and grape must from a certified winery using Vitis vinifera grape varieties widely used in the production of MW as a powerful approach to establish and conserve the first collection of autochthonous S. cerevisiae strains from the DRM.

2. Materials and Methods

2.1. Materials and Reagents

All materials and reagents used in this study were prepared aseptically and autoclaved or purchased sterilized. All the consumables used in the present study were molecular grade, DNAse- and RNAse-free, and microbiological grade.
The culture media used were of microbiological quality. Yeast peptone dextrose (YPD) medium (yeast extract, 1.0% w/v, peptone, 1.0% w/v, glucose, 2.0% w/v) was purchased from MP Biomedicals, LLC (Solon, OH, USA). Agar-agar purified powder was purchased from Merck, LLC (Darmstadt, Germany) and glycerol from Fischer Scientific (Loughborough, UK). YPD broth was prepared according to the supplier’s instructions and YPD agar was prepared by adding 1.5% w/v agar-agar.
For strain identification, all reagents used were of molecular biology and research grade. Lithium acetate (LiOAc) was purchased from Sigma-Aldrich (St. Louis, MO, USA). Ethylenediaminetetraacetic acid (EDTA) and tris-EDTA were purchased from Merck, LLC (Darmstadt, Germany). Sodium dodecyl sulfate (SDS) and Tris-Acetate-Ethylenediaminetetraacetic (Tris-Acetate-EDTA) were purchased from Thermo Scientific (Waltham, MA, USA).
All reagents used for PCR amplification and electrophoresis were molecular grade. MyTaqTM Mix was obtained from Bioline Reagents Ltd. (London, UK), and the primers δ2 (5′-GTGGATTTTTATTCCAACA-3′), δ12 (5′-TCAACAATGGAATCCCAAC-3′), and δ21 (5′-CATCTTAACACCGTATATGA-3′) were obtained from Eurogentec (Seraing, Belgium). GeneRuler 100 bp DNA Ladder and DNA Ladder Mix were purchased from Thermo Scientific (Waltham, MA, USA). Agarose electrophoresis grade was obtained from Fischer Scientific (Loughborough, UK). GelRed® 10,000× in water was acquired from Biotium (Fremont, CA, USA). Bromophenol blue (1.0%) was used as a dye, diluted in glycerol (70.0%), and mQ was purchased from Braun (Melsungen, Germany). Ultrapure water was obtained from a Milli-Q® system (Bedford, MA, USA).

2.2. Equipment and Software

Microbiological procedures were performed in a laminar flow chamber (ESCO Scientific (Changi, Singapore)). The NanoDropTM OneC (ThermoFisher Scientific (Wilmington, DE, USA)) microvolume UV–Vis spectrophotometer was used to measure DNA concentration and purity. Amplification by PCR was performed in a Veriti™ 96-Well Fast Thermal Cycler (Applied Biosystems, Fisher Scientific (Roskilde, Denmark)). The amplicons were separated on a horizontal electrophoresis system Wide Mini-Sub Cell GT (Bio Rad (Hercules, CA, USA)) and PS600 600 Volt Power Supply (Hoefer Inc. (Bridgewater, MA, USA)). The gels were visualized and the digital image acquired using Azure 600 Imaging Systems (Azure Biosystems (Dublin, CA, USA)). The gels were analyzed using GelAnalyzer 19.1 software (available at www.gelanalyzer.com, accessed on 1 May 2021) by Istvan Lazar Jr., PhD, and Istvan Lazar Sr., PhD, CSc. [16].

2.3. PCR-Interdelta Optimization

The optimizations consisted of two steps, each performed in triplicate: The first started with the selection of commercial S. cerevisiae strains in the form of active dry yeast (ADY) used in beverage production, followed by the purification and storage of the isolates. The second step involved DNA extraction and purification, followed by PCR-Interdelta amplifications in which all the components of the PCR mix were optimized, in conjunction with amplification conditions.

2.3.1. Commercial Yeast Strains

Ten commercial active dry yeast (ADY) S. cerevisiae strains commonly used in beverage production were used for the delta pair primer optimization and positive control, namely, strains M15, M20, M21, M29, M36, M47, and M54 (sachet of 10.0 g) from Mangrove Jack’s brand, Bevie Handcraft NZ Limited (Auckland, New Zealand), and S-04, S-33, and US-05 from Fermentis Company (Marcq-En-Baroeul, France), line SafAleTM (sachet of 11.5 g). Also, strain QA23 by LalvinTM from Lalleman Company (Montreal, QC, Canada) was used as positive control. All the ADYs were purchased from Oficina da Cerveja, Lisbon, Portugal, and stored at 4 °C until use.

2.3.2. Yeast Isolation

The yeast isolation started with ADY activation according to the manufacturer’s recommendations. The ADYs were activated in a laminar flow chamber using autoclaved distilled water between 25 and 35 °C for 9–15 min according to the instructions on the package. From the activation mix, serial dilutions were performed until 10−8, spread on YPD plates, and incubated at 30 °C for 48 h. YPD plates with fewer than 100 colonies were selected for optimization. The colonies (isolates) of all the ADY strains studied had the same morphological characteristic as the S. cerevisiae species. Three colonies were randomly selected, purified, and stored in YPD broth enriched with glycerol (30.0% v/v) at −42 °C until analysis [17].

2.3.3. DNA Isolation and Purification

DNA isolation and purification was performed according to Lõoke et al. [18] with some modifications [17]. Each pure isolate was plated individually on YPD plates, sectioned, and incubated for 48 h at 30 °C. The isolate was picked from YPD plates and lysed in 100 µL of LiOAc-SDS buffer (200 mM, 1.0%) at 70 °C for 20 min. DNA was then precipitated by adding 300 µL of cold ethanol (70.0% v/v), vortexed briefly, and centrifuged at approximately 15,000× g for 3 min. The supernatant was removed, and the pellet was washed with 500 µL of cold ethanol (96.0% v/v) [17]. The DNA was vacuum-dried and resuspended in 50 µL of mQ. DNA purity and concentration was determined using NanoDropTM OneC, followed by dilution (300–500 ng/µL), with an average degree of purity of 1.9 (ds 0.05).

2.3.4. Optimization of PCR-Interdelta Conditions

The PCR amplification of the interdelta regions was performed using two pairs of primers, δ2–δ12 and δ12–δ21, where the δ2 primer was designed by Ness et al. [15] and the primers of the δ12–δ21 pairs were designed by Legras and Karst [19]. The amplification was performed in 25 µL of reaction: 300 ng of DNA, 20 µM of each primer, and 12.5 µL of 2× Taq mix. Two PCR amplification conditions were tested. Condition A, according to Shuller et al. [14], started with an initial denaturation at 94 °C for 2 min, followed by 35 cycles of denaturation at 94 °C for 0.5 min, primer annealing at 43.2 °C for 1 min, and extension at 72 °C for 1 min. Condition B started with an initial denaturation at 95 °C for 2 min, followed by 35 cycles of denaturation at 95 °C for 0.5 min, primer annealing at 41 °C for 1 min, and extension at 69 °C for 1 min. In both conditions (A and B), the final extension was performed at 72 °C for 10 min, followed by cooling at 4 °C.
PCR products were separated by electrophoresis in agarose TAE gel (1.5% w/v) on a horizontal system at 7 V/cm to 7 cm [14]. GeneRuler 100 bp DNA Ladder was used as a molecular size marker. The agarose gels were stained with 6× GelRed® 10,000× in water and observed under UV light, and digital images were acquired using Azure 600 equipment.
The gels were analyzed using GelAnalyzer 19.1 software [16]. Software optimizations were performed using the Ladder in five lines, namely, lines 1, 5, 10, 15, and 20, the positive control strain QA23, and the laboratory internal positive control.

2.4. PCR-Interdelta Analysis of Samples from DRM

2.4.1. Sampling

Sampling was performed according to grape varieties, depending on the area where they are traditionally produced, considering the appropriate agroedaphoclimatic conditions. In this sense, the six Vitis vinifera grapes varieties used in the present work were Tinta Negra, Verdelho, Malvasia de São Jorge, Boal, Sercial, and Complexa, which are widely used in MW production.
All the samples were taken from the north and south of Madeira Island (32°44′ N 16°58′ W), and grape must was procured from a certified winery. A total of eleven (11) samples, namely, four grapes must and seven grape berries (in natura), were used from licensed vineyards belonging to the legal status of the DRM during the 2020 vintage campaign (Table 1), between September and October, according to the governmental institution that regulates the sector.
The samples were harvested manually, in compliance with the sanitary, quality, and oenological parameters established by the DRM statutes and the internal sanitary procedures of each winery [17]. The sampling procedure was carried out with autoclaved materials. The grapes were collected aseptically, cooled, and transported immediately to the laboratory. The grapes were crushed manually, grape juice (500 mL) was transferred into sterile flasks at flame, and then the flasks were sealed using a fermentation tube.

2.4.2. Microfermentation and Yeast Isolation

Grape musts (500 mL) from different varieties were subjected to spontaneous microfermentations at 25 °C (ds = 0.5) and 160 rpm [17]. The potential alcohol (% v/v) was measured before and after the microfermentations and expressed using the conversion factor 16.83 g/L of sugar for each degree of potential alcohol [20] (Table 2). The microfermentations were monitored daily (24 h each) by assessing mass loss, until the sugar content reached a range of 33.66 to 50.49 g/L [17]. Then, serial dilutions were made, spread on YPD plates, and incubated at 30 °C for 48 h. After this period, the CFU was determined, and 30 isolates were randomly selected considering the morphology characteristics according to S. cerevisiae colonies. The isolates were purified and stored as described in Section 2.3.2.

2.4.3. PCR-Interdelta Analysis of Samples

DNA isolation was performed as described in Section 2.3.3 for S. cerevisiae strain typing. PCR-Interdelta analysis was performed using primers and PCR conditions optimized as described in Section 2.3.4, namely, δ2–δ12 pair primers [15,19], PCR condition A, and the separation and visualization of PCR products (Section 2.3.4) [14]. The gels were analyzed using GelAnalyzer 19.1 software. The Interdelta patterns were determined by the number and molecular weight of the bands.

3. Results

3.1. Spontaneous Microfermentation and Yeast Isolation

Seven berry and four must samples were used to study spontaneous fermentation. Figure 1 shows the daily (24 h) weight loss. Microfermentations lasted between 6 and 14 days, with a mass loss between 30 and 102 g/L. The process was stopped when the sugar content reached a range of 33.66 to 50.49 g/L.
Three different fermentative profiles were detected (Figure 1). The first profile showed a sharp loss of mass with a rapid onset and short fermentation duration (6 days). This profile was found in samples from certified grape must TNSV20M and VPz20M. The second profile exhibited an initial slower mass reduction over the first two to three days, then, decreases by two to three fold, ultimately stabilizing between days 8 and 14. This profile was found in VPd20U, VSx20U, BCp20M, BCp20U, SSx20M, SSx20U, and CSx20U. The third fermentative profile showed a constant mass loss that eventually reached a plateau. This profile was exhibited in TNSV20U and MSJ20U.
After microfermentations, the number of colony forming units per milliliter (CFU/mL) was determined. As can be observed in Table 2, 1367 of the 1452 isolates showed morphological characteristics of the S. cerevisiae colony, representing 94.2% of the colonies analyzed, coming from 11 samples.
The highest concentration of yeasts per milliliter were obtained from VPd20U followed by TNSV20U with 68.7% less than the former sample. In TNSV20M, VPz20M, VSx20U, BCp20M, and SSx20M, the number of CFU recorded decreased by more than 90.0%, with the lowest values recorded by MSJ20U, BCp20U, SSx20U, and CSx20U.

3.2. Optimized PCR-Interdelta Conditions

For optimization, two pairs of primers (δ2–δ12 and δ12–δ21) and two PCR conditions (A and B, as described in Section 2.3) were tested in 10 commercial strains. Using PCR condition A, both pairs of primers gave good results regarding resolution, patterns of bands, and reproducibility (Figure 2). On the other hand, poor results were obtained using condition B.
Figure 2a,b demonstrate the six distinct patterns (I to VI) in 10 commercial strains, showing 60.0% discriminatory power. Three strains (M47, M20, and M21) shared the same pattern (I), patterns II and III were shared by two strains (S-33—M15 and S-04—M36, respectively), while other three patterns (IV, V, and VI) were uniquely found in one strain (M29, M54, and US-05). Better resolution was obtained using primers δ2–δ12 compared to δ12–δ21 (Figure 2). Thus, the former primers were used to assay the interdelta variability (polymorphism) of our samples.

3.3. PCR-Interdelta Analysis of Endogenous Isolates

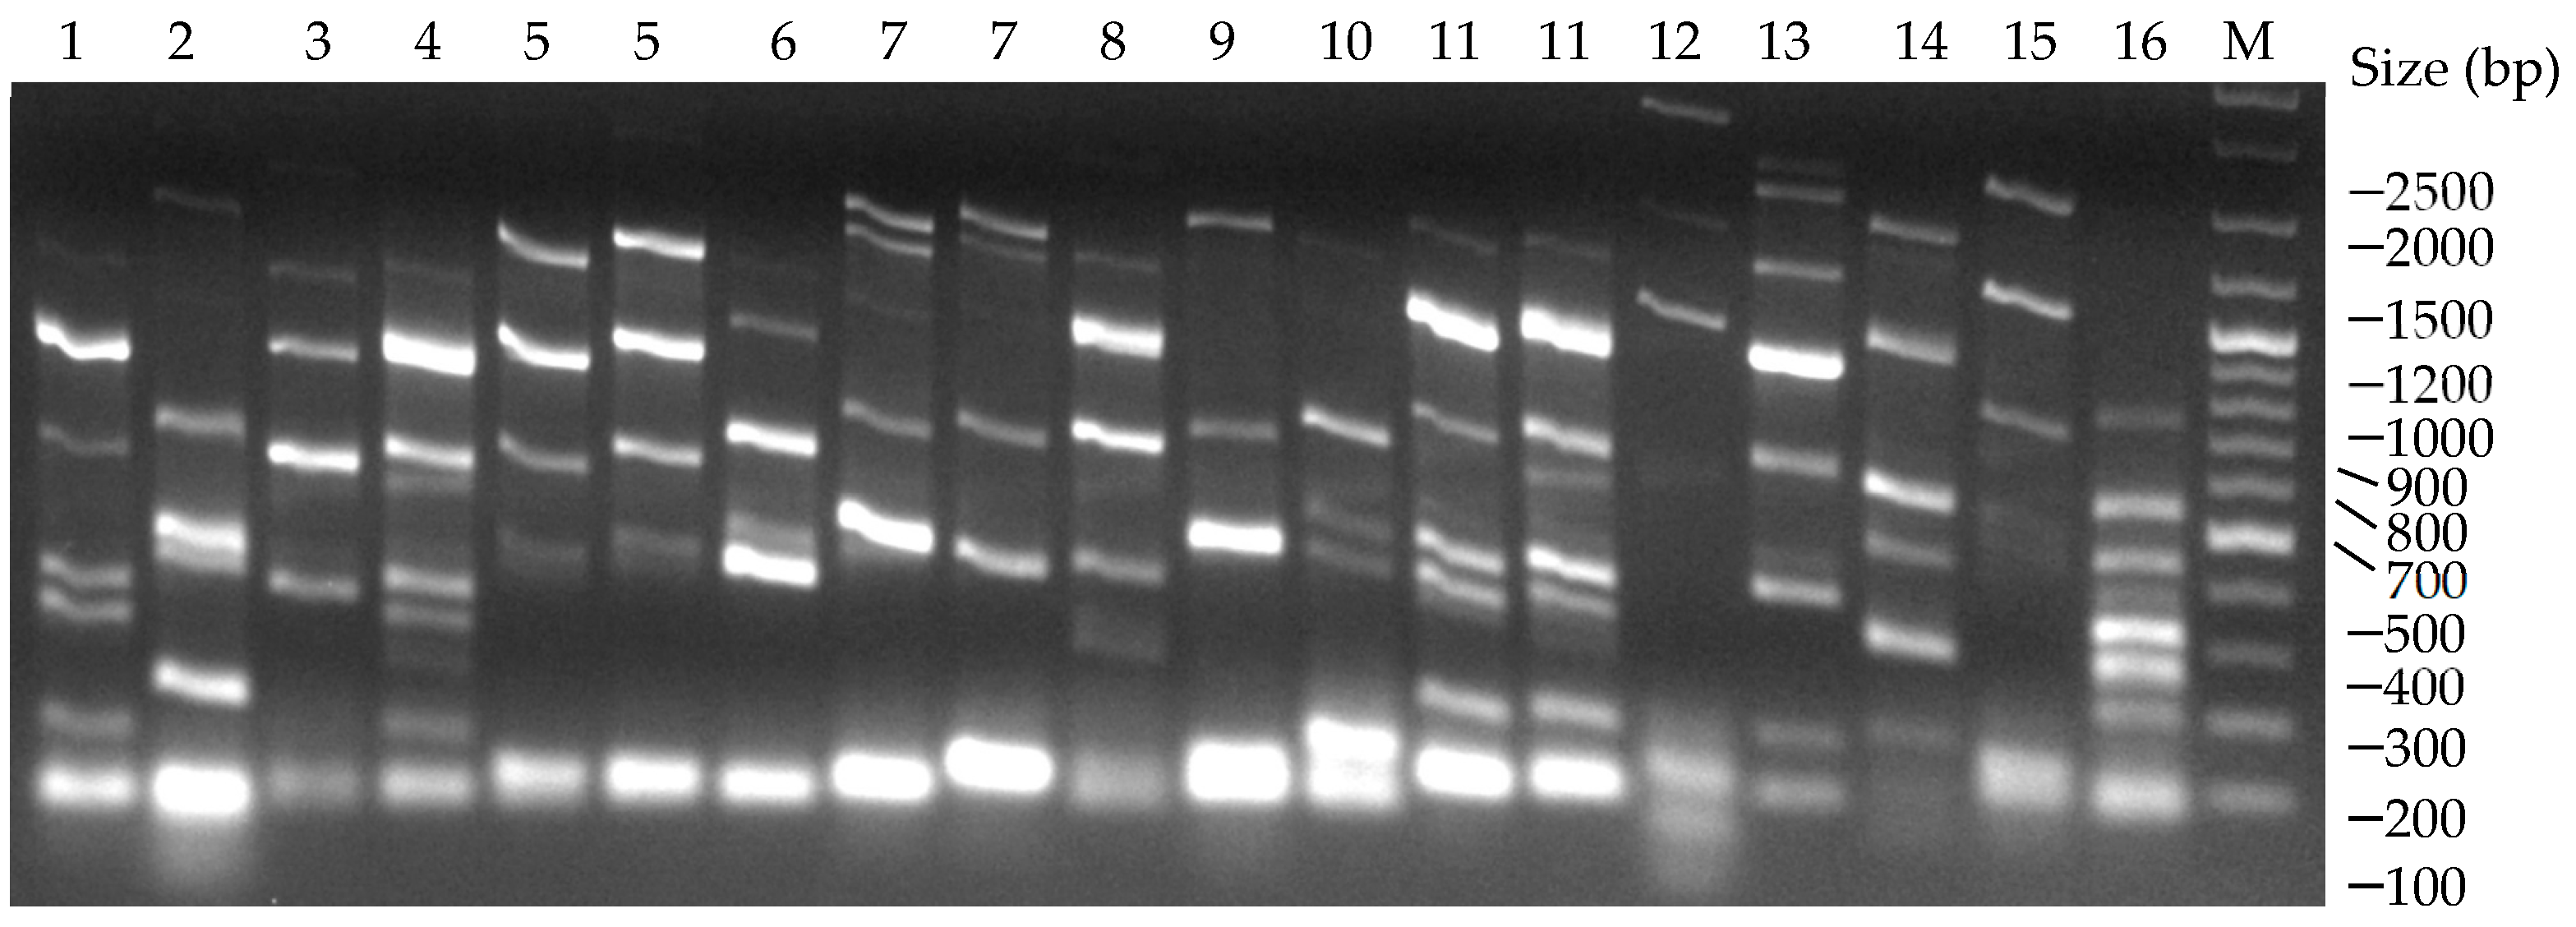
Isolates (330) showing macromorphological aspects of S. cerevisiae were randomly chosen from 11 samples and analyzed for interdelta variability. A total of 25 polymorphic patterns were detected. Figure 3 shows 16 of the most prevailing patterns. The Interdelta patterns varied depending on the samples; five samples (TNSV20M, VPd20U, VSx20U, BCp20U, and CSx20U) showed unique patterns each; three (MSJ20U, BCp20M, and SSx20U) showed two patterns each; two (TNSV20U and VPz20M) showed four patterns, and one (SSx20M) six patterns.
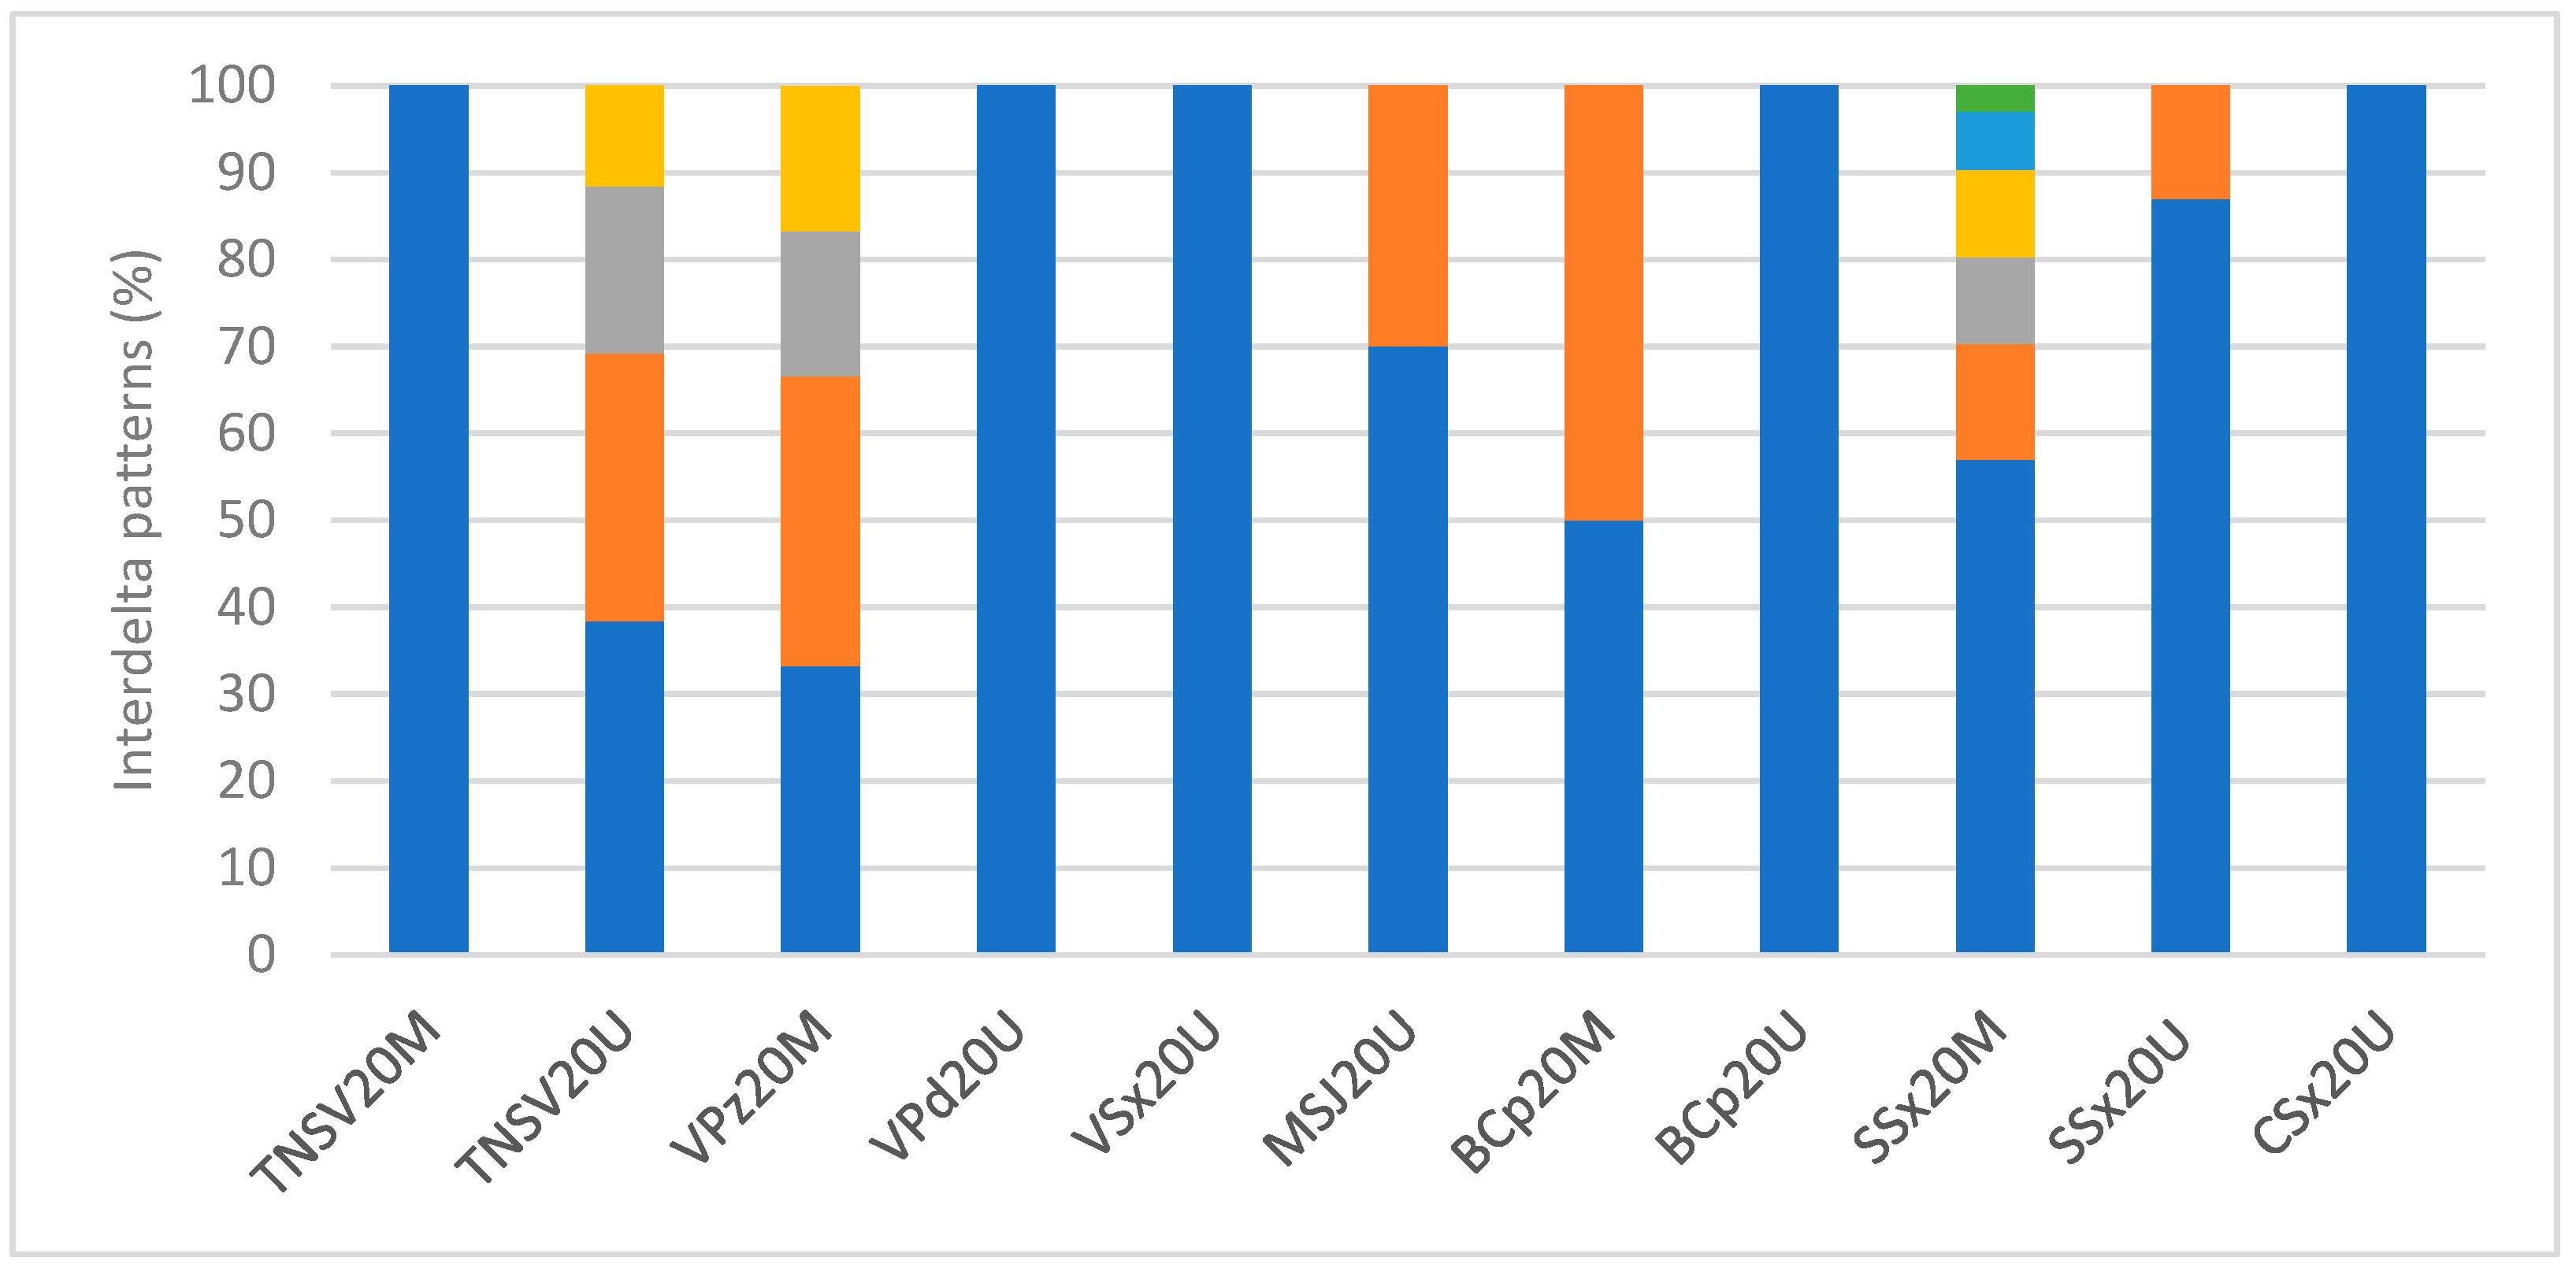
Six microfermentations (samples) were conducted by more than one strain, in which the dominance or codominance was verified in different percentages, as shown in Figure 4. In VPz20M, it can be observed that two Interdelta patterns are dominant and codominant at the same time, representing 33.3% each, totaling 66.6%. In BCp20M, it is a codominance case, while in each of MSJ20U and SSx20U, one pattern is clearly dominant. Microfermentation SSx20M was the sample with the most patterns; however, one Interdelta pattern is visibly dominant (57.0%).

4. Discussion

Several studies have demonstrated the importance of agroedaphoclimatic conditions in the microbial terroir [9,21] and the impact of S. cerevisiae strains on the quality and, above all, the regional identity of wines. In this sense, molecular identification is employed since the 1990s [12,22,23,24,25] in many wine regions, such as Portugal [26], Spain [7], Italy [27,28], and France [24], as well as in emerging wine-producing countries worldwide such as the United States of America [29], South Africa [30], Argentina [31], China [32], and more. From the DRM, only a few studies reported the identification of yeast species [5] and S. cerevisiae strains [17].
In the present work, 11 samples from six grape varieties used in MW production verified that S. cerevisiae represented just over 94.0% of isolates counted at the end of spontaneous alcoholic fermentation. Although this value is higher than those reported from other Portuguese wine regions (60.0–90.0%), it is lower than those reported from Spain (97.0%) [7,9]. On the other hand, in emerging wine producers, these strains fully dominated (100.0%) at the end of fermentations both in winery and laboratory assays [33]. These differences can partly be modulated by such agronomic practices as the application of phytopharmaceutical treatments or organic production [7], as well as specific climate and geographic localization [9].

PCR-Interdelta Analysis

The interdelta analysis is based on the amplification of interdelta DNA regions using mainly δ-2 [15], δ-12, and δ-21 [19] primers. It should be emphasized that, under winemaking conditions, the genomic stability of S. cerevisiae is sufficient for PCR-Interdelta analysis [15].
The characterization of 10 commercial S. cerevisiae strains resulted in six Interdelta patterns for both pairs of primers employed (δ2–12 and δ12–21), with the same percentages of discrimination (60.0%). Other studies reported higher discrimination values for commercial strains ranging from 77.8% up to 100.0% [11,14,19,21]. These differences could be attributed to the types and genetic closeness of the commercial strains analyzed [14].
In general, the use of primer δ12–21 is more reported [7,19,21,28,32,33,34] than that of primer δ2–12 [35,36]; moreover, some works reported the higher discriminatory power of δ12–21 [14], whereas the opposite results were reported by other works [11]. Moreover, another study screened the bulk using first δ2–12, followed by δ12–21 [13]. Therefore, testing both pairs of primers is recommended.
To monitor the population of S. cerevisiae during fermentation, Xufre et al. [11] tested three pairs of primers (δ1–2, δ2–12, and δ12–21), choosing δ2–12 due to its higher level of discrimination. Similarly, we tested the same three pairs of primers, and we obtained a low number of bands with δ1–2 (data unpublished), and the same level of discrimination with δ2–12 and δ12–21 primers (Figure 1). However, we chose the δ2–12 primer due to the slightly lower number of bands, better resolution of the bands and band sizes, which allow more accurate analysis of the Interdelta patterns, compared to the δ12–21 primers (Figure 1).
The intraspecific variability of S. cerevisiae strains was 7.6% in the present work, a comparable value (8.0%) was reported in our earlier work, using the Restriction Fragment Length Polymorphism of mitochondrial DNA technique (RFLP-mtDNA) [17]. Celis et al. [7] reported 10.5% of intraspecific variability in the Rueda Wine Region (Spain) while a much lower value (2%) was reported in China by Sun et al. [33]. In New Zealand, a study by Zhang et al. [21] reported 13.4% of intraspecific variability in vinification conditions in the winery and 27.0% in the vineyards for the same grape musts. The results can be explained by the agroedaphoclimatic conditions of the vineyards, geographical locations, winery microbiota, oenological techniques, and other variables [7,21,33]. Different intraspecific variability was also detected in the present study, where SSx20M had higher variability compared to SSx20U (20.0% vs. 6.7%). For samples TNSV20M and TNSV20U, the results are opposite.
The difference in intraspecific variability also can be related to the size of the sample, since the winery processes large volumes compared to the manual sample (3 to 5 kg), even after the control of the ripening protocols in which the sample is representative of the vineyards. On the other hand, the winery in campaign processes large and different grape varieties, sometimes using different oenological techniques, which includes the winery microbiota on equipment, devices, and other items used in wine production [5,13]. Over the years, the winery microbiota can define and shape the fingerprint of the wines that are produced [37].

5. Conclusions

This study presents the first non-official collection of S. cerevisiae strains from the DRM. The findings underscore the pivotal role of S. cerevisiae strain diversity in shaping the regional identity and quality of wines, with molecular tools like PCR-Interdelta analysis proving essential for monitoring intraspecific variability. The high dominance of S. cerevisiae (94.0%) observed here aligns with regional trends but exceeds typical Portuguese ranges (60.0–90.0%), suggesting site-specific influences from agronomic practices (e.g., organic production), climatic conditions, and winery microbiota. Further work is being carried out, including more vintage campaigns from the Madeira Archipelago.
The intraspecific variability highlights the profound impact of edaphoclimatic factors, geographical isolation, and winemaking techniques on the microbial terroir. Disparities in variability between samples (e.g., SSx20M vs. SSx20U) further implicate winery-scale processing and historical microbiota in shaping strain evolution. These insights advocate for tailored yeast selection strategies that leverage indigenous strains to preserve regional typicity, particularly in emerging wine regions where full microbial dominance (100.0%) may reflect less diversified practices. Future work should prioritize integrating multiprimer approaches and longitudinal studies to unravel the complex interplay between microbial ecology, viticultural practices, and terroir expression.
Madeira Island can be considered a “living laboratory” due to its geographical isolation and almost non-existent use of commercial yeasts in the regional wine industry. This work represents the first step towards an increase in scientific knowledge and the conservation of patrimonial viticulture by exploring and identifying the oenological potential intrinsic in the S. cerevisiae strains associated with the yeast biodiversity of the Madeira Archipelago, that is reflected in the microbial terroir and shows potential correlations with wine phenotypes.

Author Contributions

Conceptualization, M.M.C., J.S.C. and M.K.; methodology, M.M.C.; validation, M.M.C. and N.P.; formal analysis, M.M.C.; investigation M.M.C., J.S.C. and M.K.; resources, J.S.C. and M.K.; data curation, M.M.C. and N.P.; writing—original draft preparation, M.M.C.; writing—review and editing, J.S.C. and M.K.; supervision, J.S.C. and M.K.; funding acquisition, J.S.C. and M.K. All authors have read and agreed to the published version of the manuscript.

Funding

This work was supported by the Fundação para a Ciência e a Tecnologia (FCT) with Portuguese Government funds through the CQM Base Fund—UIDB/00674/2020 (DOI: 10.54499/UIDB/00674/2020) and Programmatic Fund—UIDP/00674/2020 (DOI 10.54499/UIDP/00674/2020), and by ARDITI-Agência Regional para o Desenvolvimento da Investigação Tecnologia e Inovação through funds from the Região Autónoma da Madeira-Governo Regional. Mariangie Martinez Castillo offers thanks for the PhD fellowship SFRH/BD/147434/2019 supported by FCT.

Data Availability Statement

The original contributions presented in the study are included in the article, further inquiries can be directed to the corresponding author.

Acknowledgments

The authors are particularly grateful to the winery and winegrowers for providing the certified samples used in this work, first to Vinhos Barbeito (Madeira) Lda., for supplying all the grapes must samples, followed by the local winegrowers for supplying the grape berry samples, including Miguel Caldeira for supplying the ADY used in the optimization and grape berry samples.

Conflicts of Interest

The authors declare no conflicts of interest.

References

  1. Perestrelo, R.; Silva, C.; Gonçalves, C.; Castillo, M.; Câmara, J.S. An Approach of the Madeira Wine Chemistry. Beverages 2020, 6, 12. [Google Scholar] [CrossRef]
  2. Pinheiro de Carvalho, M.Â.A.; Ragonezi, C.; Oliveira, M.C.O.; Reis, F.; Macedo, F.L.; de Freitas, J.G.R.; Nóbrega, H.; Ganança, J.F.T. Anticipating the Climate Change Impacts on Madeira’s Agriculture: The Characterization and Monitoring of a Vine Agrosystem. Agronomy 2022, 12, 2201. [Google Scholar] [CrossRef]
  3. Direção Regional de Estatística. Estatísticas da Agricultura e Pesca da Região Autónoma da Madeira; Direção Regional de Estatística: Funchal, Portugal, 2024; ISBN 978-989-9188-06-8. Available online: https://estatistica.madeira.gov.pt/download-now/economica/agricultura-floresta-e-pesca/prod-veg-prd-animal-pesca-pt/prod-vegetal-publicacoes-pt/send/74-producao-vegetal-publicacoes/17512-agricultura-e-pesca-2023pdf.html (accessed on 3 May 2025).
  4. Perestrelo, R.; Silva, C.; Câmara, J.S. Madeira Wine Volatile Profile. A Platform to Establish Madeira Wine Aroma Descriptors. Molecules 2019, 24, 3028. [Google Scholar] [CrossRef]
  5. Miranda, A.; Pereira, V.; Jardim, H.; Malfeito-Ferreira, M.; Marques, J.C. Impact of Non-Saccharomyces Yeast Fermentation in Madeira Wine Chemical Composition. Processes 2023, 11, 482. [Google Scholar] [CrossRef]
  6. Perestrelo, R.; Jaouhari, Y.; Abreu, T.; Castillo, M.M.; Travaglia, F.; Pereira, J.A.M.; Câmara, J.S.; Bordiga, M. The Fingerprint of Fortified Wines—From the Sui Generis Production Processes to the Distinctive Aroma. Foods 2023, 12, 2558. [Google Scholar] [CrossRef]
  7. de Celis, M.; Ruiz, J.; Martín-Santamaría, M.; Alonso, A.; Marquina, D.; Navascués, E.; Gómez-Flechoso, M.; Belda, I.; Santos, A. Diversity of Saccharomyces cerevisiae Yeasts Associated to Spontaneous and Inoculated Fermenting Grapes from Spanish Vineyards. Lett. Appl. Microbiol. 2019, 68, 580–588. [Google Scholar] [CrossRef]
  8. Chen, Y.; Jiang, J.; Song, Y.; Zang, X.; Wang, G.; Pei, Y.; Song, Y.; Qin, Y.; Liu, Y. Yeast Diversity during Spontaneous Fermentations and Oenological Characterisation of Indigenous Saccharomyces cerevisiae for Potential as Wine Starter Cultures. Microorganisms 2022, 10, 1455. [Google Scholar] [CrossRef]
  9. Pinto, C.; Pinho, D.; Cardoso, R.; Custódio, V.; Fernandes, J.; Sousa, S.; Pinheiro, M.; Egas, C.; Gomes, A.C. Wine Fermentation Microbiome: A Landscape from Different Portuguese Wine Appellations. Front. Microbiol. 2015, 6, 905. [Google Scholar] [CrossRef]
  10. Parapouli, M.; Vasileiadis, A.; Afendra, A.S.; Hatziloukas, E. Saccharomyces cerevisiae and Its Industrial Applications. AIMS Microbiol 2020, 6, 1–31. [Google Scholar] [CrossRef]
  11. Xufre, A.; Albergaria, H.; Gírio, F.; Spencer-Martins, I. Use of Interdelta Polymorphisms of Saccharomyces cerevisiae Strains to Monitor Population Evolution during Wine Fermentation. J. Ind. Microbiol. Biotechnol. 2011, 38, 127–132. [Google Scholar] [CrossRef]
  12. Querol, A.; Huerta, T.; Barrio, E.; Ramón, D. Dry Yeast Strain for use in Fermentation of Alicante Wines: Selection and DNA Patterns. J. Food Sci. 1992, 57, 183–185. [Google Scholar] [CrossRef]
  13. Capece, A.; Siesto, G.; Poeta, C.; Pietrafesa, R.; Romano, P. Indigenous Yeast Population from Georgian Aged Wines Produced by Traditional “Kakhetian” Method. Food Microbiol. 2013, 36, 447–455. [Google Scholar] [CrossRef] [PubMed]
  14. Schuller, D.; Valero, E.; Dequin, S.; Casal, M. Survey of Molecular Methods for the Typing of Wine Yeast Strains. FEMS Microbiol. Lett. 2004, 231, 19–26. [Google Scholar] [CrossRef]
  15. Ness, F.; Lavallee, F.; Dubourdieu, D.; Aigle, M.; Dulaub, L. Identification of Yeast Strains Using the Polymerase Chain Reaction. J. Sci. Food Agric. 1993, 62, 89–94. [Google Scholar] [CrossRef]
  16. Lazar, I., Jr.; Lazar, I., Sr. GelAnalyzer, Veision 19.1. 2010. Available online: www.gelanalyzer.com (accessed on 14 September 2023).
  17. Castillo, M.; da Silva, E.; Câmara, J.S.; Khadem, M. Molecular Identification and VOMs Characterization of Saccharomyces cerevisiae Strains Isolated from Madeira Region Winery Environments. Processes 2020, 8, 1058. [Google Scholar] [CrossRef]
  18. Löoke, M.; Kristjuahan, K.; Kristjuhan, A. Extraction of Genomic DNA from Yeasts for PCR-Based Applications. Biotechniques 2011, 50, 325–328. [Google Scholar] [CrossRef]
  19. Legras, J.L.; Karst, F. Optimisation of Interdelta Analysis for Saccharomyces cerevisiae Strain Characterisation. FEMS Microbiol. Lett. 2003, 221, 249–255. [Google Scholar] [CrossRef] [PubMed]
  20. Ribéreau-Gayon, P.; Dubourdieu, D.; Donèche, B.; Lonvaud, A. Handbook of Enology—The Microbiology of Wine and Vinifications, 2nd ed.; John Wiley and Sons, Ltd.: West Sussex, UK, 2005; Volume 1, p. viii. [Google Scholar]
  21. Zhang, J.; Plowman, J.E.; Tian, B.; Clerens, S.; On, S.L.W. Genotyping and Phenotyping of Indigenous Saccharomyces cerevisiae from a New Zealand Organic Winery and Commercial Sources Using Inter-Delta and MALDI-TOF MS Typing. Microorganisms 2024, 12, 1299. [Google Scholar] [CrossRef]
  22. Querol, A.; Barrio, E.; Huerta, T.; Ramón, D. Molecular Monitoring of Wine Fermentations Conducted by Active Dry Yeast Strains. Appl. Environ. Microbiol. 1992, 58, 2948–2953. [Google Scholar] [CrossRef]
  23. Querol, A.; Barrio, E.; Ramón, D. Population Dynamics of Natural Saccharomyces Strains during Wine Fermentation. Int. J. Food Microbiol. 1994, 21, 315–323. [Google Scholar] [CrossRef]
  24. Versavaud, A.; Courcoux, P.; Roulland, C.; Dulau, L.; Hallet, J.N. Genetic Diversity and Geographical Distribution of Wild Saccharomyces cerevisiae Strains from the Wine-Producing Area of Charentes, France. Appl. Environ. Microbiol. 1995, 61, 3521–3529. [Google Scholar] [CrossRef] [PubMed]
  25. Fernández-Espinar, M.T.; Llopis, S.; Querol, A.; Barrio, E. Molecular Identification and Characterization of Wine Yeasts. In Molecular Wine Microbiology; Carrascosa, A.V., Muñoz, R., González, R., Eds.; Elsevier Science Publishing Co Inc.: New York, NY, USA, 2011; pp. 111–141. ISBN 9780123750211. [Google Scholar]
  26. Schuller, D.; Alves, H.; Dequin, S.; Casal, M. Ecological Survey of Saccharomyces cerevisiae Strains from Vineyards in the Vinho Verde Region of Portugal. FEMS Microbiol. Ecol. 2005, 51, 167–177. [Google Scholar] [CrossRef]
  27. Cappello, M.S.; Bleve, G.; Grieco, F.; Dellaglio, F.; Zacheo, G. Characterization of Saccharomyces cerevisiae Strains Isolated from Must of Grape Grown in Experimental Vineyard. J. Appl. Microbiol. 2004, 97, 1274–1280. [Google Scholar] [CrossRef]
  28. Tristezza, M.; Fantastico, L.; Vetrano, C.; Bleve, G.; Corallo, D.; Mita, G.; Grieco, F. Molecular and Technological Characterization of Saccharomyces cerevisiae Strains Isolated from Natural Fermentation of Susumaniello Grape Must in Apulia, Southern Italy. Int. J. Microbiol. 2014, 2014, 897428. [Google Scholar] [CrossRef] [PubMed]
  29. Bougreau, M.; Ascencio, K.; Bugarel, M.; Nightingale, K.; Loneragan, G. Yeast Species Isolated from Texas High Plains Vineyards and Dynamics during Spontaneous Fermentations of Tempranillo Grapes. PLoS ONE 2019, 14, 0216246. [Google Scholar] [CrossRef]
  30. Van Der Westhuizen, T.J.; Augustyn, O.P.H.; Pretorius, I.S. Geographical Distribution of Indigenous Saccharomyces cerevisiae Strains Isolated from Vineyards in the Coastal Regions of the Western Cape in South Africa. S. Afr. J. Enol. Vitic. 2000, 21, 3–9. [Google Scholar] [CrossRef]
  31. Del Mónaco, S.M.; Curilen, Y.; Maturano, R.; Simes, A.; Caballero, A. The Use of Indigenous Yeast to Develop High-Quality Patagonian Chapter Book. In Grape and Wine Biotechnology; Morato, A., Loira, I., Eds.; InTechOpen: London, UK, 2016. [Google Scholar]
  32. Feng, L.; Wang, J.; Ye, D.; Song, Y.; Qin, Y.; Liu, Y. Yeast Population Dynamics during Spontaneous Fermentation of Icewine and Selection of Indigenous Saccharomyces cerevisiae Strains for the Winemaking in Qilian, China. J. Sci. Food Agric. 2020, 100, 5385–5394. [Google Scholar] [CrossRef] [PubMed]
  33. Sun, H.; Hao, M.; Pretorius, I.S.; Chen, S. Identification of Yeast Population Dynamics of Spontaneous Fermentation in Beijing Wine Region, China. Ann. Microbiol. 2009, 59, 69–76. [Google Scholar] [CrossRef]
  34. Van Zandycke, S.; Bertrand, D.; Daniel, H.; Douglas, P.; Helber, J.; Jenkins, D.; Kanda, H.; Pawlowski, K.; Rainieri, S.; Rosti, J.; et al. PCR Applications to Brewing: Differentiation of Brewing Yeast Strains by PCR Fingerprinting. Am. Soc. Brew. Chemists J. 2008, 66, 266–270. [Google Scholar] [CrossRef]
  35. Le Jeune, C.; Erny, C.; Demuyter, C.; Lollier, M. Evolution of the Population of Saccharomyces cerevisiae from Grape to Wine in a Spontaneous Fermentation. Food Microbiol. 2006, 23, 709–716. [Google Scholar] [CrossRef]
  36. Capece, A.; Romaniello, G.; Siesto, G.; Romano, P. Diversity of Saccharomyces cerevisiae Yeasts Associated to Spontaneously Fermenting Grapes from an Italian “Heroic Vine-Growing Area”. Food Microbiol. 2012, 31, 159–166. [Google Scholar] [CrossRef] [PubMed]
  37. Lappa, I.K.; Kachrimanidou, V.; Pateraki, C.; Koulougliotis, D.; Eriotou, E.; Kopsahelis, N. Indigenous Yeasts: Emerging Trends and Challenges in Winemaking. Curr. Opin. Food Sci. 2020, 32, 133–143. [Google Scholar] [CrossRef]
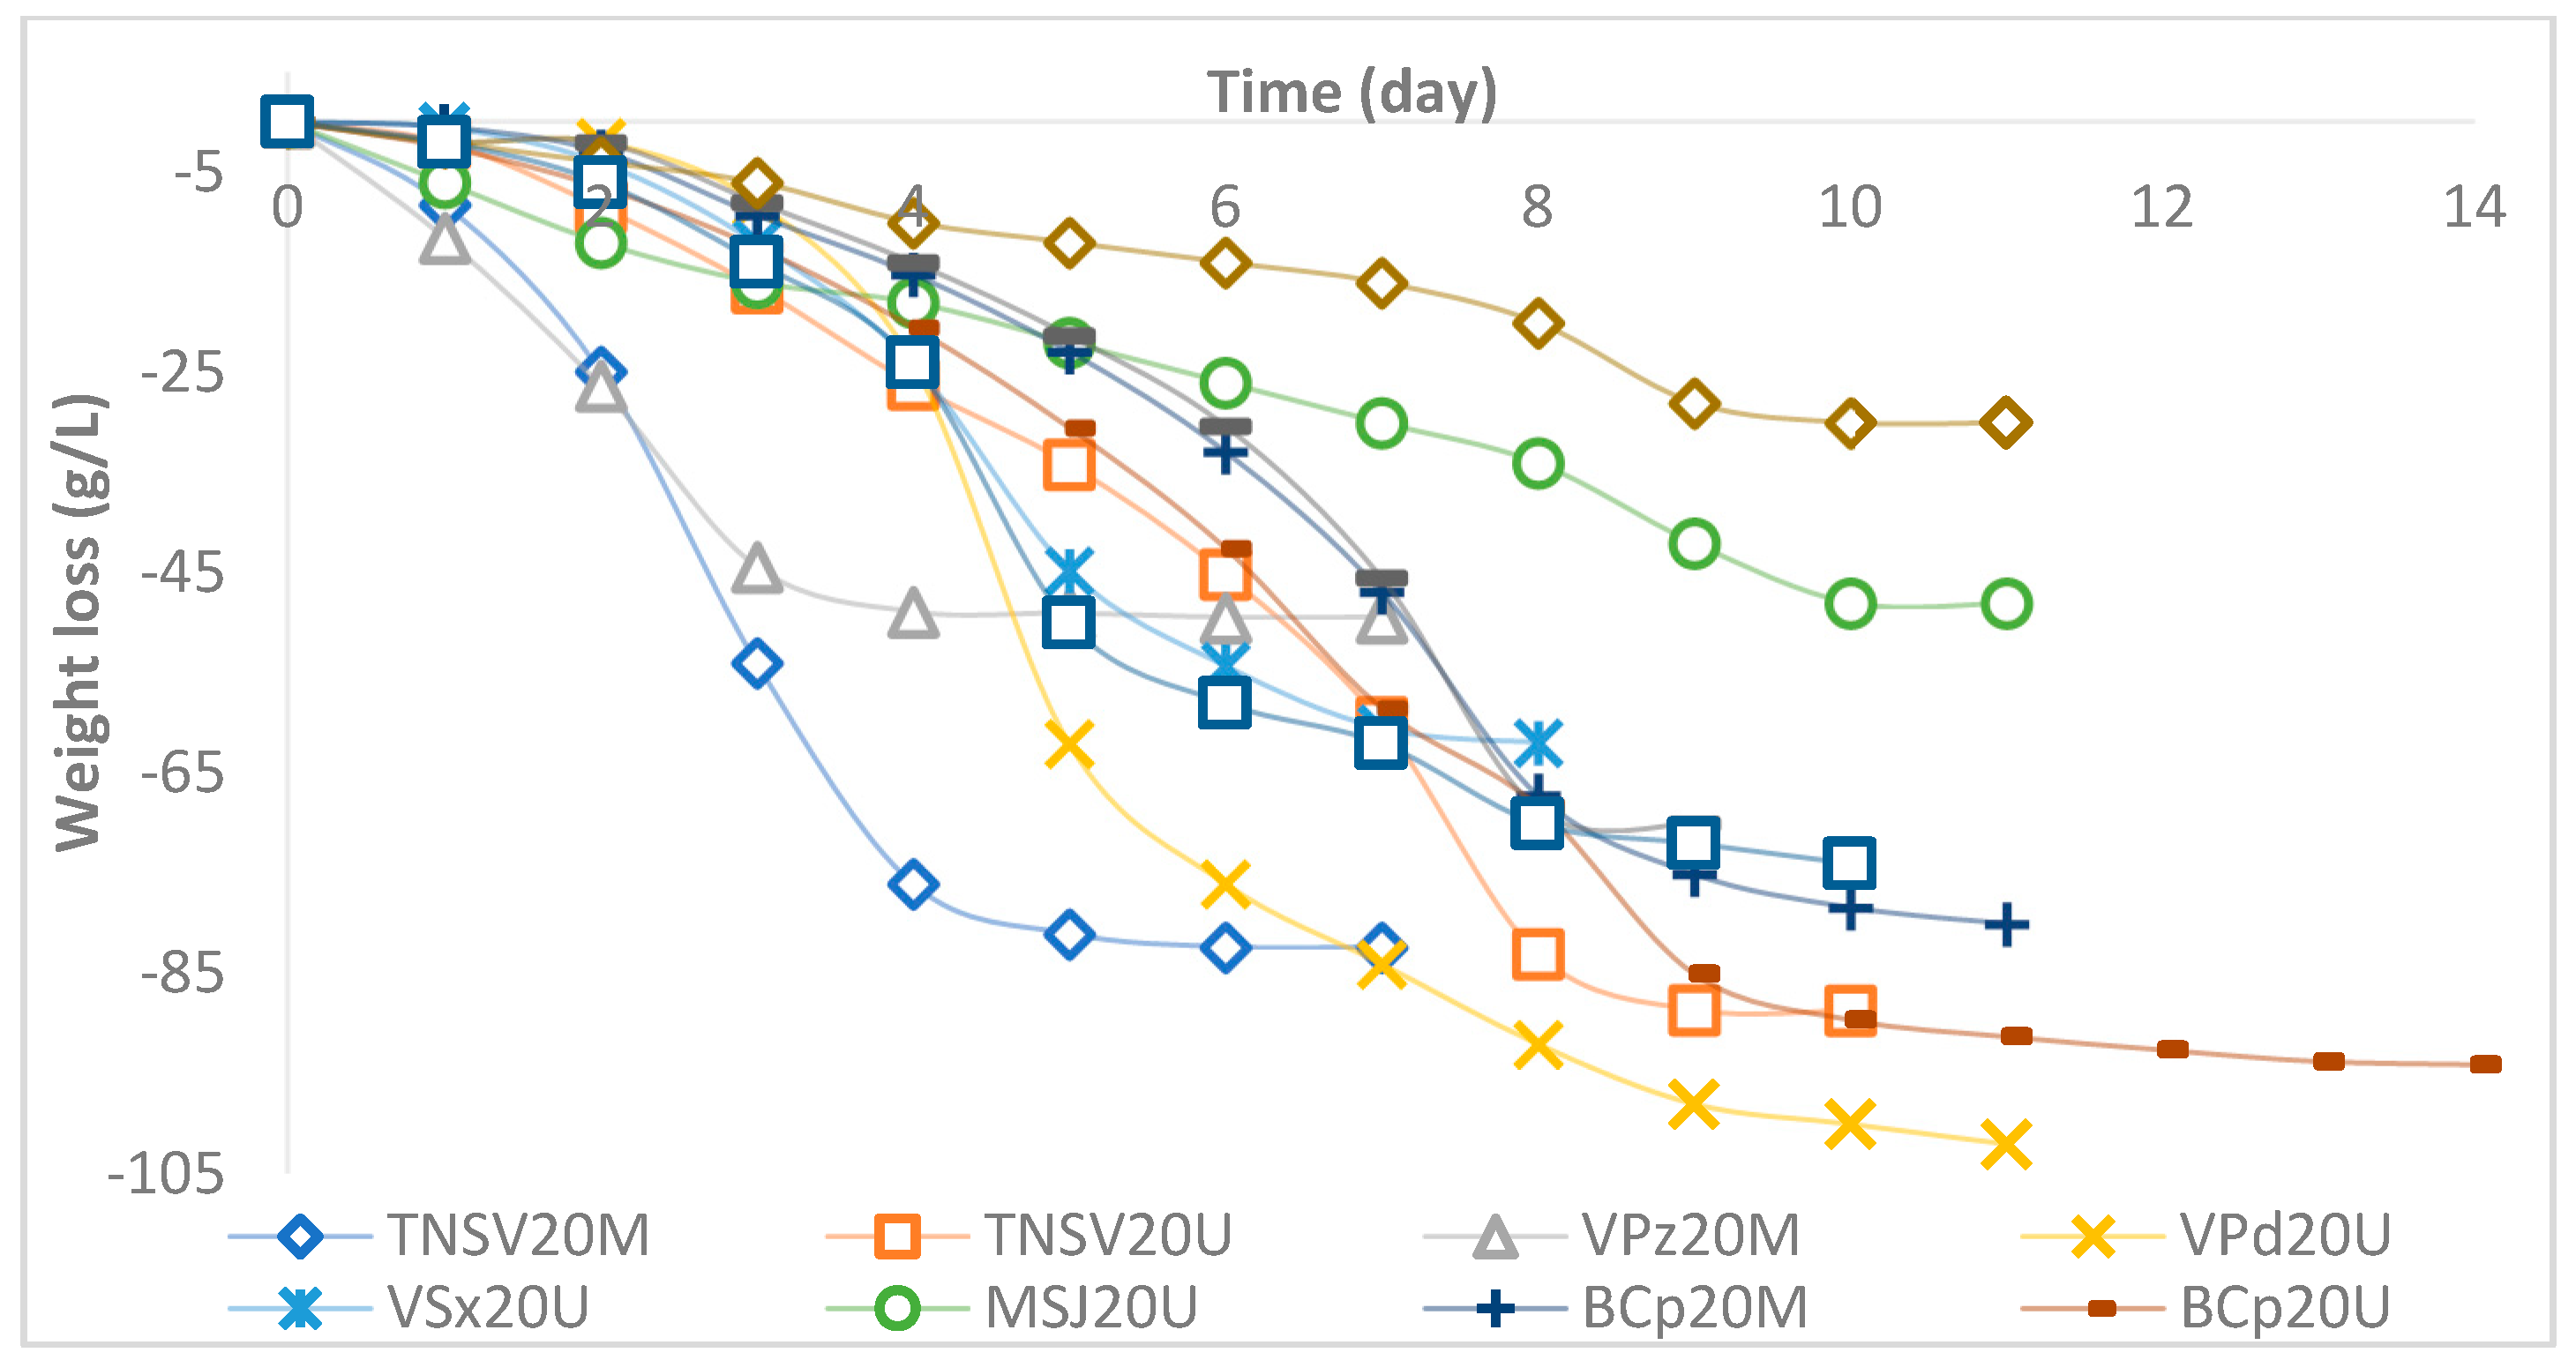
Figure 1. Fermentative profile of samples described in Table 1.
Beverages 11 00084 g001
Figure 2. PCR-Interdelta patterns from commercial ADY S. cerevisiae strains described in Section 2.3.1, using condition of amplification A. The numbers 1 to 10 correspond to commercial ADY strains: 1—M47; 2—M54; 3—S-04; 4—S-33; 5—US-05; 6—M15; 7—M20; 8—M21; 9—M29; 10—M36; 0—no strain. (a,b) show the patterns obtained by primers δ2–δ12 and δ12–δ21, respectively. I to VI: PCR-Interdelta patterns identified; M–100 bp GeneRuler DNA Leader; N—negative control; agarose gel (1.5%); TAE 1× buffer.
Beverages 11 00084 g002
Figure 3. PCR-Interdelta patterns from samples described in Section 2.4.1, using condition of amplification A, previously optimized, and δ2–δ12 primers. The numbers 1–16 correspond to PCR-Interdelta patterns of endogenous S. cerevisiae strains from the DRM: 1—TNSV20MA; 2—SSx20MB; 3—SSx20MG; 4—VSx20UA; 5—TNSV20UA; 6—TNSV20UC; 7—VPz20MA; 8—VPz20MC; 9—VPz20MD; 10—VPd20UA; 11—BCp20UA; 12—SSx20UA; 13—MSJ20UA; 14—MSJ20UB; 15—BCp20MA; 16—CSx20UA; M—GeneRuler DNA Leader Mix; agarose gel (1.5%).
Beverages 11 00084 g003
Figure 4. Interdelta patterns and dominant/codominant (%) strains of samples described in Table 1.
Beverages 11 00084 g004
Table 1. Samples from the DRM used in this study.
#Variety Type 1ZoneCoordinates 2Id. 3
1Tinta Negra MustSão Vicente32.47° N 17.01° WTNSV20M
2Tinta Negra BerriesSão VicenteTNSV20U
3VerdelhoMustPrazeres32.45° N 17.12° WVPz20M
4VerdelhoBerriesPedregal32.39° N 16.59° WVPd20U
5VerdelhoBerriesSeixal32.49° N 17.06° WVSx20U
6Malvasia SJ *BerriesSão Jorge32.49° N 16.54° WMSJ20U
7Boal MustCampanário32.40° N 17.02° WBCp20M
8Boal BerriesCampanárioBCp20U
9SercialMustSeixal32.49° N 17.06° WSSx20M
10Sercial BerriesSeixalSSx20U
11ComplexaBerriesSeixalCSx20U
1 Type of sample. 2 Coordinates of zone of sampling: latitude (N) and longitude (W). 3 Identification code of each sample. * Malvasia de São Jorge. #: number of each sample.
Table 2. Isolates obtained for each sample.
#Id. SCS 1 (g/L)SCF 2 (g/L)DilutionCol. No. 3CFU/mL 4
1TNSV20M151.4742.0110−51091.09 × 107
2TNSV20U166.6245.4410−62982.98 × 108
3VPz20M168.3040.3910−51371.37 × 107
4VPd20U193.5547.1210−7959.50 × 108
5VSx20U154.8433.6610−51141.14 × 107
6MSJ20U151.4737.0310−5373.70 × 106
7BCp20M168.3047.1210−51041.04 × 107
8BCp20U185.1350.5010−41641.64 × 106
9SSx20M151.4733.6610−52122.12 × 107
10SSx20U151.4750.5010−4303.00 × 105
11CSx20U153.1537.0310−5676.70 × 106
1 Sugar Content Starting. 2 Sugar Content Finished. 3 Colony numbers. 4 Colony Forming Unit per milliliter. #: number of each samples. Id.: Identification code of each sample.
Disclaimer/Publisher’s Note: The statements, opinions and data contained in all publications are solely those of the individual author(s) and contributor(s) and not of MDPI and/or the editor(s). MDPI and/or the editor(s) disclaim responsibility for any injury to people or property resulting from any ideas, methods, instructions or products referred to in the content.