Total Water Intake and Total Fluid Intake Worldwide: A Systematic Literature Review in Children and Adolescents


Abstract
1. Introduction
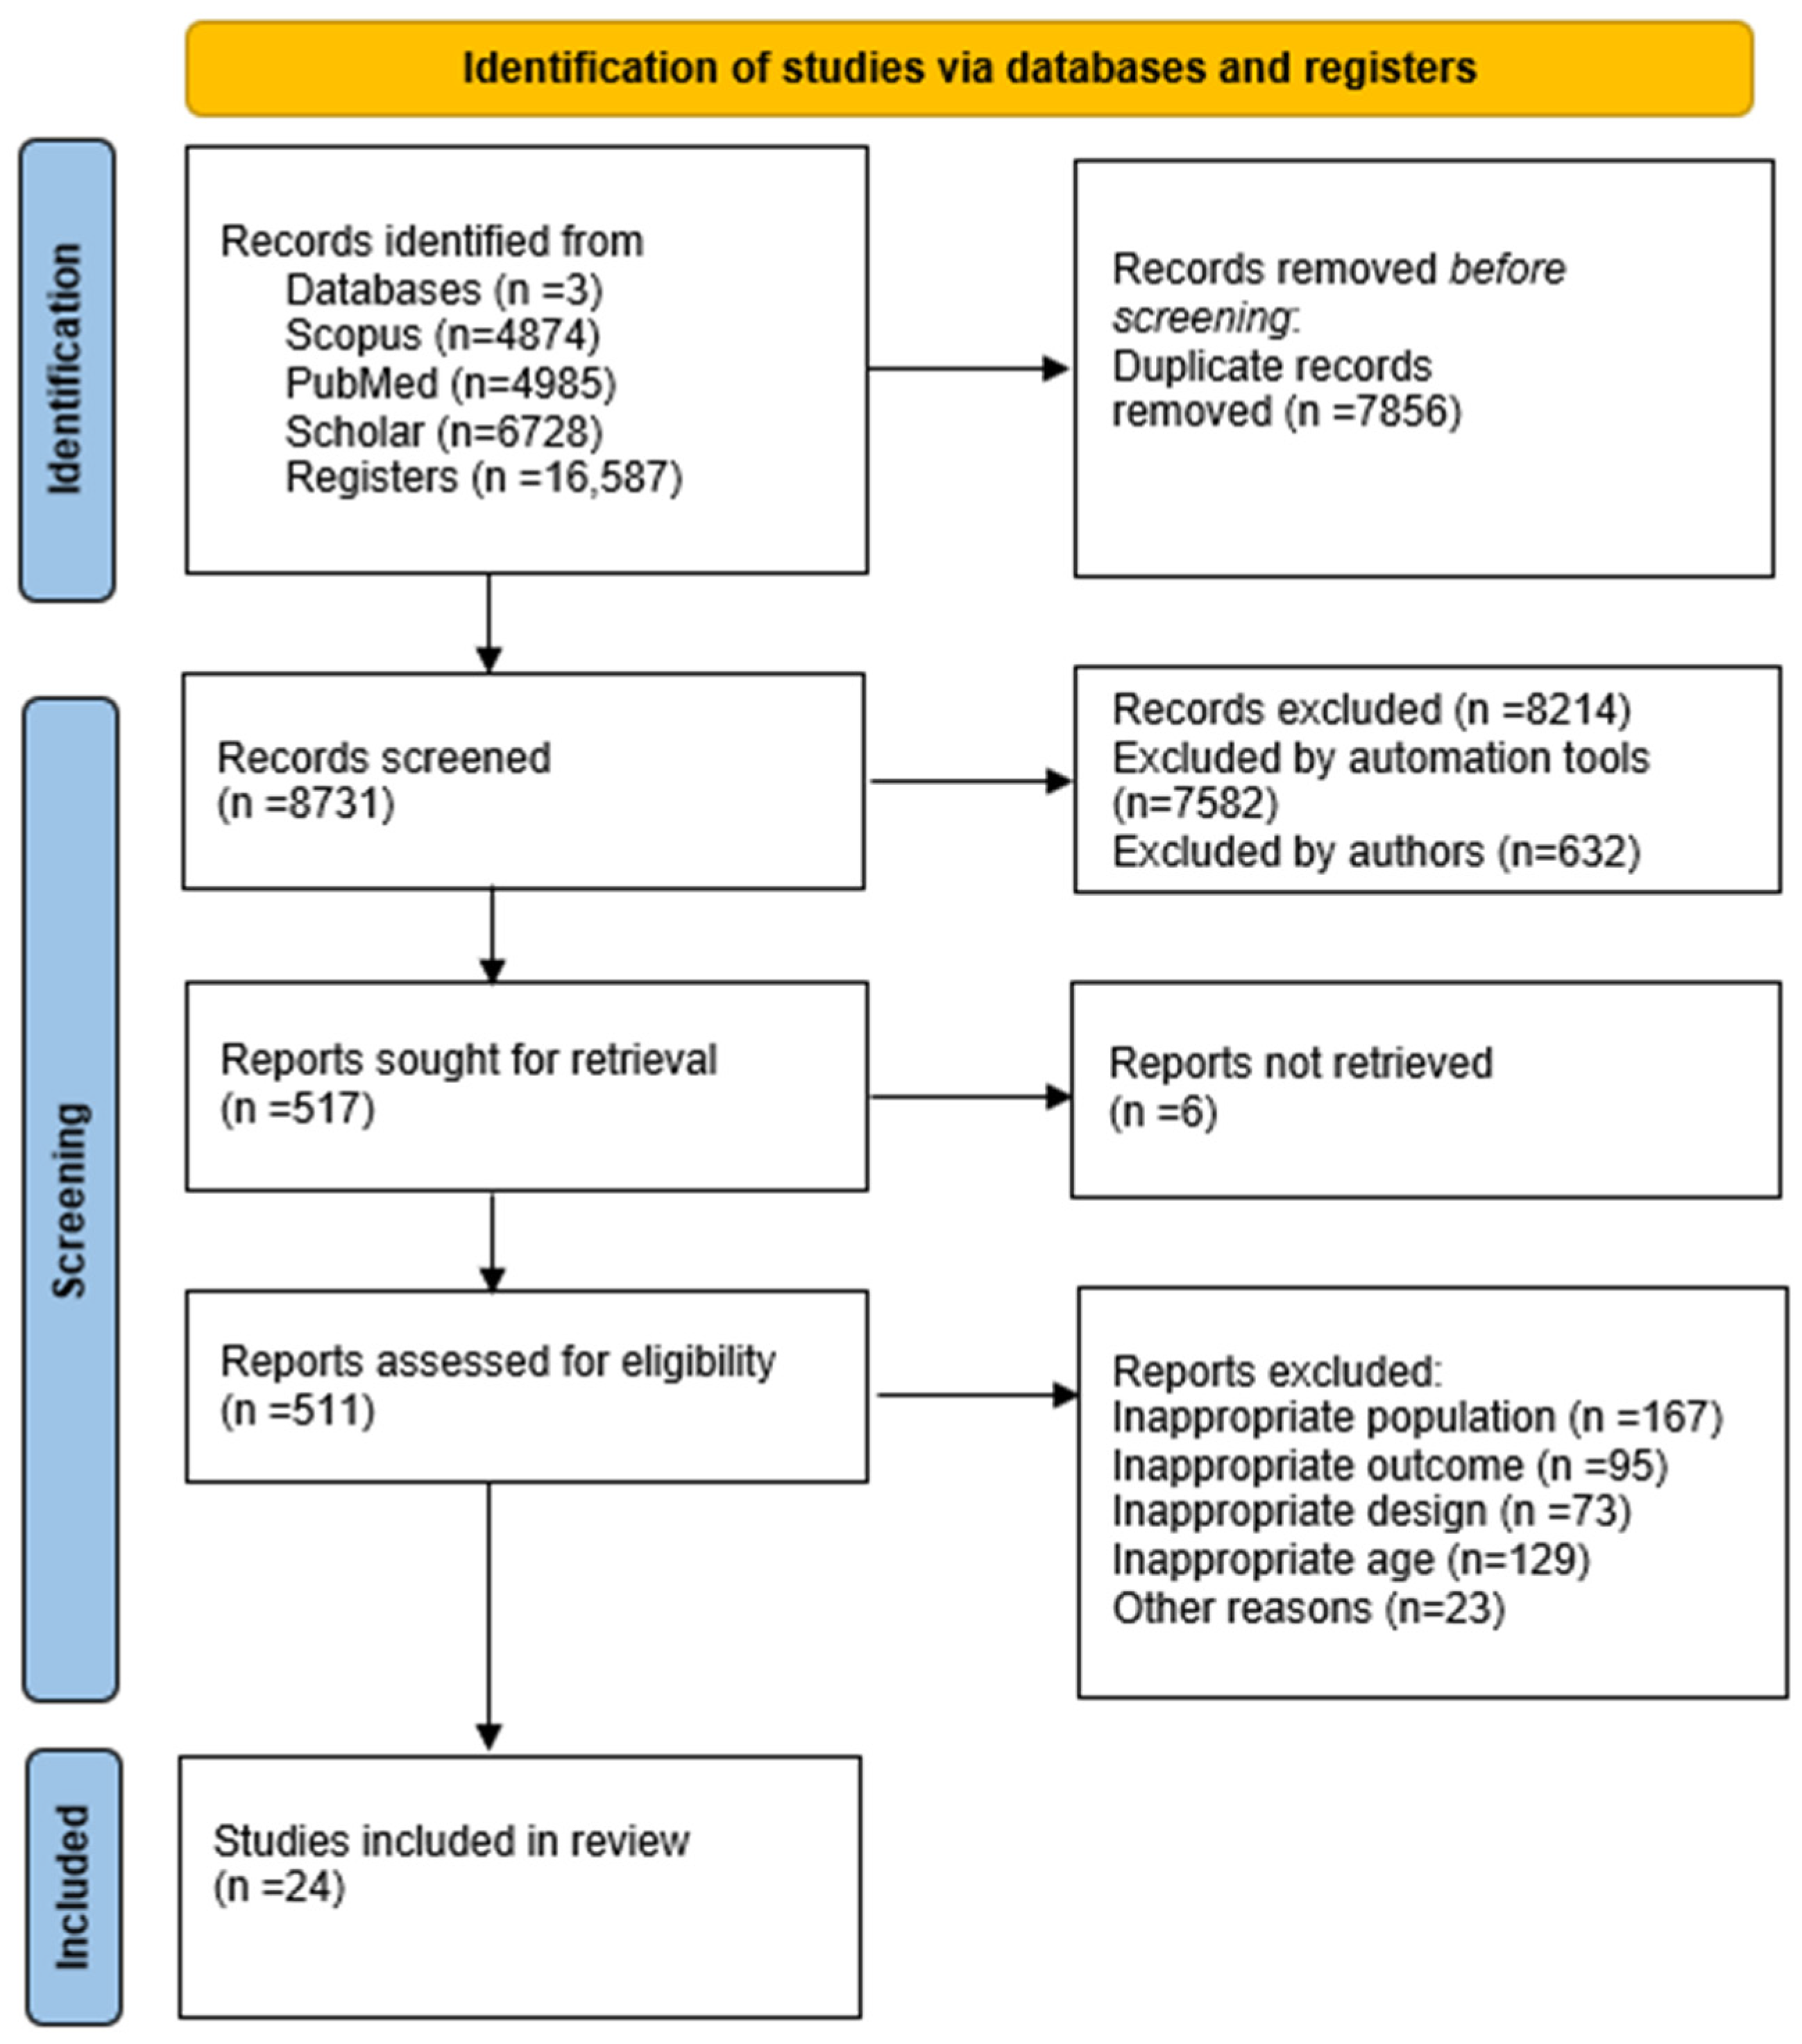
2. Materials and Methods
2.1. Search Strategy
2.2. Selection Procedure
- Sample Selection: We reviewed whether the studies clearly defined their inclusion and exclusion criteria plus whether they provided details on participant recruitment or not. Only the studies with well-defined populations and representative samples were considered in our systematic review as they are far more reliable.
- Measurement Methods: The assessment tools used to quantify total water intake (TWI) and total fluid intake (TFI) were closely evaluated. The studies employing validated dietary assessment methods, namely 24 h recalls, food frequency questionnaires (FFQs), or hydration-specific intake logs, were included, as they are considered methodologically valid. The studies relying on self-reported data without any form of further validation were noted as having a potential risk of measurement bias.
- Potential Confounders: We assessed whether the studies accounted for the key variables influencing hydration, such as physical activity levels, climate conditions, and dietary patterns. The studies that did not adjust for these factors were noted as having a higher risk of confounding bias.
- Data Completeness and Reporting: We examined whether the studies reported the key hydration outcomes (mean TWI/TFI values with standard deviations) and whether they had significant missing data. The studies that did not provide sufficient detail for data synthesis were excluded from the review.
2.3. Inclusions and Exclusions
2.4. Data Extraction
3. Results
3.1. TFI in Children by Gender
3.2. TFI in Adolescents by Gender
3.3. TWI in Children by Gender
3.4. TWI Adolescents by Gender
4. Discussion
4.1. Global Variations in Water Intake
4.2. Regional and Climate Variations
4.3. Impact of Sugar-Sweetened Beverages (SSBs)
4.4. Limitations
5. Conclusions
Author Contributions
Funding
Data Availability Statement
Conflicts of Interest
Abbreviations
| TFI | total fluid intake |
| TWI | total water intake |
| SSBs | sugar-sweetened beverages |
References
- Jéquier, E.; Constant, F. Water as an Essential Nutrient: The Physiological Basis of Hydration. Eur. J. Clin. Nutr. 2010, 64, 115–123. [Google Scholar] [CrossRef] [PubMed]
- EFSA Panel on Dietetic Products, Nutrition, and Allergies (NDA) Scientific Opinion on Dietary Reference Values for Water. EFS2 2010, 8, 1459. [CrossRef]
- Institute of Medicine. Dietary Reference Intakes for Water, Potassium, Sodium, Chloride, and Sulfate; The National Academies Press: Washington, DC, USA, 2005. [Google Scholar] [CrossRef]
- Third National Health and Nutrition Examination Survey (NHANES III), 1988–1994. Available online: https://wwwn.cdc.gov/nchs/nhanes/nhanes3/default.aspx (accessed on 25 May 2018).
- Kavouras, S.A.; Bougatsas, D.; Johnson, E.C.; Arnaoutis, G.; Tsipouridi, S.; Panagiotakos, D.B. Water Intake and Urinary Hydration Biomarkers in Children. Eur. J. Clin. Nutr. 2017, 71, 530–535. [Google Scholar] [CrossRef]
- Bottin, J.H.; Morin, C.; Guelinckx, I.; Perrier, E.T. Hydration in Children: What Do We Know and Why Does It Matter? Ann. Nutr. Metab. 2019, 74, 11–18. [Google Scholar] [CrossRef]
- Warren, J.; Guelinckx, I.; Livingstone, B.; Potischman, N.; Nelson, M.; Foster, E.; Holmes, B. Challenges in the Assessment of Total Fluid Intake in Children and Adolescents: A Discussion Paper. Eur. J. Nutr. 2018, 57, 43–51. [Google Scholar] [CrossRef]
- Özen, A.E.; Bibiloni, M.D.M.; Pons, A.; Tur, J.A. Fluid Intake from Beverages across Age Groups: A Systematic Review. J. Human. Nutrition Diet. 2015, 28, 417–442. [Google Scholar] [CrossRef] [PubMed]
- Martinez, H.; Guelinckx, I.; Salas-Salvadó, J.; Gandy, J.; Kavouras, S.A.; Moreno, L.A. Harmonized Cross-Sectional Surveys Focused on Fluid Intake in Children, Adolescents and Adults: The Liq.In7 Initiative. Ann. Nutr. Metab. 2016, 68, 12–18. [Google Scholar] [CrossRef]
- Page, M.J.; McKenzie, J.E.; Bossuyt, P.M.; Boutron, I.; Hoffmann, T.C.; Mulrow, C.D.; Shamseer, L.; Tetzlaff, J.M.; Akl, E.A.; Brennan, S.E.; et al. The PRISMA 2020 Statement: An Updated Guideline for Reporting Systematic Reviews. BMJ 2021, 372, n71. [Google Scholar] [CrossRef]
- Perales-García, A.; Ortega, R.M.; Urrialde, R.; López-Sobaler, A.M. Physical Activity and Sedentary Behavior Impacts on Dietary Water Intake and Hydration Status in Spanish Schoolchildren: A Cross-Sectional Study. PLoS ONE 2018, 13, e0208748. [Google Scholar] [CrossRef]
- Milla Tobarra, M.; Martínez-Vizcaíno, V.; Lahoz García, N.; García-Prieto, J.C.; Arias-Palencia, N.M.; Garcia-Hermoso, A. The Relationship between Beverage Intake and Weight Status in Children: The Cuenca Study. Nutr. Hosp. 2014, 30, 818–824. [Google Scholar] [CrossRef]
- Jomaa, L.; Hwalla, N.; Constant, F.; Naja, F.; Nasreddine, L. Water and Beverage Consumption among Children Aged 4–13 Years in Lebanon: Findings from a National Cross-Sectional Study. Nutrients 2016, 8, 554. [Google Scholar] [CrossRef]
- Laja García, A.I.; Moráis-Moreno, C.; Samaniego-Vaesken, M.d.L.; Puga, A.M.; Varela-Moreiras, G.; Partearroyo, T. Association between Hydration Status and Body Composition in Healthy Adolescents from Spain. Nutrients 2019, 11, 2692. [Google Scholar] [CrossRef] [PubMed]
- Vieux, F.; Maillot, M.; Constant, F.; Drewnowski, A. Water and Beverage Consumption among Children Aged 4–13 Years in France: Analyses of INCA 2 (Étude Individuelle Nationale Des Consommations Alimentaires 2006–2007) Data. Public Health Nutr. 2016, 19, 2305–2314. [Google Scholar] [CrossRef]
- Sui, Z.; Zheng, M.; Zhang, M.; Rangan, A. Water and Beverage Consumption: Analysis of the Australian 2011–2012 National Nutrition and Physical Activity Survey. Nutrients 2016, 8, 678. [Google Scholar] [CrossRef]
- Vieux, F.; Maillot, M.; Constant, F.; Drewnowski, A. Water and Beverage Consumption Patterns among 4 to 13-Year-Old Children in the United Kingdom. BMC Public Health 2017, 17, 479. [Google Scholar] [CrossRef] [PubMed]
- Lopez-Gonzalez, D.; Avila-Rosano, F.; Montiel-Ojeda, D.; Ortiz-Obregon, M.; Reyes-Delpech, P.; Diaz-Escobar, L.; Clark, P. Maternal Factors and Their Association with Patterns of Beverage Intake in Mexican Children and Adolescents. Children 2021, 8, 385. [Google Scholar] [CrossRef]
- Iglesia-Altaba, I.; Miguel-Berges, M.L.; Morin, C.; Moreno-Aznar, L.A. Fluid Intake Habits of Spanish Children and Adolescents: An Update of the Liq.In7 Survey. Ann. Nutr. Metab. 2021, 77, 10–11. [Google Scholar] [CrossRef]
- Nissensohn, M.; Sánchez-Villegas, A.; Ortega, R.; Aranceta-Bartrina, J.; Gil, Á.; González-Gross, M.; Varela-Moreiras, G.; Serra-Majem, L. Beverage Consumption Habits and Association with Total Water and Energy Intakes in the Spanish Population: Findings of the ANIBES Study. Nutrients 2016, 8, 232. [Google Scholar] [CrossRef] [PubMed]
- Montenegro-Bethancourt, G.; Vossenaar, M.; Doak, C.M.; Solomons, N.W. Total Daily Water Intake in Guatemalan Children. Food Nutr. Bull. 2009, 30, 340–350. [Google Scholar] [CrossRef]
- Kant, A.K.; Graubard, B.I. Contributors of Water Intake in US Children and Adolescents: Associations with Dietary and Meal Characteristics—National Health and Nutrition Examination Survey 2005–2006123. Am. J. Clin. Nutr. 2010, 92, 887–896. [Google Scholar] [CrossRef]
- Sichert-Hellert, W.; Kersting, M.; Manz, F. Fifteen Year Trends in Water Intake in German Children and Adolescents: Results of the DONALD Study. Acta Paediatr. 2001, 90, 732–737. [Google Scholar] [CrossRef] [PubMed]
- Tung, S.E.H.; Ch’ng, Y.Z.; Karnan, T.V.; Chong, P.N.; Zubaidah, J.O.; Chin, Y.S. Fluid Intake, Hydration Status and Its Association with Cognitive Function among Adolescents in Petaling Perdana, Selangor, Malaysia. Nutr. Res. Pract. 2020, 14, 490–500. [Google Scholar] [CrossRef]
- Zhang, N.; Morin, C.; Guelinckx, I.; Moreno, L.A.; Kavouras, S.A.; Gandy, J.; Martinez, H.; Salas-Salvadó, J.; Ma, G. Fluid Intake in Urban China: Results of the 2016 Liq.In 7 National Cross-Sectional Surveys. Eur. J. Nutr. 2018, 57, 77–88. [Google Scholar] [CrossRef]
- Bougatsas, D.; Arnaoutis, G.; Panagiotakos, D.B.; Seal, A.D.; Johnson, E.C.; Bottin, J.H.; Tsipouridi, S.; Kavouras, S.A. Fluid Consumption Pattern and Hydration among 8–14 Years-Old Children. Eur. J. Clin. Nutr. 2018, 72, 420–427. [Google Scholar] [CrossRef]
- Senterre, C.; Dramaix, M.; Thiébaut, I. Fluid Intake Survey among Schoolchildren in Belgium. BMC Public Health 2014, 14, 651. [Google Scholar] [CrossRef]
- Guelinckx, I.; Iglesia, I.; Bottin, J.H.; De Miguel-Etayo, P.; González-Gil, E.M.; Salas-Salvadó, J.; Kavouras, S.A.; Gandy, J.; Martinez, H.; Bardosono, S.; et al. Intake of Water and Beverages of Children and Adolescents in 13 Countries. Eur. J. Nutr. 2015, 54, 69–79. [Google Scholar] [CrossRef]
- Nachatar Singh, S.; Tung, S.; Maykanathan, D.; Lim, Y. The Association of the Hydration Status and Parental Knowledge on Fluid Consumption with Children’s Weight Status in Malaysia. Sri Lanka J. Child Health 2017, 46, 222. [Google Scholar] [CrossRef]
- Laksmi, P.W.; Morin, C.; Gandy, J.; Moreno, L.A.; Kavouras, S.A.; Martinez, H.; Salas-Salvadó, J.; Guelinckx, I. Fluid Intake of Children, Adolescents and Adults in Indonesia: Results of the 2016 Liq.In7 National Cross-Sectional Survey. Eur. J. Nutr. 2018, 57, 89–100. [Google Scholar] [CrossRef]
- Somuncu, B.P.; Topbaş, M.; Şahin, K.; Gündoğmuş, C.A.; Üstündağ, M.G.; Dilaver, İ.; Bostan, Y.E.; Çan, G. Water/Fluid Intake in Students and Influencing Factors. Cukurova Med. J. 2021, 46, 1267–1277. [Google Scholar]
- Lioret, S.; Dubuisson, C.; Dufour, A.; Touvier, M.; Calamassi-Tran, G.; Maire, B.; Volatier, J.-L.; Lafay, L. Trends in Food Intake in French Children from 1999 to 2007: Results from the INCA (Étude Individuelle Nationale Des Consommations Alimentaires) Dietary Surveys. Br. J. Nutr. 2010, 103, 585–601. [Google Scholar] [CrossRef]
- Bibiloni, M.; Özen, A.; Pons, A.; González-Gross, M.; Tur, J. Physical Activity and Beverage Consumption among Adolescents. Nutrients 2016, 8, 389. [Google Scholar] [CrossRef] [PubMed]
- Laja García, A.I.; Samaniego-Vaesken, M.D.L.; Partearroyo, T.; Varela-Moreiras, G. Adaptation and Validation of the Hydration Status Questionnaire in a Spanish Adolescent-Young Population: A Cross Sectional Study. Nutrients 2019, 11, 565. [Google Scholar] [CrossRef]
- McDermott, B.P.; Anderson, S.A.; Armstrong, L.E.; Casa, D.J.; Cheuvront, S.N.; Cooper, L.; Kenney, W.L.; O’Connor, F.G.; Roberts, W.O. National Athletic Trainers’ Association Position Statement: Fluid Replacement for the Physically Active. J. Athl. Train. 2017, 52, 877–895. [Google Scholar] [CrossRef]
- Armstrong, L.E.; Johnson, E.C. Water Intake, Water Balance, and the Elusive Daily Water Requirement. Nutrients 2018, 10, 1928. [Google Scholar] [CrossRef] [PubMed]
- Tani, Y.; Asakura, K.; Sasaki, S.; Hirota, N.; Notsu, A.; Todoriki, H.; Miura, A.; Fukui, M.; Date, C. The Influence of Season and Air Temperature on Water Intake by Food Groups in a Sample of Free-Living Japanese Adults. Eur. J. Clin. Nutr. 2015, 69, 907–913. [Google Scholar] [CrossRef] [PubMed]
- Bar-David, Y.; Urkin, J.; Landau, D.; Bar-David, Z.; Pilpel, D. Voluntary Dehydration among Elementary School Children Residing in a Hot Arid Environment. J. Hum. Nutr. Diet. 2009, 22, 455–460. [Google Scholar] [CrossRef]
- Kamin, T.; Koroušić Seljak, B.; Fidler Mis, N. Water Wins, Communication Matters: School-Based Intervention to Reduce Intake of Sugar-Sweetened Beverages and Increase Intake of Water. Nutrients 2022, 14, 1346. [Google Scholar] [CrossRef]

| Age Groups | Age | European Foods Safe Authority, 2010 mL/day | National Academy of Medicine, 2004 mL/day | ||
|---|---|---|---|---|---|
| Total Water Intake (TWI) 1 | Total Fluid Intake (TFI) 2 | Total Water Intake (TWI) 1 | Total Fluid Intake (TFI) 2 | ||
| Children (male) | 9–13 | 2100 | 1680 | 2400 | 1920 |
| Children (female) | 9–13 | 1900 | 1520 | 2100 | 1680 |
| Adolescents (male) | 14–18 | 2500 | 2000 | 3300 | 2640 |
| Adolescents (female) | 14–18 | 2000 | 1600 | 2300 | 1840 |
| Studies | Type of Article | Sample | Country | Hydration Outcome | Assessment Tool | Total Mean Score mL/day | |
|---|---|---|---|---|---|---|---|
| 1 | [24] | Cross-sectional | 230 Adolescents | Malaysia | TFI | 15-item beverage intake questionnaire | TFI 1854 ± 895 |
| 2 | [25] | Cross-sectional | 279 Children and 370 Adolescents | China | TFI | 7-day fluid-specific record (Liq.In7 record) | TFI children 966 ± 30; adolescents 1177 ± 31 |
| 3 | [26] | Cross-sectional | 210 Children | Greece | TFI | Fluid intake for 2 days | TFI 1771 ± 634 |
| 4 | [5] | Cross-sectional | 150 Children | Greece | TFI | Fluid intake for 2 days, 24 h urine collection | TFI Boys 1729 ±756; TFI Girls 1550 ± 573 |
| 5 | [28] | Cross-sectional | 3611 Children and 8109 Adolescents | Global | TFI | 7-day fluid record in school or online | Children TFI Boys 651 ± 535 Girls 661 ± 525; Adolescent TFI Boys 813 ± 600 Girls 740 ± 556 |
| 6 | [27] | Cross-sectional | 760 Children | Belgium | TFI | Total liquid intake during 7 consecutive days | TFI 809 (513–1089) |
| 7 | [29] | Cross-sectional | 207 Children | Malaysia | TFI | Questionnaire BEVQ-15 | TFI 1335 ± 550 |
| 8 | [30] | Cross-sectional | 388 Children and 478 adolescents | Indonesia | TFI | 7-day fluid-specific record | TFI 4–9 years 2165 ± 45; TFI 10–17 years 2488 ± 49 |
| 9 | [31] | Cross-sectional | 2710 Children and 1541 Adolescents | Turkey | TFI | Questionnaire | TFI 1611 ± 688 Children TFI 1603 ± 682; Adolescents TFI 1744 ± 710 |
| 10 | [32] | Cross-sectional | 907 Children and 566 Adolescents | France | TFI | Based on a 7 day food record | TFI 11–14 years 1883 ± 473, 15–17 years 1955 ± 595 |
| 11 | [33] | Cross-sectional | 1551 Adolescents | Spain | TFI | Two non-consecutive 24 h diet recalls period. | TFI 1004 |
| 12 | [13] | Cross-sectional | 358 Children | Lebanon | TWI | Questionnaire | TWI 1698 ± 17 9–13 years old |
| 13 | [14] | Cross-sectional | 372 Children | Spain | TWI | Questionnaire HSQ-AY | TWI Boys: 2649 (2217–3353); TWI Girls: 2509 (1924–3316) |
| 14 | [15] | Cross-sectional | 835 Children | France | TWI | 7-day food record | TWI 1324 (1295, 1353) |
| 15 | [16] | Cross-sectional | 563 Children and 517 Adolescents | Australia | TWI | Two days of dietary recall. | TWI Children 1700 ± 500 Adolescents 2100 ± 600 |
| 16 | [17] | Cross-sectional | 845 Children | UK | TWI | 4-day food records. | TWI 1338 ± 401 |
| 17 | [11] | Cross-sectional | 242 Children | Spain | TWI | 3 d weighed dietary records and 24 h urine collection | TWI 1412 ± 431 |
| 18 | [12] | Cross-sectional | 373 Children | Spain | TWI | Two 24 h recalls | TWI 1483 ± 507 |
| 19 | [18] | Cross-sectional | 588 Children and 417 Adolescents | Mexico | TWI | Two 24 h recall surveys and 12-month FFQ | TWI children 1605 ± 644; TWI adolescents 1922 ± 650 |
| 20 | [19] | Cross-sectional | 65 Children and 81 Adolescents | Spain | TWI | Liquid intake 7-day record (Liq.in7). | TWI children 1184 ± 67; TWI adolescents 1321 ± 68 |
| 21 | [20] | Cross-sectional | 212 Children and 210 Adolescents | Spain | TWI | three-day recording period | TWI children 1387 (41); TWI adolescents 1366 (46) |
| 22 | [21] | Cross-sectional | 449 Children | Guatemala | TWI | FFQ | TWI 1837 ± 484 |
| 23 | [22] | Cross-sectional | 1004 Children and 1997 Adolescents | USA | TWI | Complete and reliable 24 h dietary recall | All groups 1920 ± 36; TWI Children 1644 ± 39; TWI Adolescents 2397 ± 66 |
| 24 | [23] | Longitudinally | 1083 Children | Germany | TWI | 3 day Weighted dietary records | TWI 1784 ± 405 |
| TWI | ||||
|---|---|---|---|---|
| Children (8–14 year) | ||||
| Boys | Girls | |||
| EFSA 1 | IOM 1 | EFSA 1 | IOM 1 | |
| Adequate Intake (mL/day) | Adequate Intake (mL/day) | Adequate Intake (mL/day) | Adequate Intake (mL/day) | |
| 2100 mL/day | 2400 mL/day | 1900 mL/day | 2100 mL/day | |
| Studies | ||||
| [11] | 1465 ± 473 | 1465 ± 473 | 1357 ± 378 | 1357 ± 378 |
| [12] | 1443 ± 489 | 1443 ± 489 | 1520 ± 521 | 1520 ± 521 |
| [13] | 1739 ± 17 | 1739 ± 17 | 1554 ± 9 | 1554 ± 9 |
| [14] | 2649 (2217–3353) | 2649 (2217–3353) | 2509 (1924–3316) | 2509 (1924–3316) |
| [15] | 1506 (1443, 1570) | 1506 (1443, 1570) | 1313 (1249, 1377) | 1313 (1249, 1377) |
| [16] | 1700 ± 500 | 1700 ± 500 | 1300 ± 300 | 1300 ± 300 |
| [17] | 1359 ± 390 | 1359 ± 390 | 1316 ± 410 | 1316 ± 410 |
| [23] | 1891 ± 428 | 1891 ± 428 | 1676 ± 386 | 1676 ± 386 |
| [22] | 1880 (1730, 2030) | 1880 (1730, 2030) | 1790 (1640, 1940) | 1790 (1640, 1940) |
| [21] | 1845 ± 555 | 1845 ± 555 | 1919 ± 508 | 1919 ± 508 |
| [20] | 1440 ± 46 | 1440 ± 46 | 1334.55 ± 46.58 | 1334.55 ± 46.58 |
| [18] | 1831 ± 713 | 1831 ± 713 | 1768 ± 664 | 1768 ± 664 |
| [19] | 1220 ± 99 | 1220 ± 99 | 1133 ± 85 | 1133 ± 85 |
| Adolescents (14–18 year) | ||||
| Boys | Girls | |||
| EFSA 1 | IOM 1 | EFSA 1 | IOM 1 | |
| Adequate intake (mL/day) | Adequate intake (mL/day) | Adequate intake (mL/day) | Adequate intake (mL/day) | |
| 2500 mL/day | 3300 mL/day | 2000 mL/day | 2300 mL/day | |
| Studies | ||||
| [16] | 2100 ± 600 | 2100 ± 600 | 1700 ± 500 | 1700 ± 500 |
| [18] | 2032 ± 650 | 2032 ± 650 | 1812 ± 650 | 1812 ± 650 |
| [19] | 1294 ± 80 | 1294 ± 80 | 1374 ± 128 | 1374 ± 128 |
| [20] | 1398 ± 43 | 1398 ± 43 | 1236 ± 40 | 1236 ± 40 |
| [22] | 2890 (2650, 3130) | 2890 (2650, 3130) | 1970 (1840, 2100) | 1970 (1840, 2100) |
| TFI | ||||
|---|---|---|---|---|
| Children (8–14 year) | ||||
| Boys | Girls | |||
| EFSA 1 | IOM 1 | EFSA 1 | IOM 1 | |
| Adequate Intake (mL/day) | Adequate Intake (mL/day) | Adequate Intake (mL/day) | Adequate Intake (mL/day) | |
| 1680 mL/day | 1920 mL/day | 1520 mL/day | 1680 mL/day | |
| Studies | ||||
| [25] | 981 ± 38 | 981 ± 38 | 949 ± 47 | 949 ± 47 |
| [26] | 1870 ± 702 | 1870 ± 702 | 1673 ± 544 | 1673 ± 544 |
| [27] | 920 (671–1154) | 920 (671–1154) | 836 (606–1061) | 836 (606–1061) |
| [28] | 651 ± 535 | 651 ± 535 | 661 ± 525 | 661 ± 525 |
| [5] | 1729 ± 756 | 1729 ± 756 | 1550 ± 573 | 1550 ± 573 |
| [29] | 1338 ± 556 | 1338 ± 556 | 1283 ± 540 | 1283 ± 540 |
| [30] | 2169 ± 57 | 2169 ± 57 | 2159 ± 71 | 2159 ± 71 |
| [31] | 1658 ± 690 | 1658 ± 690 | 1560 ± 670 | 1560 ± 670 |
| [32] | 2019 ± 474 | 2019 ± 474 | 1746 ± 441 | 1746 ± 441 |
| Adolescents (14–18 year) | ||||
| Boys | Girls | |||
| EFSA 1 | IOM 1 | EFSA 1 | IOM 1 | |
| Adequate intake (mL/day) | Adequate intake (mL/day) | Adequate intake (mL/day) | Adequate intake (mL/day) | |
| 2000 mL/day | 2640 mL/day | 1600 mL/day | 1840 mL/day | |
| Studies | ||||
| [24] | 2149 ± 1070 | 2149 ± 1070 | 1680 ± 725 | 1680 ± 725 |
| [25] | 1240 ± 46 | 1240 ± 46 | 1113 ± 42 | 1113 ± 42 |
| [28] | 813 ± 600 | 813 ± 600 | 740 ± 556 | 740 ± 556 |
| [30] | 2499 ± 65 | 2499 ± 65 | 2472 ± 74 | 2472 ± 74 |
| [31] | 1854 ± 714 | 1854 ± 714 | 1654 ± 697 | 1654 ± 697 |
| [32] | 2150 ± 565 | 2150 ± 565 | 1769 ± 581 | 1769 ± 581 |
| [33] | 1004 ± 47 | 1004 ± 47 | 1004 ± 29 | 1004 ± 29 |
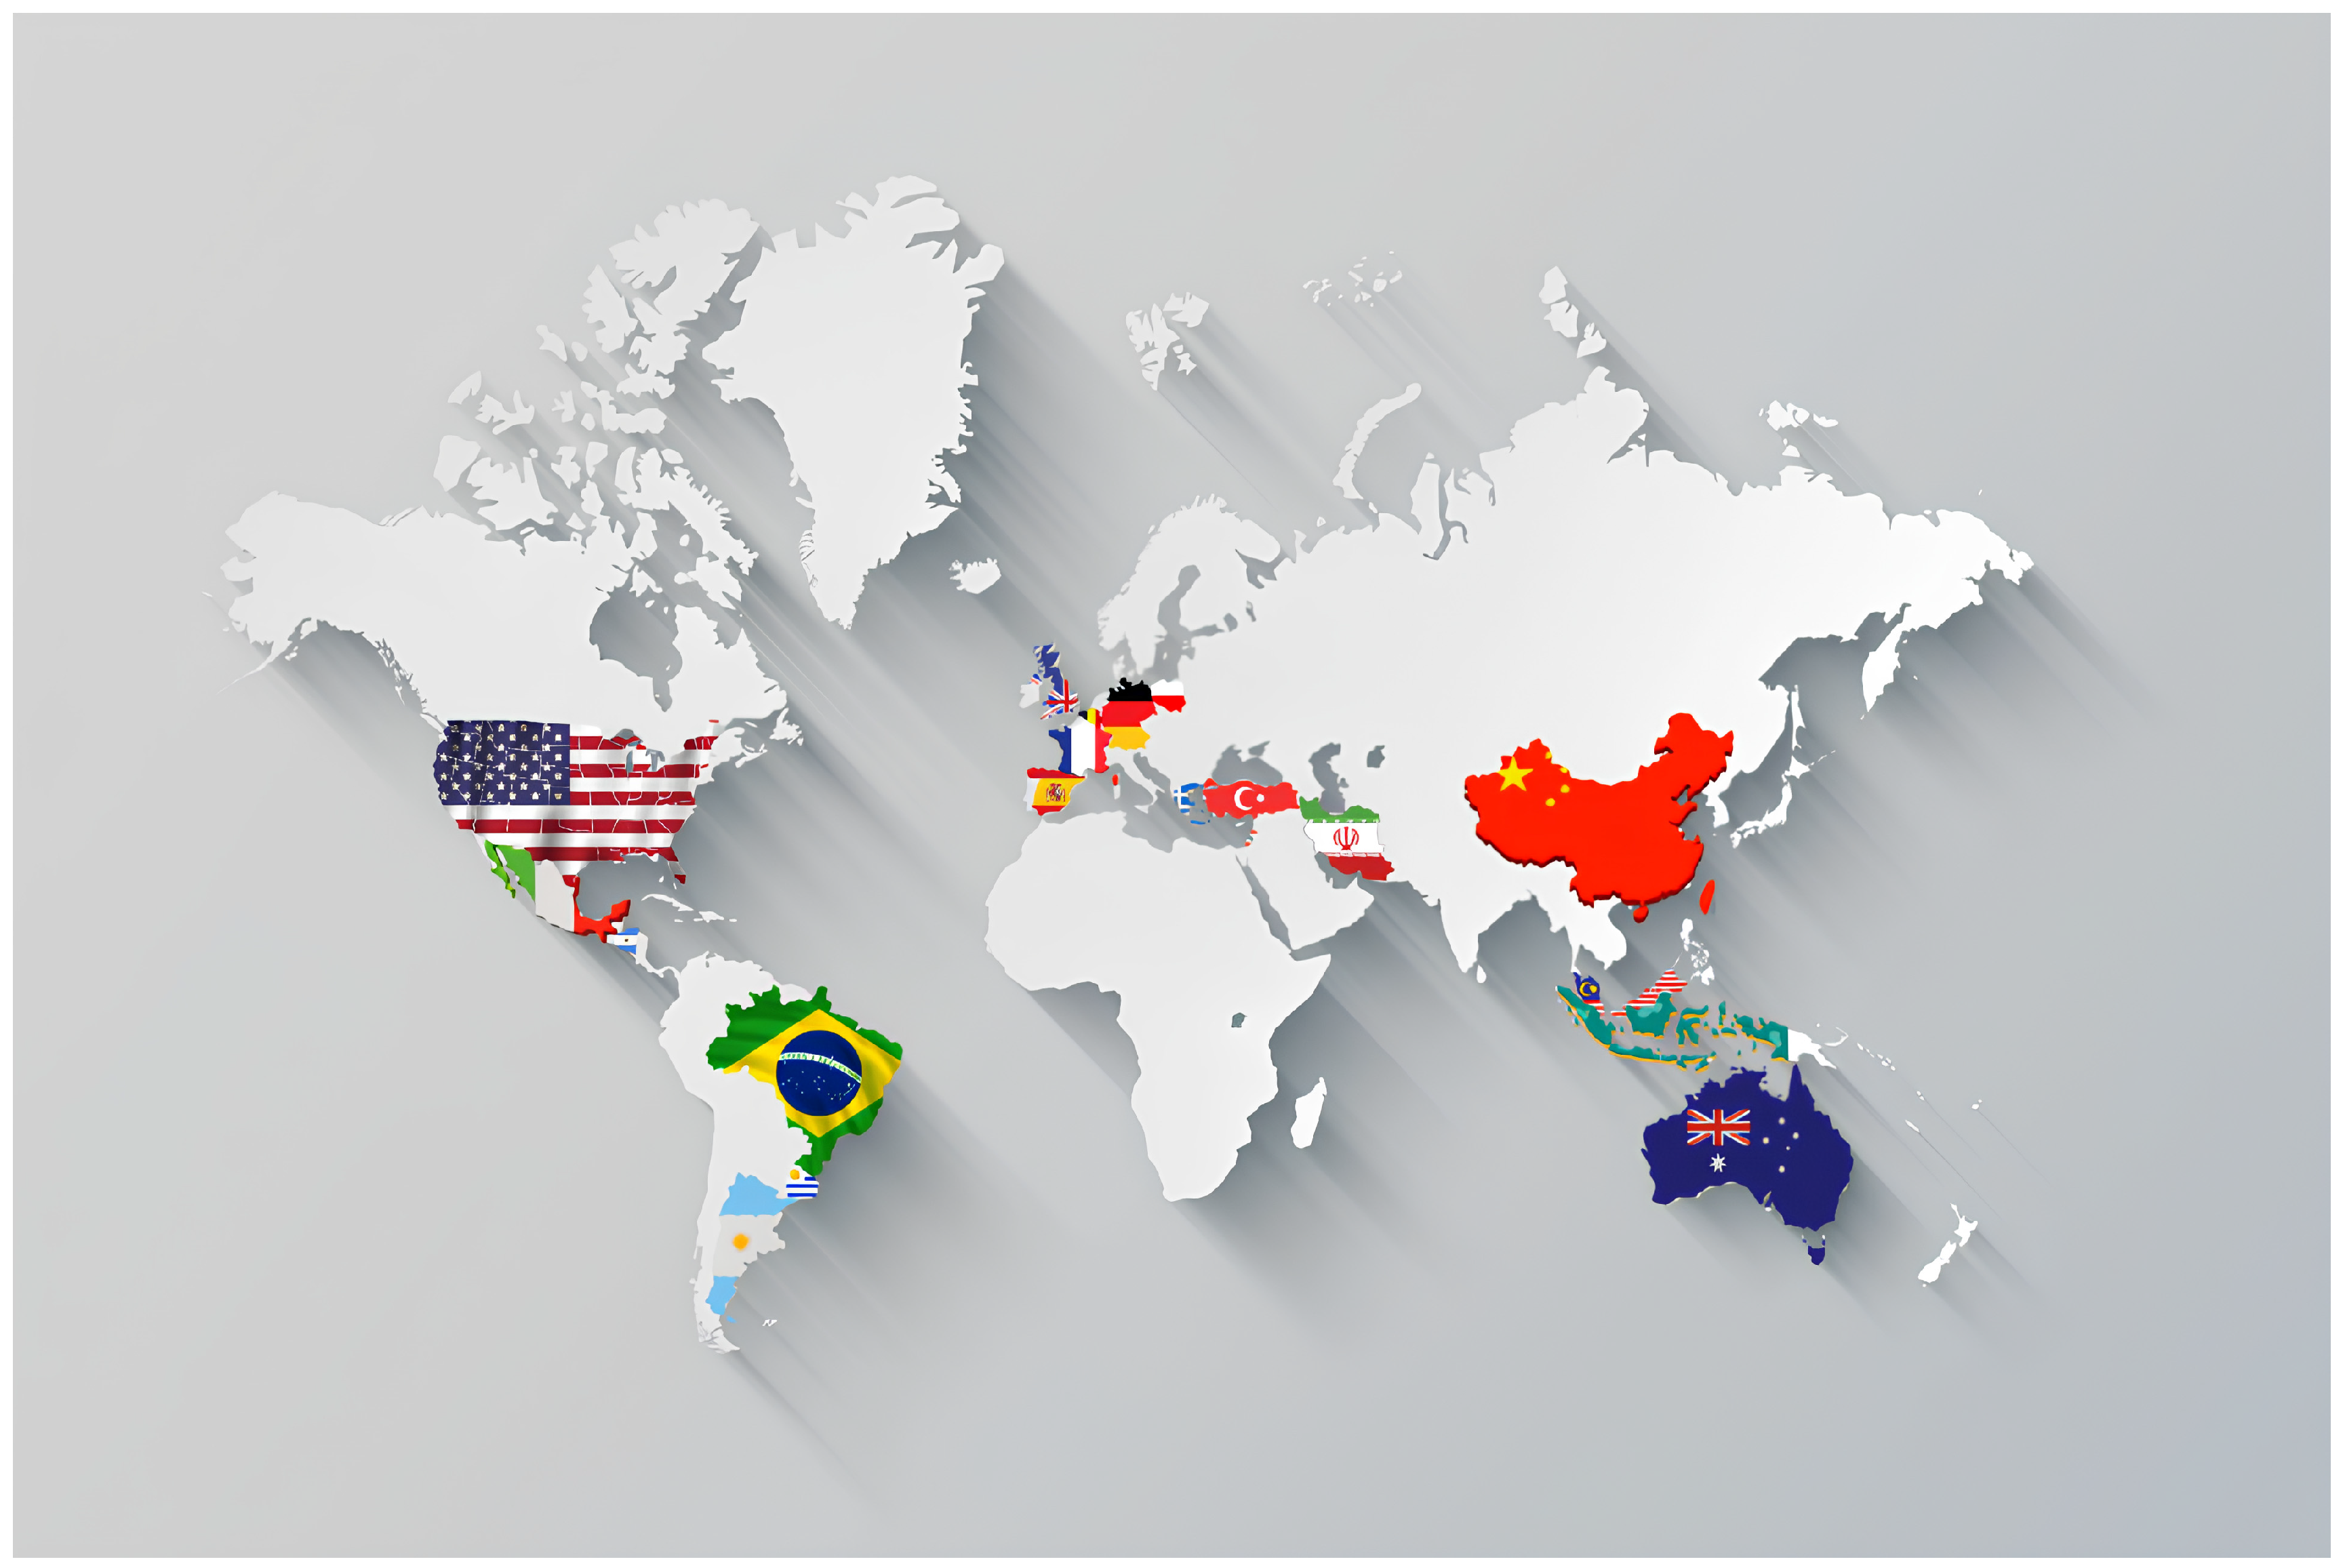
| Country | (N) (%) |
|---|---|
| Europe | 13(56%) |
| South America | 1(4%) |
| North America | 2(8%) |
| Australia | 1 (4%) |
| Asia | 6 (24%) |
| Global | 1 (4%) |
| Group age | |
| Children 9–13 year boys | 8138 (50%) |
| Children 9–13 year girls | 8116 (50%) |
| Total Children | 16,254 (100%) |
| Adolescents 14–18 year boys | 7518 (49%) |
| Adolescents 14–18 year girls | 7849 (51%) |
| Total adolescents | 15,367 (100%) |
| Publication year | |
| 2004–2014 | 6 (25%) |
| 2014–2024 | 18 (75%) |
| Number of participants | |
| TWI children | 7032 (23%) |
| TWI adolescents | 2522 (8%) |
| TFI children | 9222 (29%) |
| TFI adolescents | 12,845 (40%) |
| Total children and adolescents | 31,621 (100%) |
Disclaimer/Publisher’s Note: The statements, opinions and data contained in all publications are solely those of the individual author(s) and contributor(s) and not of MDPI and/or the editor(s). MDPI and/or the editor(s) disclaim responsibility for any injury to people or property resulting from any ideas, methods, instructions or products referred to in the content. |
© 2025 by the authors. Licensee MDPI, Basel, Switzerland. This article is an open access article distributed under the terms and conditions of the Creative Commons Attribution (CC BY) license (https://creativecommons.org/licenses/by/4.0/).
Share and Cite
Papaoikonomou, G.; Apergi, K.; Malisova, O. Total Water Intake and Total Fluid Intake Worldwide: A Systematic Literature Review in Children and Adolescents. Beverages 2025, 11, 46. https://doi.org/10.3390/beverages11020046
Papaoikonomou G, Apergi K, Malisova O. Total Water Intake and Total Fluid Intake Worldwide: A Systematic Literature Review in Children and Adolescents. Beverages. 2025; 11(2):46. https://doi.org/10.3390/beverages11020046
Chicago/Turabian StylePapaoikonomou, Georgios, Kyriaki Apergi, and Olga Malisova. 2025. "Total Water Intake and Total Fluid Intake Worldwide: A Systematic Literature Review in Children and Adolescents" Beverages 11, no. 2: 46. https://doi.org/10.3390/beverages11020046
APA StylePapaoikonomou, G., Apergi, K., & Malisova, O. (2025). Total Water Intake and Total Fluid Intake Worldwide: A Systematic Literature Review in Children and Adolescents. Beverages, 11(2), 46. https://doi.org/10.3390/beverages11020046