1. Introduction
Caffeine is found in a variety of food, beverages, and supplements, with energy drinks, noted for their high caffeine content, gaining ever-increasing popularity, particularly among young adults. This increase in popularity stems from their marketing as energy-boosters to improve physical endurance or to lessen fatigue for those who might work long hours. However, along with all the benefits of caffeine, there are significant consequences of a high caffeine intake, such as an increase in anxiety, insomnia, increased irritability, digestive issues, and increased blood pressure [
1,
2,
3,
4,
5].
Several studies have demonstrated the increase in the popularity of energy drinks [
6,
7,
8,
9,
10,
11,
12]. A large study conducted in the USA assessed the dietary data from 2003 to 2016 from National Health and Nutrition Examination surveys [
13]. The survey found an increase in energy drink consumption from 2003 to 2016 for adolescents aged 12 to 19 and young adults aged 20 to 39. The prevalence of energy drink consumption calculated from this study was 0.2% to 1.4% for adolescents and 0.5% to 5.5% for young adults [
13]. Energy drink consumption is increasing among the Australian population, with the daily per capita volumes of energy drinks increasing from 8.2 mL in 2018–2019 to 12.0 mL in the period 2022–2023 [
14].
The energy drink industry is growing, with many new brands becoming available to the consumer and each brand having a range of products varying in terms of caffeine content. Some of the major brands of energy drinks include Mother Energy, V Red Bull and Monster Energy. Popular brands of cola drinks include Coca-Cola and Pepsi cola. Currently, not all products containing caffeine are labelled with accurate caffeine content information due to a lack of regulation by the U.S Food and Drug Administration (FDA) [
15]. This lack of regulation of caffeine content fails to protect the consumer, particularly those who are monitoring their caffeine intake due to health risks. The current regulation of caffeine by the FDA is that only added caffeine is to be labelled, and not the total amount of caffeine found in the product [
15]. Cola-type drinks are required to label that they contain caffeine, but the label does not have to include the amount of caffeine [
15]. The regulation of caffeine-containing products by the Food Standards Australia and New Zealand (FSANZ) is similar to that of the FDA. However, they limit the amount of caffeine found in cola drinks to 145 mg per kg, and for energy drinks the limit is 320 mg per litre [
16]. Energy drinks also require an additional label by the FSANZ detailing they are not suitable for children, pregnant or lactating women, or for those sensitive to caffeine [
16]. The European Union requires all drinks that contain over 150 mg/l of caffeine to have an additional label stating they have a high caffeine content and are not recommended for children or pregnant or breast-feeding women [
17]. To improve the regulation of caffeine in food and beverages, there is a need for efficient and accurate caffeine quantification, which analytical chemistry techniques such as HPLC can provide.
HPLC can allow for the accurate testing of caffeine content in caffeinated products. Several studies have been reported that use HPLC for the analysis of caffeine in energy drinks, but given the vast rise in the popularity of energy drinks, there is an ever-increasing demand for timely analyses to facilitate high sample throughput [
18,
19,
20,
21,
22,
23,
24]. Hence, methods of analysis need to be developed that are both rapid and accurate.
Recent developments and commercial introductions in column technology in HPLC have led to the design of column outlet fittings that segment the flow of the mobile phase and solute as it exits the column [
25]. Specifically, the radial central flow portion of the mobile phase is isolated from the peripheral wall region. This process of flow segmentation has been termed ‘radial flow stream splitting’ (RFS) [
26,
27,
28]. The RFS HPLC column provides the advantage of a higher separation efficiency since the stationary phase bed/packing structure in chromatography columns is heterogeneous in density. Generally, the more homogeneous portion of the bed is in the radial central region of the bed, with heterogeneity developing as the wall region is approached. This is the case whether the column is packed with particles or is formed from a monolithic structure. So, the separation of flow between the radial central section of the column and the wall region of the column yields a higher performance, and only the flow from the radial central region of the column is sent to the detection source. An added advantage of the RFS HPLC column is that, as a consequence of the dual outlet of flow, the operational pressure of the column is reduced; hence, higher speeds of analysis are possible, which can benefit routine high sample throughput laboratories.
The aim of this study was to demonstrate rapid HPLC < 5800 psi (400 bar) assays using commercially available HPLC columns to facilitate high sample throughput assays for the quantification of caffeine in energy drinks. As the RFS column was only recently made available to purchase, we included a conventional HPLC column comparison, with the only difference being the column’s end fitting. Both HPLC quantification methods aimed to provide a caffeine sample analysis in under 20 s, comparing the measured content to the food label claims. Both methods were assessed chromatographically and compared with respect to the HPLC assay’s pressure, performance, and precision. The HPLC assays’ quantification results involved ten different caffeinated beverages, including eight energy drinks and two cola soft drinks, and compared the caffeine content to that stated on the beverage’s food label. In cases where no content was provided, the USDA-reported levels were used for cola drinks. The aim of the quantification results is to highlight the need for stricter regulations on the caffeine content that is actually present in each of the beverages.
2. Materials and Methods
2.1. Chemicals
Mobile phases were prepared from HPLC-grade acetonitrile, HPLC-grade methanol and Milli-Q water. HPLC-grade acetonitrile and methanol were obtained from Fisher Chemicals (Loughborough, UK). Milli-Q water was prepared in-house (18.2 MΩ cm). Caffeine was purchased from Sigma-Aldrich (Castle Hill, NSW, Australia).
2.2. Samples
The energy/cola drinks that were tested include the following, Coca-Cola, Pepsi Big Can, Plus Hemp Energy Guarana flavour, Monster Energy Pipeline Punch, Monster Energy Ultra Gold, V Blue, V Refresher, Mother Energy Original, Red Bull Green edition and Red Bull Purple edition. These were purchased from the local market. Note that, within the manuscript, when quantitative information is presented with respect to any of the energy drinks, we deidentify each energy drink by referring to them as E1 to E10. We do not, however, deidentify the energy drinks when qualitative information is presented.
2.3. Equipment
All samples were analysed using an Agilent (Forest Hill, Victoria, Australia) UHPLC system consisting of a 1260 auto injector, a 1290 binary pump, and a 1290 diode array detector.
The column used for this study was a high-resolution silica-based C18 monolithic column (25 × 4.6 mm) from Merck fitted with a custom RFS end-fitting provided by Chromaspeed Pty Ltd. (Tonsley, Australia). These fittings are now commercially available.
2.4. Calibration Curve and Sample Testing Method
2.4.1. Standards
Calibration standards were prepared from a caffeine stock solution. The caffeine standards ranged in concentration from 0.5 ppm to 500 ppm. A calibration curve was produced in both conventional and RFS modes.
2.4.2. Samples Preparation
Each beverage was degassed in an ultrasonic bath prior to use and diluted in a ratio of 1 to 4 (quantitatively) with Milli-Q water, with no filtering prior to analysis.
Calibration standards and samples were tested in both RFS and conventional mode. All assays (samples and standards) were tested via triplicate injection in both conventional and RFS modes of operation. The injection sequence for a quantitative analysis of the caffeine, in all cases, was as follows: blank (water); Std (20 ppm); Std (100 ppm); sample 1; sample 2; sample 3; sample 4; sample 5; Std (20 ppm); Std (100 ppm); sample 6; sample 7; sample 8; sample 9; sample 10; Std (20 ppm); Std (100 ppm); blank. Quantification was based on the averaged response factor of each standard that bracketed each set of samples, i.e., 1 to 5, and then separately, 6 to 10. The calibration curve was used to test the linearity of the detector. All samples and standards fell within the linear range.
2.4.3. HPLC Analysis
All assays (samples and standards) were established in gradient elution mode. The flow rate of the mobile phase was set so that the column operated at near-maximum pressure (3200 p.s.i.)—a primary focus was the speed of the analysis and the subsequent performance metrics that were obtained. Since the RFS mode functions at a lower pressure than the conventional mode, the flow rate in the RFS assays was higher than that in the conventional mode. Subsequently, the duration of the gradient was adjusted so that the rate of change in the composition of the mobile phase was equal (volumetrically) for both modes of operation. Specifically, in the conventional HPLC mode, the initial conditions were 90/10 water (0.1% formic acid)/acetonitrile (0.1% formic acid), followed by a gradient running to 40/60 water (0.1% formic acid)/acetonitrile (0.1% formic acid) at 0.47 min with a flow rate of 4.2 mL/min. In RFS mode, the initial conditions were 90/10 water (0.1% formic acid)/acetonitrile (0.1% formic acid), with a gradient running to 40/60 water (0.1% formic acid)/acetonitrile (0.1% formic acid) at 0.40 min with a flow rate of 5.0 mL/min. Prior to repeat injections, the column was re-equilibrated with the initial mobile phase. The exact period for this re-equilibration was unimportant since the injection/needle-washing process was far greater than the period of time required to equilibrate the column. The injection volume was 5 µL and detection was set to 254 nm.
The RFS mode of operation was conducted with a 30% flow segmentation ratio—that is, 30% of the flow was directed to the detector originating from the central flow stream exit port of the dual-port end-fitting. Trials were also undertaken using a 15% RFS mode, but the outcomes were not as good as when the flow segmentation ratio was set to 30% and data from the 15% mode of operation presented limited significance.
2.5. Column Efficiency
Prior to the analysis of the energy drink samples, the column performance in both the conventional and RFS modes of operation was tested. Standard HETP tests were undertaken using a 30/70 water/methanol mobile phase at a variety of flow rates (0.4 to 5 mL/min). The test sample was naphthalene at a concentration of 1 mg/mL. The injection volume was 2 µL and detection was set to 254 nm.
2.6. Data Collection and Analysis
Microsoft® Excel (2024) was used for data collection and statistical analysis. The graphs were produced in OriginPro 8.5 by Origin labs.
3. Results and Discussion
3.1. Preliminary Study
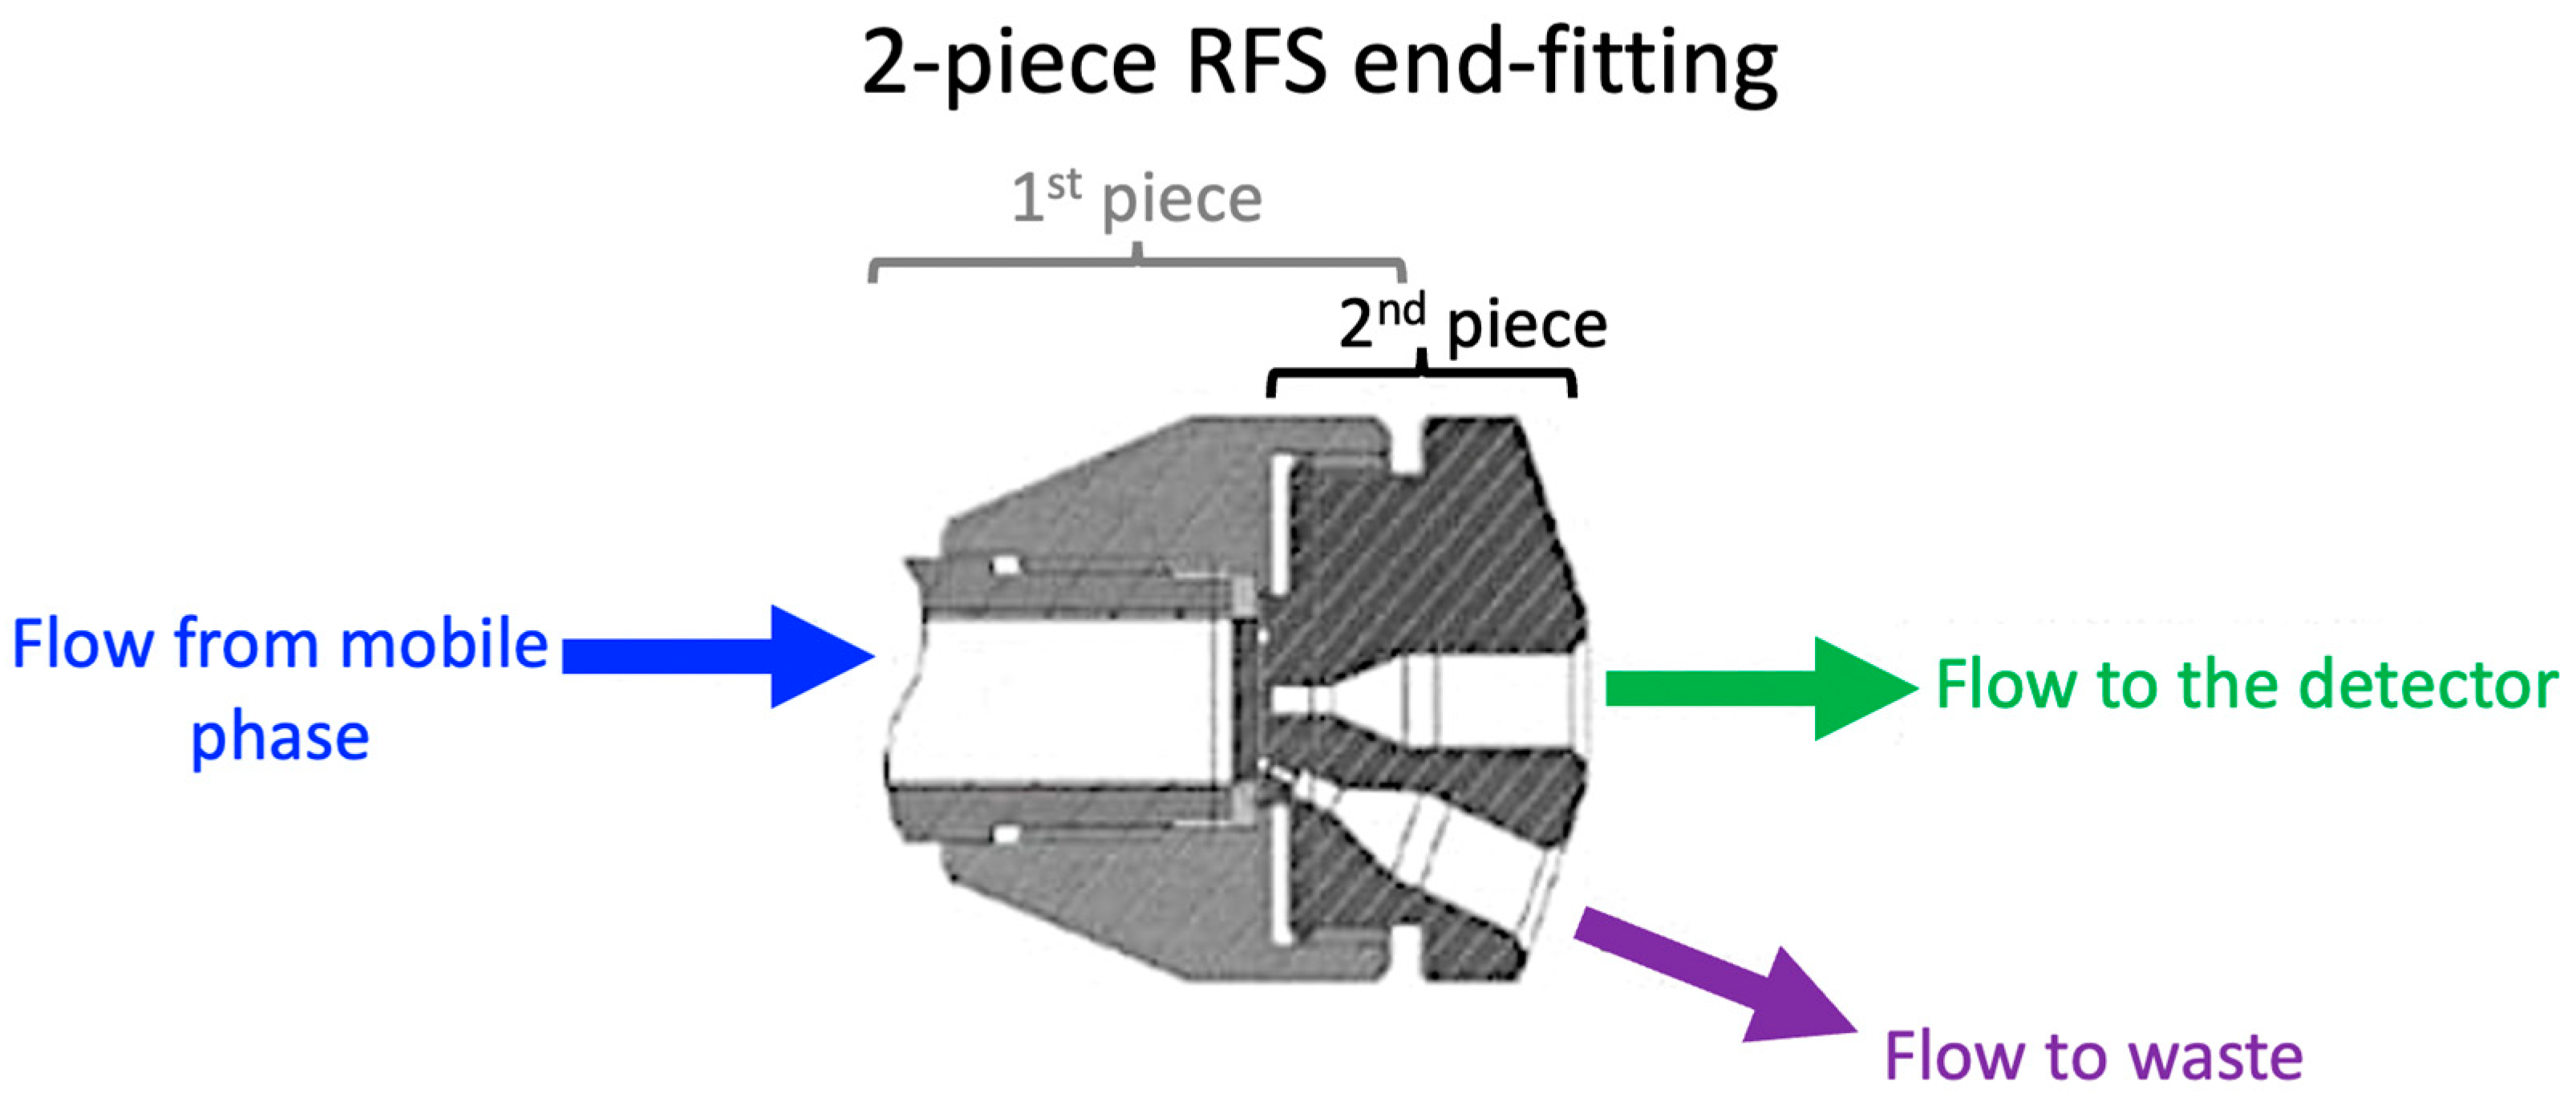
The aim of the preliminary study conducted was to compare the column performance and pressure at specific velocities/flow rates for the HPLC column with and without the RFS end-fitting used in this study. The conventional column was a silica-based monolith HPLC column known for providing a higher-speed analysis at lower backpressures that has been commercially available for over 20 years [
29,
30]. The radial flow splitting (RFS) column was created by using the recently commercialised column technology two-piece end-fitting design, as illustrated in
Figure 1. The RFS was fitted on the conventional column retrospectively in order to demonstrate the improvements in the method when using the RFS column technology.
3.1.1. Conventional and RFS Column Performance
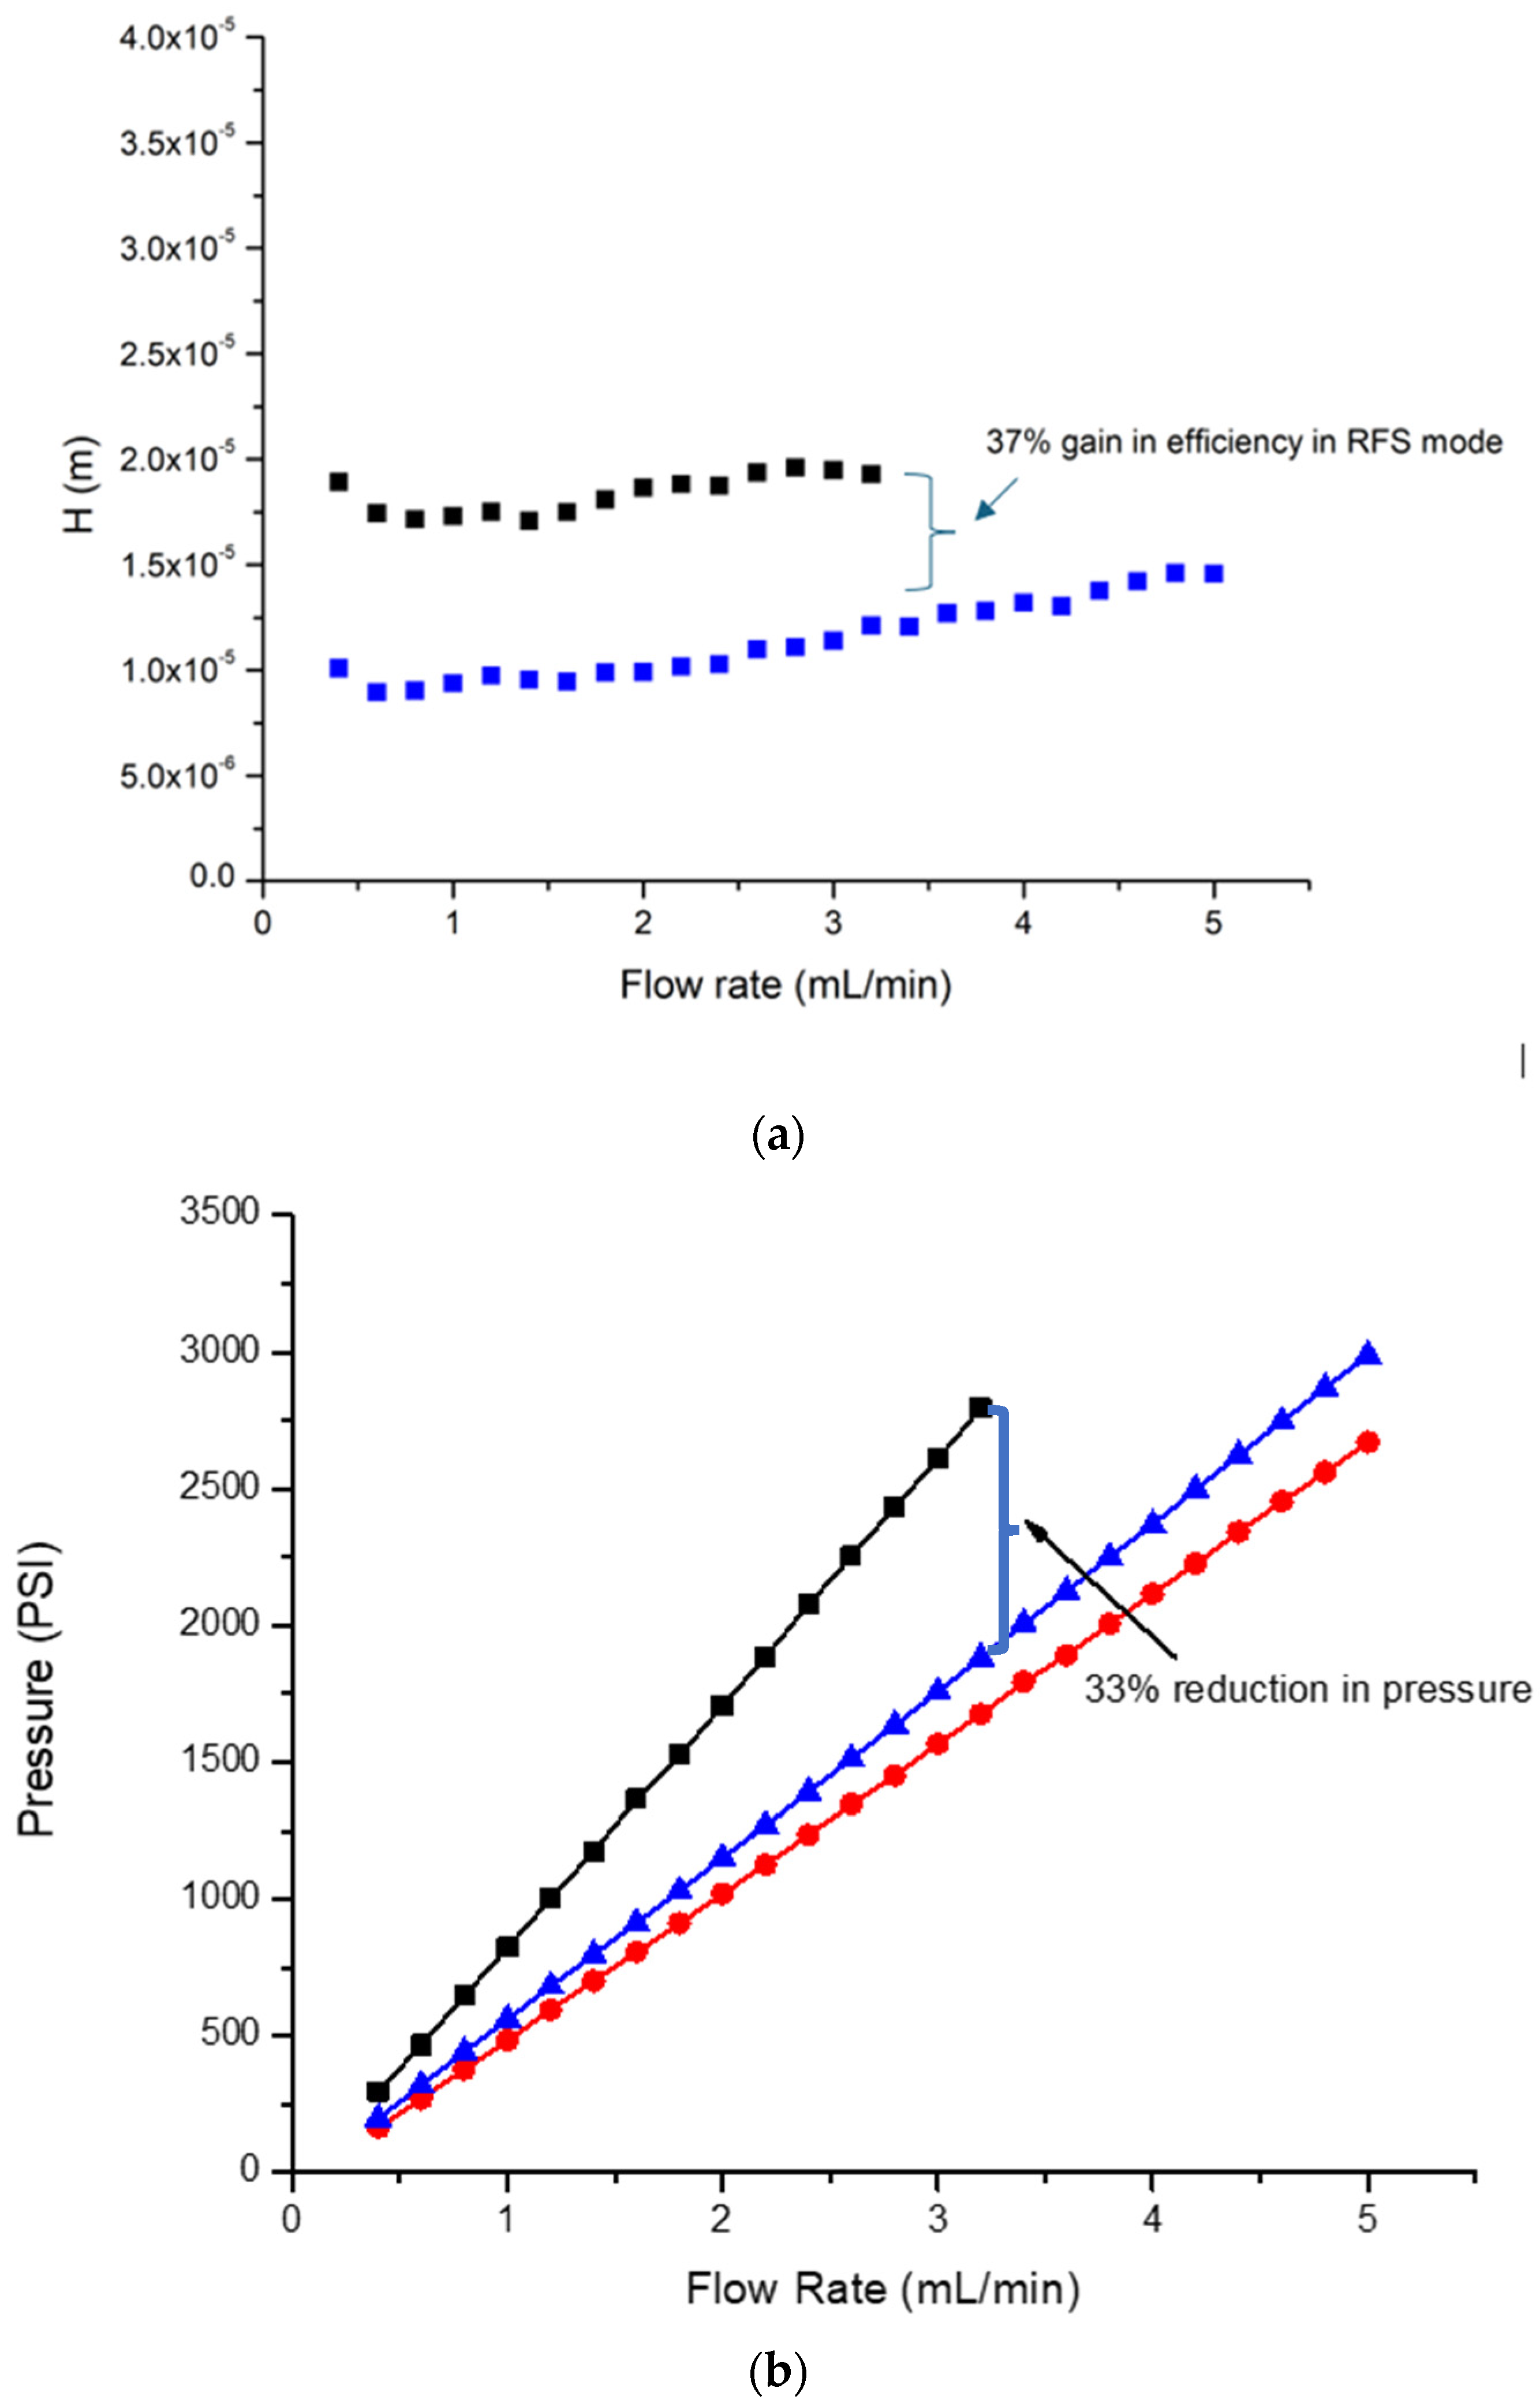
The information presented in
Figure 2a represents the Height Equivalent to a Theoretical Plate (HETP) (a measure of column efficiency), plotted as a function of mobile phase flow rate. The efficiency of the column in RFS mode was about 37% higher than the conventional mode of operation at the flow rate of maximum pressure during a conventional mode of operation (3.2 mL/min). Such a gain in efficiency is important as these assays were undertaken with a high-throughput mode of operation utilising a column of short bed length, which hence reduced separation capacity. The gain in performance of 37% in RFS mode was subsequently important for peak capacity.
Notably, the highest gain in efficiency was seen at the flow rate of 0.6 mL/min, with a gain of 49%. In prior published work, undertaken on 100 mm length monoliths, a gain in separation performance of 64% was reported [
31]. No doubt, some of the loss in these gains is associated with the extra column dead volume of the system, which becomes more significant as the peak volume decreases and is hence more important when using shorter columns than longer ones. This is also the reason why efficiency gains were not observed at a 15% segmentation ratio: the peak volume was too small for the HPLC system architecture.
3.1.2. Conventional and RFS Column Operational Pressure
Figure 2b details the pressure/flow rate relationship during operation in conventional and RFS modes. Two RFS modes were tested with segmentation ratios of 30% and 15% of the mobile phase eluting from the radial central exit port. In all cases, the increase in pressure as a function of the flow rate was linear, with the RFS (30% segmentation ratio) operating at 33% lower pressure than the conventional mode, and the RFS (15% segmentation ratio) operating at 37% lower pressure than the conventional mode. A similar reduction in pressure in the RFS modes of operation on HPLC monolithic columns was reported previously [
31]. As a consequence of the reduced operational pressures, the assays undertaken in RFS modes were performed at higher flow rates; hence faster speeds were used, consistent with operation at near maximum pressure.
3.2. Caffeine Calibration Curves
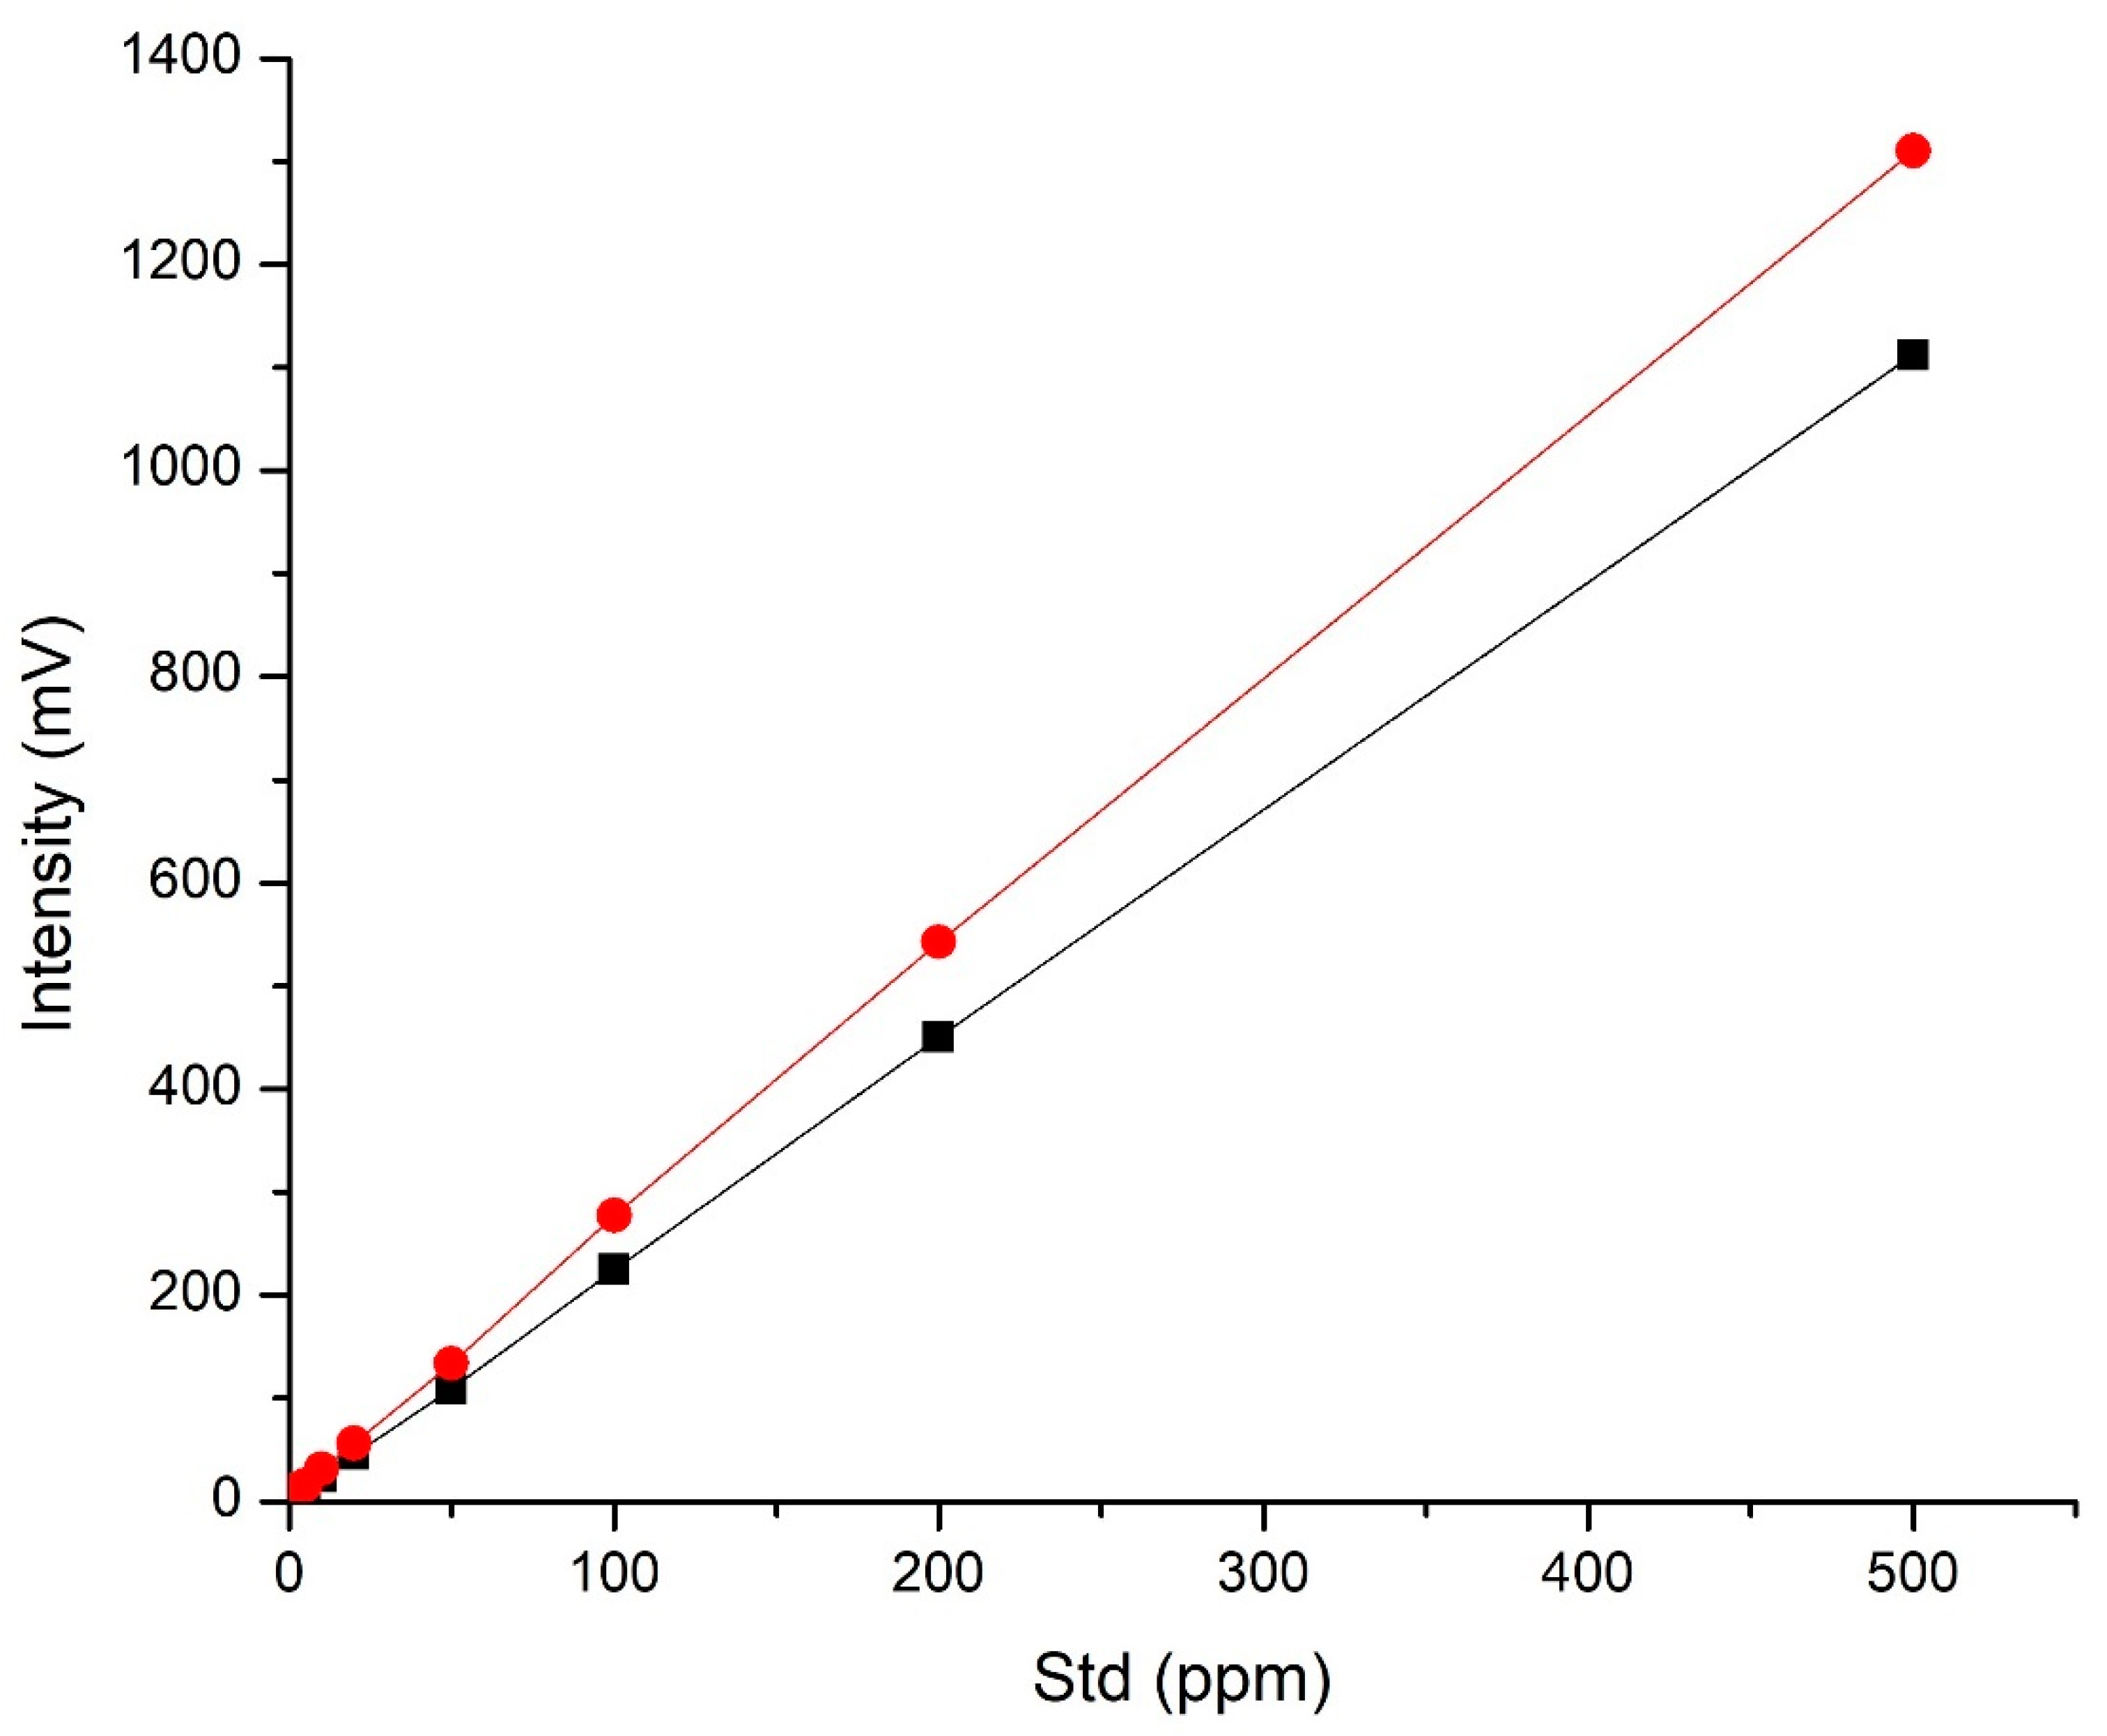
The plots in
Figure 3 illustrate the linear dynamic range and sensitivity of the caffeine assay using the column in conventional and RFS mode; the values are also listed in the
Supplementary Information, Table S1. In both cases, the calibration curves were linear with the R
2 values of >0.999 for both RFS and conventional columns. The column in RFS mode demonstrated a sensitivity increase of up to one-third compared to the column in conventional mode, above the concentration levels of 10 ppm (
Table S1). Such an outcome might appear contrary to the concept of flow stream splitting, with 70% of the sample not being directed to the detection source; however, the reason for the sensitivity increases is because the 30% of the flow that is sent to the detector is the most homogenous region of the elution band, which means the sample is not diluted by the diffuse tailing portion of the band as it passes through the detector, as is the case in the conventionally run column. The sensitivity observed when the column was run in the RFS mode of operation, set at 15% of the flow from the radial central exit port, was approximately the same as that of the conventionally run column. It was partly for this reason that further studies using the RFS at the 15% mode of operation were not undertaken. We note that, in this study, the samples’ reported caffeine contents were well above the LOD and LOQ levels for both RFS and conventional mode; however, we still included these calculations in the figures of merit (
Table S1).
3.3. Caffeine Content—Beverage Sample Analysis
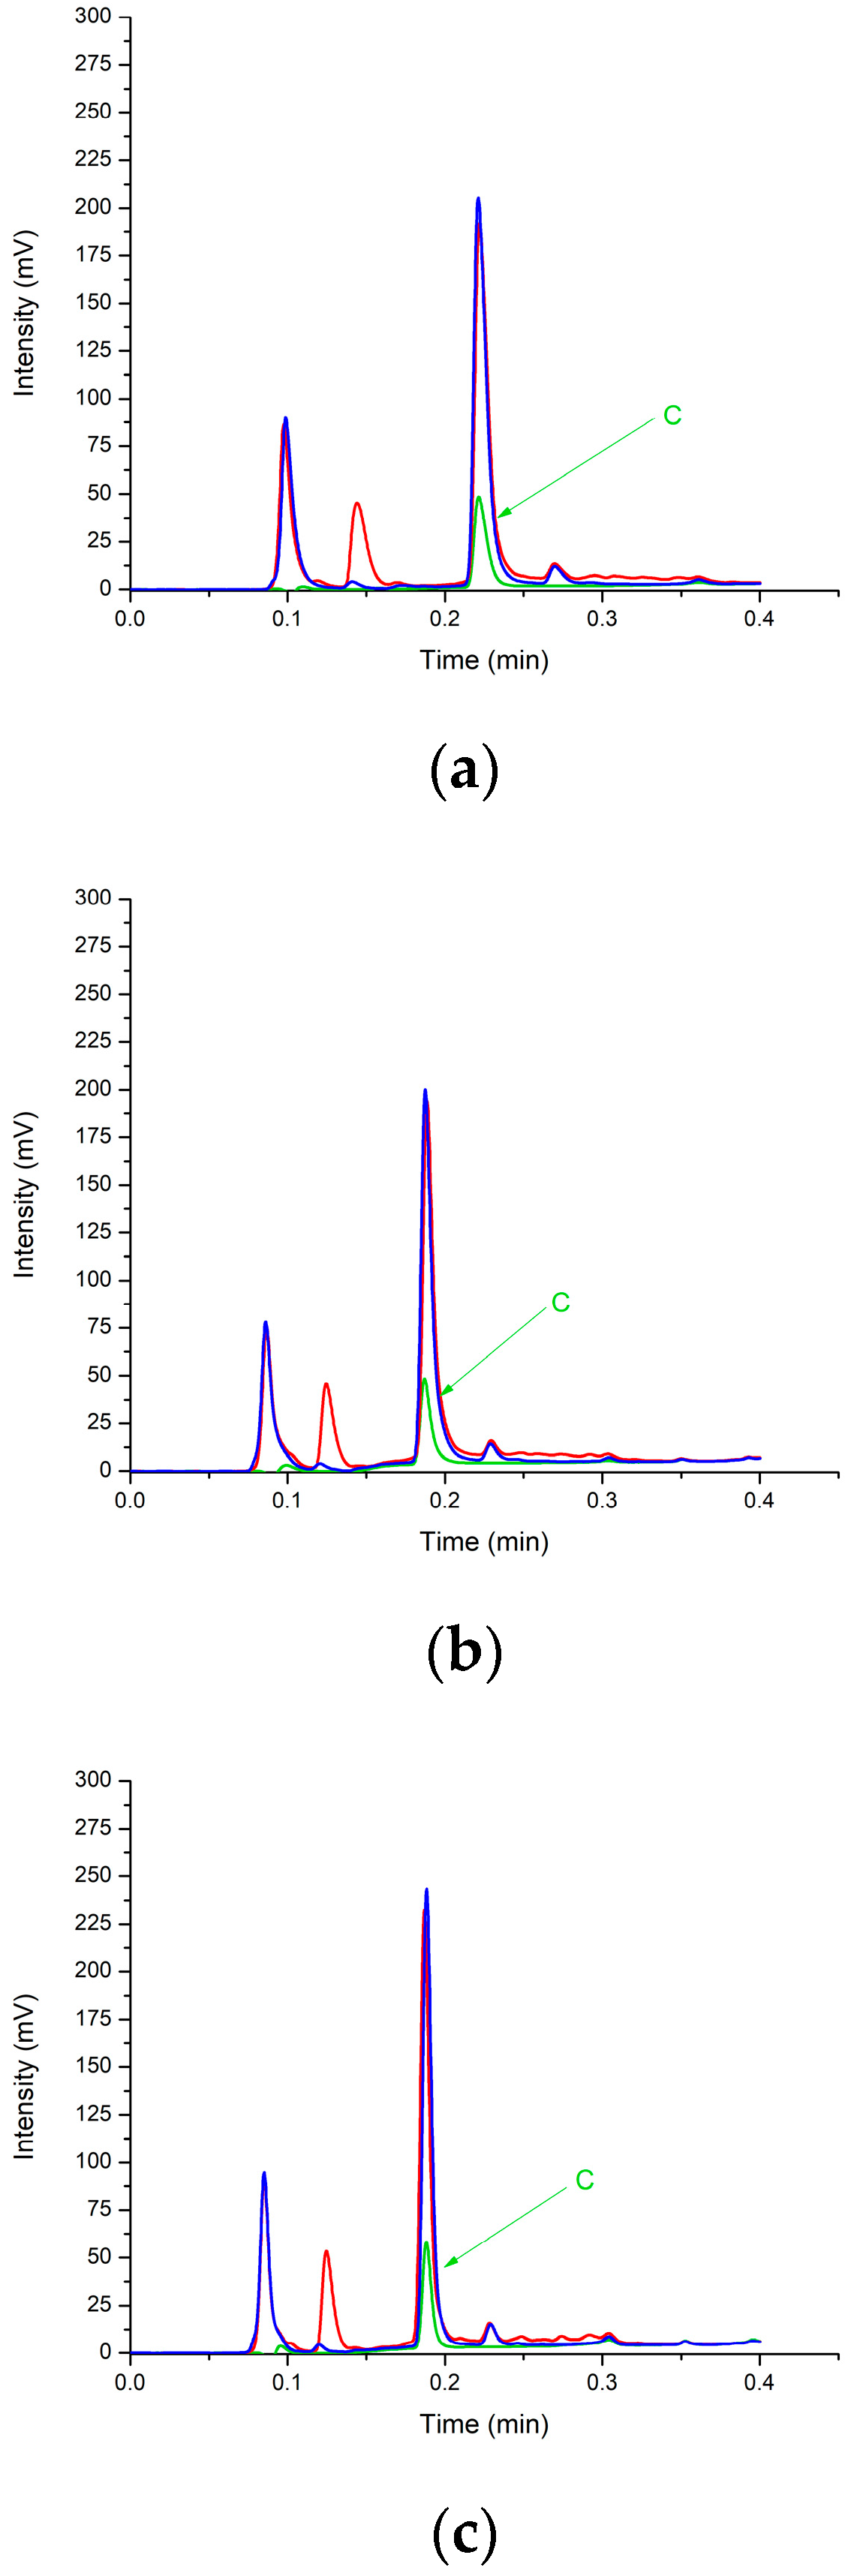
The series of chromatograms in
Figure 4a–c are examples of the energy/cola samples that were assayed. In the illustrated chromatograms, the samples represent the ‘Red Bull’ samples—both the ‘Green Edition’ (red trace) and the ‘Purple Edition’ (blue trace). For reference, the black trace shows the caffeine standard at a concentration of 20 ppm.
Figure 4a shows the separation that was achieved using the conventional column,
Figure 4b shows the separation that was achieved using RFS mode operated at a 15% segmentation ratio, and
Figure 4c shows the separation that was achieved using the RFS mode at a different segmentation ratio of 30%.
Several important points are worth noting from the chromatograms in
Figure 4a–c. Firstly, the high sample-throughput time of <20 s was demonstrated when caffeine was eluted at approximately 11 s (0.18 min) in the RFS chromatograms and 14 s (0.24 min) in the conventional ones. While both methods achieved high-throughput analysis times, the RFS was able to reduce the analysis time by a further 20% compared to the conventionally run HPLC column mode of operation. Secondly, the sensitivity measured by the peak height was approximately 35% higher in the RFS 30% mode of operation compared to both the conventional and RFS 15% modes of operation. Hence, RFS operated at a 30% split to the detector is the best mode of operation if sensitivity is of the highest priority, e.g., if the quantification of caffeine is required at a lower limit.
Furthermore, the peak-to-peak resolution was better in the RFS 30% split to the detector mode of operation compared to the conventional and RFS 15% modes of operation, and this is consistent with the gain in column efficiency when operating in RFS mode. Hence, integration and quantification are improved, particularly if the beverage has an increased complexity with regard to caffeine and a sample matrix component needs to be resolved.
This is detailed further in
Figure 5, which compares the separation of the Hemp sample. The insert in
Figure 5 is an expanded, peak height-normalised profile of the caffeine peak for each mode—overlaid with respect to each peak’s first moment (retention time). These normalised peak profiles show that the peak width obtained using the RFS mode (30% split to the detector) was significantly reduced by 28% compared to that using the conventional mode under gradient conditions, in which peak width reductions are already assisted by gradient compression effects [
32]. The results obtained under gradient elution conditions are in line with the improved isocratic theoretical plate/column efficiency of up to 37% observed in the HETP curves (
Figure 1) when the column operated in RFS mode compared to the conventional HPLC column. Hence, the improved column efficiency translates to better separation performance in real samples separated under gradient conditions, as shown.
3.4. Precision
Table 1 details the performance metrics for the analysis of caffeine in the conventional and RFS (30% mode of operation) columns. Moreover,
Table S2 lists the retention time, peak area and peak height precision data for conventional and RFS mode at a segmentation ratio of 30%. We note the precision values for both HPLC analytical methods, as they are key for validated methods that require long-term repeatability for routine testing, with respect to retention time and detection response. All testing outcomes in this study were assessed based on triplicate injections and their respective relative standard deviation (%RSD).
The injection sequence for both modes of operation were identical, with five samples being bracketed by two caffeine standards at two caffeine concentration levels. The precision and relative standard deviation (%RSD) results are as follows: for the retention time ≤0.62—RFS and ≤0.94—conventional (34% RFS improvement); peak area was ≤6.72—RFS and ≤11.26—conventional (40% RFS improvement); and peak height was ≤1.13—RFS and ≤3.05—conventional (63% RFS improvement). The HPLC conventional precision is acceptable and, overall, the precision of the RFS mode was better in comparison to the conventional mode, with lower deviation values. This consistent and improved precision demonstrates that the RFS column was beneficial and not detrimental to the caffeine testing process.
3.5. Quantification of Caffeine
Table 2 shows the quantification results of the labelled caffeine content versus the amount measured and calculated using the RFS and conventional modes for the eight energy beverages. With respect to the amount of caffeine present in the energy drinks, it was overall comparable to a prior published work, which found that, on average, there was a ±15% difference in caffeine content when compared to the labelled amount [
33], with a ±13% difference obtained using the conventional mode assay and ±10% difference obtained using the RFS mode compared to the stated label claim. With regard to the caffeine content in mg for each serving size, the highest difference was 16 mg.
Table 3 lists the cola drink quantification results. The food label on these cola beverages did not include the caffeine content; hence, the U.S. Department of Agriculture (USDA)-reported content was used for comparison [
34]. The RFS HPLC assay measurements were 76% higher for cola sample E4, and 79% higher caffeine content was found for cola sample E5 compared to the USDA-reported content. While the conventional HPLC column also found higher caffeine contents of 95% and 89% for E4 and E5, respectively. This result is alarmingly high considering that consumers may be drinking double the amount of caffeine that is presented in the USDA guidance per serving for the beverages tested. Both tables highlight the need to regulate the caffeine content in beverages and report the actual value for each can/bottle.
3.6. Final Remarks
It would have been possible to undertake these assays in chromatographic isocratic mobile-phase conditions for the RFS mode but not for the conventional mode; hence, we used gradient separation conditions. As the conventional column had a lower column-separation power and sensitivity, the quantification of caffeine co-eluting with another sample component likely contributed to the differences seen in both
Table 2 and
Table 3 compared to the higher column separation and sensitivity of the RFS HPLC assay. However, despite these differences, all results highlight the need to regulate caffeine, as up to 16 mg more caffeine was quantified in this study for energy drinks and 25 mg for cola drinks for each can/bottle serving size. Moreover, we must include both HPLC assays, as the RFS mode was only commercially available to purchase this year, in 2024, and only differed in the column outlet end-fitting compared to the conventional mode, which has been commercially available for almost over 20 years.
The present study showed the ability to achieve a caffeine high-throughput assay using RFS and conventional mode, which can provide quantitative information for readily available energy and cola drinks. The RFS benefits from shorter analysis times of 11 s (0.18 min) and improved chromatography performance, pressure, and sensitivity, as well as precision metrics.
Future studies are required for the quantification and high sample-throughput benefits of RFS HPLC to be exploited and applied to other routine quantitative HPLC applications. These include, but are not limited to, applications where target compounds of interest must be quantified and monitored via HPLC, such as food, beverages, pharmaceutical products, cosmetic products, complementary therapeutic products, natural products, and environmental samples. Furthermore, future studies should undertake a closer investigation of the differences between the RFS and HPLC conventional column designs for example, using a higher-resolution mass spectrometry detector to confirm that the caffeine was not co-eluting with another species in the conventional HPLC assay. Despite these differences, both assays clearly highlighted that stricter regulation is required to ensure the actual caffeine content in energy and cola drinks is reported. This study reported that up to 25 mg more caffeine was observed in cola drinks, which is equivalent to two servings in one can—significantly different levels that can be detrimental for consumers who require strict control of their caffeine intake, e.g., children and pregnant women.
4. Conclusions
In this study, we demonstrated fast, at <20 s, and precise HPLC approaches to caffeine quantification in caffeinated beverages, particularly energy drinks and cola drinks. We showcased a newly introduced HPLC Radial Flow Splitting (RFS) column that is able to analyse caffeine in 11 s, a 20% reduction in analysis time compared to the conventional column of 14 s. The quantitative certainty associated with precision in peak area and height, as well as retention time, was improved when using RFS. Furthermore, the gain in separation efficiency of up to 37% provided a better HPLC separation performance, making it easier to achieve quantitative resolution and clearly separate caffeine from the other components in the beverage samples’ peaks. While caffeine was not present in trace amounts in the beverages analysed, the RFS column showed improved sensitivity, with 35% greater signal intensity. The quantification results for both HPLC assays demonstrated the need for improved regulations surrounding caffeine labelling on energy and cola drinks, since, in almost all the beverages tested, the amount of caffeine was higher than the label claim, consistent with prior studies. In one case, the amount of caffeine was 16 mg higher per serving than the stated label claim for energy drinks, and 25 mg more caffeine was observed per serving for cola drinks. The inaccurate labelling of caffeine content can be harmful to consumers who need to regulate their caffeine content, e.g., children and pregnant women.

 ,
, 

