Abstract
Biska, a traditional Istrian herbal spirit, is produced by macerating mistletoe leaves and twigs in a water–ethanol base, usually grape marc spirit. The aim of this study was to determine the optimal mistletoe maceration parameters (ethanol content, concentration of plant material, and duration) for the production of biska, which have not yet been the subject of scientific research. The prepared mistletoe macerates and the collected biska samples were subjected to phenolic compound characterization, including total phenolic content (TPC), total flavonoid content (TFC), and polyphenolic profile, by ultra-high-performance liquid chromatography coupled with mass spectrometry (UPLC-ESI-MS2). In addition, the macerates and the biska samples were analyzed for their biological properties: antioxidant and antiproliferative activity. The results showed that both the macerates and the biska samples contain phenolic compounds of mistletoe such as phenolic acids, flavonoids, and coumarins, which contribute to the observed biological activities—significant antioxidant activity and antiproliferative effect. By applying the maceration parameters, which yielded the highest content of phenolic compounds as well as volatile aromatic compounds (40–80 g/L of mistletoe, 40–55% v/v ethanol, and 21 days’ maceration time), the production process can be improved to produce biska with better aromatic and biological properties.
1. Introduction
Aromatic and medicinal herbs have been used for healing and nutritional purposes since ancient times. One of the oldest herbal extracts used for medicinal purposes were alcoholic extracts or elixirs made by monks in monasteries. Together with its good properties as a solvent, ethanol, unlike water, allowed the preservation of extracts and became one of the most important agents for the extraction of volatiles and other compounds from herbs. These alcoholic extracts formed the basis for the production of flavored alcoholic beverages such as beers, aromatized wines, liqueurs, and herbal spirits [1].
Herbal spirits are a special group of strong alcoholic beverages characterized by an ethanol content of up to 40% v/v and produced by flavoring neutral distillates/alcohol of agricultural origin with herbs, fruits, and spices and/or with their extracts such as essential oils, ethanol macerates, distillates, and infusions. For the preparation of herbal spirits, different parts of one or more herb species are used, depending on the manufacturer’s recipe. Compounds extracted from the plant material are responsible for the characteristic flavor, color, and sensory properties of the final product [1,2]. In addition to flavoring, the plant material used in their production serves as a source of beneficial bioactive compounds, especially polyphenolic compounds, which contribute to the antioxidant activity of beverages. Apart from their pleasurable effects, some functional properties can be attributed to herbal spirits [3,4,5,6,7]. In Croatia, these types of alcoholic beverages have a long tradition, especially in the Adriatic regions, which are rich in numerous wild and cultivated medicinal and aromatic herb species. According to Luczaj et al. [8], an impressive number of 114 herb species are used for flavoring and making alcoholic beverages in this part of Croatia. Biska is an authentic Croatian herbal spirit produced by macerating leaves and twigs of white mistletoe (Viscum album) in a water–ethanol base, usually grape marc spirit. It is produced usually by rural families as part of the gastronomic and cultural identity of Istria in the Croatian tourist region.
White mistletoe (Viscum album) is an evergreen hemiparasite shrub that grows on different host trees. Throughout human history, its extracts have been used for medicinal and pharmaceutical purposes. In recent decades, numerous scientific studies have confirmed that mistletoe is a rich source of phytochemicals (e.g., lectins, viscotoxins, alkaloids, terpenes, polyphenols, phytosterols), the content of which depends mainly on the type of host tree on which it parasitizes, but also on the time of harvesting [9,10,11]. Due to its rich phytochemical composition, white mistletoe exhibits a wide range of biological effects, such as immunomodulatory, antioxidant, cytotoxic, antihypertensive, sedative, antidiabetic, and antimicrobial effects, but research is mostly focused on aqueous mistletoe extracts, while ethanol extracts are insufficient. Melo et al. [12] summarized the biological and chemical potential of alcoholic mistletoe extracts. Alcoholic extracts demonstrated antimicrobial [13], cytotoxic [14], anti-inflammatory [15], and antihypertensive activities [16], among other activities. In the production of strong alcoholic beverages, only ethanol can be used as a solvent/extracting agent, which is suitable for the extraction of phenolic compounds [17,18], but it also has other advantages such as being a bio-solvent, easily available in high purity, completely biodegradable, and low-price [19].
Maceration is a solid–liquid extraction technique traditionally used to extract various compounds from plant material. It is a simple and low-cost operation suitable for both industrial and homemade alcoholic beverages productions. Maceration is still widely used in the production of herbal spirits and liquors, despite its disadvantages such as its long extraction time and low extraction efficiency [20]. Moreover, this process is often performed traditionally without accurate knowledge of the influence of maceration parameters on the quality of the macerate. Maceration parameters such as ethanol content, plant–liquid ratio, temperature, and duration of maceration affect the quality of the macerate. These conditions should be optimized for each plant species used in order to ensure both the quality and health safety of the final product. In recent years, several studies have been published regarding the optimal maceration conditions for various medicinal and aromatic herbs and fruits, used for herbal spirit and liquor production [4,5,7,19,21,22,23,24,25]. These studies provide valuable data about the characterization and identification of compounds, mainly phenolic and volatiles from plants, spices, and alcoholic bases, responsible for the biological activity and sensory profile of alcoholic beverages.
In our previous study [25], we reported the effect of mistletoe maceration conditions on the chemical composition, physical properties, and aroma profile of the macerates. The aim of this study was the determination of the optimal parameters of mistletoe maceration in a water–ethanol base for biska production to obtain the maximum yield of the beneficial phenolic compounds in macerate. The prepared macerates and the collected biska samples were subjected to a characterization of the phenolic compounds, the total phenolic compounds (TPC) and total flavonoid content (TFC), and ultra-high-performance liquid chromatography coupled with mass spectrometry (UPLC-ESI-MS2) was used to determine the polyphenolic profile. In addition, the macerates and the biska samples were analyzed for their biological properties: antioxidant and antiproliferative activity. The present study attempts to fill the research gap between aqueous and alcohol mistletoe extracts and to support the use of alcohol extracts in the production of herbal spirit. In addition, this study has a practical aspect: the results could be useful for producers of mistletoe herbal spirits when considering which maceration parameters have the greatest influence on the final product.
2. Materials and Methods
2.1. Chemicals and Reagents
Folin–Ciocalteu (FC) reagent, iron (III) chloride hexahydrate, and hydrochloric acid (37%) were supplied by Kemika (Zagreb, Croatia). Sodium carbonate and sodium acetate were of analytical grade, obtained from Grammol (Zagreb, Croatia). Acetic acid (glacial) was obtained from Carlo Erba Reagents (Barcelona, Spain). Aluminum chloride, Trolox (6-hydroxy-2,5,7,8-tetramethylchromane-2-carboxylic acid), 2,4,6-tripyridyl-S-triazine (TPTZ), 2,2-diphenyl-1-picrylhydrazyl (DPPH), and all analytical standards were supplied by Sigma-Aldrich (St. Louis, MO, USA). Ethanol 96% (v/v) was obtained from Kefo (Sisak, Croatia). The two adherent human cell lines used (HeLa and HaCaT) were purchased from ATCC (Manassas, VA, USA). The Dulbecco’s modified Eagle medium (DMEM) and fetal bovine serum (FBS) used for cell cultivation were purchased from Capricorn (Ebsdorfergrund, Germany). The CellTiter 96® AQueous One Solution Cell Proliferation assay was purchased from Promega (Madison, WI, USA).
2.2. Preparation of Mistletoe (V. album) Macerates
Mistletoe (V. album) macerates were prepared by macerating dry chopped plant material (mistletoe leaves and stems) in a water–ethanol base (A = 25%, B = 40%, C = 55%, and D = 70% v/v ethanol). Water–ethanol bases were prepared by mixing 96% ethanol of agricultural origin and water. The plant material was weighed and added to 500 mL of the water–ethanol base to obtain three different concentrations of mistletoe (20, 40, and 80 g/L). Accordingly, the samples are named _20, _40, and_80, with a prior letter indication of the water–ethanol base strength (A, B, C, D). Maceration was conducted in bottles with plugs at room temperature and in darkness to avoid exposure to sunlight. Macerate samples for the determination of TPC were taken every week (after 7, 14, 21, and 28 days of maceration). The end of the maceration was determined on the basis of TPC equilibrium. At the end of maceration, the macerates were filtered through filter paper to remove plant material, which was also squeezed and stored at −20 °C. During maceration, the samples were shaken manually daily for 30 s. Plant material was obtained from a local phytotherapy producer (Croatia). Macerates were prepared in duplicate, and all analyses were performed in triplicate.
2.3. Misletoe Herbal Spirit (Biska) Samples
Thirty-four samples of traditional mistletoe spirit biska from the Istria region, Croatia, were studied. Ten of them were commercially produced and twenty-four were homemade products (Table 1). The samples were collected directly from the producers but the equipment and the production process were unknown. The content of ethanol (% v/v) in the biska samples as stated by the producers is shown in Table 1.

Table 1.
Type of production and content of ethanol (% v/v), total phenolic content (TPC), and antioxidant activity reported by FRAP and DPPH method for the collected biska samples (B1–B34).
2.4. Determination of the Total Phenolic Content (TPC) and the Total Flavonoid Content (TFC)
The total phenolic content (TPC) of each sample was determined by applying the Folin–Ciocalteu method [26]. Briefly, 0.3 mL of diluted samples or standard solutions (gallic acid) was added to 6 mL of distilled water and 0.5 mL of the Folin–Ciocalteu reagent, thoroughly mixed, and allowed to stand for 5 min. Then, 1.5 mL of saturated sodium carbonate solution was added, mixed well, and filled to a total volume of 10 mL with distilled water. The samples were left at room temperature for 2 h in darkness. The absorbance of the samples was measured at 760 nm using a UV/Vis spectrophotometer (Specord 50 Plus, Analytik Jena). The calibration curve used for the quantification of the samples was prepared with different concentrations of gallic acid standard solution (50–300 mg/L). The total phenolic content is expressed as milligrams of gallic acid equivalents (GAE) per L of sample.
The total flavonoid content (TFC) of the samples was analyzed using the aluminum chloride colorimetric method [27]. Briefly, 500 μL of the diluted sample was mixed with 100 μL of 10% aluminum chloride solution, 100 μL of 1 M sodium acetate, and 1.5 mL of 80% (v/v) ethanol. The mixture was left to stand at room temperature for 30 min in darkness. The absorbance of the mixture was measured at 415 nm against the blank sample using a UV/Vis spectrophotometer (Specord 50 Plus, Analytik Jena). The calibration curve was prepared with different concentrations of standard rutin solution (5–250 µg/mL). The content of total flavonoids was expressed as µg of rutin equivalents (RE) per mL of macerates.
2.5. UPLC/ESI-MS2 Analysis of Polyphenols
A previously developed UPLC/ESI-MS2 method described by Elez Garofulić et al. [28] was used for qualitative and quantitative analysis of polyphenolics in the mistletoe macerates obtained. UPLC/ESI-MS2 analysis was performed on a 1290 RRLC instrument (Agilent, Santa Clara, CA, USA) connected to a triple-quadrupole mass spectrometer (6430) with an ESI ion source coupled to a binary pump, with an autosampler and thermostated column compartment. Separations were performed on a Zorbax Eclipse Plus C18 column (100 mm × 2.1 mm; 1.8 µm particle size) (Agilent, Santa Clara, CA, USA). The column temperature was set at 35 °C and the injection volume was 2.5 µL. The solvent composition and the gradient conditions used, as well as the instrument settings, were maintained according to the procedure described by Elez Garofulic et al. [28]. Ionization was performed by electrospraying (ESI) in the negative and positive modes (from 100 to 1000 m/z), and the data were collected in the dynamic multiple reactions monitoring (dMRM) mode with the following parameters: positive/negative capillary voltage, 4000/3500 V; drying gas temperature, 300 °C; flow rate, 11 L/h; and nebulizer pressure, 40 psi. High-purity nitrogen (99.999%, Messer, Croatia) was used as an inducing cone and collision gas. The MassHunter Workstation Software (ver. B.04.01) (Agilent, Santa Clara, CA, USA) was used for data acquisition and analysis. All measurements were performed in duplicate. An external standard calibration methodology was applied. Calibration curves were obtained by the injection of six known concentrations of the following standards prepared by consecutive dilutions from a stock methanol solution: gallic acid, chlorogenic acid, caffeic acid, ferulic acid, sinapic acid, quinic acid, p-coumaric acid, procyanidin B1 and B2, catechin, epicatechin, epicatechin gallate, epigallocatechin gallate, quercetin-3-rutinoside, quercetin-3-glucoside, kaempferol-3-rutinoside, naringenin, myricetin, luteolin, rutin, apigenin, esculetin, and scopoletin. All standards were qualified and quantified in dynamic MRM mode, using the optimized specific parameters: retention time, precursor ion, product ion, fragmentor voltage, collision energy, and ionization mode. Quality parameters for the analytical method including calibration curves, instrumental detection (LOD), and quantification (LOQ) limits were previously reported [28]. The identification of phenolic compounds was carried out by comparing retention times and mass spectra with those of authentic standards. For compounds lacking reference standards, identification was based on mass spectral data and previously reported mass fragmentation patterns, while quantification was performed as follows: gentisic acid, cinnamic acid, and p-hydroxybenzoic acid were calculated as gallic acid equivalent, kaempferol derivates were calculated according to kaempferol-3-rutinoside; quercetin derivates were calculated according to the quercetin-3-glucoside calibration curve; chrysoeriol was calculated according to the luteolin calibration curve; apigenin derivates were calculated according to apigenin; genistein was calculated according to the naringenin calibration curve; and umbelliferone was calculated according to scopoletin. The concentrations obtained are expressed as mg per L of sample, as the mean value and standard deviation (n = 3 replicates).
2.6. Antioxidant Activity
For the determination of the antioxidant activity of mistletoe macerates, the ferric ion reducing antioxidant power (FRAP) and the 1,1-diphenyl-2-picrylhydrazyl (DPPH) radical scavenging method were used. The FRAP assay was performed as previously described by Benzie and Strain [29] with some modifications. The FRAP reagent solution was made of the mixture of the acetate buffing agent (300 mM, pH = 3.6), TPTZ (10 mM solution TPTZ in 40 mM HCl), and FeCl3 × 6H2O (20 mM) in a volume ratio of 10:1:1. The working FRAP reagent was prepared fresh on the day of the analysis. All samples, standards, and reagents were pre-incubated at 37 °C. The examined samples (80 μL) were mixed with FRAP reagent (2080 μL) and distilled water (240 μL). After reaction at 37 °C for 5 min, the absorbance at 593 nm was measured. The standard curve was constructed using a serial dilution (0.1–2.0 mM) of Trolox stock solution. The final results are expressed as millimolar Trolox equivalents.
The procedure for determining 1,1-diphenyl-2-picrylhydrazyl (DPPH) radical scavenging activity was carried out according to Brand-Williams et al. [30]. A total of 200 µL of sample or standard was added to 2 mL of 0.1 mM DPPH solution and 2 mL of 96% (v/v) of ethanol. After incubation for 30 min in darkness, the absorbance of each reaction solution was determined at 517 nm using a UV/Vis spectrophotometer (Specord 50 Plus, Analytik Jena). The corresponding blank was also determined and the percentage of macerate scavenging activity against DPPH radicals was calculated as follows:
where Ablank is the absorbance of the control reaction (containing all reagents except the test compound) and Asample is the absorbance of the test compound.
% of DPPH inhibition = (Ablank − Asample/Ablank) × 100
2.7. Cell Proliferation Assay
The human cell lines used in this study were the HeLa cell line, derived from human cervical carcinoma (ATCC) and the normal HaCaT cell line (ATCC). Both cell lines were cultured in 75 mL flasks in DMEM supplemented with 10% inactivated fetal bovine serum (FBS) and maintained at 37 °C and 5% CO2. Samples of both cell lines were taken in the exponential growth phase and counted using Trypan blue. Cells were then seeded in 96-well plates at a density of 3 × 10⁴ cells/mL and incubated at 37 °C and 5% CO2 for 24 h. After that, the cells were treated with selected mistletoe macerates (A_80, B_80, C_80, and D_80) and collected biska samples (B20, B24, B33, and B34) in the range of volume fractions from 1.25 to 10% v/v. The cells were incubated at 37 °C for 72 h, after which the cytotoxic effect was determined by the CellTiter96® AQueous One Solution Cell Proliferation assay (Promega, USA) according to the manufacturer’s protocol. After the reagent was added to each well, the cells were incubated for an additional 3 h and then the absorbance was measured at 492 nm on the microplate reader (Tecan, Männedorf, Switzerland). Cell viability percentage was expressed as the ratio between the absorbances of the treated versus nontreated control cells. Also, in order to rule out the potential toxicity of ethanol, the effect of 25, 40, 55, and 70% v/v ethanol on both cell lines was tested in parallel in the same volume fractions as for the samples. Three independent experiments in triplicate were performed and the results are expressed as % survival of treated cells compared to untreated, control cells.
2.8. Statistical Analysis
Statistical analyses were performed using SPSS Statistics 22.0 (IBM, Armonk, NY, USA). The data shown are mean values (n = 3). The results were tested for distribution normality using the Shapiro–Wilks test. In order to determine the statistical significance of differences across the different concentrations of mistletoe, the content of ethanol (% v/v), and maceration days, ANOVA, and the Kruskal–Wallis test were used depending on the normality of the data distribution. The Pearson correlation coefficients were calculated to demonstrate the correlation between the antioxidant activities evaluated with different methods. Decisions on statistical relevance were made at a significance level of p < 0.05. Principal component analysis (PCA) was carried out using the MS Excel tool XLStat (Addinsoft, Paris, France) program and used to confirm some relationships among analyzed variables using averaged data.
3. Results and Discussion
3.1. Maceration Parameters
The determination of optimal maceration parameters is important because changes in these parameters can affect the quality and extraction yield of bioactive compounds with positive but also negative health effects [4,21,31]. The effect of mistletoe maceration parameters on the phenolic compound extraction has not been the subject of scientific research until now. Figure 1 shows the evolution of total phenolic compounds (TPC) extracted from mistletoe during the maceration period.
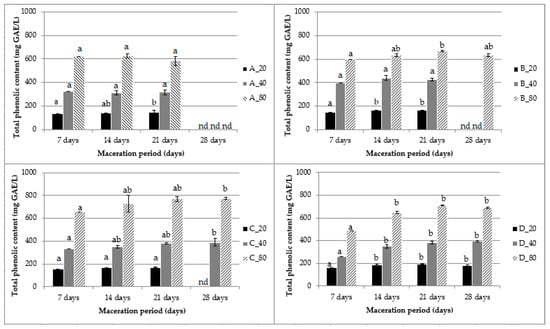
Figure 1.
Total phenolics (TPC) extracted by maceration of mistletoe (_20 = 20 g/L, _40 = 40 g/L, and _80 = 80 g/L) in the different water–ethanol bases (A = 25%, B = 40%, C = 55%, and D = 70% v/v ethanol) as a function of the maceration time. Values are expressed as mean ± standard deviation (n = 3). Bars in each graph within a sample followed by different letters are significantly different (p < 0.05). nd = not determined, due to finished maceration.
The extraction of polyphenolic compounds, like all other plants compounds, is carried out according to the principle of diffusion until equilibrium is reached, which terminates the extraction [20,32]. For most macerates, there was an increase in TPC during the first 7 days of maceration. For macerates with a minimal ethanol content (A) and minimal mistletoe concentration (_20), TPC reached a plateau after 7 days of maceration. For all other macerates, there was a slight increase in TPC up to 21 days of maceration. Statistical analysis of the studied maceration parameters (p < 0.05) showed that the volume fraction of ethanol (25, 40, 55, and 70% v/v) had no significant influence on the yield of total phenolic compounds extracted in contrast to the mass concentration of the plant material (20, 40, and 80 g/L): TPC showed an increase with the mistletoe mass concentration (g/L). The maximum concentration of mistletoe (80 g/L) led to the maximum extraction of TPC. This was also confirmed by the principal component analysis (PCA) performed to identify the main factors of variability and to describe the relationship between the variables analyzed (Figure 2). The first two principal components accounted for almost 99% of the total variance between the samples (PC1 87.19% and PC2 11.67%).
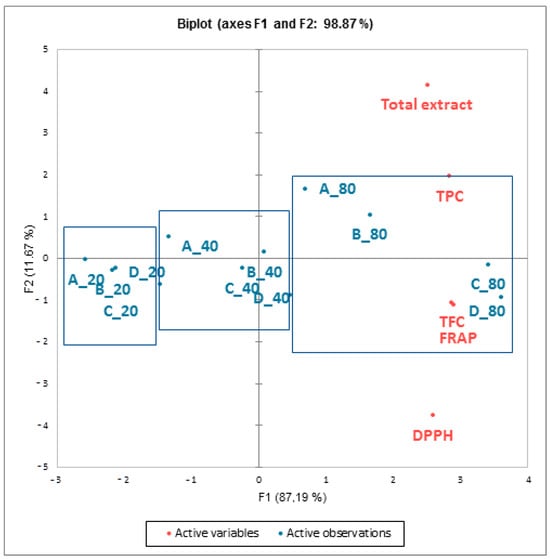
Figure 2.
Principal component analysis (PCA) score plot of mistletoe macerates obtained after maceration of mistletoe (_20 = 20 g/L, _40 = 40 g/L, and _80 = 80 g/L) in the different water–ethanol bases (A = 25%, B = 40%, C = 55%, and D = 70% v/v ethanol) based on phenolic compounds (TPC), total flavonoid content (TFC), and antioxidant activity (FRAP and DPPH assays).
According to PCA, the macerates were separated into three main groups depending on the mass concentration of plant material (20, 40, and 80 g/L), confirming its significant influence on TPC, TFC, and consequently the antioxidant activity (FRAP and DPPH assays) of the macerates obtained (Figure 2). A similar effect was observed by Galego et al. [33] for the maceration of myrtle berries but is in contrast to the study by Rodriguez-Solana et al. [21], in which the plant concentration had no significant effect on the extraction of phenolic compounds for chamomile flowers and eucalyptus leaves. The highest ethanol concentration (70% v/v) favored total phenolic compounds from these plants. Moreover, in this study, it was observed that with increasing plant concentration, a longer time was required for the maximum extraction of TPC. The use of a larger amount of plant material leads to an increase in the viscosity of the extraction medium, which reduces the diffusion rate [34]. These results suggest that maceration conditions must be optimized for each plant species as well as for the different plant parts. Based on the obtained results, the parameters of the maceration process of mistletoe in a water–ethanol base in which the highest yield of total phenolic compounds is achieved are 80 g/L of mistletoe, a 55% v/v water–ethanol base, and the 21-day maceration duration. These results are consistent with the findings of Senica and Mikulić-Petkovšek [35], who reported that the highest phenolic content in 40% (v/v) ethanol was obtained in eight different herb macerates (wormwood, caraway, centaury, fennel, lemon balm, peppermint, rue, and sage), which are mostly used for homemade alcoholic beverages or liquors, between 7- and 21-day maceration periods. Furthermore, carob pod maceration in a 50% (v/v) water–ethanol base (1:5 solid-to-liquid ratio) in darkness for 8 weeks was recommended as optimal maceration conditions for the production of carob liquor [24]. Rodriguez-Solana et al. [21] selected the optimal maceration conditions 70% (v/v) of ethanol, 40 g/L of plant concentration, and 3 weeks of maceration for selected herbs used in the production of Galician herbal spirits and liquors: German chamomile, coriander, licorice, and eucalyptus.
3.2. Phenolic Compounds Characterization
Prepared macerates and collected biska samples were subjected to phytochemical characterization, total phenolic compounds (TPC), and total flavonoid content (TFC), and ultra-high-performance liquid chromatography coupled with mass spectrometry (UPLC-ESI-MS2) was used to determine the polyphenolic profile, i.e., the identification and concentration of polyphenolic compounds. The contents of total phenolic compounds (TPC) and total flavonoids (TFC) in prepared mistletoe macerates are shown in Table 2.
Table 2.
Content in total phenolics (TPC), total flavonoids (TFC), and antioxidant activity reported by FRAP and DPPH method for the obtained mistletoe macerates.
During the maceration process, these bioactive compounds, as well as other mistletoe phytochemicals, are extracted into the water–ethanol base. The content of extracted bioactive compounds depends on maceration parameters such as the amount of plant material, duration of maceration, strength of the water–ethanol base, and temperature [5,24]. The TPC in the mistletoe macerates ranged from 146.16 (A_20) to 774.31 (C_80) mg GAE/L. TPC increased with increasing concentration of plant material and strength of the water–ethanol base. The highest TPC (774.31 mg GAE/L) was observed in sample C_80, characterized by the highest plant concentration (80 g/L) and 55% v/v of ethanol. This result is a consequence of the large amount of macerated herbs, but also the ratio of ethanol and water of almost 1:1. Polyphenols from aromatic plants are preferentially extracted with a mixture of alcohol and water using maceration, particularly when they are in a glycoside form [32]. In a mixture, one solvent can enhance the solubility of polyphenols, while the other can improve desorption. Moreover, small amounts of water in a binary solvent system create a more polar medium, whereas breaking hydrogen bonding facilitates the extraction of polyphenols [36]. The majority of distillates used as water–alcohol bases in the production of herbal spirits and liqueurs are characterized by a volume fraction of ethanol of 40–50%.
In accordance with the growth of TPC in macerates, the content of total flavonoids (TFC), the large group of phenolic compounds, also increased and ranged from 35.59 (A_20) to 425.99 µg RE/mL (D_80) (Table 2). But, in contrast to total phenols, where higher values were achieved using a 55% water–ethanol base, higher values of total flavonoids were achieved using a 70% water–ethanol base. Most flavonoids from mistletoe such as kaempferol, quercetin, rutin, sakuranetin, homoeriodictyol, naringenin, viscolin, rhamnazine, and isorhamnetin [37] are weakly polar and consequently less soluble in water. Increasing the concentration of ethanol in the water–alcohol base improves the solubility of flavonoids and their extraction. Such results are confirmed by Cosmulescu et al. [38], where walnut macerates with 70% v/v ethanol have the highest concentration of total flavonoids. Although the results of the studies are varied and sometimes contradictory, they confirm that the efficiency of extraction of phenolic compounds with water–ethanol solutions depends strongly on the plant material and the extraction conditions, and that too high or too low concentrations of ethanol in water are not conducive to the simultaneous extraction of all phenolic compounds. For example, water–ethanol solutions containing 50% ethanol were found to be most effective in extracting total phenolics, flavonoids, and anthocyanins from blueberry pomace [39], chokeberry [40], sage [41], and carob pods [24].
For comparison, the content of total phenolic compounds (TPC) was also determined in collected biska samples. In this case, phenolic compounds may come from the mistletoe but also from other plant species used. The results are shown in Table 1.
The content of phenolic compounds in the biska samples ranged from 25.51 to 790.98 mg GAE/L. Although the obtained results show that the collected biska samples differ in the content of total phenolic compounds, there was no statistically significant difference (p = 0.541) in phenolic compounds content between commercial and homemade samples. The differences in TPC are attributed to the differences in the manufacturing process: origin of raw material, quantity and composition of herbs, volume fraction of ethanol in the water–ethanol base/distillate, duration and temperature of maceration, and the addition of sugar or honey. Namely, manufacturers produce biska according to various recipes, most of which are unknown. Besides mistletoe as the basic herb, other aromatic herbs are often added during maceration. Croatia is characterized by a favorable climate for the growth of a variety of wild and cultivated medicinal and aromatic plants such as Foeniculum vulgare, Myrtus communis L., Salvia officinalis L., Ruta graveolens L., Juniperus oxycedrus L., Ceratonia siliqua L., Juglans regia L., Citrus spp., Ficus carica L., Laurus nobilis L., Rosmarinus officinalis L., Artemisia absinthium L., Rosa centifolia L., and Mentha piperita L. [8]. In addition, honey, as flavoring and sweetening agent as well as the additional source of phenolics [42], can be added to the biska. Based on the obtained results, the range of TPC in biska samples is similar to those of other herbal spirits made from different herbs. Herbal spirits obtained by the maceration of 12 single herb species such as Thymus vulgaris, Mentha piperita, Salvia officinalis, Satureja montana, Foeniculum vulgare, Matricaria chamomilla, and Melissa officinalis contain TPC ranging from 88.6 to 658 mg GAE/L [43]. According to Andreou et al. [6], TPC in 16 selected herb macerates ranged from 26.80 to 4569.33 mg GAE/L: the highest TPCs were found in the herbal spirit obtained by the maceration of S. aromaticum L., J. officinale L., and E. globulus Labill., while H. rhamnoides L. and L. barbarum Mill. showed the lowest values. Alcoholic beverages such as wine [44], beer [45], distillates aged in barrels, and fruit and herbal liqueurs [3,22,46,47] also contain a significant amount of total phenolic compounds (TPC): white and red wines and various beers in the range of 8.4–1031, 155–2314, and 125–544 mg GAE/L; and fruit wines and liqueurs, Nocino liqueur and Korean lotus liqueur, and mint liqueur in the range of 91–1820, 239–3884, 1063, and 10.49–446.80 mg GAE/L, respectively. Petrović et al. [7] determined the content of total phenolic compounds in several bitter liqueurs and herbal spirits in the range from 249 mg GAE/L to 1365 mg GAE/L. Mrvčić et al. [3] established that spirit drinks aged in wooden casks, such as wine or plum brandy, contain TPC ranging from 40 to 90 mg GAE/L, whereas walnut or sour cherry liquors contain much more TPC ranging from 680 to 3360 mg GAE/L.
3.3. Polyphenolic Profile
Herbal spirits are chemically very complex hydro-ethanol extracts of a large number of different herbs and spices used in the production process. It is known that the chemical composition of the plant material depends on the growing conditions, time of harvest, storage conditions, etc. [48], but in the case of parasitic plants such as mistletoe, the chemical complexity is not stable and depends significantly on the host tree species. According to Pietrzak and Nowak [10], higher levels of phenolic compounds were found in mistletoe extracts obtained from plant material collected in the autumn–winter period (cold weather with the presence of snow and less sunshine). Furthermore, Kleszken et al. [11] presented a review of the literature on the impact of the host tree on the profile of bioactive compounds of mistletoe, such as lectins and viscotoxins, with a focus on phenolics, such as flavonoids and phenolic acids. During maceration, phenolic compounds are extracted from the mistletoe plant material into the water–ethanol base. The water–ethanol extracts obtained (e.g., macerates) were analyzed by UPLC/ESI-MS2 in order to reveal their polyphenolic profile. Identification and quantitative data regarding the phenolic compounds profile of the selected macerates (A_80, B_80, C_80, and D_80) and biska samples (B17, B18, B22, B25, B30 and B34) are shown in Table 3.
Table 3.
Polyphenolic profile including mass spectrometric data and concentration of identified individual compounds.
Values in each row followed by different letters are significantly different (p < 0.05). Based on the results obtained, 32 compounds including 12 phenolic acids (6 hydroxycinnamic and 6 hydroxybenzoic acids), 7 flavonols, 4 flavan-3-ols, 4 flavones, 1 flavanon and isoflavon, and 3 coumarins are identified and quantified, by comparison of chromatographic data and mass fragmentation patterns with bibliographic resources or, in some cases, by comparison with authentic analytical standards. Melo et al. [12] demonstrated that approximately 70% of the chemical compounds identified in mistletoe alcoholic extracts were flavonoids (47%) and phenolic acids (23%). In this work, 53% of the identified phenolic compounds belong to the flavonoids and 37.5% to the phenolic acids. According to Luczkiwicz et al. [49] and Vicas et al. [50], phenolic acids found in mistletoe are protocatechuic, p-hydroxybenzoic, caffeic, salicylic, ferulic, and sinapic acid, occurring in free form or as esters or glycosides. In all analyzed samples, phenolic acids belonging to hydroxycinnamic and hydroxybenzoic acids were found in the highest concentrations. Compounds 1 (protocatechuic acid), 4 (gentisic acid), 5 (cinnamic acid), 6 (p-coumaric acid), and 9 (gallic acid) exhibited the product ions at m/z 109, m/z 109, m/z 103, m/z 119, and m/z 125 with a neutral loss of the CO2 unit (44 Da) from the parent ions, respectively. This fragmentation pattern has been shown for most of the identified phenolic acids. Chlorogenic acid (compound 2) as a marker of Viscum album species was identified based on deprotonated molecular ions at m/z 353 and by comparison with the authentic standard [51]. This compound has already been reported in the ethanol extract of V. album [49,52]. Compound 3 was found in all analyzed macerates and biska samples as the most abundant one, present in the concentration range of 18.60–375.42 mg/L. Based on the fragment ion at m/z 191 ([quinic acid-H]-), it was identified as quinic acid [53]. Due to its polar characteristic, it is present in the highest concentration in macerates with a lower ethanol content (A_80 and B_80). The presence of quinic acid was also confirmed in the 80% v/v ethanol extract of Viscum album [51] and the alcoholic extract of Viscum schimperi [54]. A quinic acid derivative was also identified in the methanolic extract of berries, leaves, and seeds of mistletoe (Viscum album) harvested from common pine [55]. Compounds 7 and 8 were identified through comparison with authentic standards as syringic and ferulic acid. Compound 10 presented an ion at m/z 137 and a fragment ion at 93 was assigned to p-hydroxybenzoic acid [56]. Compounds 11 and 12 were identified as sinapic acid and caffeic acid belonging to the class of hydroxycinnamic acids. Sinapic acid presented an ion at m/z 223 and was the most abundant in biska sample B25 followed by B17 and among macerates in A_80, followed by B_80. Caffeic acid was identified based on fragments related to the caffeoyl group with fragment ions at m/z 179 ([caffeoyl-H]-) and 135 ([caffeoyl-H-CO2]-) [53].
Apart from phenolic acids, which were the most abundant in the samples according to their content, most of the compounds were identified in the flavonoid group. Flavonoids can be present as aglycons but, in most cases, they are linked to sugar moieties as glycosylated compounds [57]. Among the flavonoids, flavonols, mainly kaempferol and quercetin glycosides, were found to be the most abundant subclass in all analyzed samples, followed by flavons and flavan-3-ols, which are consistent with the literature data [11,58]. Compounds 13, 16, and 18 were tentatively identified as kaempferol glycosides due to a characteristic fragment ion at m/z 287 that corresponds to kaempferol. They were assigned as kaempferol 3-O-glucoside, kaempferol rhamnoside, and kaempferol pentoside due to losses corresponding to hexose (162 Da), rhamnose (146 Da), and pentose (132 Da) [59]. Compounds 14 and 19 were tentatively identified as quercetin glycosides due to a characteristic fragment ion at m/z 303. They were identified according to specific losses as quercetin pentoside (132 Da for loss of pentose) and quercetin acetyl-rutinoside (42, 146, and 162 Da for losses of acetyl moiety, rhamnose, and glucose) [60,61]. There is almost no difference in the concentration of quercetin derivatives between analyzed samples, as they are highly soluble in all water–ethanol solutions due to the presence of several hydroxyl groups in their structure, unlike kaempferol [62]. In all samples analyzed, compound 15 identified as kaempferol (product ion at m/z 285) was the most represented flavonol quantified from 0.71 to 3.22 mg/L. Quercetin, kaempferol, and its mono-, di-, and trimethyl ethers were detected in the various subspecies of the European mistletoe [11,58]. Another compound belonging to the class of flavonols identified in the samples was myricetin (compound 17) characterized by an MS-MS pattern and by comparison with the authentic standard. Compounds belonging to the class of flavan-3-ols (20, 21, 22, and 23) were identified based on characteristic MS-MS spectra and also by comparison with analytical standards. They were epicatechin gallate, epicatechin, catechin, and epigallocatechin gallate. The extraction of catechin was not affected by the ethanol content, unlike other flavan-3-ols whose concentration decreases with increasing ethanol content. Catechin was the most abundant flavan-3-ol in all analyzed samples (0.36–2.71 mg/L). Furthermore, 4 flavones, 1 flavanon, and 1 isoflavon were identified. Compounds 24, 25, 26, and 27 were identified as luteolin, chrysoeriol, apigenin, and apigenin 7-O-glucoside based on the MS-MS pattern and by comparison with authentic standards. Flavanon naringenin (compound 28) was characterized by a specific product ion at m/z 271, and its fragmentation pattern followed the Retro–Diels–Alder reaction showing a fragment ion at m/z 151 [63]. Compound 29 was tentatively assigned as isoflavone genistein due to a precursor ion at m/z 269 and fragment ion at m/z 133 [64]. In addition to phenolic acids and flavonoids, coumarins were another class of phenolic compounds that were able to be identified in analyzed samples. The presence of three different coumarins belonging to the hydroxycoumarin subclass in the samples was confirmed. Compounds 30, 31, and 32 were identified as scopoletin, umbelliferone, and esculetin based on MS-MS data. Scopoletin was characterized by the product ion at m/z 191 and the fragment ion at m/z 151. Umbelliferone and esculetin were tentatively characterized at m/z 161, which produced a fragment ion at 133 through the neutral loss of CO (28 Da), and at m/z 177, which produced a fragment ion at 133 through the neutral loss of CO2 (44 Da) [65]. Scopoletin and esculetin were present in higher concentrations than most other phenolic compounds in all samples analyzed. The extraction of scopoletin and umbelliferone was better in macerates with the lowest ethanol content (A_80, 5.92, and 0.27 mg/L), in contrast to esculetin, which is more soluble in an aqueous–alcoholic base with a higher ethanol content. The results presented confirm the effects of the ethanol content on the qualitative and quantitative profile of the phenolic compounds present in the water–ethanol macerates, which is consistent with the data reported in the literature [19,35,48]. The highest total concentration of phenolic compounds, according to UPLC/ESI-MS2 results, was achieved in macerate B_80 followed by biska sample B30, both characterized by 40% v/v of ethanol. In the macerates obtained, all the phenolic compounds detected originate exclusively from mistletoe, as ethanol of agricultural origin was used as the water–ethanol base, whereas in the biska samples, the phenolic compounds might originate from both mistletoe and other plants or from added honey.
3.4. Biological Activity
3.4.1. Antioxidative Activity
The literature showed that mistletoe extracts exhibit an antioxidant activity that depends on the qualitative and quantitative composition of phytochemicals, such as phenolic compounds [10,50,55,66,67,68,69,70]. The antioxidant activity of macerates and biska samples was measured by two methods: FRAP and DPPH (Table 1 and Table 2). The results of the antioxidant activity of the macerates showed the same pattern for both methods used (FRAP and DPPH): with an increase in the mass concentration of mistletoe and the volume fraction of ethanol, the antioxidant activity also increases. The antioxidant activity of the macerates presented values from 0.69 (A_20) to 5.79 (C_80) mM Trolox with FRAP and from 4.37 (A_20) to 63.19% (D_80) of DPPH inhibition, reflecting the content of TPC and TFC in the macerates (Table 2). PCA results (Figure 2) also showed that the antioxidant activity of the macerates (FRAP and DPPH) correlated with TPC and strongly connected with TFC. In addition, the calculated Pearson’s correlation coefficients showed a very high correlation (r2 = 0.92) between the TPC and FRAP antioxidant activity assay and a high correlation (r2 = 0.74) for the DPPH assay. The highest correlation was observed between TFC and antioxidant activity (r2 = 0.91 for DPPH and r2 = 0.97 for FRAP assay), suggesting that flavonoids have significant antioxidant potential. A strong correlation between the content of phenolic compounds and antioxidant activity was also confirmed in the research of Pietrzak et al. [71] and Stefanucci et al. [55]. In addition, most phenolic compounds from the flavonoid group (17 in total) were identified in the analyzed macerate and biska samples, and it can be said that the flavonoids are the carriers of the antioxidant activity of mistletoe macerate, which was also confirmed in studies on the antioxidant activity of Viscum coloratum mistletoe [67,68]. Although the phenolic compounds contribute to the antioxidant activity, it is the result of the synergistic effect of all bioactive mistletoe compounds, e.g., the viscotoxin proteins, as found in the study by Roman et al. [72].
The antioxidant effect of strong alcoholic beverages depends mainly on the amount and type of phenolic compounds present. Pure distillates do not contain phenolic compounds, because the production process and their antioxidant effect are negligible. However, wooden barrel-aged distillates, such as grain, grape, or plum spirits, have an average antioxidant activity of 0.53 mM Trolox due to the extraction of phenolic compounds from the wood. Herbal (1.18 mM Trolox) and fruit liqueurs (9.54 mM Trolox) showed the highest average antioxidant activity measured by the FRAP method, as well as the antiradical activity measured by the DPPH method (about 1.6 mM Trolox) [3]. Many studies report the antioxidant efficacy of alcoholic beverages containing different herbs [22,43] and fruits [73], rose petals [19], walnut [46], myrtle berry [74], or carob [24]. The antioxidant activity of biska samples measured by the FRAP method ranges from 0.28 (B33) to 6.91 (B24) mM Trolox, and that measured by the DPPH method ranges from 1.67 (B22) to 70.99% (B20) inhibition of DPPH radicals (Table 1). Biska samples possessing a high TPC (B22 and B24) was also found to be the most effective in terms of reducing ability measured by FRAP and scavenging DPPH radicals among all analyzed samples. This wide ranges of antioxidant activity values might be related to the biska production conditions or/and characteristics of plant material, like origin and season.
3.4.2. Antiproliferative Activity
Most of the scientific research on white mistletoe (Viscum album L.) deals with its antitumor activity. Furthermore, standardized water preparations of white mistletoe are used in antitumor therapy in the official phytopharmaceutical practice of some European countries [75,76]. Numerous studies indicate that aqueous extracts of mistletoe have cytotoxic and immunomodulating properties, improve patient tolerance to chemotherapy, and thereby improve the quality of life of patients with ovarian cancer, cervical cancer, neuroblastoma, glioma, and lung cancer [52,76,77]. The use of different solvents as well as extraction conditions affects the chemical composition of the mistletoe extract, and thus the in vitro and in vivo antitumor activity. The cytotoxic effect of water–alcohol tinctures of mistletoe has been proven on tumor Ehrlich cells [78] and the proliferation of tumor HeLa cells [79], which indicates that biologically active compounds soluble in ethanol also contribute to the antitumor activity of the mistletoe extracts. The antiproliferative effect of mistletoe macerates with the highest mass concentration of plant material (A_80, B_80, C_80, and D_80) and selected biska samples (B20, B24, B33, and B34) was tested on the tumor HeLa and on the normal HaCaT human cell line. From the obtained results (Figure 3), the macerates affected the viability of tumor HeLa cells in a dose-dependent manner, which is in agreement with the literature [52,66,71,80].
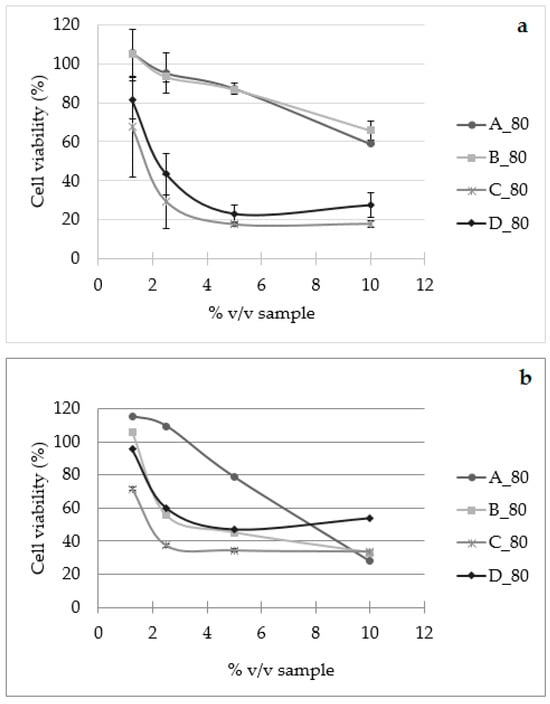
Figure 3.
Cell viability (%) of HeLa (a) and HaCaT (b) cells after 72 h of treatment with macerates (A_80, B_80, C_80, and D_80).
Macerates C_80 and D_80 showed an antiproliferative effect even at the lowest applied volume fraction of 1.25% v/v, where the survival was 67.69 and 81.38%, while macerates A_80 and B_80 showed a more pronounced antiproliferative effect at volume fractions higher than 5% v/v. The greatest antiproliferative effect was shown by macerates C_80 and D_80 in volume fractions of 5% v/v, inhibiting the growth of 82.41 and 76.9% of HeLa cells compared to control cells (Figure 3). However, the tested macerates showed an antiproliferative effect also on normal HaCaT cells (Figure 3), where A_80 was effective, inhibits cell growth in a dose-dependent manner, and has the greatest antiproliferative effect achieved at a volume fraction of 10% v/v, inhibiting the growth of 72.10% of cells. Other macerates (B_80, C_80, and D_80) show significant antiproliferative activity at volume fractions greater than 2.5% v/v. Since water–ethanol bases, i.e., 25 and 40% v/v ethanol, showed no antiproliferative effect in either cell line up to the highest volume fraction of 20% v/v used, it can be assumed that the observed antiproliferative effect of macerates A_80 and B_80 is due to the effect of the compounds extracted from the mistletoe. For the preparation of the macerates C_80 and D_80, 55 and 70% v/v ethanol were used as the solvent, so it can be assumed that the observed inhibitory effect of the mentioned macerates is due to the effect of ethanol and extracted mistletoe compounds. Selected biska samples (40% v/v ethanol) did not show an antiproliferative effect on the HeLa tumor cell line, but did on the HaCaT cell line in a dose-dependent manner (Figure 4).

Figure 4.
Cell viability (%) of HeLa (a) and HaCaT (b) cells after 72 h of treatment with biska samples (B20, B24, B33, and B34).
According to the literature, the cytotoxic and cytostatic activities of mistletoe alcoholic extracts in human and rat cell lines depend on the Viscum species, as well as the host tree, plant parts used, and concentration of the bioactive compounds [12,51].
4. Conclusions
Traditional foods and drinks are part of people’s cultural and historical identity. These products are usually homemade according to traditional recipes. Biska, a mistletoe herbal spirit, is one of these products. As part of the Croatian gastronomic offering, it is important to ensure its consistent quality, health safety, and sensory properties, which depend on the raw materials used (water–ethanol base and mistletoe characteristics, addition of other herbs) and maceration process. The results of this study confirmed the effects of the different maceration parameters on the total phenolic and flavonoid contents. The results showed that the macerates and the biska samples contained phenolic compounds of mistletoe, with most of them being from the classes of phenolic acids and flavonoids as well as coumarins. Among them, quinic acid was the most abundant, followed by caffeic and sinapic acid, scopoletin, and esculetin. The biological activity of mistletoe macerates and biska samples (antioxidant and antiproliferative activity) cannot be attributed to the phenolic compounds alone, but is the result of the synergistic effect of all bioactive mistletoe compounds. The parameters of the mistletoe maceration process that yielded the highest total phenolic content are 80 g/L of mistletoe, a 55% v/v water–ethanol base, and a 21-day maceration duration. Based on these results as well as the results of our previous study [25], we can suggest that 40–55% ethanol and 40–80 g/L of mistletoe should be used for the production of aromatic mistletoe macerates with improved phytochemical and biological value. Further studies should include the influence of mistletoe maceration parameters on the concentration of other biologically active compounds (e.g., viscotoxins and lectins), and the influence of maceration parameters on the sensory analysis of the prepared mistletoe herbal spirits.
Author Contributions
Conceptualization, K.H.Č. and J.M.; methodology, K.H.Č., J.M. and D.S.; software, T.L. and D.S.; validation, J.M. and T.L.; formal analysis, K.H.Č., Z.Z. and K.R.; investigation, K.H.Č.; resources, S.R., D.D. and D.S.; data curation, K.H.Č. and T.L.; writing—original draft preparation, K.H.Č. and J.M.; writing—review and editing, D.S., J.M., K.R., S.R., Z.Z. and D.D.; visualization, K.H.Č. and J.M.; supervision, J.M. All authors have read and agreed to the published version of the manuscript.
Funding
This research received no external funding.
Institutional Review Board Statement
Not applicable.
Informed Consent Statement
Not applicable.
Data Availability Statement
The original contributions presented in the study are included in the article, further inquiries can be directed to the corresponding author.
Conflicts of Interest
The authors declare no conflicts of interest.
References
- Tonutti, I.; Liddle, P. Aromatic plants in alcoholic beverages. A review. Flavour Fragr. J. 2010, 25, 341–350. [Google Scholar] [CrossRef]
- Veljković, V.B.; Stanković, M.Z. Herbs used in alcoholic drinks. In Encyclopedia of Food Sciences and Nutrition, 2nd ed.; Caballero, B., Trugo, L.C., Finglas, M., Eds.; Academic Press: Cambridge, MA, USA; Elsevier: Amsterdam, The Netherlands, 2003; pp. 3098–3107. [Google Scholar]
- Mrvčić, J.; Posavec, S.; Kazazić, S.; Stanzer, D.; Peša, A.; Stehlik-Tomas, V. Spirit drinks: A source of dietary polyphenols. Croat. J. Food Sci. Technol. 2012, 4, 102–111. [Google Scholar]
- Rodríguez-Solana, R.; Salgado, J.M.; Domínguez, J.M.; Cortés-Diéguez, S. Phenolic compounds and aroma-impact odorants in herb liqueurs elaborated by maceration of aromatic and medicinal plants in grape marc distillates. J. Inst. Brew. 2016, 122, 653–660. [Google Scholar] [CrossRef]
- Rodríguez-Solana, R.; Salgado, J.M.; Pérez-Santín, E.; Romano, A. Effect of carob variety and roasting on the antioxidant capacity, and the phenolic and furanic contents of carob liquors. J. Sci. Food Agric. 2019, 99, 2697–2707. [Google Scholar] [CrossRef] [PubMed]
- Andreou, V.; Strati, I.F.; Fotakis, C.; Liouni, M.; Zoumpoulakis, P.; Sinanoglou, V.J. Herbal distillates: A new era of grape marc distillates with enriched antioxidant profile. Food Chem. 2018, 253, 171–178. [Google Scholar] [CrossRef] [PubMed]
- Petrović, M.; Vukosavljević, P.; Đurović, S.; Ntić, M.; Gorjanović, S. New herbal bitter liqueur with high antioxidant activity and lower sugar content: Innovative approach to liqueurs formulations. J. Food Sci. Technol. 2019, 56, 4465–4473. [Google Scholar] [CrossRef] [PubMed]
- Luczaj, L.; Jug-Dujaković, M.; Dolina, K.; Vitasović-Kosić, I. Plants in alcoholic beverages on the Croatian islands, with special reference to rakija travarica. J. Ethnobiol. Ethnomed. 2019, 15, 51. [Google Scholar] [CrossRef] [PubMed]
- Nazaruk, J.; Orlikowski, P. Phytochemical profile and therapeutic potential of Viscum album L. Nat. Prod. Res. 2016, 30, 373–385. [Google Scholar] [CrossRef]
- Pietrzak, W.; Nowak, R. Impact of Harvest Conditions and Host Tree Species on Chemical Composition and Antioxidant Activity of Extracts from Viscum album L. Molecules 2021, 26, 3741. [Google Scholar] [CrossRef]
- Kleszken, E.; Timar, A.V.; Memete, A.R.; Miere, F.; Vicas, S.I. On Overview of Bioactive Compounds, Biological And Pharmacological Effects Of Mistletoe (Viscum Album L.). Pharmacophore 2022, 13, 10–26. [Google Scholar] [CrossRef]
- Melo, M.N.d.O.; Batista, J.V.d.C.; Peñaloza, E.M.C.; Oliveira, A.P.; Garrett, R.; Baumgartner, S.; Holandino, C. A Scoping Review of Genus Viscum: Biological and Chemical Aspects of Alcoholic Extracts. Plants 2023, 12, 1811. [Google Scholar] [CrossRef]
- Hussain, M.A.; Khan, M.Q.; Hussain, N.; Habib, T. Antibacterial and Antifungal Potential of Leaves and Twigs of Viscum album L. J. Med. Plants Res. 2011, 5, 5545–5549. [Google Scholar]
- Anatole, P.C.; Jeanne, N.; Marieta, C. Polyphenol Contents of Five of Medicinal Plants from Cameroon and Effects of Their Extracts on Antioxidant Capacities of Human Breast Cancer Cells. Toxicol. Environ. Chem. 2014, 96, 1120–1130. [Google Scholar]
- Yoo, J.-M.; Yang, J.-H.; Kim, Y.S.; Yang, H.J.; Cho, W.-K.; Ma, J.Y. Inhibitory Effects of Viscum coloratum Extract on IgE/Antigen- Activated Mast Cells and Mast Cell-Derived Inflammatory Mediator-Activated Chondrocytes. Molecules 2016, 22, 37. [Google Scholar] [CrossRef]
- Radenkovic, M.; Ivetic, V.; Popovic, M.; Brankovic, S.; Gvozdenovic, L. Effects of Mistletoe (Viscum album L., Loranthaceae) Extracts on Arterial Blood Pressure in Rats Treated with Atropine Sulfate and Hexocycline. Clin. Exp. Hypertens. 2009, 31, 11–19. [Google Scholar] [CrossRef]
- Sun, C.; Wu, Z.; Wang, Z.; Zhang, H. Effect of Ethanol/Water Solvents on Phenolic Profiles and Antioxidant Properties of Beijing Propolis Extracts. Evid. Based Complement. Altern. Med. 2015, 2015, 595393. [Google Scholar] [CrossRef]
- Altemimi, A.; Lakhssassi, N.; Baharlouei, A.; Watson, D.G.; Lightfoot, D.A. Phytochemicals: Extraction, Isolation, and Identification of Bioactive Compounds from Plant Extracts. Plants 2017, 6, 42. [Google Scholar] [CrossRef]
- Cendrowski, A.; Ścibisz, I.; Kieliszek, M.; Kolniak-Ostek, J.; Mitek, M. UPLCPDA-Q/TOF-MS Profile of Polyphenolic Compounds of Liqueurs from Rose Petals (Rosa rugosa). Molecules 2017, 22, 1832. [Google Scholar] [CrossRef]
- Zhang, Q.; Lin, L.; Ye, W. Techniques for extraction and isolation of natural products: A comprehensive review. Chin. Med. J. 2018, 13, 20. [Google Scholar] [CrossRef] [PubMed]
- Rodríguez-Solana, R.; Vázquez-Araújo, L.; Salgado, J.M.; Domínguez, J.M.; Cortés-Diéguez, S. Optimization of the process of aromatic and medicinal plant maceration in grape marc distillates to obtain herbal liqueurs and spirits. J. Sci. Food Agric. 2016, 96, 4760–4771. [Google Scholar] [CrossRef] [PubMed]
- Rodríguez-Solana, R.; Esteves, E.; Mansinhos, I.; Gonçalves, S.; Pérez-Santín, E.; Galego, L.; Romano, A. Influence of elaboration process on chemical, biological, and sensory characteristics of European pennyroyal liqueurs. J. Sci. Food Agric. 2021, 101, 4076–4089. [Google Scholar] [CrossRef]
- Caldeira, I.; Lopes, D.; Delgado, T.; Canas, S.; Anjos, O. Development of blueberry liquor: Influence of distillate, sweetener and fruit quantity. J. Sci. Food Agric. 2018, 98, 1088–1094. [Google Scholar] [CrossRef]
- Hanousek Čiča, K.; Mrvčić, J.; Srečec, S.; Filipan, K.; Blažić, M.; Stanzer, D. Physicochemical and aromatic characterization of carob macerates produced by different maceration conditions. Food Sci. Nutr. 2020, 8, 942–954. [Google Scholar] [CrossRef]
- Hanousek Čiča, K.; Lukin, P.; Derewiaka, D.; Mrvčić, J.; Stanzer, D. Chemical Composition, Physical Properties, and Aroma Profile of Ethanol Macerates of Mistletoe (Viscum album). Beverages 2022, 8, 46. [Google Scholar] [CrossRef]
- Singleton, V.L.; Rossi Junior, J.A. Colorimetry of total phenolics with phosphomolybdic-phosphotungstic acid reagents. Am. J. Enol. Vitic. 1965, 16, 144–158. [Google Scholar] [CrossRef]
- Pekal, A.; Pyrzynska, K. Evaluation of Aluminium Complexation Reaction for Flavonoid Content Assay. Food Anal. Methods 2014, 7, 1776–1782. [Google Scholar] [CrossRef]
- Elez Garofulić, I.; Zorić, Z.; Pedisić, S.; Brnčić, M.; Dragović-Uzelac, V. UPLC-MS2 profiling of blackthorn flower polyphenols isolated by ultrasound-assisted extraction. J. Food Sci. 2018, 83, 2782–2789. [Google Scholar] [CrossRef]
- Benzie, F.F.; Strain, J.J. Ferric reducing/antioxidant power assay: Direct measure of total antioxidant activity of biological fluids and modified version for simultaneous measurement of total antioxidant power and ascorbic acid concentration. Methods Enzymol. 1999, 299, 15–23. [Google Scholar]
- Brand-Williams, W.; Cuvelier, M.E.; Berset, C. Use of a free radical method to evaluate antioxidant activity. LWT 1995, 28, 25–30. [Google Scholar] [CrossRef]
- Coelho, E.M.; de Souza, M.E.A.O.; Corrêa, L.C.; Viana, A.C.; de Azevêdo, L.C.; dos Santos Lima, M. Bioactive Compounds and Antioxidant Activity of Mango Peel Liqueurs (Mangifera indica L.) Produced by Different Methods of Maceration. Antioxidants 2019, 8, 102. [Google Scholar] [CrossRef] [PubMed]
- Jovanović, A.; Petrović, P.; Ðorđević, V.; Zdunić, G.; Šavikin, K.; Bugarski, B. Polyphenols extraction from plant sources. Lek. Sirovine 2017, 37, 45–49. [Google Scholar] [CrossRef]
- Galego, L.R.; da Silva, J.P.; Almeida, V.R.; Bronze, M.R.; Boas, L.V. Preparation of novel distinct highly aromatic liquors using fruit distillates. Int. J. Food Sci. Technol. 2011, 46, 67–73. [Google Scholar] [CrossRef]
- Vuleta, G.; Milic, J.; Savic, S. Farmaceutska Tehnologija (Pharmaceutical Technology); Faculty of Pharmacy, University of Belgrade: Belgrade, Serbia, 2012. [Google Scholar]
- Senica, M.; Mikulic-Petkovsek, M. Changes in beneficial bioactive compounds in eight traditional herbal liqueurs during a one-month maceration process. J. Sci. Food Agric. 2019, 100, 343–353. [Google Scholar] [CrossRef] [PubMed]
- Uma, D.B.; Ho, C.W.; Aida, W.M. Optimization of extraction parameters of total phenolic compounds from henna (Lawsonia inermis) leaves. Sains Malays. 2010, 39, 119–128. [Google Scholar]
- Urech, K.; Baumgartner, S. Chemical Constituents Of Viscum album L.: Implications for the Pharmaceutical Preparation of Mistletoe. In Mistletoe: From Mythology to Evidence-Based Medicine, 4th ed.; Zänker, K.S., Kaveri, S.V., Eds.; Karger Publishing: Basel, Switzerland, 2015; pp. 11–23. [Google Scholar]
- Cosmulescu, S.; Trandafir, I.; Nour, V.; Ionica, M.; Tutulescu, F. Phenolics Content, Antioxidant Activity and Color of Green Walnut Extracts for Preparing Walnut Liquor. Not. Bot. Horti Agrobot. 2014, 42, 551–555. [Google Scholar] [CrossRef]
- Bamba, B.S.B.; Shi, J.; Tranchant, C.C.; Xue, S.J.; Forney, C.F.; Lim, L.-T. Influence of Extraction Conditions on Ultrasound-Assisted Recovery of Bioactive Phenolics from Blueberry Pomace and Their Antioxidant Activity. Molecules 2018, 23, 1685. [Google Scholar] [CrossRef] [PubMed]
- Ćujić, N.; Šavikin, K.; Janković, T.; Pljevljakušić, D.; Zdunić, G.; Ibric, S. Optimization of polyphenols extraction from dried chokeberry using maceration as traditional technique. Food Chem. 2016, 194, 135–142. [Google Scholar] [CrossRef] [PubMed]
- Dent, M.; Dragović-Uzelac, V.; Penić, M.; Brnčić, M.; Bosiljkov, T.; Levaj, B. The effect of extraction solvents, temperature and time on the composition and mass fraction of polyphenols in Dalmatian wild sage (Salvia officinalis L.) extracts. Food Technol. Biotechnol. 2013, 51, 84–91. [Google Scholar]
- Cianciosi, D.; Forbes-Hernández, T.Y.; Afrin, S.; Gasparrini, M.; Reboredo-Rodriguez, P.; Manna, P.P.; Zhang, J.; Bravo, L.L.; Martínez, F.S.; Agudo, P.T.; et al. Phenolic Compounds in Honey and Their Associated Health Benefits: A Review. Molecules 2018, 22, 2322. [Google Scholar] [CrossRef] [PubMed]
- Issa-Issa, H.; Ivanišová, E.; Noguera-Artiaga, L.; Kántor, A.; López-Lluch, D.; Kačániová, M.; Szumny, A.; Carbonell-Barrachina, A.A. Effect of the herbs used in the formulation of a Spanish herb liqueur, Herbero de la sierra de Mariola, on its chemicaland functional compositions and antioxidant and antimicrobial activities. Eur. Food Res. Technol. 2019, 245, 1197–1206. [Google Scholar] [CrossRef]
- Gorjanović, S.Z.; Novaković, M.M.; Potkonjak, N.I.; Sužnjević, D.Z. Antioxidant activity of wines determined by a polarographic assay based on hydrogen peroxide scavenge. J. Agric. Food Chem. 2010, 58, 4626–4631. [Google Scholar] [CrossRef]
- Gorjanović, S.Z.; Novaković, M.M.; Vukosavljević, P.V.; Pastor, F.T.; Tešević, V.; Sužnjević, D.Ž. Polarographic assay based on hydrogen peroxide scavenging in determination of antioxidant activity of strong alcohol beverages. J. Agric. Food Chem. 2010, 58, 8400–8406. [Google Scholar] [CrossRef]
- Alamprese, C. Characterization and antioxidant activity of nocino liqueur. Food Chem. 2005, 90, 495–502. [Google Scholar] [CrossRef]
- Lee, H.K.; Choi, Y.M.; Noh, D.O.; Suh, H.J. Antioxidant effect of Korean traditional lotus liquor (Yunyupju). Int. J. Food Sci. Technol. 2005, 40, 709–715. [Google Scholar] [CrossRef]
- Montero, L.; Schmitz, O.J.; Meckelmann, S.W. Chemical characterization of eight herbal liqueurs by means of liquid chromatography coupled with ion mobility quadrupole time-of-flight mass spectrometry. J. Chromatogr. A 2020, 1631, 461560. [Google Scholar] [CrossRef]
- Luczkiewicz, M.; Cisowski, W.; Kaiser, P.; Ochocka, R.; Piotrowski, A. Comparative analysis of phenolic acids in mistletoe plants from various hosts. Acta Pol. Pharm. Drug Res. 2001, 58, 373–379. [Google Scholar]
- Vicas, S.I.; Rugina, D.; Socaciu, C. Comparative Study about Antioxidant Activities of Viscum album from Different Host Trees, Harvested in Different Seasons. J. Med. Plants Res. 2011, 5, 2237–2244. [Google Scholar]
- Holandino, C.; de Melo, M.N.O.; Oliveira, A.P.; da Batista, J.V.C.; Capella, M.A.M.; Garrett, R.; Grazi, M.; Ramm, H.; Torre, C.D.; Schaller, G.; et al. Phytochemical Analysis and in Vitro Anti-Proliferative Activity of Viscum album Ethanolic Extracts. BMC Complement. Med. Ther. 2020, 20, 215. [Google Scholar] [CrossRef]
- Melo, M.N.O.; Oliveira, A.P.; Wiecikowski, A.F.; Carvalho, R.S.; de Lima Castro, J.; de Oliveira, F.A.G.; Pereira, H.M.G.; da Veiga, V.F.; Capella, M.M.A.; Rocha, L.; et al. Phenolic Compounds from Viscum album Tinctures Enhanced Antitumor Activity in Melanoma Murine Cancer Cells. Saudi Pharm. J. 2018, 26, 311–322. [Google Scholar] [CrossRef] [PubMed]
- Ruan, J.; Yan, J.; Zheng, D.; Sun, F.; Wang, J.; Han, L.; Zhang, Y.; Wang, T. Comprehensive chemical profiling in the ethanol extract of Pluchea indica aerial parts by liquid chromatography/mass spectrometry analysis of its silica gel column chromatography fractions. Molecules 2019, 24, 2784. [Google Scholar] [CrossRef] [PubMed]
- Abdallah, H.M.; Farag, M.A.; Abdel-Naim, A.B.; Ghareib, S.A.; Abdel-Sattar, E.A. Mechanistic Evidence of Viscum schimperi (Viscaceae) Antihyperglycemic Activity: From a Bioactivity-Guided Approach to Comprehensive Metabolite Profiling. Phytother Res. 2015, 29, 1737–1743. [Google Scholar] [CrossRef]
- Stefanucci, A.; Zengin, G.; Llorent-Martinez, E.J.; Dimmito, M.P.; Della Valle, A.; Pieretti, S.; Ak, G.; Sinan, K.I.; Mollica, A. Viscum album L. Homogenizer-Assisted and Ultrasound-Assisted Extracts as Potential Sources of Bioactive Compounds. J. Food Biochem. 2020, 44, e13377. [Google Scholar] [CrossRef]
- Ali, A.; Bashmil, Y.M.; Cottrell, J.J.; Suleria, H.A.R.; Dunshea, F.R. LC-MS/MSQTOF Screening and Identification of Phenolic Compounds from Australian Grown Herbs and Their Antioxidant Potential. Antioxidants 2021, 10, 1770. [Google Scholar] [CrossRef]
- Vuolo, M.M.; Lima, V.S.; Junior, M.R.M. Phenolic compounds: Structure, classification, and antioxidant power. In Bioactive Compounds; Campos, M.R.S., Ed.; Woodhead Publishing: Sawston, UK, 2019; pp. 33–50. [Google Scholar]
- Haas, K.; Bauer, M.; Wollenweber, E. Cuticular waxes and flavonol aglycones of mistletoes. Z. Naturforsch. C 2003, 58, 464–470. [Google Scholar] [CrossRef]
- Carocho, M.; Barros, L.; Bento, A.; Santos-Buelga, C.; Morales, P.; Ferreira, I.C.F.R. Castanea sativa Mill. Flowers amongst the Most Powerful Antioxidant Matrices: A Phytochemical Approach in Decoctions and Infusions. Biomed. Res. Int. 2014, 2014, 232956. [Google Scholar] [CrossRef]
- Pinheiro, P.F.; Justino, G.C. Structural Analysis of Flavonoids and Related Compounds—A Review of Spectroscopic Applications. In Phytochemicals—A Global Perspective of Their Role in Nutrition and Health; Rao, V., Ed.; InTech: Rijeka, Croatia, 2012; pp. 33–56. [Google Scholar]
- Elez Garofulić, I.; Kruk, V.; Martić, A.; Martić, I.; Zorić, Z.; Pedisić, S.; Dragović, S.; Dragović-Uzelac, V. Evaluation of Polyphenolic Profile and Antioxidant Activity of Pistacia lentiscus L. Leaves and Fruit Extract Obtained by Optimized Microwave-Assisted Extraction. Foods 2020, 9, 1556. [Google Scholar] [CrossRef]
- Reis, S.F.; Rai, D.K.; Abu-Ghannam, N. Water at room temperature as a solvent for the extraction of apple pomace phenolic compounds. Food Chem. 2012, 135, 1991–1998. [Google Scholar] [CrossRef]
- Zeng, X.; Su, W.; Zheng, Y.; Liu, H.; Li, P.; Zhang, W.; Liang, Y.; Bai, Y.; Peng, W.; Yao, H. UFLC-Q-TOF-MS/MS-based screening and identification of flavonoids and derived metabolites in human urine after oral administration of Exocarpium Citri Grandis extract. Molecules 2018, 23, 895. [Google Scholar] [CrossRef]
- Feng, J.; Xiang, C.; Liang, H.; Zhao, Y.Y. Chemical constituents of isoflavones from vine stems of Millettia nitita var. hirsutissima. China J. Chin. Mater. Med. 2007, 34, 321–322. [Google Scholar]
- Ammar, S.; del Mar Contreras, M.; Belguith-Hadrich, O.; Bouaziz, M.; Segura-Carretero, A. New insights into the qualitative phenolic profile of Ficus carica L. fruits and leaves from Tunisia using ultra-high-performance liquid chromatography coupled to quadrupole-time-of-flight mass spectrometry and their antioxidant activity. RSC Adv. 2015, 5, 20035–20050. [Google Scholar] [CrossRef]
- Onay-Uçar, E.; Karagöz, A.; Arda, N. Antioxidant activity of Viscum album ssp. album. Fitoterapia 2006, 77, 556–560. [Google Scholar] [CrossRef]
- Leu, Y.L.; Hwang, T.L.; Chung, Y.M.; Hong, P.Y. The inhibition of superoxide anion generation in human neutrophils by Viscum coloratum. Chem. Pharm. Bull. 2006, 54, 1063–1066. [Google Scholar] [CrossRef]
- Yao, H.; Liao, Z.X.; Wu, Q.; Lei, G.Q.; Liu, Z.J.; Chen, D.F.; Chen, J.K.; Zhou, T.S. Antioxidative flavanone glycosides from the branches and leaves of Viscum coloratum. Chem. Pharm. Bull. 2006, 54, 133–135. [Google Scholar] [CrossRef]
- Vicas, S.; Rugina Socaciu, C. Antioxidant Activity of European Mistletoe (Viscum album). In Phytochemicals as Nutraceuticals—Global Approaches to Their Role in Nutrition and Health; Venkteteshwer, R., Ed.; InTech: Rijeka, Croatia, 2012; pp. 115–130. [Google Scholar]
- Choudhary, M.I.; Maher, S.; Begum, A.; Abbaskhan, A.; Ali, S.; Khan, A.; Shafique-ur-Rehman; Atta-ur-Rahman. Characterization and Antiglycation Activity of Phenolic Constituents from Viscum album (European Mistletoe). Chem. Pharm. Bull. 2010, 58, 980–982. [Google Scholar] [CrossRef]
- Pietrzak, W.; Nowak, R.; Gawlik-Dziki, U.; Lemieszek, M.K.; Rzeski, W. LC-ESI-MS/MS Identification of Biologically Active Phenolic Compounds in Mistletoe Berry Extracts from Different Host Trees. Molecules 2017, 22, 624. [Google Scholar] [CrossRef]
- Roman, G.P.; Neagu, E.; Radu, G.L. Antiradical activities of Salvia officinalis and Viscum album L. Extracts concentrated by ultrafiltration process. Acta Sci. Pol. Technol. Aliment 2009, 8, 47–58. [Google Scholar]
- Sokół-Łętowska, A.; Kucharska, A.Z.; Wińska, K.; Szumny, A.; Nawirska-Olszańska, A.; Mizgier, P.; Wyspiańska, D. Composition and antioxidant activity of red fruit liqueurs. Food Chem. 2014, 157, 533–539. [Google Scholar] [CrossRef]
- Serreli, G.; Jerković, I.; Gil, K.A.; Marijanović, Z.; Pacini, V.; Tuberoso, C.I.G. Phenolic Compounds, Volatiles and Antioxidant Capacity of White Myrtle Berry Liqueurs. Plant Foods Hum. Nutr. 2017, 72, 205–210. [Google Scholar] [CrossRef]
- Ochocka, J.R.; Piotrowski, A. Biologically active compounds from European mistletoe (Viscum album L.). Can. J. Plant Pathol. 2002, 24, 21–28. [Google Scholar] [CrossRef]
- Singh, B.N.; Saha, C.; Galun, D.; Upreti, D.K.; Bayry, J.; Kaveri, S.V. European Viscum album: A potent phytotherapeutic agent with multifarious phytochemicals pharmacological properties and clinical evidence. RSC Adv. 2016, 6, 23837–23857. [Google Scholar] [CrossRef]
- Tröger, W.; Galun, D.; Reif, M.; Schumann, A.; Stanković, N.; Milićević, M. Quality of life of patients with advanced pancreatic cancer during treatment with mistletoe: A randomized controlled trial. Deutsches Arzteblatt Int. 2014, 111, 493–502. [Google Scholar]
- Stan, R.; Hangan, A.; Dican, L.; Sevastre, B.; Hanganu, D.; Catoi, C.; Sarpataki, O.; Ionescu, C. Comparative Study Concerning Mistletoe Viscotoxins Antitumor Activity. Acta Biol. Hung. 2013, 64, 279–288. [Google Scholar] [CrossRef]
- Sarpataki, O.; Páll, E.; Sevastre-Berghian, A.C.; Stan, R.L.; Hanganu, D.; Benedec, D.; Hangan, A.C.; Sevastre, B.; Marcus, I. Antiproliferative effect of Viscum album alcoholic extract in vitro. Bull. UASVM Vet. Med. 2015, 72, 170–173. [Google Scholar] [CrossRef][Green Version]
- Vlad, D.C.; Popescu, R.; Dumitrascu, V.; Cimporescu, A.; Vlad, C.S.; Vágvölgyi, C.; Krisch, J.; Dehelean, C.; Horhat, F.G. Phytocomponents Identification in Mistletoe (Viscum album) Young Leaves and Branches, by GC-MS and Antiproliferative Effect on HEPG2 and MCF7 Cell Lines. Farmacia J. 2016, 64, 82–87. [Google Scholar]
Disclaimer/Publisher’s Note: The statements, opinions and data contained in all publications are solely those of the individual author(s) and contributor(s) and not of MDPI and/or the editor(s). MDPI and/or the editor(s) disclaim responsibility for any injury to people or property resulting from any ideas, methods, instructions or products referred to in the content. |
© 2024 by the authors. Licensee MDPI, Basel, Switzerland. This article is an open access article distributed under the terms and conditions of the Creative Commons Attribution (CC BY) license (https://creativecommons.org/licenses/by/4.0/).