Article

Aromatic Characterization of Graševina Wines from Slavonia and Podunavlje Sub-Regions

by
Mitja Martelanc
1,
Guillaume Antalick
1,
Tatjana Radovanović Vukajlović
1,
Branka Mozetič Vodopivec
1,
Melita Sternad Lemut
1,
Ahmad Hosseini
2,
Valentina Obradović
3,
Josip Mesić
3 and
Lorena Butinar
1,*
1
Wine Research Centre, University of Nova Gorica, Glavni Trg 8, 5271-SI Vipava, Slovenia
2
Center for Information Technologies and Applied Mathematics, University of Nova Gorica, Glavni Trg 8, 5271-SI Vipava, Slovenia
3
Faculty of Tourism and Rural Development Pozega, Josip Juraj Strossmayer University of Osijek, Vukovarska 17, 34000 Požega, Croatia
*
Author to whom correspondence should be addressed.
Beverages 2024, 10(2), 24; https://doi.org/10.3390/beverages10020024
Submission received: 29 January 2024 / Revised: 16 March 2024 / Accepted: 25 March 2024 / Published: 31 March 2024
(This article belongs to the Section Wine, Spirits and Oenological Products)

Abstract

:
This study investigated the chemical aromatic profiles of 60 volatile organic compounds (VOCs), including 21 terpenes, 6 norisoprenoids, 6 volatile phenols, 4 C-6 alcohols, and 23 esters, in Graševina wines originating from Slavonia and Podunavlje sub-regions (Croatia). Headspace solid-phase microextraction gas chromatography coupled with mass spectrometric detection (HS-SPME-GCMS) was used to assess 60 VOCs, and a novel HS-SPME-GCMS method for the determination of terpenes and norisoprenoids was developed and validated. Statistical analysis found no significant differences between VOCs present in Graševina wines and others wines (Chardonnay and Pinot gris); nonetheless, comparison of VOC fingerprints between different wines from the same producer showed that four terpenes (α-terpinene, γ-terpinene, 1,4-cineol, and 4-terpineol) were present in higher amounts in Graševina wines when compared to other wines. By exclusively examining VOCs within Graševina wines through the utilization of a heatmap and hierarchical clustering, a distinct visualization of samples and VOCs emerged, highlighting the vintage effect. Simultaneously, a partial least squares discriminant analysis model was developed with a confidence interval of 95%, demonstrating a noticeable distinction between samples originating from the western and eastern regions. Furthermore, by employing the heatmap using only VOCs from the terpene and norisoprenoidic groups, a clear separation of samples into two groups was observed based on geographical origin; namely, higher concentrations of norisoprenoids and terpenes were observed in the Slavonia sub-region. These results suggest that terpenes and norisoprenoids to a lower extent may be valuable aromatic markers for the regional typicality of Graševina wines.

1. Introduction

Welschriesling is a white grape variety originating from the Danube Basin, namely in the Slavonia and Podunavlje sub-regions situated in northeastern continental Croatia. Graševina (Croatian name for Welschriesling) is the most widely planted and economically important white variety in Croatia [1]. Welschriesling is also present in the regions of Eastern and Central Europe; however, its origin has not yet been fully proven. The latest DNA analysis showed that Welschriesling is probably the natural cross between the Italian variety Coccalona Nera and an unknown father variety [2].
Although Welschriesling wine is an important part of the wine market in Europe, its aromatic profile has not been studied extensively. A semi-quantitative study was performed, in which 12 esters, 1 terpenoid nerol, and 1 norisoprenoid β-damascenone were analyzed to assess the chemical aromatic profile of eight Welschriesling wines from Burgenland, Leithagebirge, Austria [3]. The outcome of the aromatic profile was apple-like aromas, which were further differentiated into green and mature apple profiles by the addition of exotic aromas and meadow flowers. It was also shown that soil, climate, geographical position, and vinification affect the aroma profile of Welschriesling wines. A study on the effects of controlled vinification on wine aroma profile has also been conducted [4]. However, both studies lack quantitative data on volatile compounds, and therefore, no concrete connection between volatile chemical composition and wine aroma perception could be deduced.
In contrast, Šuklje and Čus quantified 28 aromatic compounds, including varietal thiols, esters, higher alcohols, and monoterpene alcohols in 8 commercial Welschriesling wines from Slovenia, and investigated the effects of commercial yeast starters and lactic acid bacteria on Welschriesling wines’ aromatic profile. It was concluded that varietal thiols could impact the aromatic profile of Welschriesling wines, and that malolactic fermentation caused an increase in 3-mercaptohexan-1-ol [5]. A complementary study suggested that the selection of grape clones of Graševina and yeast strains can also modulate varietal thiol wine composition [6]. In addition, four new clones of Graševina positioned in the Zagreb area were subjected to sensory evaluation and determination of volatile aromatic compounds [7].
To the best of our knowledge, there are no published studies assessing volatile compounds in Graševina wines originating from both the Slavonia and Podunavlje sub-regions (Croatia). Consequently, this study aimed to extend the knowledge about the volatile composition of Graševina wine, particularly by focusing on terpenoids and norisoprenoids, which have not yet been analyzed in such wine. The second objective of this study was to establish the potential impact of volatile fingerprints between both sub-regions based on statistical analyses.

2. Materials and Methods

2.1. Chemicals

Ester standards: Propyl acetate (99%), isobutyl acetate (97%), ethyl 2-methylbutyrate (99%), phenylethyl acetate (98%), trans-2 -hexen-1-ol (96%), cis-3-hexen-1-ol (98%), trans-3-hexen-1-ol (97%), ethyl propanoate (97%), butyl acetate (99%), hexanol (99%), Z-3-hexenyl acetate (98%), E-2-hexenyl acetate (98%), and ethyl dihydrocinnamate were supplied from Sigma Aldrich Chemie GmbH (Steinheim, Germany). Ethyl leucate (98%) was supplied from TIC (Tokyo Chemical Industry; Tokyo, Japan). Ethyl butyrate (99%), hexyl acetate (99%), isoamyl acetate (99%), ethyl isovalerate (99%), ethyl decanoate (99%), octyl acetate (99%), ethyl hexanoate (99%), ethyl octanoate (99%), and ethylphenyl acetate (99%) were purchased from Acros Organics BV (Geel, Belgium). Ethyl isobutyrate (98%) and ethyl cinnamate (98%) were obtained from Alfa Aesar (Kandel, Germany). Absolute ethanol (99.8%, HPLC grade) was obtained from Honeywell (Riedel-de Haën, Germany). Milli-Q water was obtained using a Purelab Option-Q system (ELGA LabWater, High Wycombe, UK). Sodium chloride (purity 99%) was supplied from Chemlab (Zedelgem, Belgium). Internal standards for esters: ethyl butyrate-4,4,4 d3 (99.8%), ethyl hexanoate d11 (98.7%), ethyl octanoate d15 (98.8%), and ethyl trans cinnamate d5 (99.4%) were purchased from C/D/N Isotopes Inc. (Pointe-Claire, QC, Canada). Volatile phenols: methyl salicylate (99%), 4-ethyl guaiacol (98%), guaiacol (99%), and 2-methoxy-4-vinylphenol (4-vinyl guaiacol) (98%) were purchased from Sigma Aldrich (Steienheim, Germany). 4-Vinyl phenol (10%) was purchased from BIOSYNTH (Carbosynth, Compton, UK). 4-Ethyl phenol (97%) was purchased from Acros Organics BV (Geel, Belgium). Terpenes and norisoprenoids: 3-carene (95%), α-terpinene (95%), γ-terpinene (97%), 1,4-cineole (95%), eucalyptol (99%), p-cymene (99.5%), α-terpinolene (95%), α-ionone (90%), β-ionone (96%), linalool (97%), cis-geraniol (97%), rose oxide (99%), 4-terpineol (95%), trans-β-damascenone (98%), nerolidol (97%), and linalool oxide (cis and trans) (97%) were purchased from Sigma Aldrich (Steienheim, Germany). α-Terpineol (97%), citronellol (95%), trans-geraniol (99%), and limonene (96%) were supplied by Thermoscientific, Acros Organics BV (Geel, Belgium). TDN (1,1,6-trimethyl-1,2-dihydronaphthalene (80%) was purchased from BIOSYNTH (Carbosynth, Compton, UK). Vitispirane 1 and 2 (98%) and hotrienol (97%) were purchased from Eptes Analytical (Vevey, Switzerland). Internal standards for quantification of terpenes were as follows: geraniol d6, linalool d5, 2-octanol, and ethyl trans cinnamate d5. The deuterated standards were purchased from EPTES Sarl (Vevey, Switzerland).

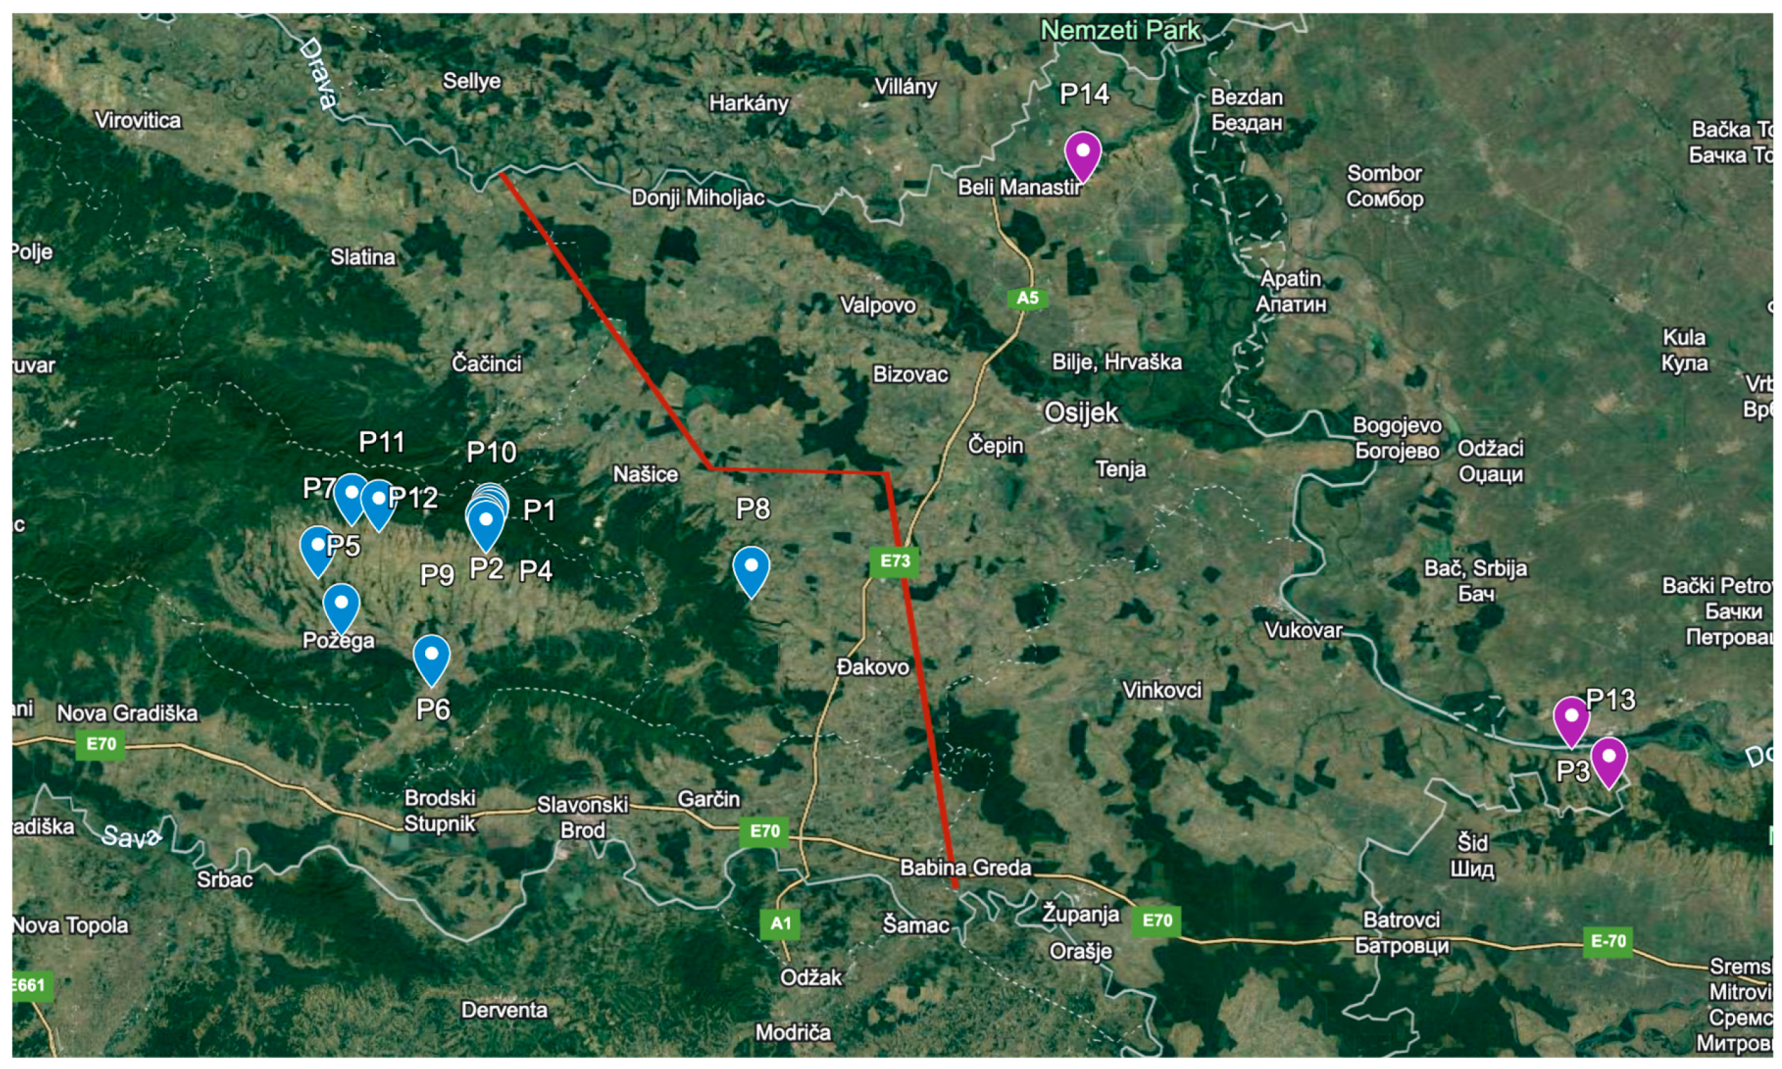
2.2. Commercial Samples

Commercial wine samples were purchased in stores or from producers located in the Slavonia (27 samples) and Podunavlje (9 samples) sub-regions in 2021 and 2022, namely, 36 Graševina wine samples with vintages between 2019 and 2021, as shown in the Supplementary Materials (Table S1). Additionally, we purchased nine samples of Chardonnay and Pinot Gris from the same producers as the Graševina samples. After purchase, the wines were stored at +16 °C in a wine fridge. Immediately after the wine bottles were opened, the wine samples were separately fully loaded into a 150 mL amber glass bottle, airtight sealed, and stored at +4 °C in a fridge. Volatile compounds were analyzed in September 2022.

2.3. Determination of Volatile Compounds

Selected volatile organic compounds (VOCs) were determined in the wine samples using an automated robotic system for solid-phase micro-extraction (SPME) in headspace (HS) and injected into a gas chromatograph coupled with a mass spectrometric detector (GC-MS). Esters, C6 alcohols, and volatile phenols were analyzed using two methods adapted from a previously published protocol [8,9]. Samples were extracted by headspace Solid Phase Micro-Extraction (HS–SPME) using an SPME fiber assembly (50/30 μm DVB/CAR/PDMS, Stableflex, 24 Ga, Autosampler, Gray (Supelco, St. Louis, MO, USA). To a 20 mL SPME vial, 3 mL of the wine sample was added to 2 g NaCl and 3 mL deionized water, and a 20 μL solution of internal deuterated standards was added. Terpenes and norisoprenoids were quantified using the same method as in the above-mentioned volatiles with a slightly different temperature program: held at 40 °C for 5 min, then raised to 65 °C at a rate of 3 °C/min, held for 10 min, then raised to 90 °C at 3 °C/min, raised to 130 °C at 10 °C/min, and finally raised to 240 °C at 4 °C/min and held for 10 min. The method validation for the determination of terpenes was performed by checking the recovery, linearity, and repeatability, as shown in Table 1. To study the presence of carryover, two blank samples (6 mL of Milli-Q water) were analyzed, and the calibration sample with the highest calibration point for each compound was analyzed twice, followed by the injection of two blank samples, and this was repeated six times. Carryover was negligible, that is, under 0.1% for all the measured compounds. To quantify the analyzed VOCs, internal standards were spiked accordingly. Each internal standard was separately dissolved in ethanol to obtain a stock solution. Subsequently, two stock mix solutions were prepared separately, one for terpenes and norisoprenoids and one for esters and volatile phenols. The concentration levels in all solutions are presented in Table 2. Internal standard stock solutions and internal standard mix stock solutions were stored at −80 °C.

2.4. Multivariate Data Analysis and Data Visualization

All computational endeavors, encompassing (multivariate) data analysis techniques, such as Heatmaps, Hierarchical Clustering, Boxplots, Scattergrams, Pearson’s Correlation Analysis, Principal Component Analysis (PCA), and Partial Least Squares-Discriminant Analysis (PLS-DA), were executed using data analysis add-on tools in Microsoft Excel, RStudio (R version 4.3.2), Minitab 21, and XLSTAT 2021. Analyses were conducted on a Lenovo PC operating on Microsoft Windows 10 OS.

3. Results and Discussion

3.1. Comparison of Aroma Compounds between Graševina Wines and Other Wines from the Same Producers

We analyzed 36 Graševina wine samples and 9 other wine samples (Pinot Gris and Chardonnay) in an attempt to identify VOCs that could potentially contribute to the aromatic typicality of Graševina wines in comparison with wines made from other varieties by the same producers. Wine samples with different vintages (2019, 2020, and 2021) were obtained from 14 producers located in two Croatian sub-regions, namely the Slavonia and Podunavlje sub-regions. The aromatic profile of the analyzed wine samples was determined by quantifying 60 VOCs from five different groups, namely 21 terpenes, 6 norisoprenoids, 6 volatile phenols, 4 C6 alcohols, and 23 esters. Concentration levels of all VOCs are available in Table S2 in the Supplementary Materials.
Quantification data for each analyzed VOC in each sample (data given in Supplementary Materials, Table S2) showed no distinct differences between Graševina wine samples and other wine samples (Chardonnay and Pinot gris). The effect of the winemaking protocol could potentially overlap the varietal differences for the targeted aromatic compounds. Interestingly, when comparing Chardonnay and/or Pinot gris wine samples with Graševina wines made by the same producers as shown in Figure 1, four terpenes, namely α-terpinen, γ-terpinene, 1,4-cineol and 4-terpineol, stood out, since they were predominantly present in higher concentrations in Graševina wines. The sensory impact of these monoterpenes on wine aroma is not well documented, except for 1,4-cineole, which has recently been studied [10]. Nevertheless, it seems that the concentrations of these monoterpenes in Graševina wines were well below their sensory thresholds, considering the case of γ-terpinene in matrices other than wine [11]. However, monoterpenes are known to contribute to wine aroma, even when their levels are lower than their sensory threshold, through complex synergistic effects [12,13]. Such complex sensory interactions between terpenes and other compounds cannot be excluded and require further investigation.

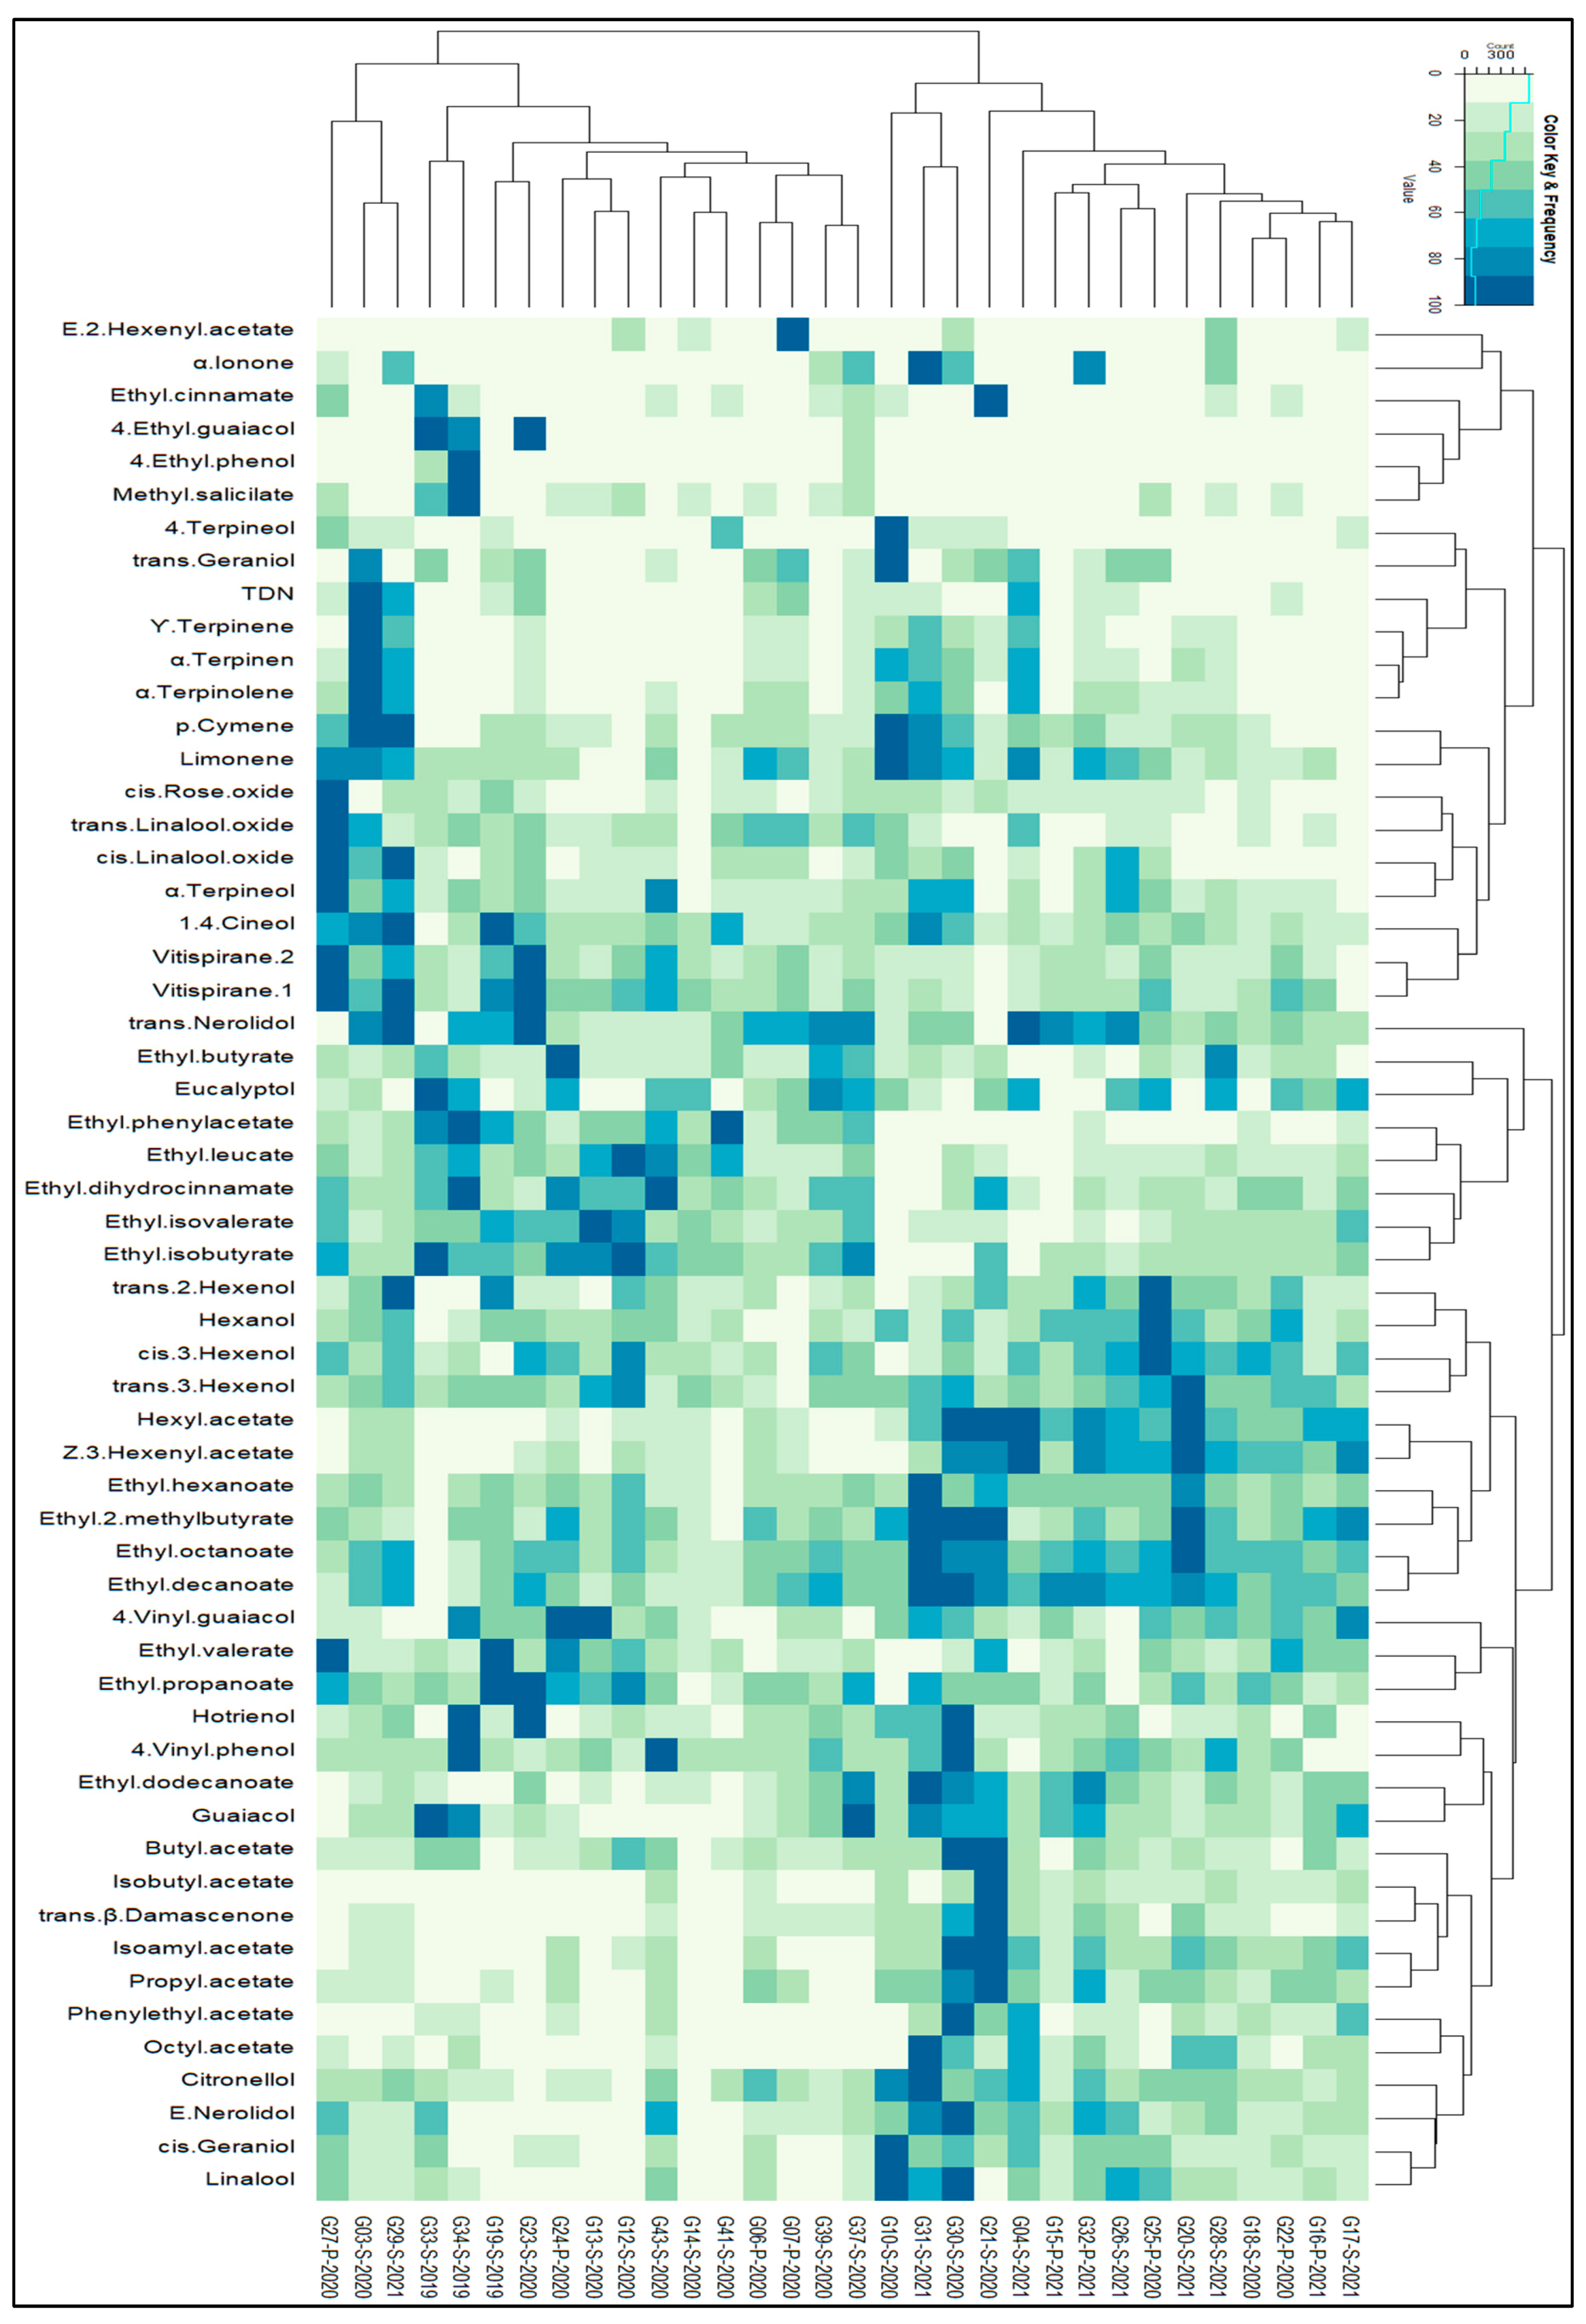
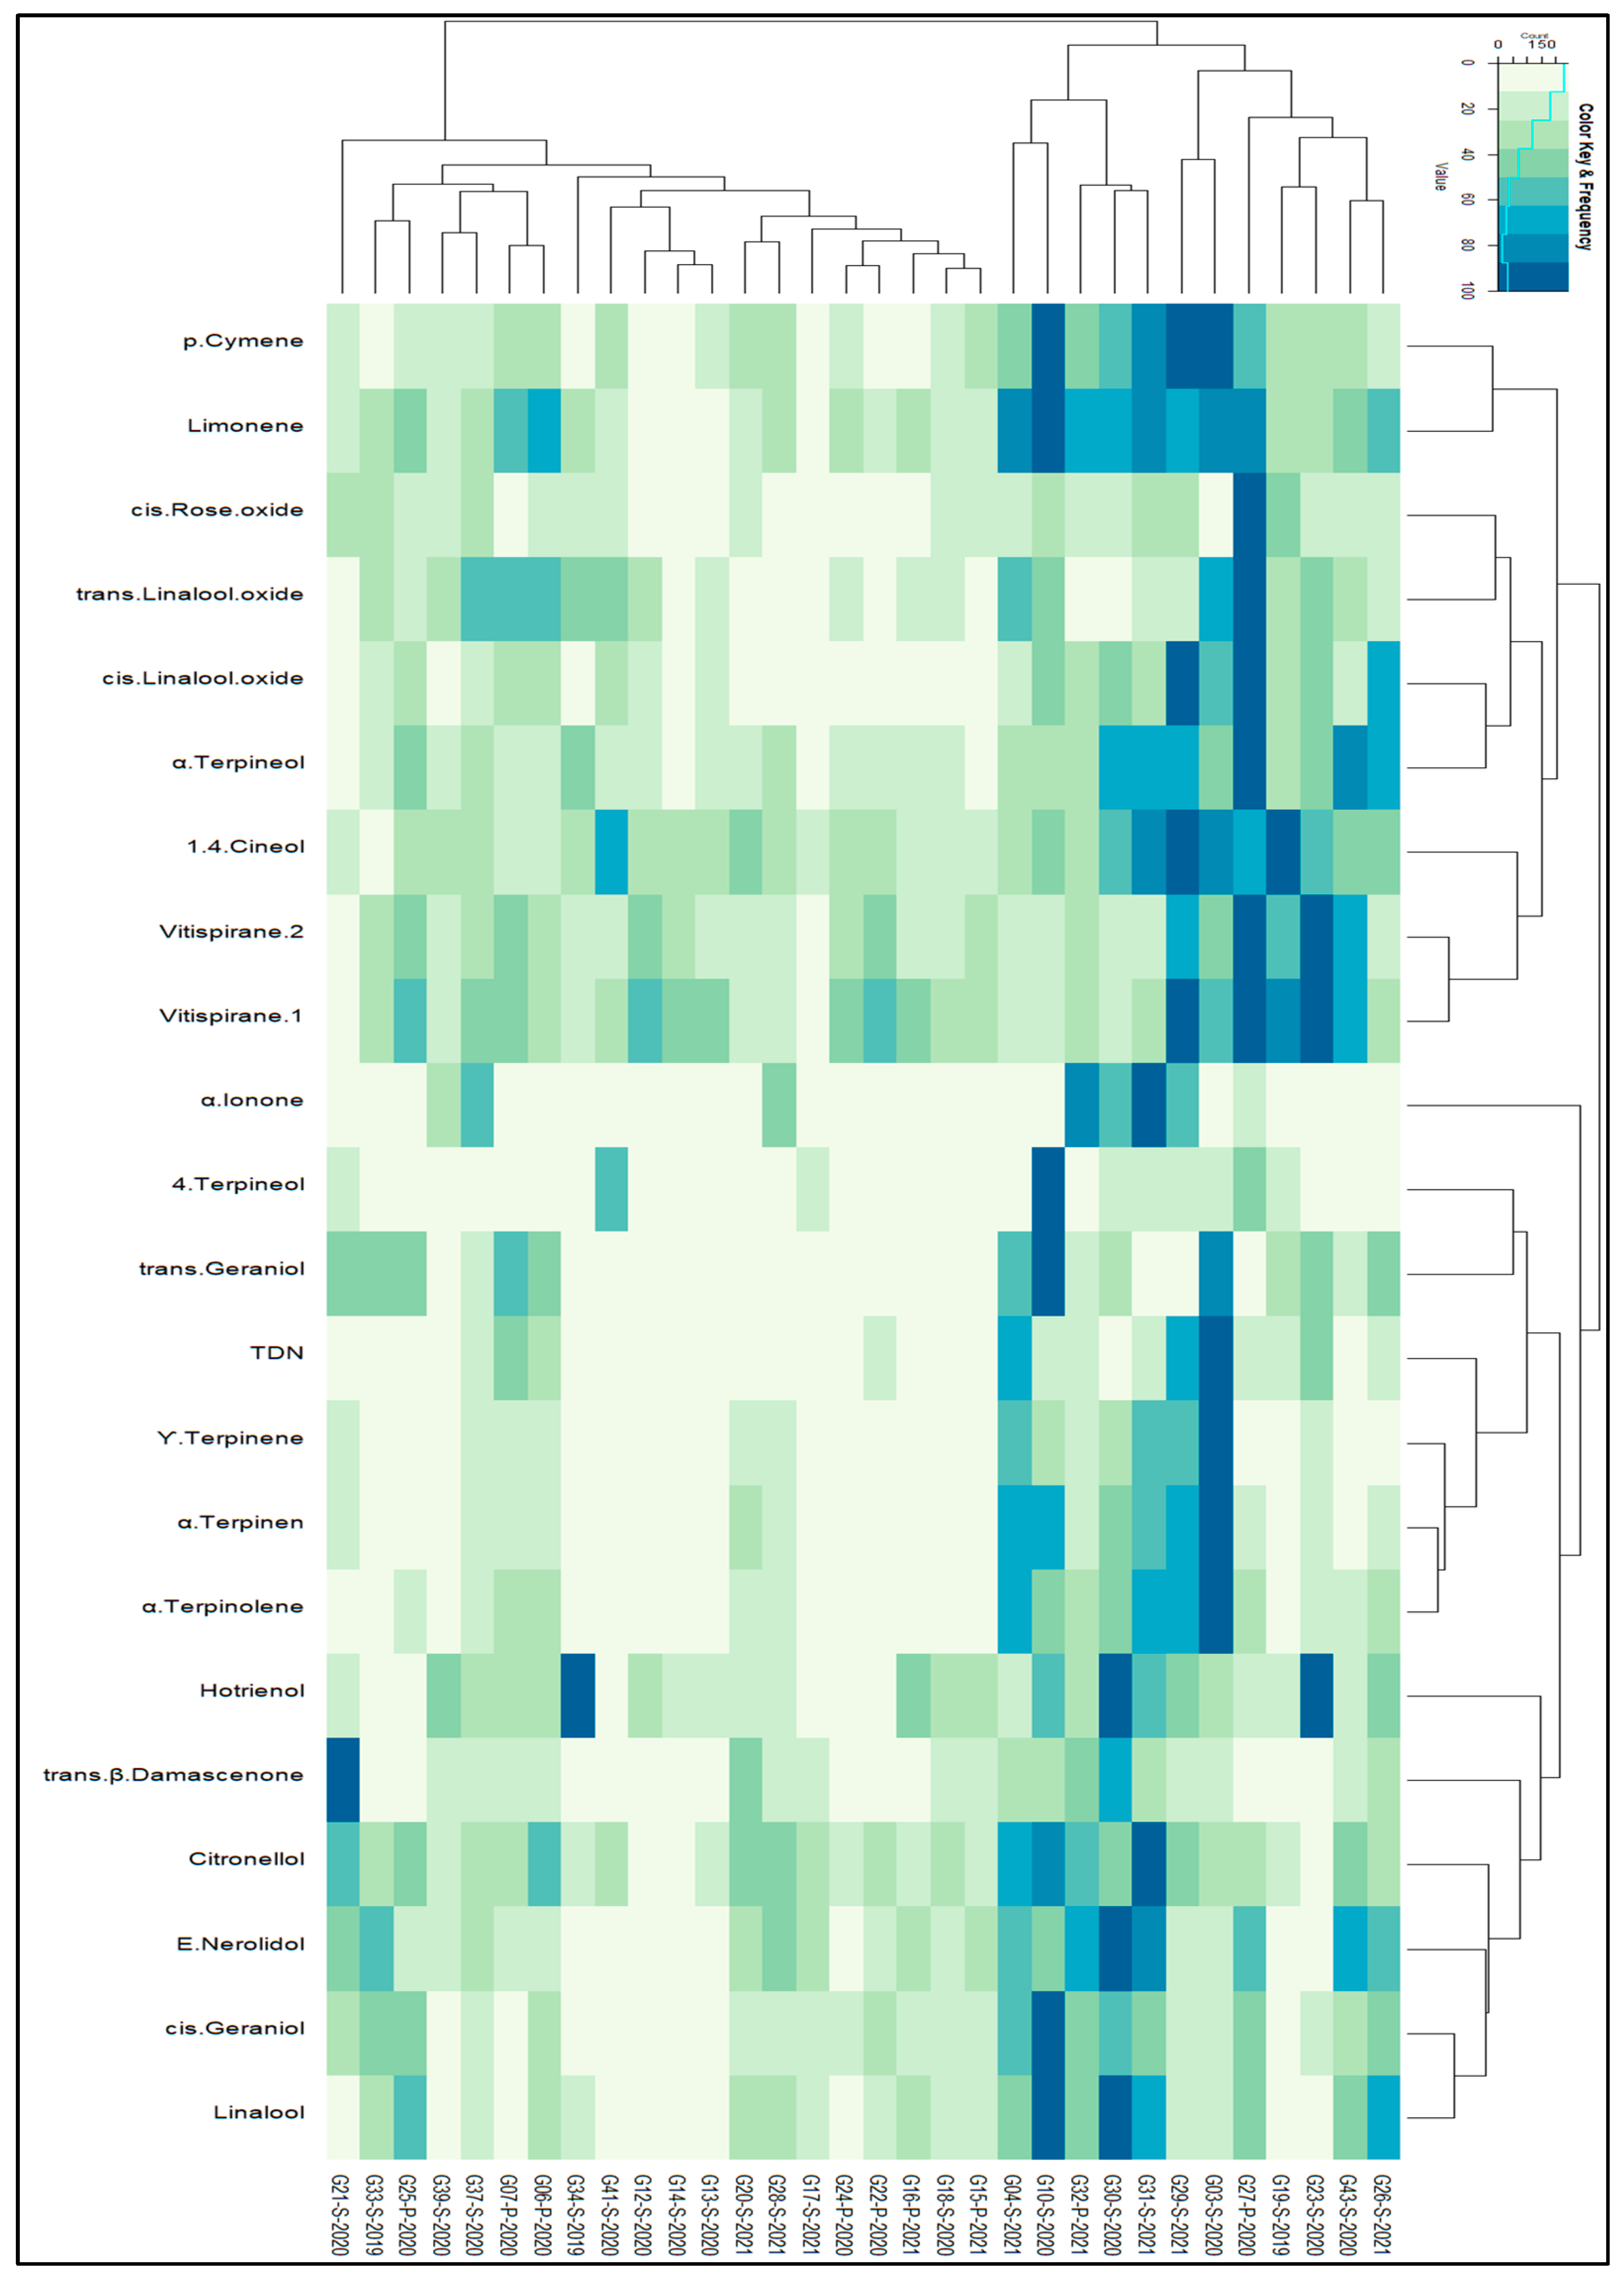
3.2. Identifying Patterns in the Whole Dataset Using Heatmaps and Hierarchical Clustering

Because the comparison of concentration levels of all analyzed VOCs showed no relevant differences between Graševina wines and other wines, except for the four previously mentioned terpenes, we focused our efforts on the data obtained for Graševina wine samples by applying statistical analysis to obtain a clearer picture of the regional effect on the concentration levels of determined VOCs, as wine samples were sourced from two different sub-regions.
To discern the patterns and trends within our dataset, we employed heatmap analysis to visually depict the relationships between the samples and variables (VOCs). This visualization technique highlighted clusters of correlated samples and variables. Initially, it was important to observe that among the 60 VOCs, β-ionone, 3-carene, and trans-rose oxide were consistently assigned a fixed value of 0.01. Consequently, these three compounds were excluded from further analysis. Furthermore, a correlation matrix, complemented by a correlogram, was employed to visualize the correlations and relationships among a total of 57 VOCs spanning various chemical families. This comprehensive analysis encompasses all samples, irrespective of their geographical regions, and is illustrated in Figure A1 within Appendix A. Figure 2 displays a heatmap, which provides a succinct representation of the data by utilizing colors to denote the values of the 57 distinct variables. The columns represent the various samples utilized in our experiments, showcasing their hierarchical clusters, while the rows depict the VOCs and their corresponding hierarchical clusters. The heatmap incorporates all VOCs associated with the 32 Graševina wine samples from 2 distinct geographical regions.
The dendrograms displayed alongside the heatmap correspond to the hierarchical clustering of columns (i.e., samples) and rows (i.e., VOCs) based on their similarity. To create the heatmap, the data were standardized to a range of 0 to 100, and hierarchical clustering was performed on the sample data using the Euclidean distance between the columns of the standardized data and the default Complete Linkage method.
Based on the discerned patterns in the heatmap and hierarchical cluster analysis, we identified two major classes depicted at the top of the heatmap among the 32 samples. The dendrograms associated with the samples revealed that the initial cluster (situated on the right side) was composed of samples G17-S-2021, G16-P-2021, …, and G10-S-2020, organized based on their similarities, while the second major cluster of samples comprised G37-S-2020, G39-S-2020, …, and G27-P-2020.
The most relevant differences between these two clusters can be observed in these groups of compounds. The first group of compounds, namely ethyl butyrate, ethyl phenylacetate, ethyl leucate, ethyl dihydrocinnamete, ethyl isovalerate, and ethyl isobutyrate, exhibited the highest content in the second cluster of samples, whereas the second group (trans-2-hexenol, hexano, cis-3-hexenol, trans-3-hexenol, hexyl acetate, z-3-hexenxyl acetate, ethyl hexanoate, ethyl 2-methylbutyrate, ethyl octanoate, and ethyl decanoate) and the third group of compounds (butyl acetate, isobutyl acetate, trans--damascenone, isoamyl acetate, propyl acetate, phenyethyl acetate, octyl acetate, citronellol, E-nerolidol, cis-geraniol, and linaool) exhibited the highest content in the first cluster.
From the above two clusters, it can be seen that they are mainly diversified by vintage, since the first cluster encompasses nine samples out of 10 of vintage 2021, while samples from vintage 2019 are present only in cluster 2. Samples from vintage 2020 were also predominant in cluster two as well. These observations are also in agreement with the previously mentioned groups of compounds, as the concentration patterns coincide with the age of the samples. The first group of compounds associated with older wines present in cluster 2 is dominated by ethyl esters of branched acids, which are mainly formed during wine aging [9]. In contrast, the second and third groups of compounds correlated to cluster 1, with younger wines bringing together ethyl esters of fatty acids with long carbon chain and higher alcohol acetates. These esters have been reported to undergo hydrolysis during aging [9,14].
To summarize, the heatmap displayed in Figure 2 visually depicted mainly vintage relationships between samples and variables (VOCs).

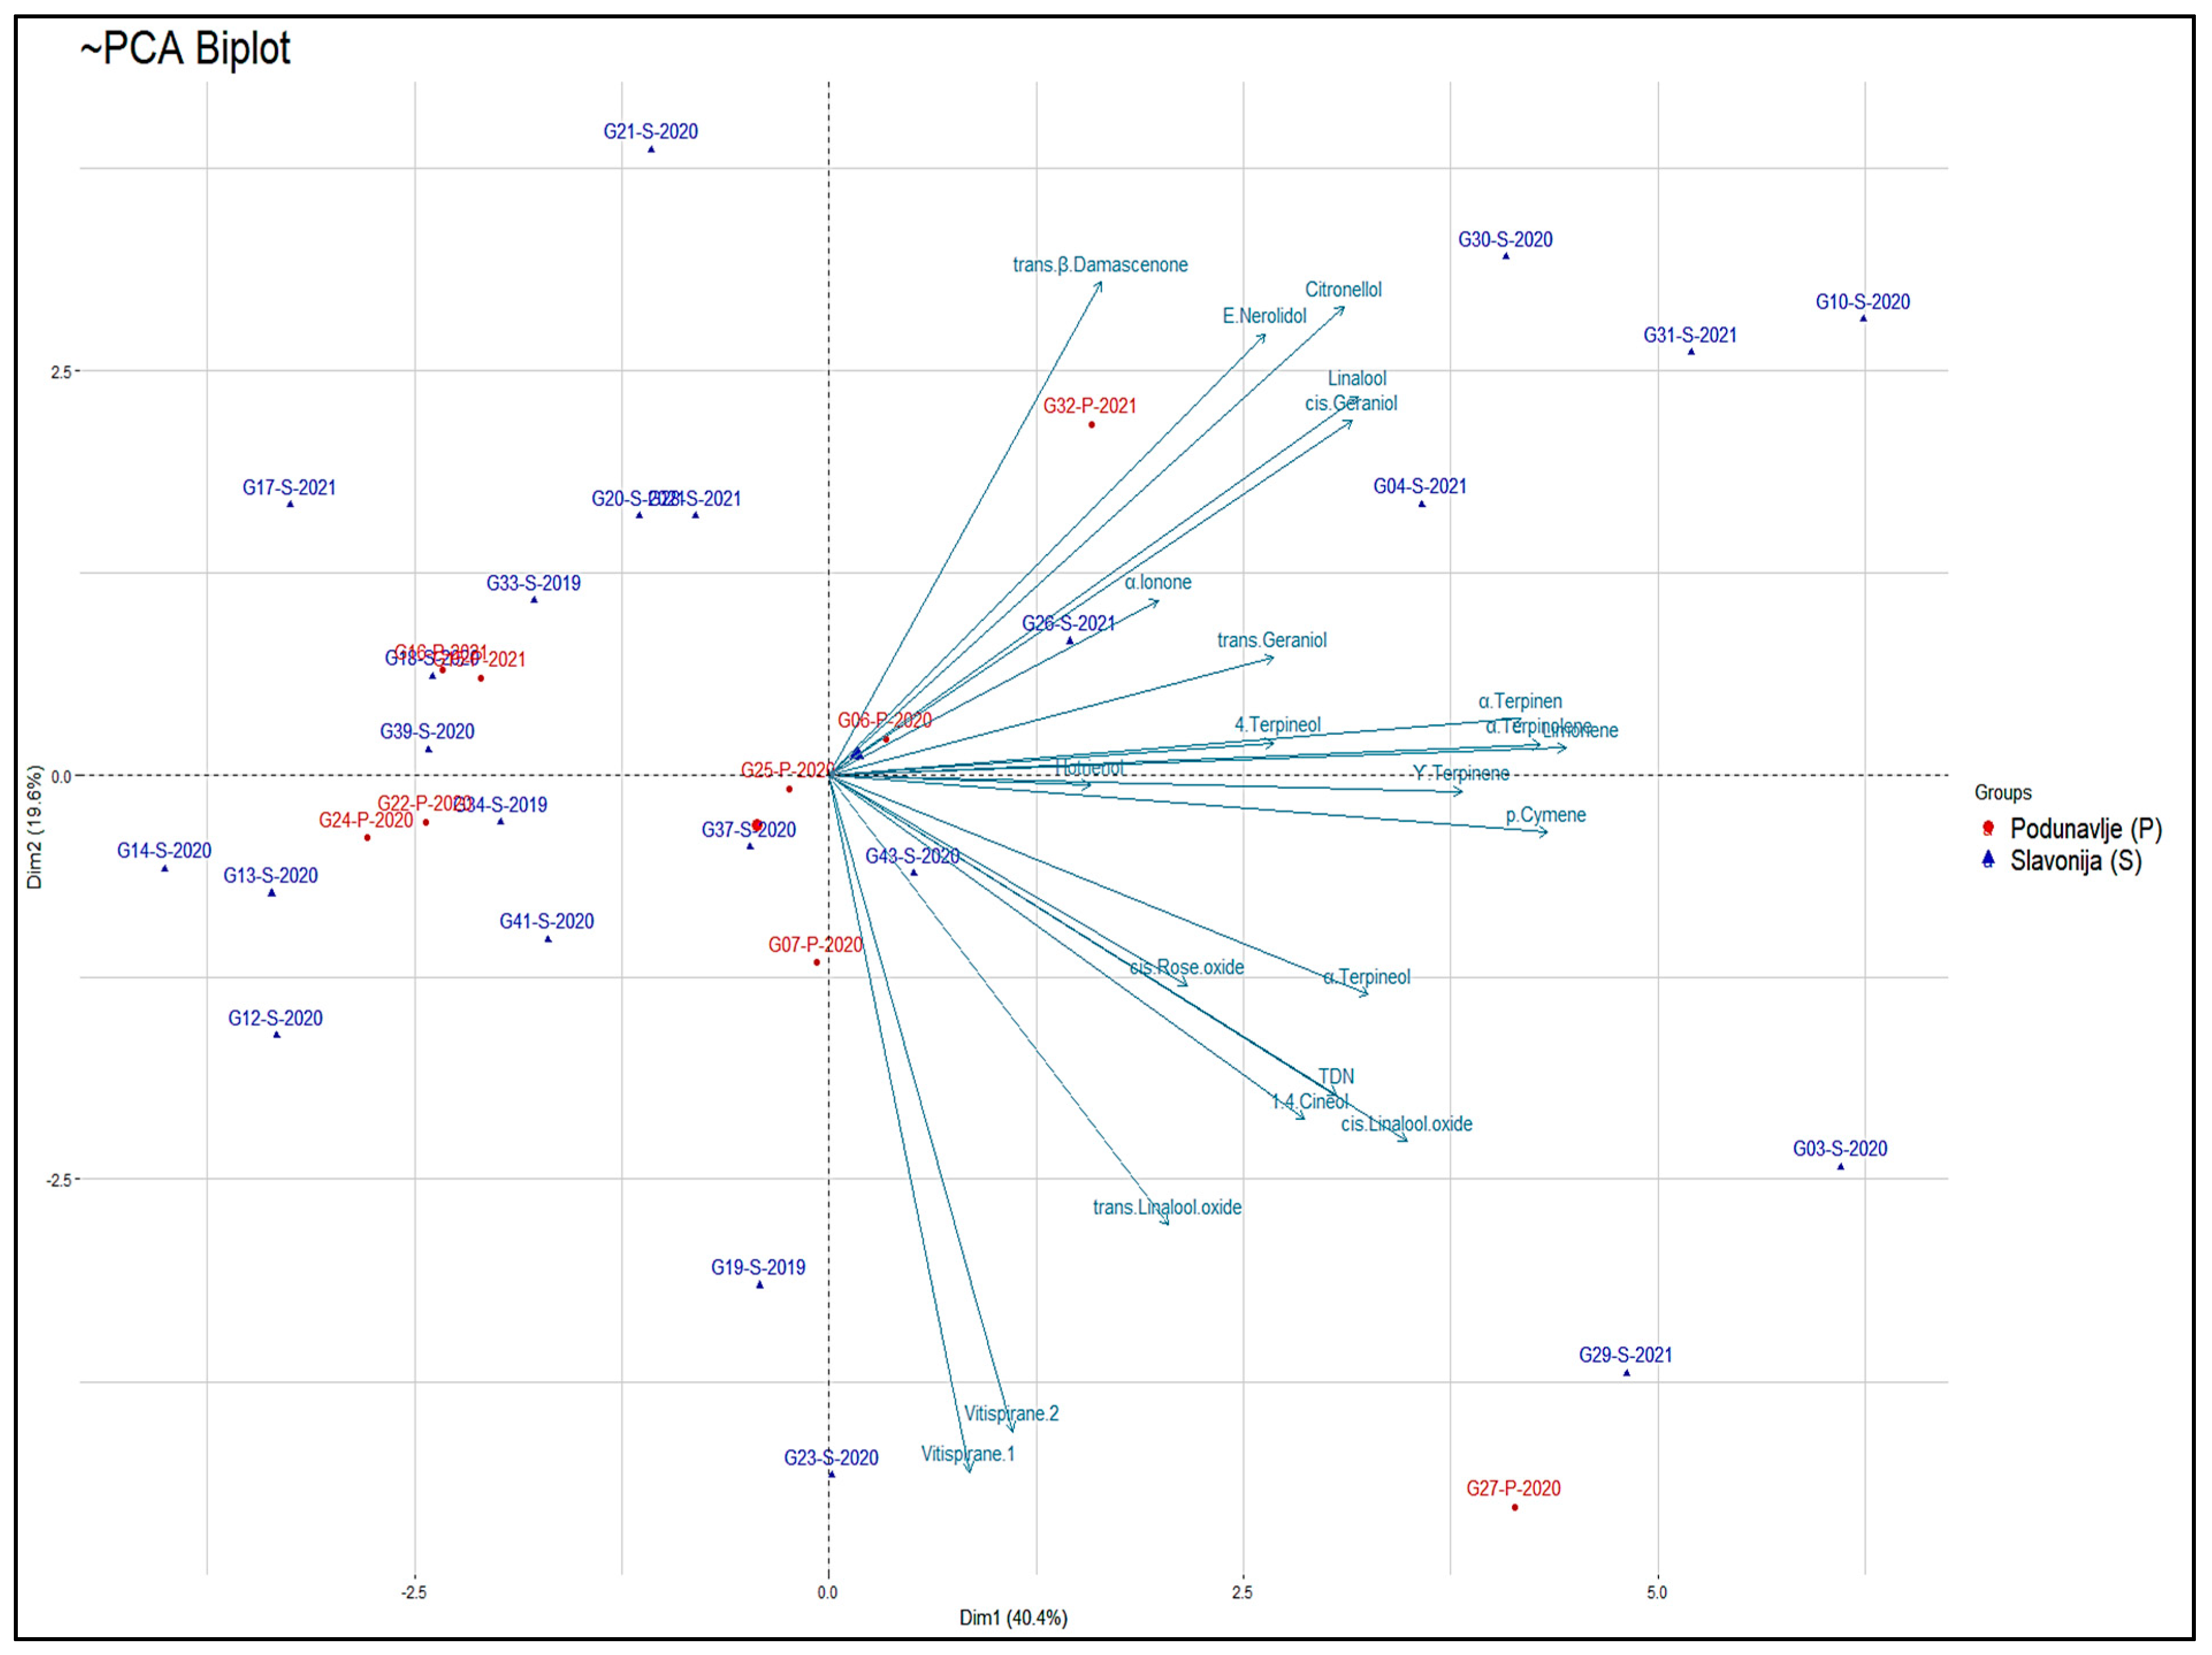
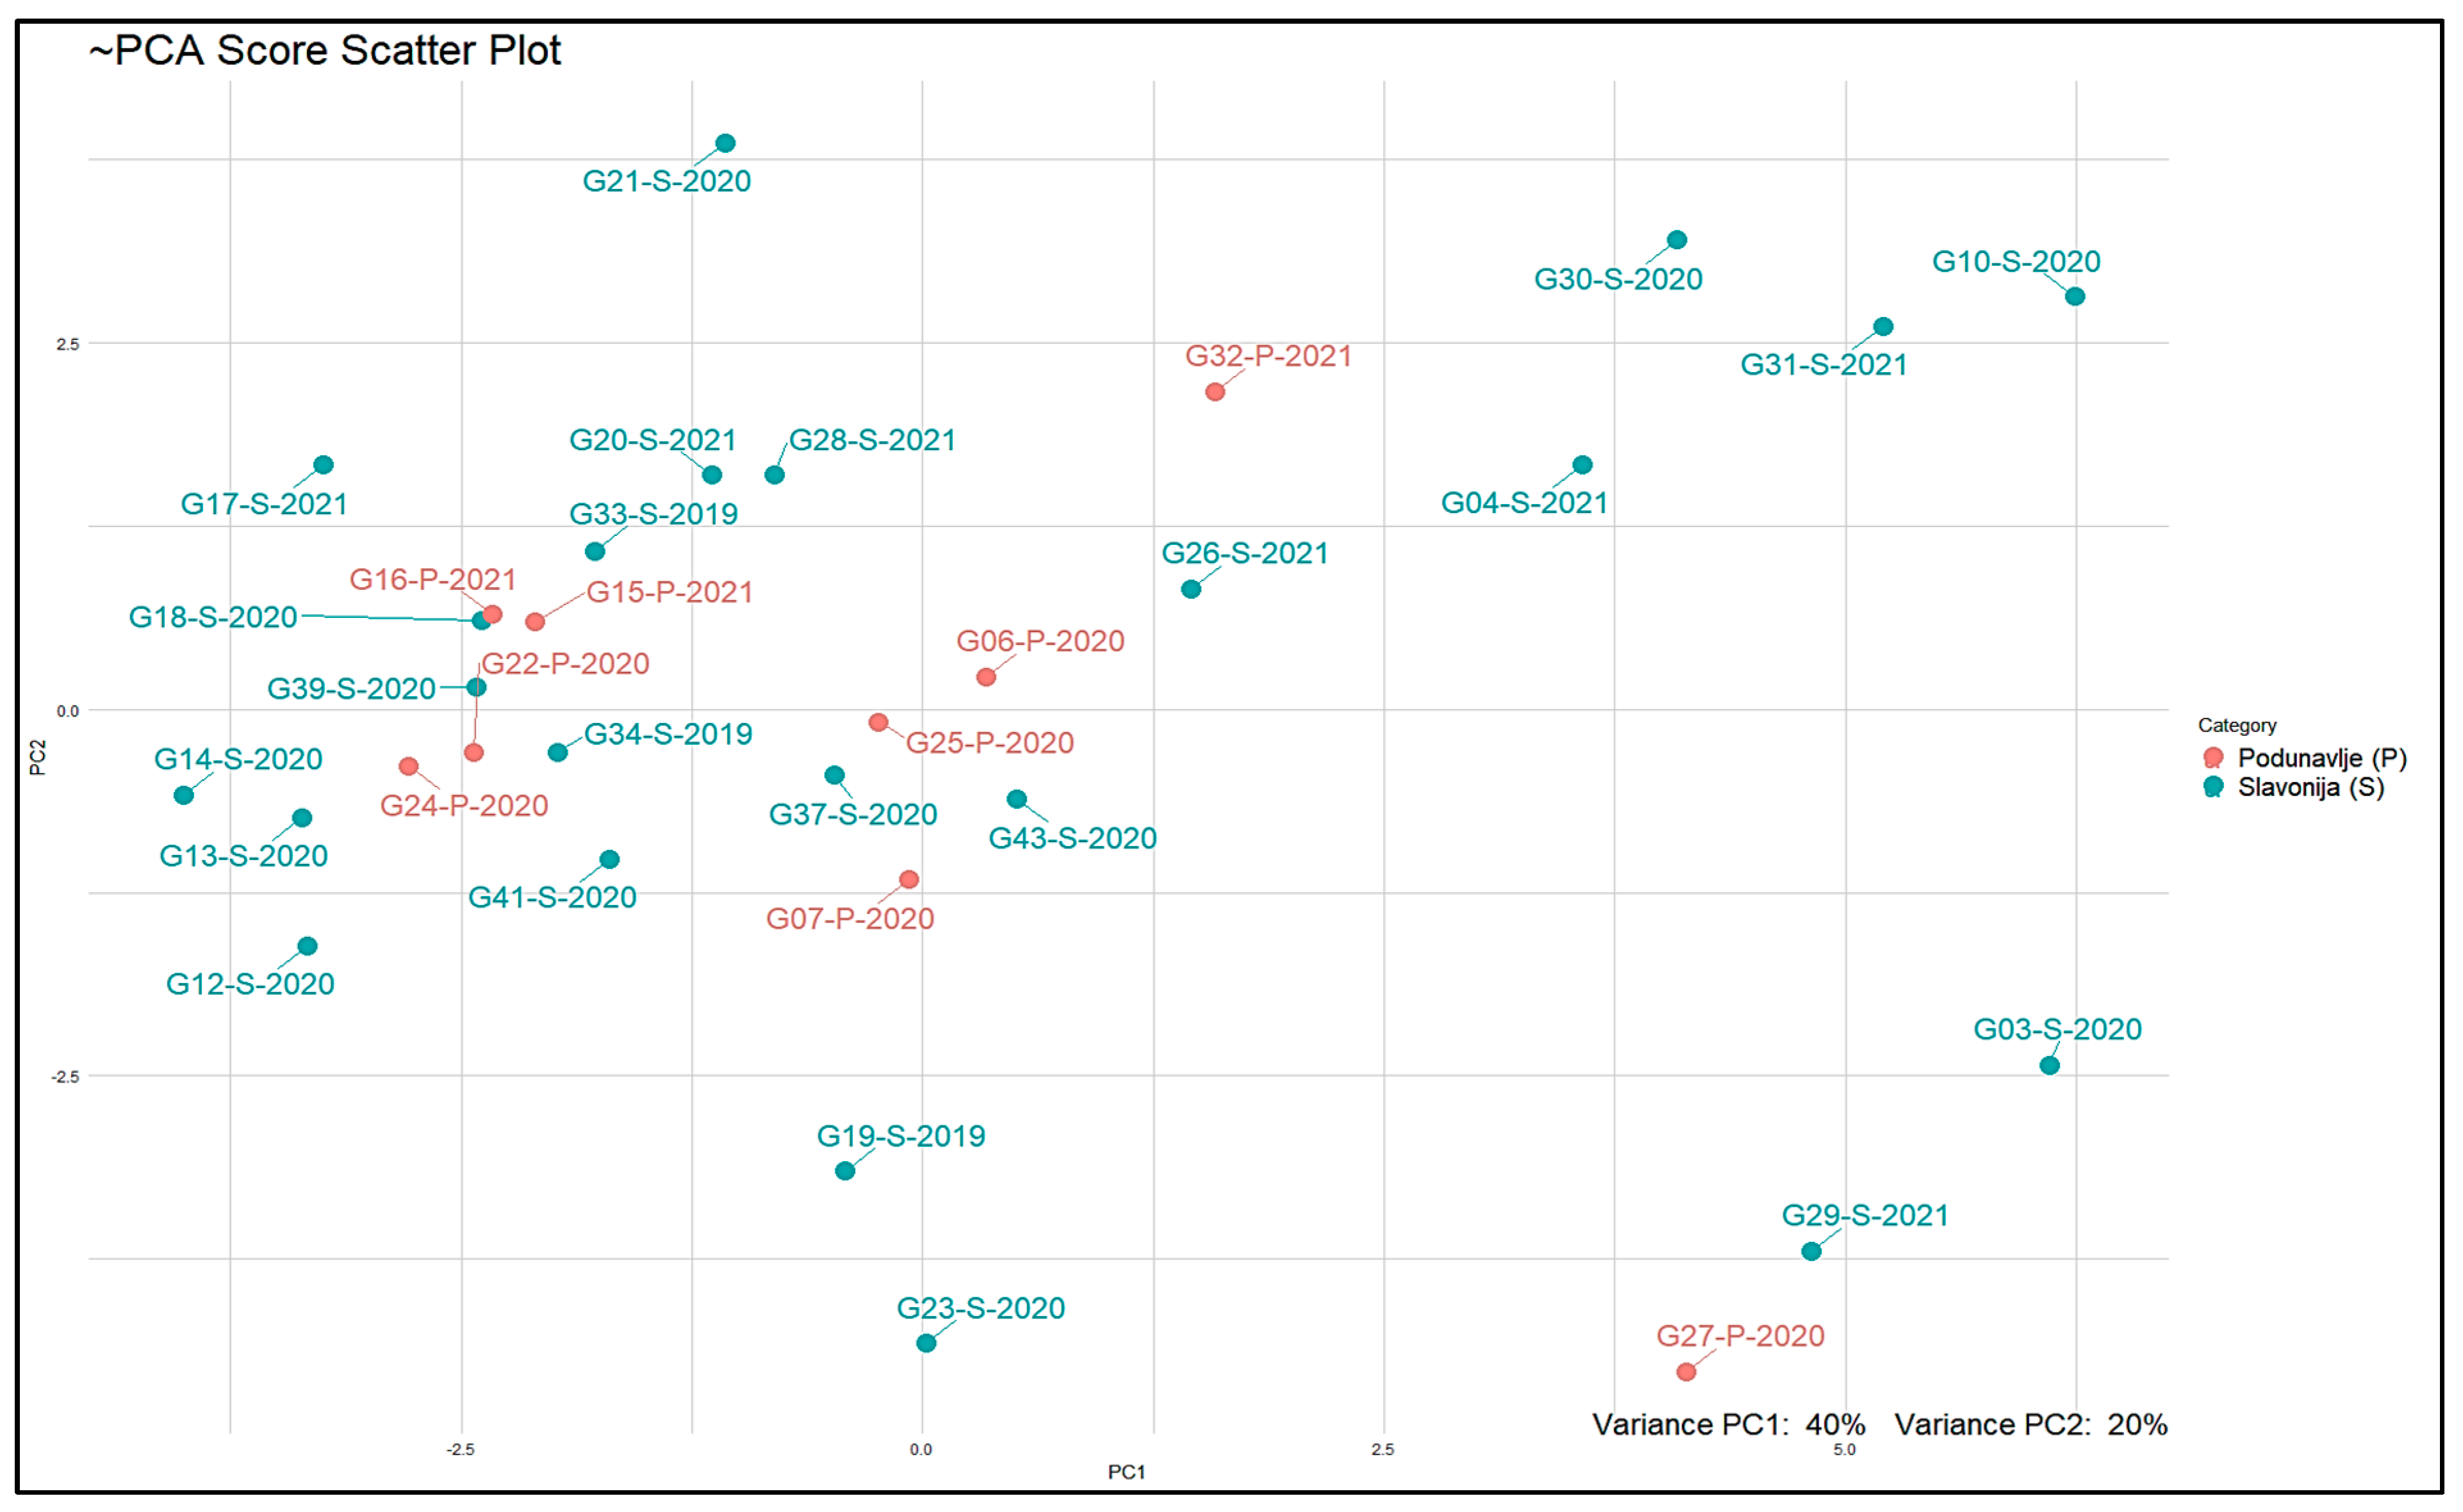
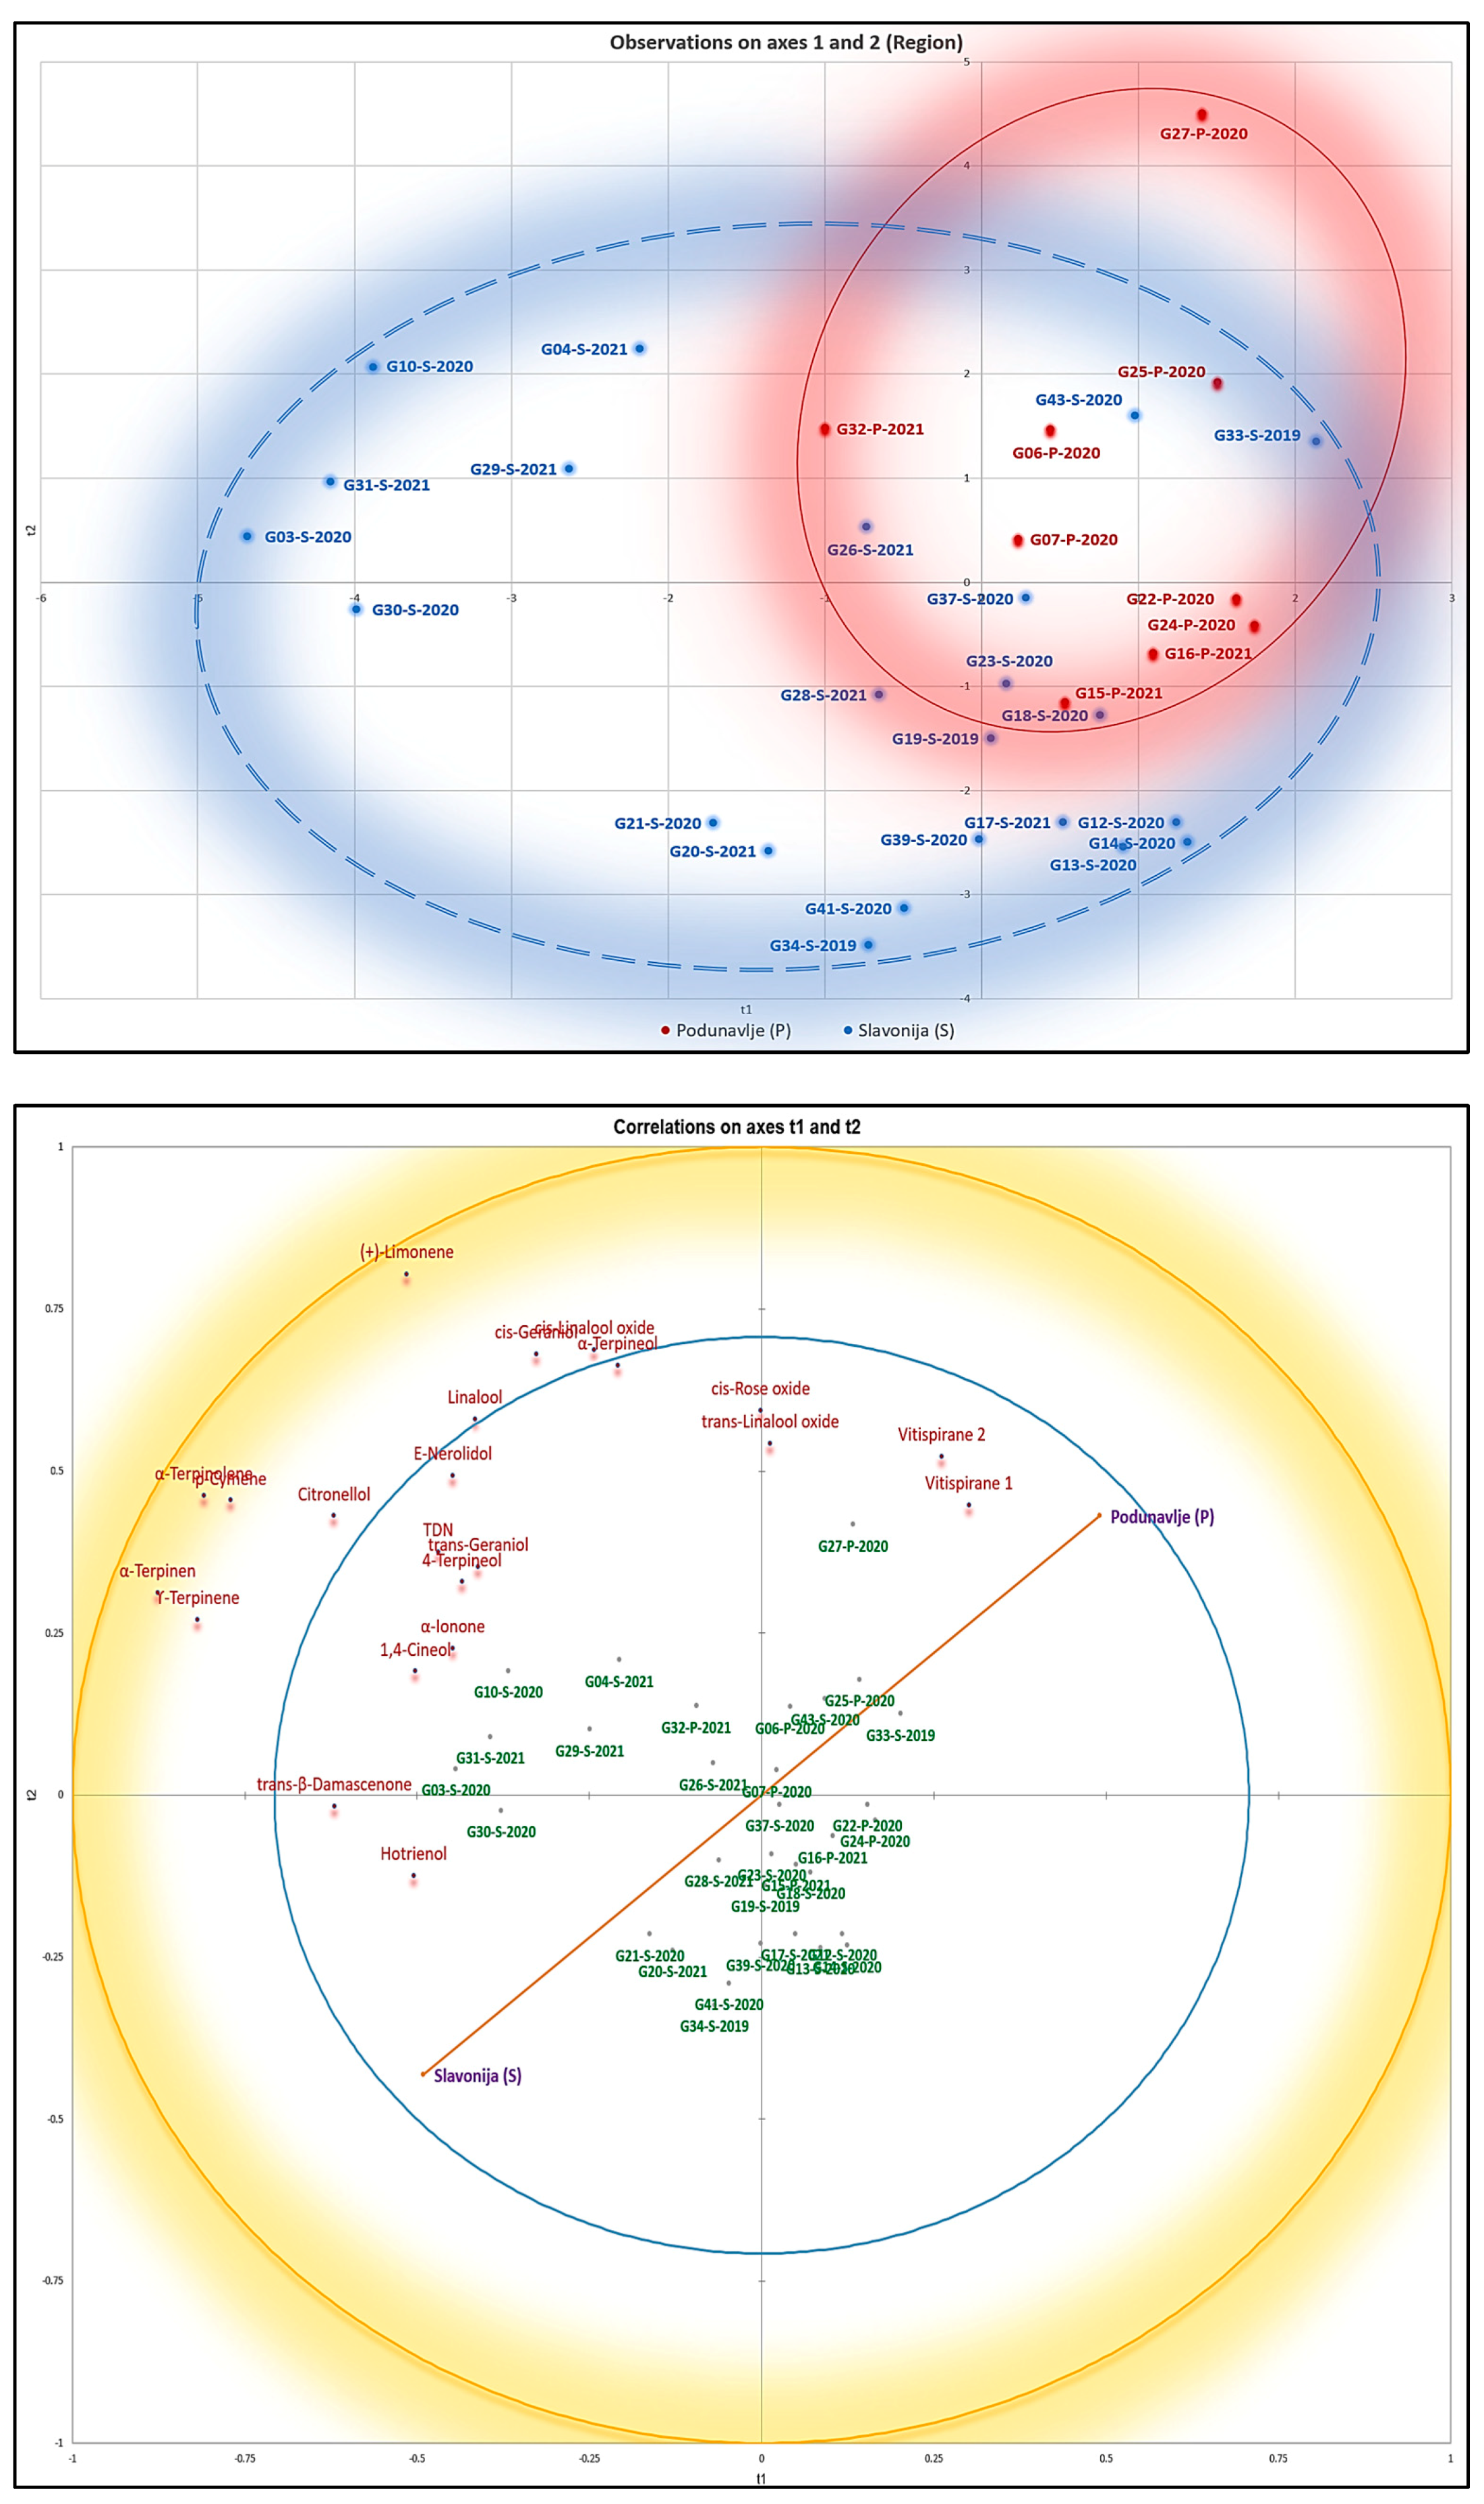
3.3. Relationships between the Groups of VOCs and Samples Using PCA and PLS-DA

To obtain a preliminary overview of similarities and differences among the studied samples and identify possible patterns, all VOCs were subjected to principal component analysis (PCA). In addition, PCA can show whether the geographical region has a remarkable influence on VOCs. From the eigenanalysis of the correlation matrix associated with the PCA, 13 principal components (represented by PC or F) were extracted, and 51.86% of the variance in the dataset was explained by the first three components, as shown in Appendix B in Table A1 (F1 = PC1 = 26.9%, F2 = PC2 = 15.25%, and F3 = PC3 = 9.91%). The first 13 principal components (PCs) had eigenvalues greater than 1. These components explained 90.5% of the total variability, which was due to the difference in volatile components of samples from the western and the eastern geographical regions (Slavonia and Podunavlje sub-regions, respectively), as shown in Figure A2.
We also employed the PCA score scatter plot depicted in Figure A2 to assess the significance of individual samples in our dataset and to observe the possible clusters in our 32 samples in a reduced-dimensional space. Some differences can be seen between some samples located in Kutjevo district from other samples also originating from the Slavonia as well as Podunavlje sub-regions from the PCA Score Scatter Plot. Figure A2 also shows how the VOCs in our dataset relate to each other and to the samples, based on the underlying patterns identified. Thus, from both plots in Figure A2 it can be deduced that just one group of compounds namely terpenes (α-terpinen, γ-terpinene, 1,4-cineol and 4-terpineol, limonen, p-cymene, and α-terpineol) show a faint connection to samples originated from the Slavonia sub-region.
Moreover, to condense an extensive discussion on the significance and impact of VOCs on principal components, we present a summary in Table A2 in Appendix B. This table, along with the biplot in Figure A2, outlines the contributions of the variables obtained from PCA, focusing on the VOCs deemed of the highest importance in our analysis. Table A2 in conjunction with Figure A2, facilitated the understanding of the relationship between the variables and samples within a reduced-dimensional space. Moreover, it highlighted the primary contributors associated with each Principal Component (PC). For example, it can be observed that variables α-terpinen, γ-terpinene, 1,4-cineol and 4-terpineol, limonen, p-cymene, and α-terpineol have higher loadings in the PCA biplot in Figure A2; additionally, their associated scores for the contribution of the variables (%) factor loadings in Table A2 are larger compared to other VOCs.
The cumulative variance of 51.86% in the PCA method across the initial three PCs does not provide a sufficient level of variation for researchers to rely on valid and robust analyses and clustering. Additionally, the PCA score scatter plot failed to exhibit a distinct separation of samples according to their geographical regions. Consequently, to gain deeper insights into the distinctions among samples originating from different geographical locations, a partial least squares discriminant analysis (PLS-DA) model was constructed with a confidence interval of 95%. Furthermore, it should be noted that we have utilized the weighting technique to mitigate the dominance of the larger sample group (i.e., Slavonija (S)) in the analysis solely because of its larger sample size. This methodological approach serves to alleviate the effects of imbalanced sample sizes, ensuring that each sample contributes proportionally to the analysis, regardless of group size. Notably, this model revealed a clear separation between samples from the Podunavlje and Slavonia sub-regions, which was better than that observed in the Heatmap in Figure 2. Furthermore, the score scatter plot (Figure 3) demonstrates the distinct segregation of samples based on their geographical origins. Additionally, the correlation circle plot in Figure 3 provides a visual representation of Variable Importance in the Projection (VIP) scores. Under the above-mentioned data, yet more distinguished, terpenes can be well associated with samples originating from the Salvonia sub-region, as shown in Figure 3. Furthermore, detailed information on the individual loadings of all VOCs in the PLS-DA method can be found in Appendix C, presented in Figure A4 and Figure A5.

3.4. Multivariate Data Analysis Based on 22 VOCs

As the PLS-DA score scatter plot in Figure 3 shows, some VOCs, namely terpenes and norisoprenoids, were of higher importance in the classification depicted in the correlation circle plot in Figure 3. Consequently, we focused on 22 terpenes and norisoprenoids, of which 3-carene, β-ionone, and trans-rose oxide were present below the limit of quantification, and therefore, they are not important. Additionally, these 22 VOCs could better represent the profiles of our samples, since four terpenes, i.e., α-terpinene, γ-terpinene, 1,4-cineol, and 4-terpineol, as shown in Figure 2, are generally found at higher concentration in Graševina wines in comparison to Chardonnay and Pinot Gris wines from the same producers.
To uncover the patterns and trends in our dataset, we mapped and visualized the relationship between samples and variables (VOCs) using a heatmap, which revealed groups of correlated samples and variables. Additionally, we utilized Boxplots and Scattergrams as two impactful graphical tools to depict the distribution of our 22 VOCs, serving as predictor variables for samples from the Slavonia (S) and Podunavlje (P) sub-regions in the dataset. These visual representations are provided separately in Appendix D (Figure A8 and Figure A9). In the heatmap analysis, we used 22 VOCs associated with 32 different samples from 2 different geographical regions to generate the heatmap.
Based on the heatmap and hierarchical cluster analysis patterns, two major groups of samples were identified. Higher amounts of terpenes and norisoprenoids were present in the first group than in the second group, as shown in the heatmap (Figure 4). Interestingly, the wines represented in the first group with a higher content of terpenoids mainly originated from the Kutjevo district within the Slavonia sub-region, whereas most of the wines from Podunavlje sub-region were in the second group. Therefore, it appears that the heatmap and hierarchical cluster analysis managed to separate Graševina wine samples according to their geographical origin to a certain extent. The dendrogram from the heatmap depicted in Figure 4 also shows two major clusters (or three minor clusters in total) of compounds, each cluster being composed of different groups of terpenoids and norisoprenoids without a clear trend.
The sum of terpenes and norisoprenoids (but not individual compounds) showed a connection to the geographical region based on their concentration levels. These data indicate that norisoprenoids and even more terpenes can be used to a certain extent as markers of the geographical origin of Slavonian Graševina wines.

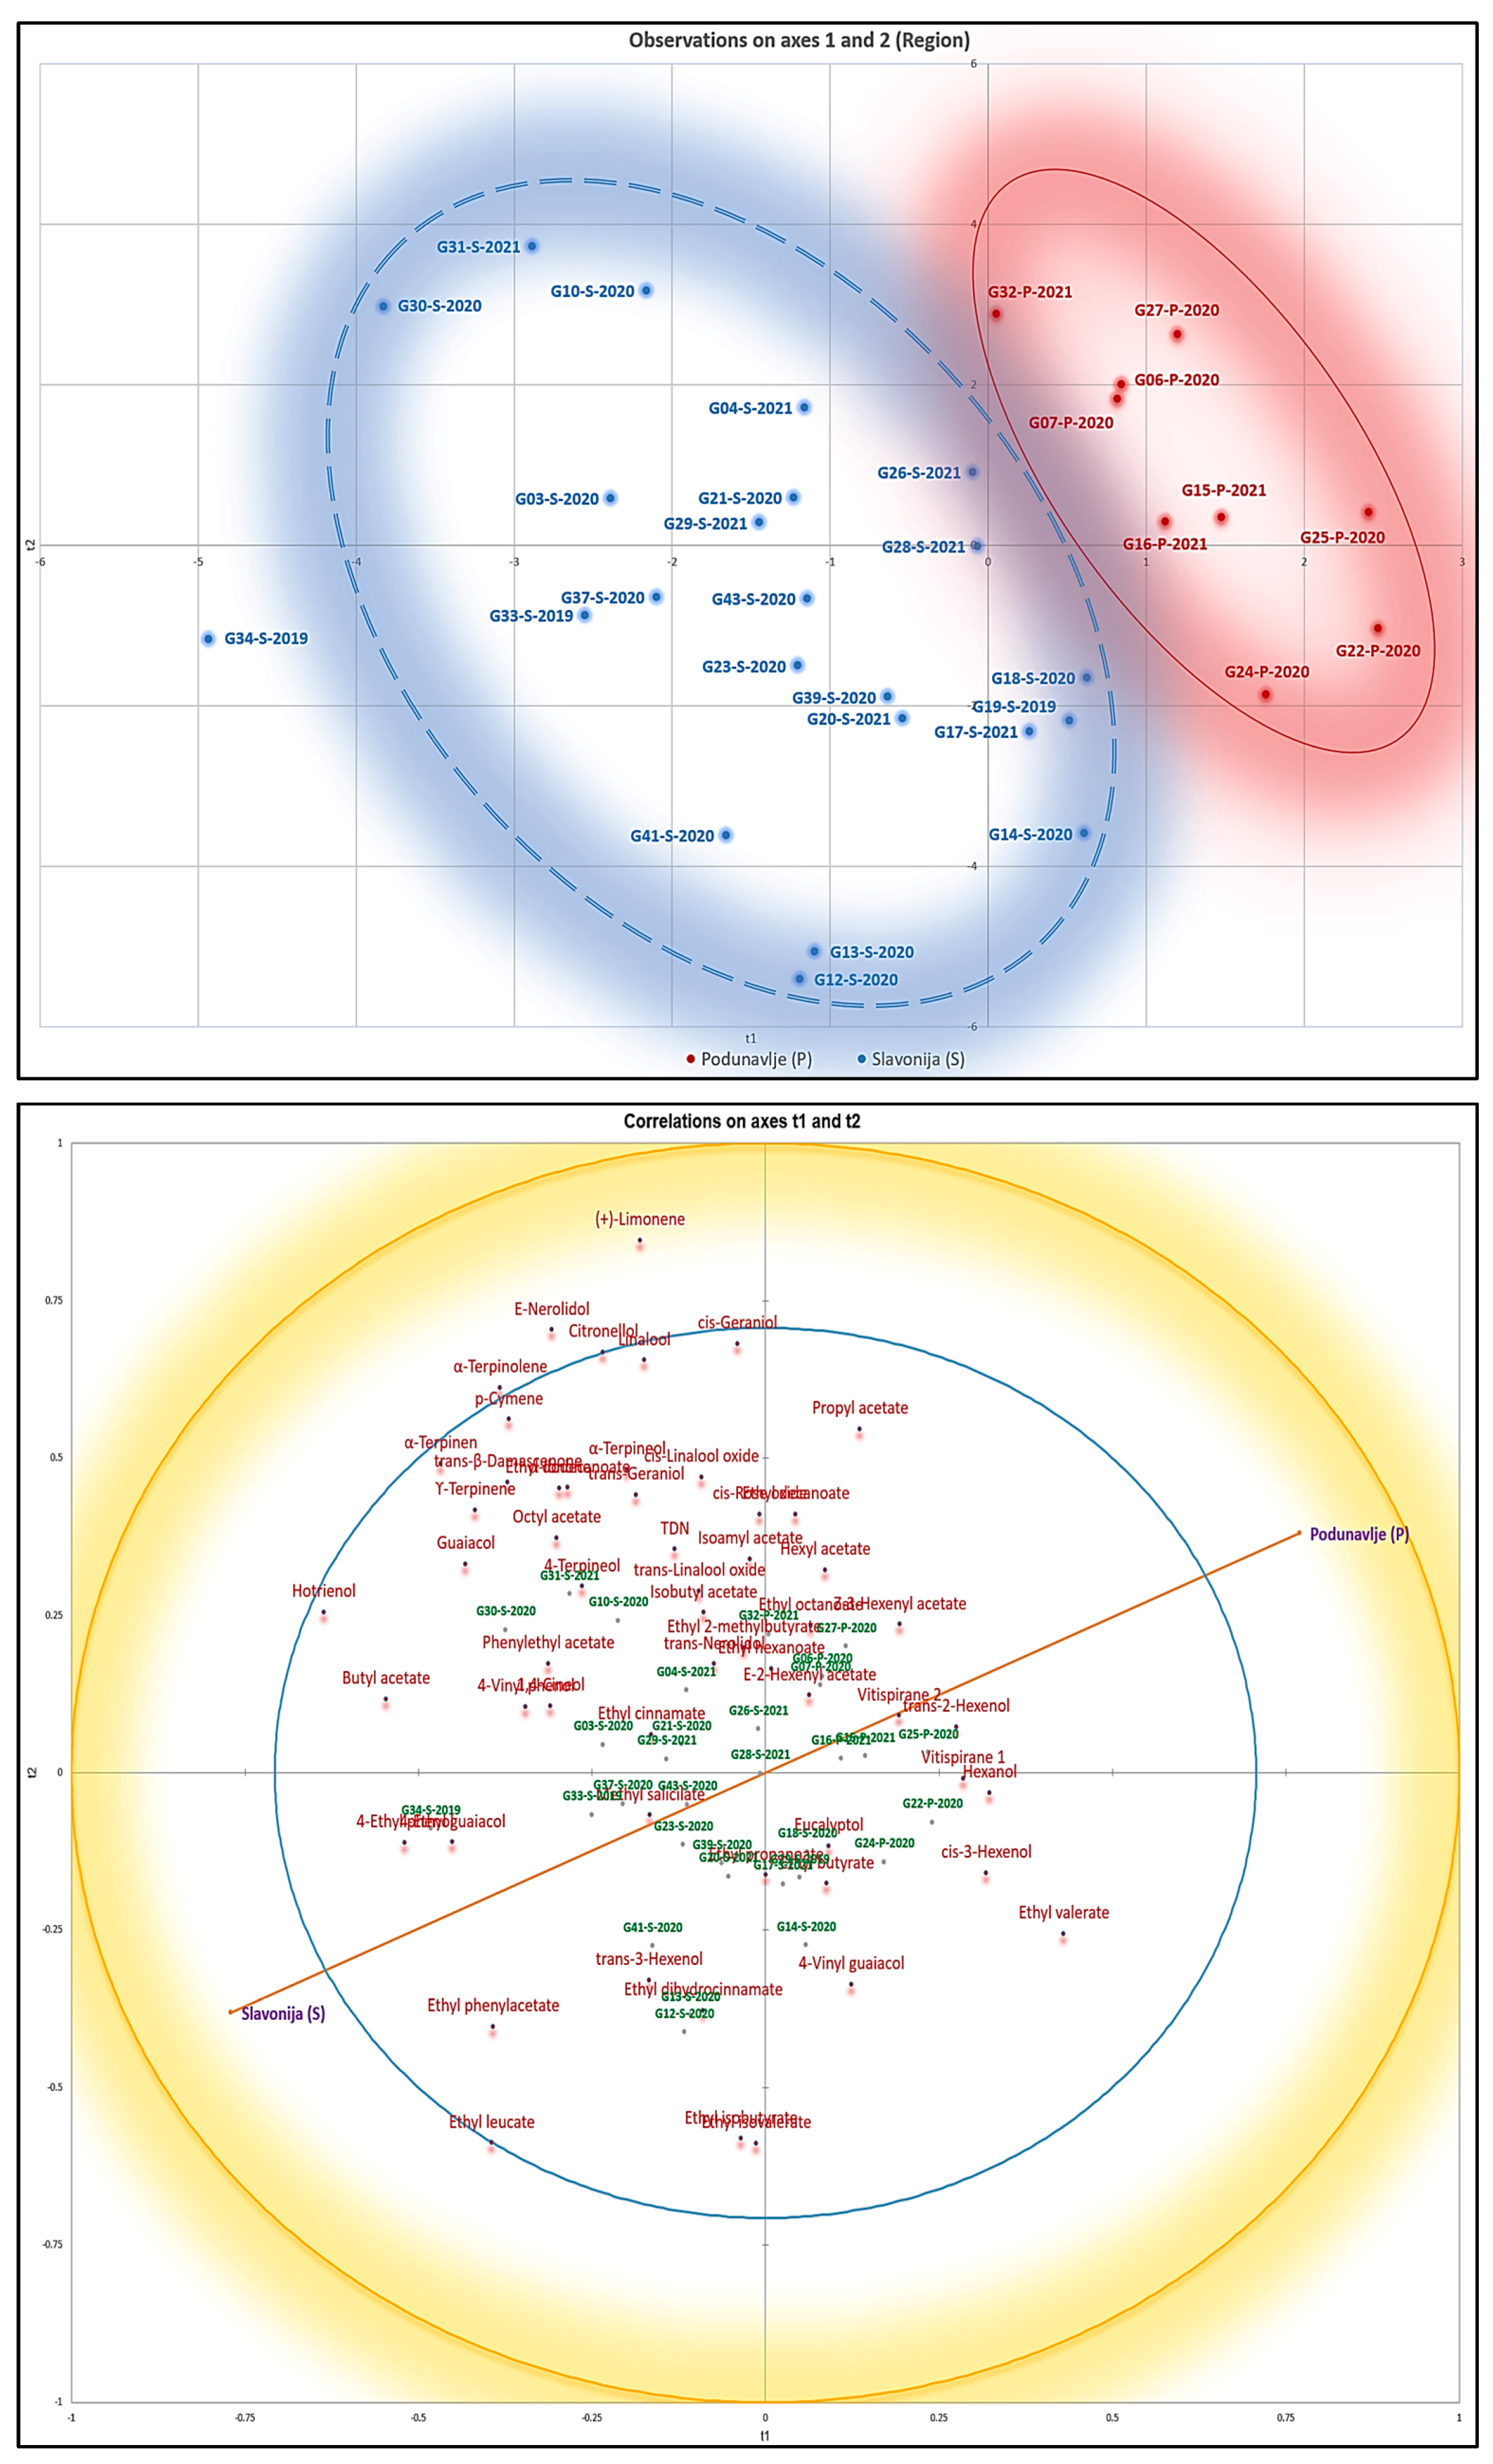
3.5. Relationships between the Groups of VOCs and Samples Using PCA and PLS-DA

To gain a comprehensive understanding of the similarities and distinctions among the samples and to identify potential patterns, 22 VOCs were subjected to PCA. Through eigenanalysis of the correlation matrix associated with PCA, five principal components (denoted as PC or F) were extracted, each having eigenvalues greater than 1. Notably, these five components effectively accounted for 83.71% of the total variability observed in samples from both the Podunavlje and Salvonia sub-region. The first three principal components (F1 = PC1 = 40.41%, F2 = PC2 = 19.60%, and F3 = PC3 = 10.39%) collectively explained 70.41% of the variance in the dataset. The PCA biplot (Figure A3 in Appendix B) again displayed a higher tendency of norisoprenoids and terpenes towards samples originating from the western geographic region.
The PCA score scatter plot failed to exhibit a distinct separation of samples based on geographical sub-regions. Therefore, to gain deeper insights into the differences among samples originating from diverse geographical origins, a new Partial Least Squares-Discriminant Analysis (PLS-DA) model was constructed, incorporating a confidence interval of 95%. In this PLS-DA model, three significant components elucidated 64% of the total variation in predictors (i.e., VOCs). The score scatter plot presented in Figure 5 did not reveal, however, a clear separation of samples based on geographical sub-regions. Additionally, the correlation circle plot in Figure 5 provides a visual representation of Variable Importance in the Projection (VIP) scores. Furthermore, detailed information regarding the individual loadings of all 22 VOCs in the PLS-DA method on various components can be located in Appendix C, illustrated in Figure A6 and Figure A7. Once more, it can be seen that in both PLS-DA plots (Figure 5), as expected and discussed earlier, most of the chosen 22 VOCs, especially terpenes, are of higher importance in the PLS-DA model and classification. This can be observed by their high loadings in the correlation circle plot in Figure 5.

3.6. Potential Markers of Graševina Wines’ Regionality

Different statistical approaches led to the same conclusion, suggesting that it was not easy to discriminate between Graševina wines from both studied sub-regions based on the targeted volatiles. Nevertheless, a group of wine samples exclusively from the Kutjevo district in the Slavonia sub-region were systematically correlated to some norisoprenoids and a wide range of monoterpenes, including the four compounds potentially involved in Graševina aromatic signature, namely 4-terpineol, 1,4-cineole, and α- and γ-terpinene. In contrast, wines from the Podunavlje sub-region were grouped together when PLS-DA was applied, and seemed to be correlated with the levels of vitispirane isomers (Figure 3 and Figure 5). This consistent result highlights that appropriate statistical analyses can unravel some subtle differences in the composition of wines from different geographical origins. For instance, this approach has recently been used to characterize the regional aromatic signature of Australian Shiraz wines [15,16]. More recently, Schartner et al. [17] managed to predict the origin of Bordeaux red wines from simple GC/MS data with the help of a Machine Learning tool.
In the case of Graševina wines from northeastern Croatia, as shown in Figure 6, it seems that the Kutjevo district in the Slavonia sub-region is more prone to favor higher levels of terpenoids. The Podunavlje sub-region has a more continental climate than the Slavonia sub-region, with warmer days and slightly colder nights during the ripening season. Rain precipitation is slightly more abundant during summer and autumn in Slavonia (www.meteoblue.com, 28 January 2024). This climatic difference is even more pronounced when considering the Kutjevo district, which is located on the slope of the Papuk mountains. Interestingly, Graševina wines from different areas of the Slavonia sub-region, namely Požega Pleternica, and Djakovo, were rather grouped with wines from the Podunavlje sub-region. This was particularly the case for samples from the Djakovo area, located at the border with the Podunavlje sub-region, which has a more continental climate than Kutjevo.
Different studies have reported contradictory results regarding the effects of temperature on norisoprenoids and monoterpenes [18]. The influence of abiotic factors on these volatiles also depends on the compound [18]. For norisoprenoids, there is consensus that warmer and sunnier climate favors higher levels of TDN [18]. This was not the case in the present study, because samples from the cooler Kutjevo district displayed higher levels than those from the warmer Podunavlje sub-region (Figure 5). β-Damascenone and α-ionone were also associated with samples from Kutjevo area. For these compounds, there is a lack of consensus in the literature regarding the impact of abiotic factors on their contents in grapes and wine [18]. In contrast, both vitispirane isomers were correlated with wines from the Podunavlje sub-region, indicating that warmer temperatures could potentially stimulate their synthesis in grapes. However, this topic is poorly documented in the literature and further studies are required to confirm this assumption. Monoterpenes were all associated with different degrees of correlation with wines from Kutjevo area. According to Van Leeuwen et al. [18], the influence of air temperature on monoterpene concentrations in grape and wine is difficult to predict and depends on other factors. In contrast, Suklje et al. [15] found in Shiraz wines that monoterpenes were associated with cooler regions in Australia. It appears that Graševina, grown in a continental climate, follows the same trend. Interestingly, the compounds that were most discriminative between sub-regions were α-terpinene, γ-terpinene, and 1,4-cineole. Graševina wines from the Kutjevo district showed higher concentrations than Podunavlje wines. Antalick et al. [10] reported a higher level of 1,4-cineole in Cabernet-Sauvignon wines originating from the Margaret River with milder climates than South Australia. Suklje et al. [15] found similar results for γ-terpinene in Shiraz wines associated with cooler Australian regions. It is worth highlighting that terpinene isomers and 1,4-cineole followed the same trend, as the three compounds are connected by the same metabolic pathway [19]. These monoterpenes are also metabolically connected to 4-terpineol [19], and they seem to be all chemical markers of Graševina wines, as suggested earlier. Their individual odors are described as herbaceous for 1,4-cineole and 4-terpineol [10,20] and pine, citrusy, lemon, and lime odor for terpinene isomers [20]. It is worth noting that lemon and lime are descriptors used by wine experts to characterize the aroma of Graševina wine, particularly in the Kutjevo district, which is considered the most iconic region for this variety in Croatia. Nevertheless, it is too speculative to state that these monoterpenes actually contribute directly or through perceptive interactions to the aromatic typicality of Graševina wine. Further sensory experiments are warranted to confirm this hypothesis.

4. Conclusions

Aromatic profiling of Graševina wine samples and other wine samples (Pinot Gris and Chardonnay) by quantifying 60 volatile organic compounds (VOCs) did not show differences, with the exception of α-terpinene, γ-terpinene, 1,4-cineol, and 4-terpineol, which stood out. Accordingly, when comparing Graševina wines to other wine samples made by the same producers, these four terpenes were predominantly present at higher concentrations in Graševina wines.
Moreover, this study highlighted the differences in the aromatic composition of Graševina wine originating from different sub-regions of Northern Croatia. Wine samples from the cooler continental climate of the Kutjevo district in the Slavonia sub-region were particularly correlated with some norisoprenoids and a wide range of monoterpenes in comparison to wines from the warmer Podunavlje sub-region. Interestingly, the aforementioned compounds potentially involved in the Graševina aromatic signature, namely 1,4-cineole and α- and γ-terpinene, were the most discriminative in distinguishing the sub-regions. Further studies are warranted to investigate the sensory impact of these terpenes on Graševina wines.

Supplementary Materials

The following supporting information can be downloaded at: https://www.mdpi.com/article/10.3390/beverages10020024/s1, Table S1: Analyzed commercial wines and their producers with identification names and vintages. Table S2: Concentration levels (µg/L) of 60 volatile compounds in all analyzed wine samples.

Author Contributions

Conceptualization, M.M., G.A., A.H., B.M.V. and L.B.; Data curation, M.M., G.A., L.B., V.O. and J.M.; Formal analysis, M.M., T.R.V. and A.H.; Funding acquisition, B.M.V. and L.B.; Investigation, M.M., G.A. and L.B.; Methodology, M.M. and G.A.; Project administration, B.M.V. and L.B.; Resources, M.S.L., B.M.V. and L.B.; Supervision, M.M. and L.B.; Validation, M.M., G.A., T.R.V., A.H. and L.B.; Visualization, M.M., A.H. and L.B.; Writing—original draft, M.M. and A.H.; Writing—review and editing, M.M., G.A., A.H., V.O., J.M., B.M.V., M.S.L. and L.B. All authors have read and agreed to the published version of the manuscript.

Funding

The study was fully supported within the project Uncorking rural heritage: indigenous production of fermented beverages for local cultural and environmental sustainability, funded by Iceland, Liechtenstein and Norway through the EEA and Norway Grants Fund for Regional Cooperation—grant number 2018-1-0682.

Institutional Review Board Statement

Not applicable.

Informed Consent Statement

Not applicable.

Data Availability Statement

Data are contained within the article or Supplementary Material.

Acknowledgments

The project Uncorking rural heritage: indigenous production of fermented beverages for local cultural and environmental sustainability benefits from a 1,501,000.00 EUR grant from Iceland, Liechtenstein, and Norway through the EEA and Norway Grants Fund for Regional Cooperation. The aim of the project is to foster the development of rural areas by improving common research capacity and knowledge dissemination applied to the “terroir” approach for wine and cider production in selected areas of Slovenia, Croatia, North Macedonia, and Norway. The sixth author (Ahmad Hosseini) would also like to express appreciation towards the Slovenian Research Agency for their financial support extended through the research core funding for the program Knowledge Technologies (No. P2-0103).

Conflicts of Interest

The authors declare no conflicts of interest. The funders had no role in the design of the study, in the collection, analyses, or interpretation of data, in the writing of the manuscript, or in the decision to publish the results.

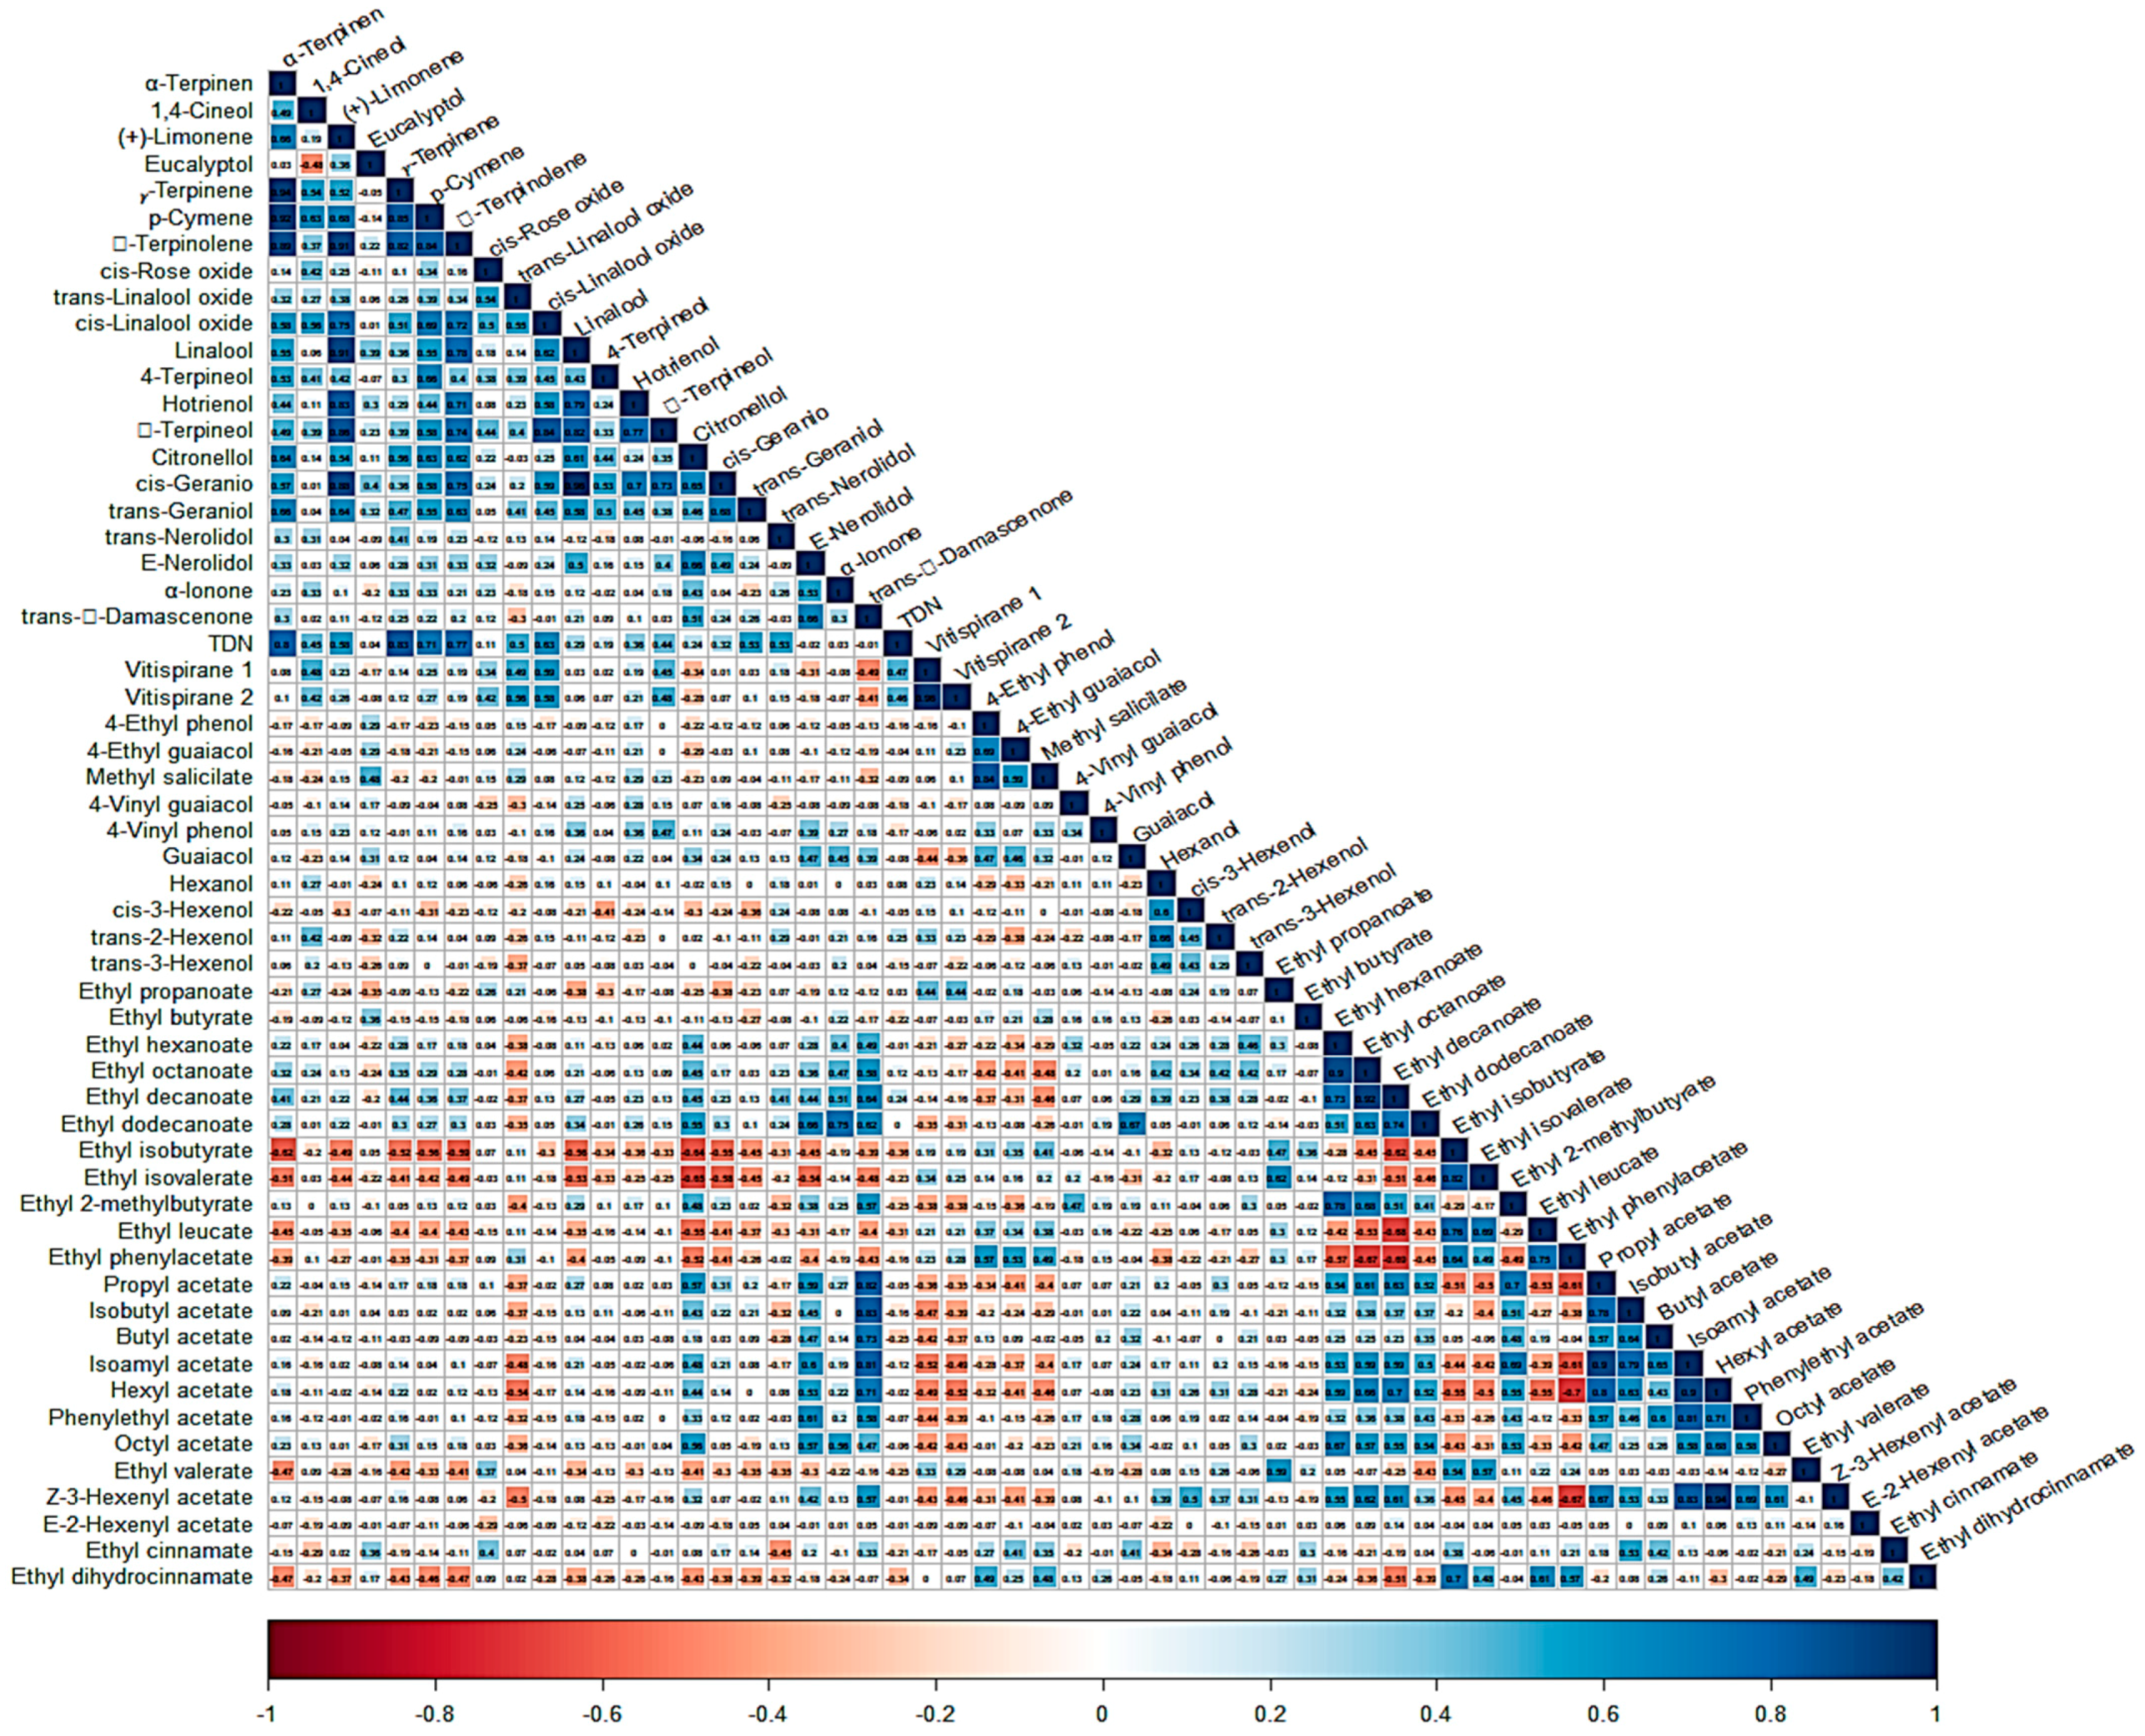
Appendix A. Correlation Matrix and (Pearson) Correlation Coefficients

Figure A1. The correlogram, based on Pearson’s correlation coefficients (α = 5%), for all 57 VOCs in all samples, independent of geographical regions.
Beverages 10 00024 g0a1

Appendix B. PCA Results

Table A1. Importance of components associated with the PCA for VOCs in 32 samples from the Slavonia and Podunavlje sub-regions.
F1F2F3F4F5F6F7F8F9F10
Eigenvalue15.2158.6935.6534.2383.5872.5362.4102.0431.7411.668
Variability (%)26.69415.2529.9177.4346.2934.4494.2273.5843.0552.927
Cumulative %26.69441.94551.86259.29765.59070.03974.26677.85080.90583.832
Table A2. PCA results for contribution of the variables (%) factor loadings associated with the most important VOCs in 32 samples from the Slavonia and Podunavlje sub-regions.
VOCα-Terpinen1,4-Cineol(+)-Limoneneγ-TerpineneZ-3-Hexenyl Acetateα-TerpinoleneE-Nerolidol
F12.7130.2972.4192.2393.2872.9403.345
F24.264 *5.494 *4.8034.018 *1.9374.450 *0.021
VOCcis-GeraniolVitispirane 2LinaloolTDNtrans-Linalool oxideEthyl dodecanoatetrans-β-Damascenone
F12.5740.8023.1880.4150.4943.215 *3.701 *
F20.4635.164 *0.3116.407 *6.184 *0.3960.999
VOCHexyl acetateEthyl octanoatep-CymeneEthyl leucateEthyl phenylacetatePropyl acetateIsoamyl acetate
F14.315 *3.706 *1.9963.1123.815 *4.015 *3.854
F22.0680.3116.172 *0.0290.2551.3012.819
VOCOctyl acetateEthyl isovalerateCitronellolEthyl isobutyratetrans-Linalool oxideEthyl hexanoate
F13.1193.193 *4.132 *4.211 *2.9402.604
F20.5110.0210.0820.3694.450 *0.726
* Variables with higher loadings.
Figure A2. The PCA score scatter plot (top) and biplot (loadings and score plot) (bottom) in the rotated space for 57 VOCs associated with 32 samples from 2 geographical sub-regions, Podunavlje (P) and Slavonia (S).
Beverages 10 00024 g0a2aBeverages 10 00024 g0a2b
Figure A3. The PCA score scatter plot (top) and the biplot (bottom) in the rotated space for 22 VOCs associated with 32 samples from 2 geographical sub-regions, Podunavlje (P) and Slavonia (S).
Beverages 10 00024 g0a3aBeverages 10 00024 g0a3b

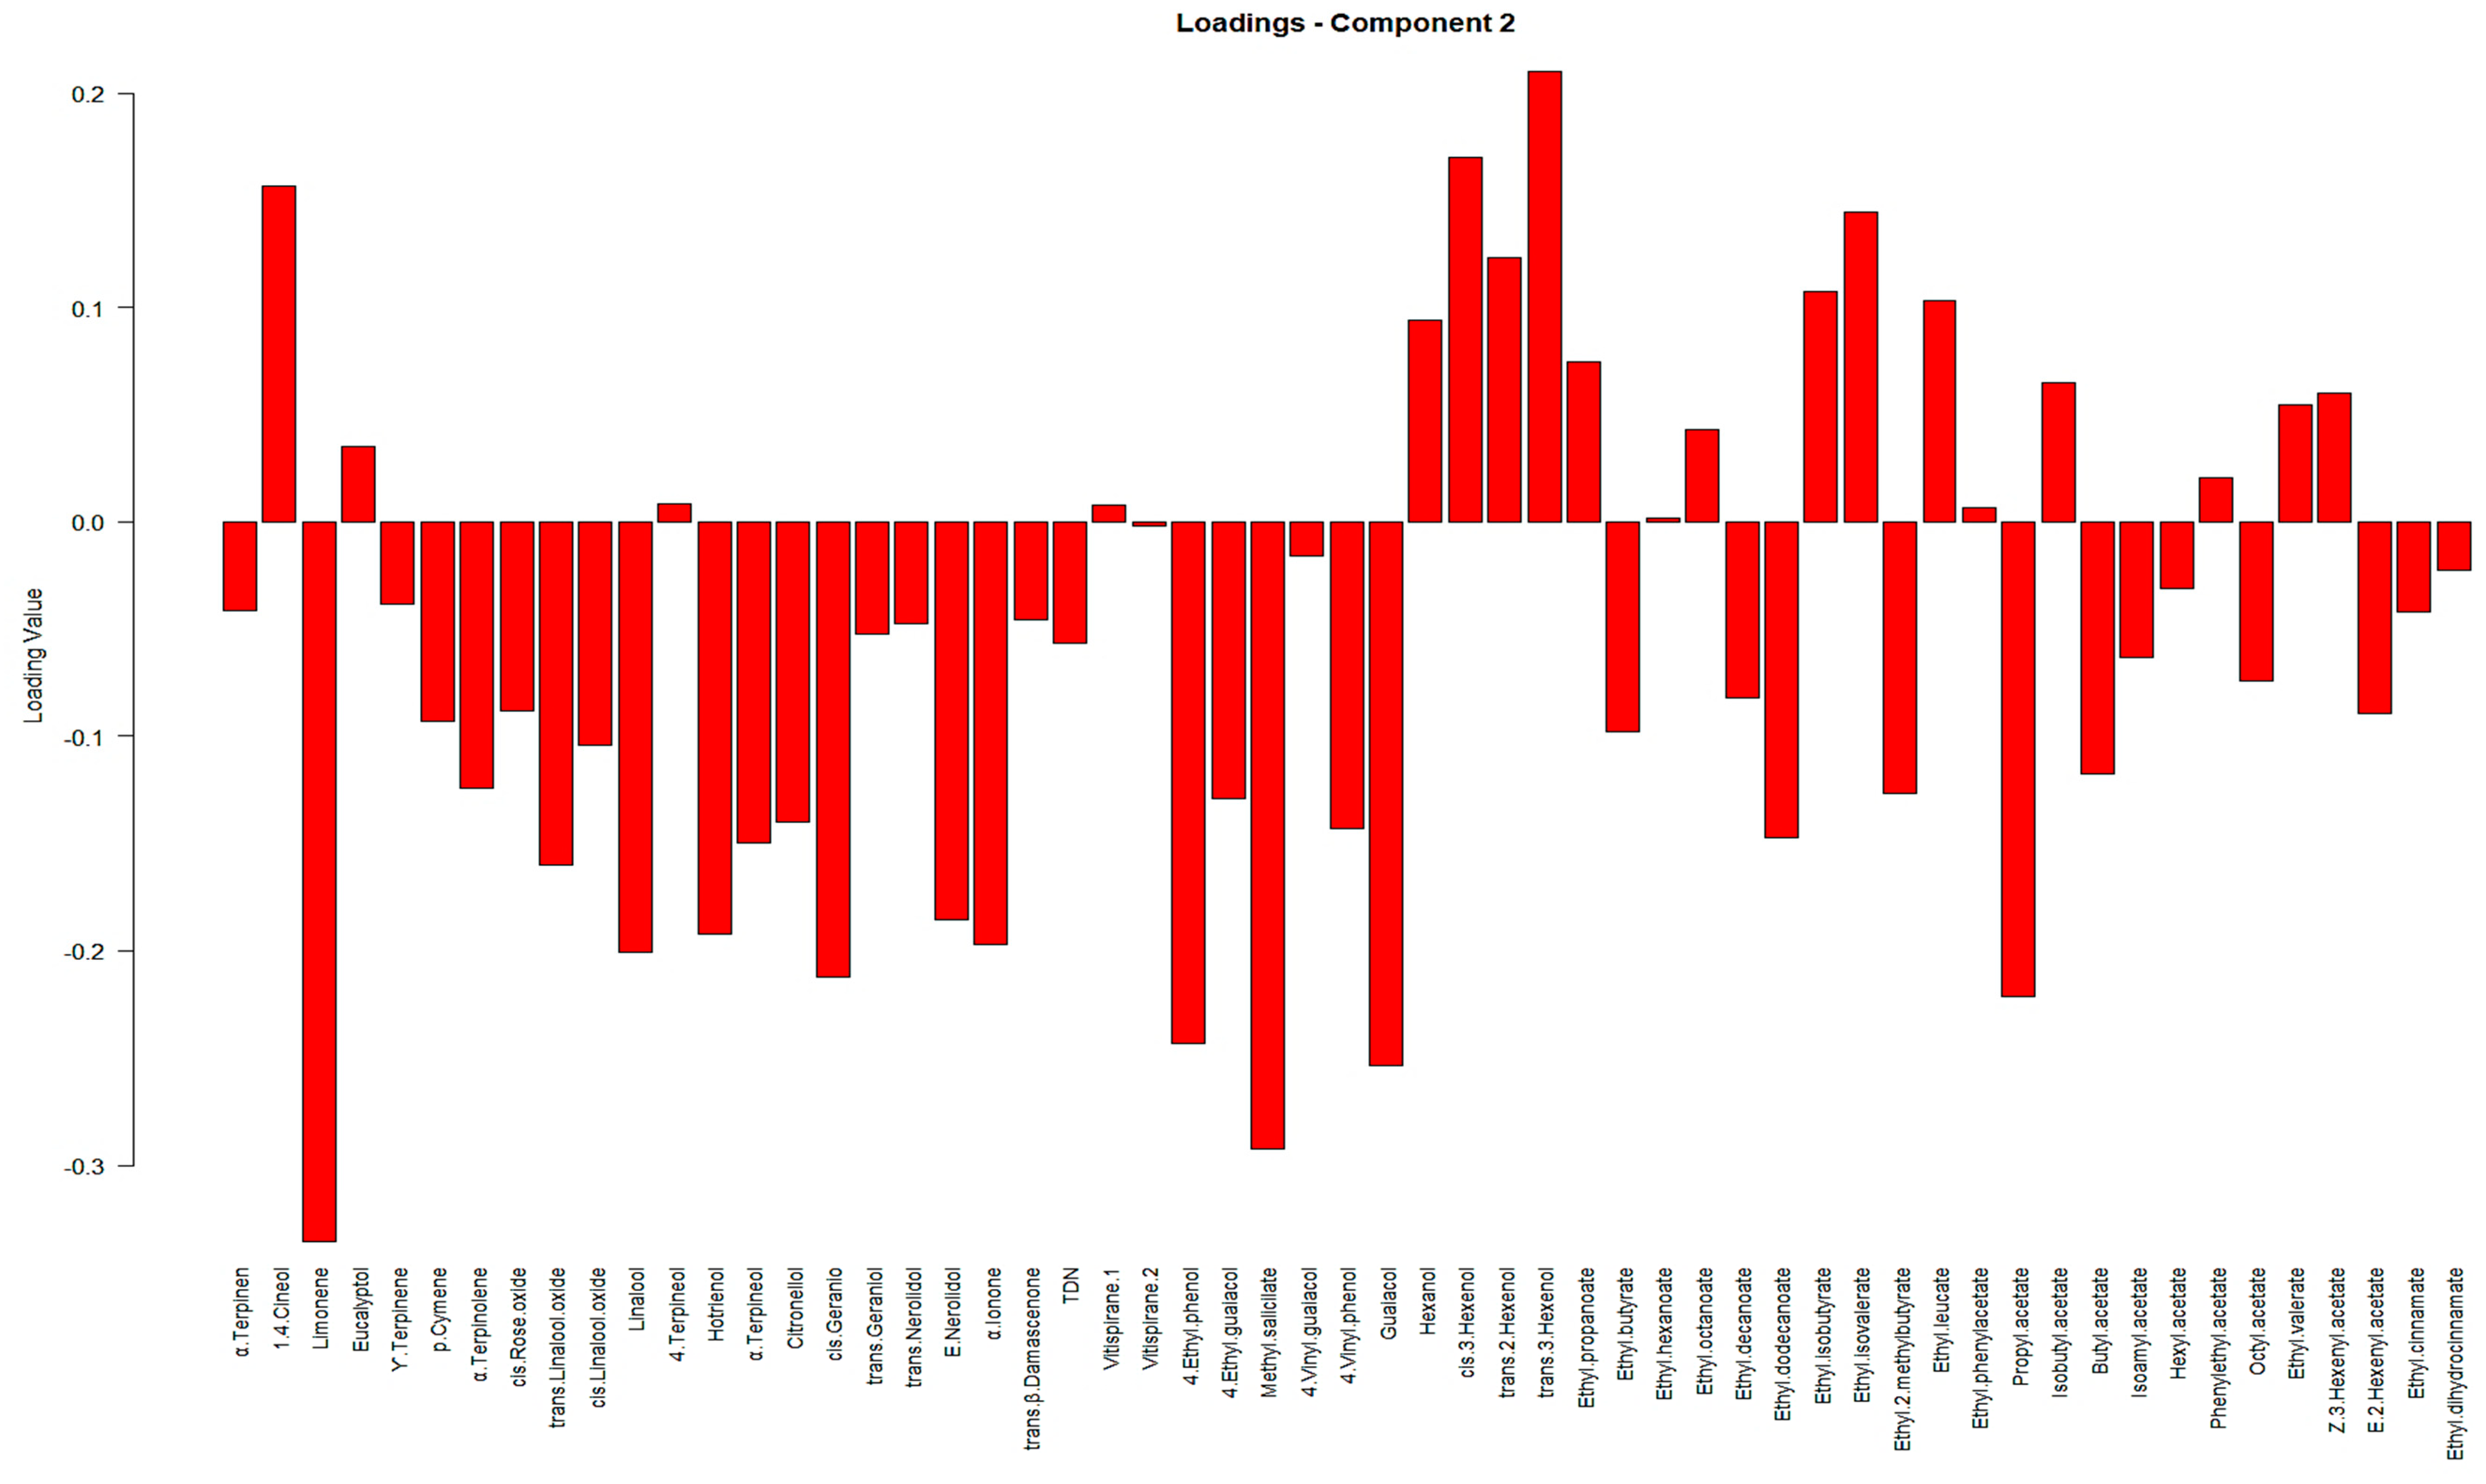
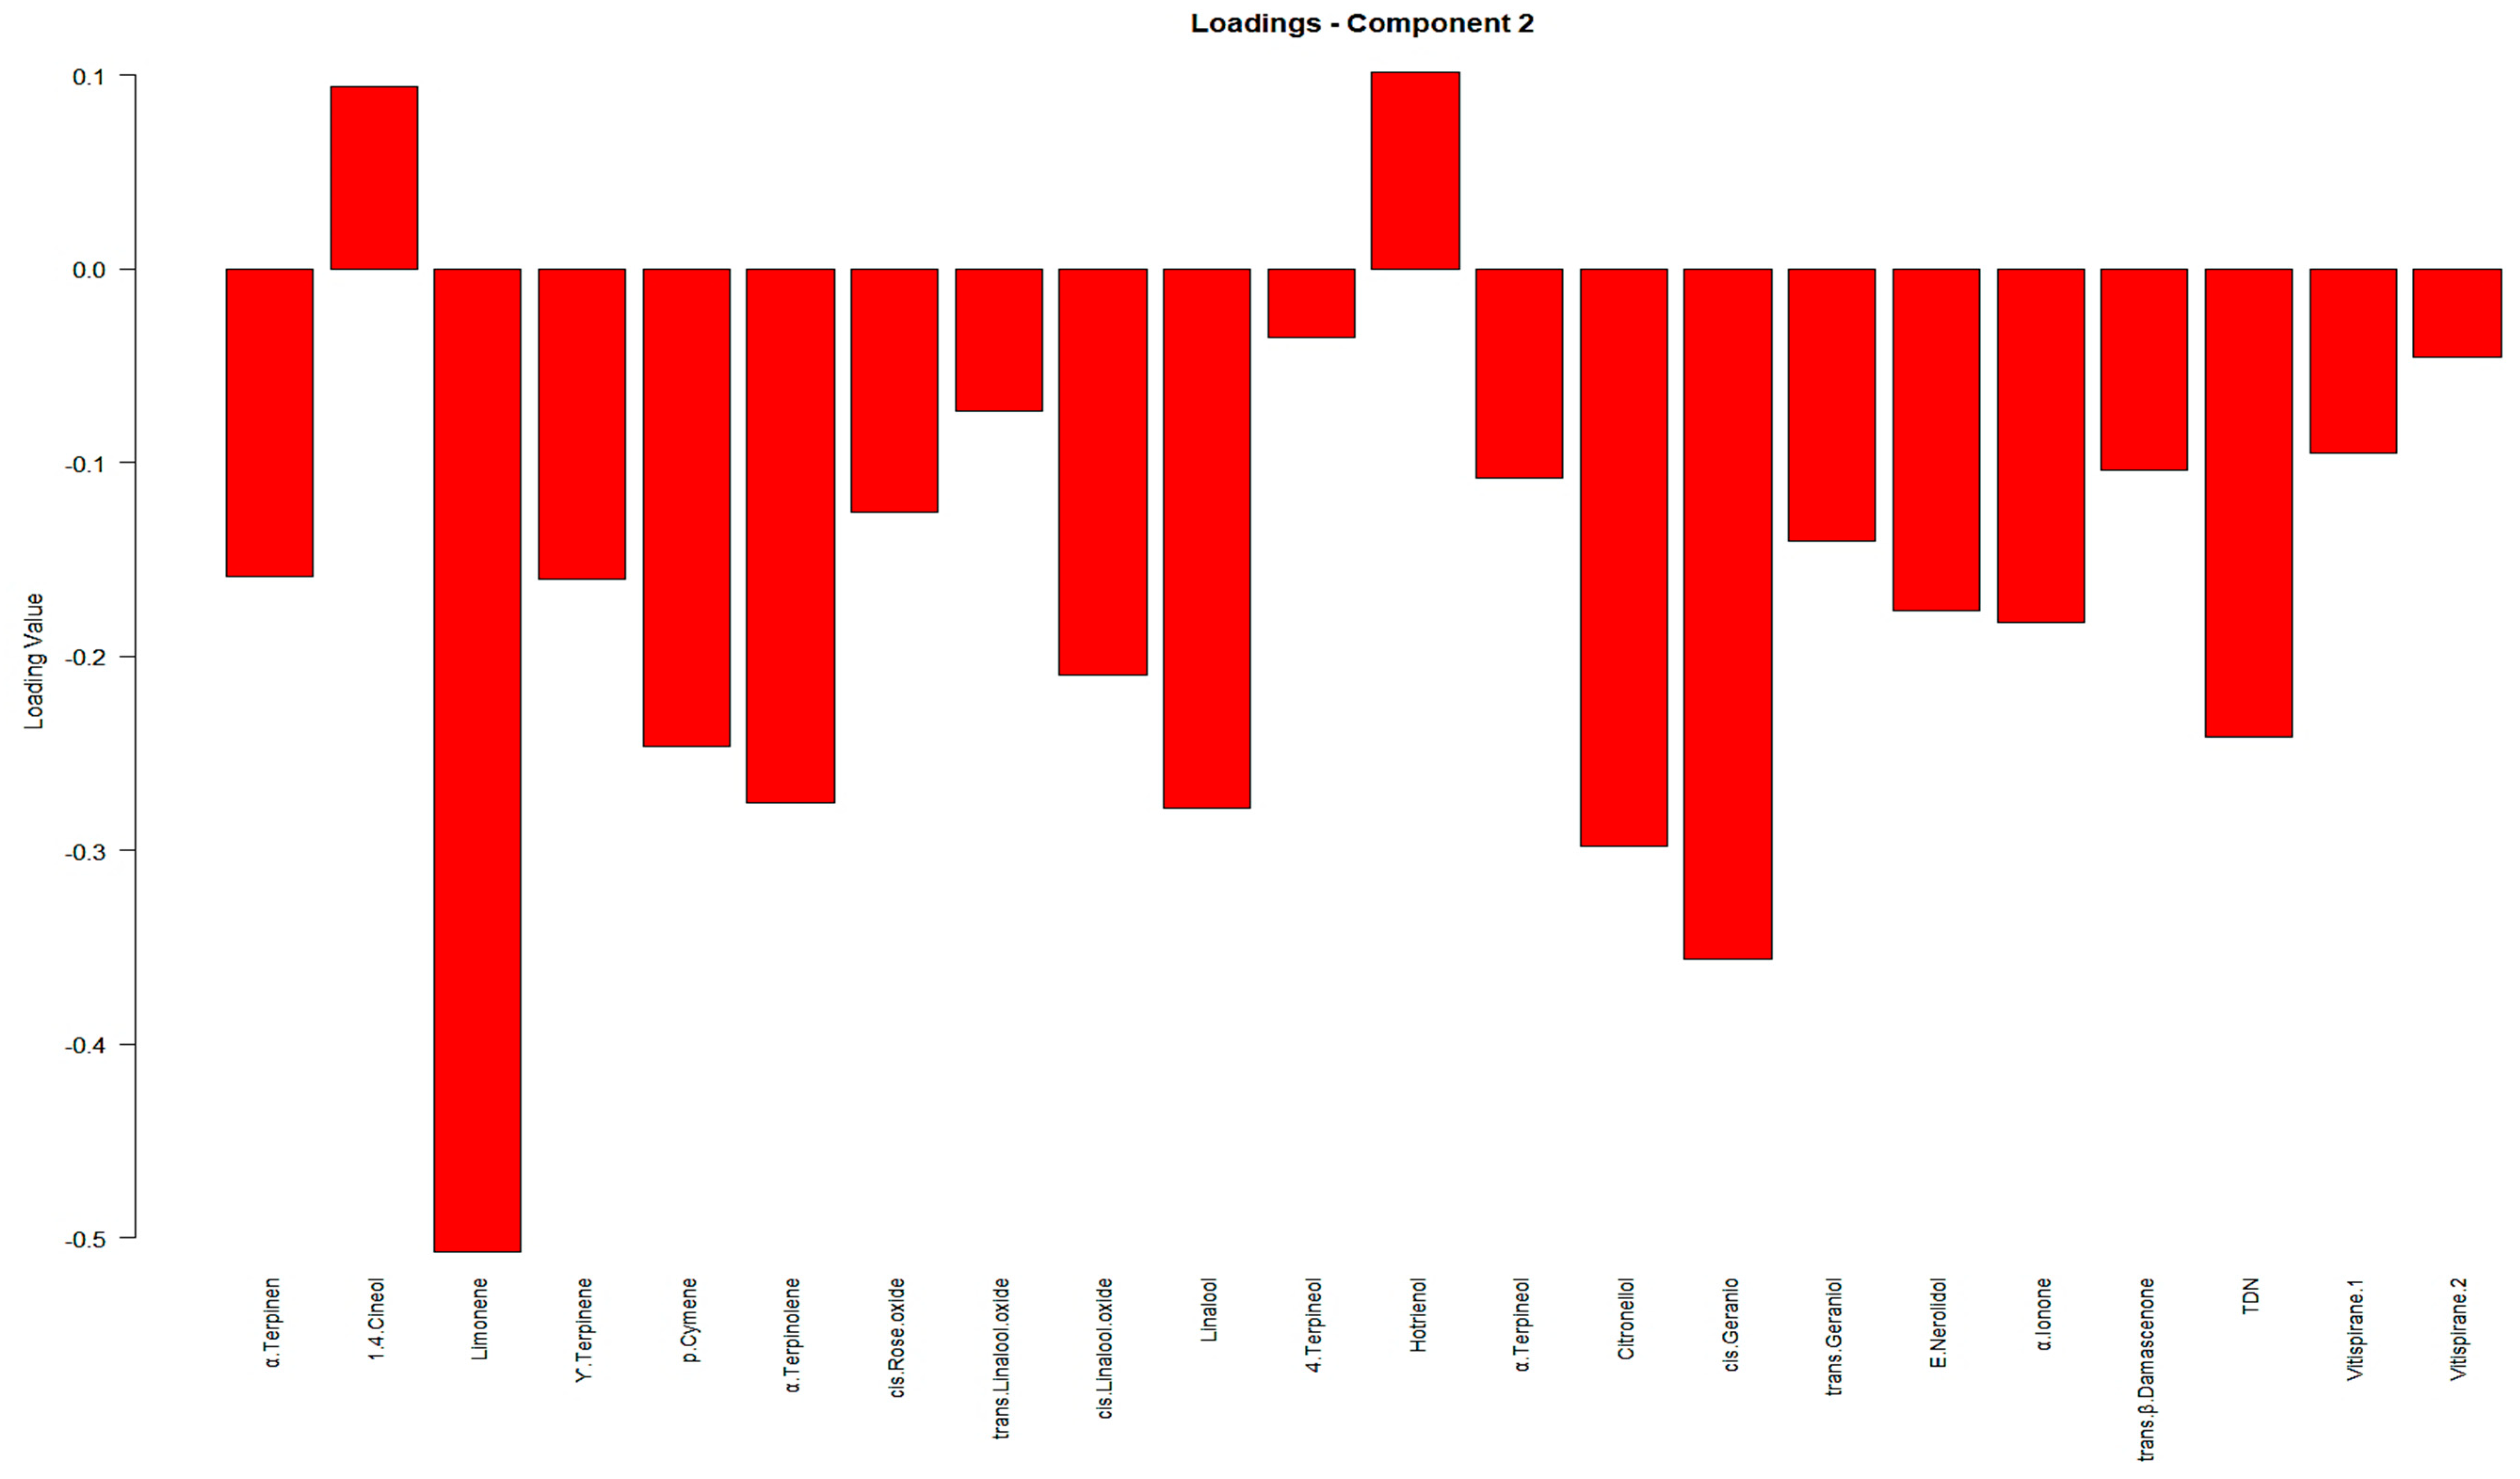
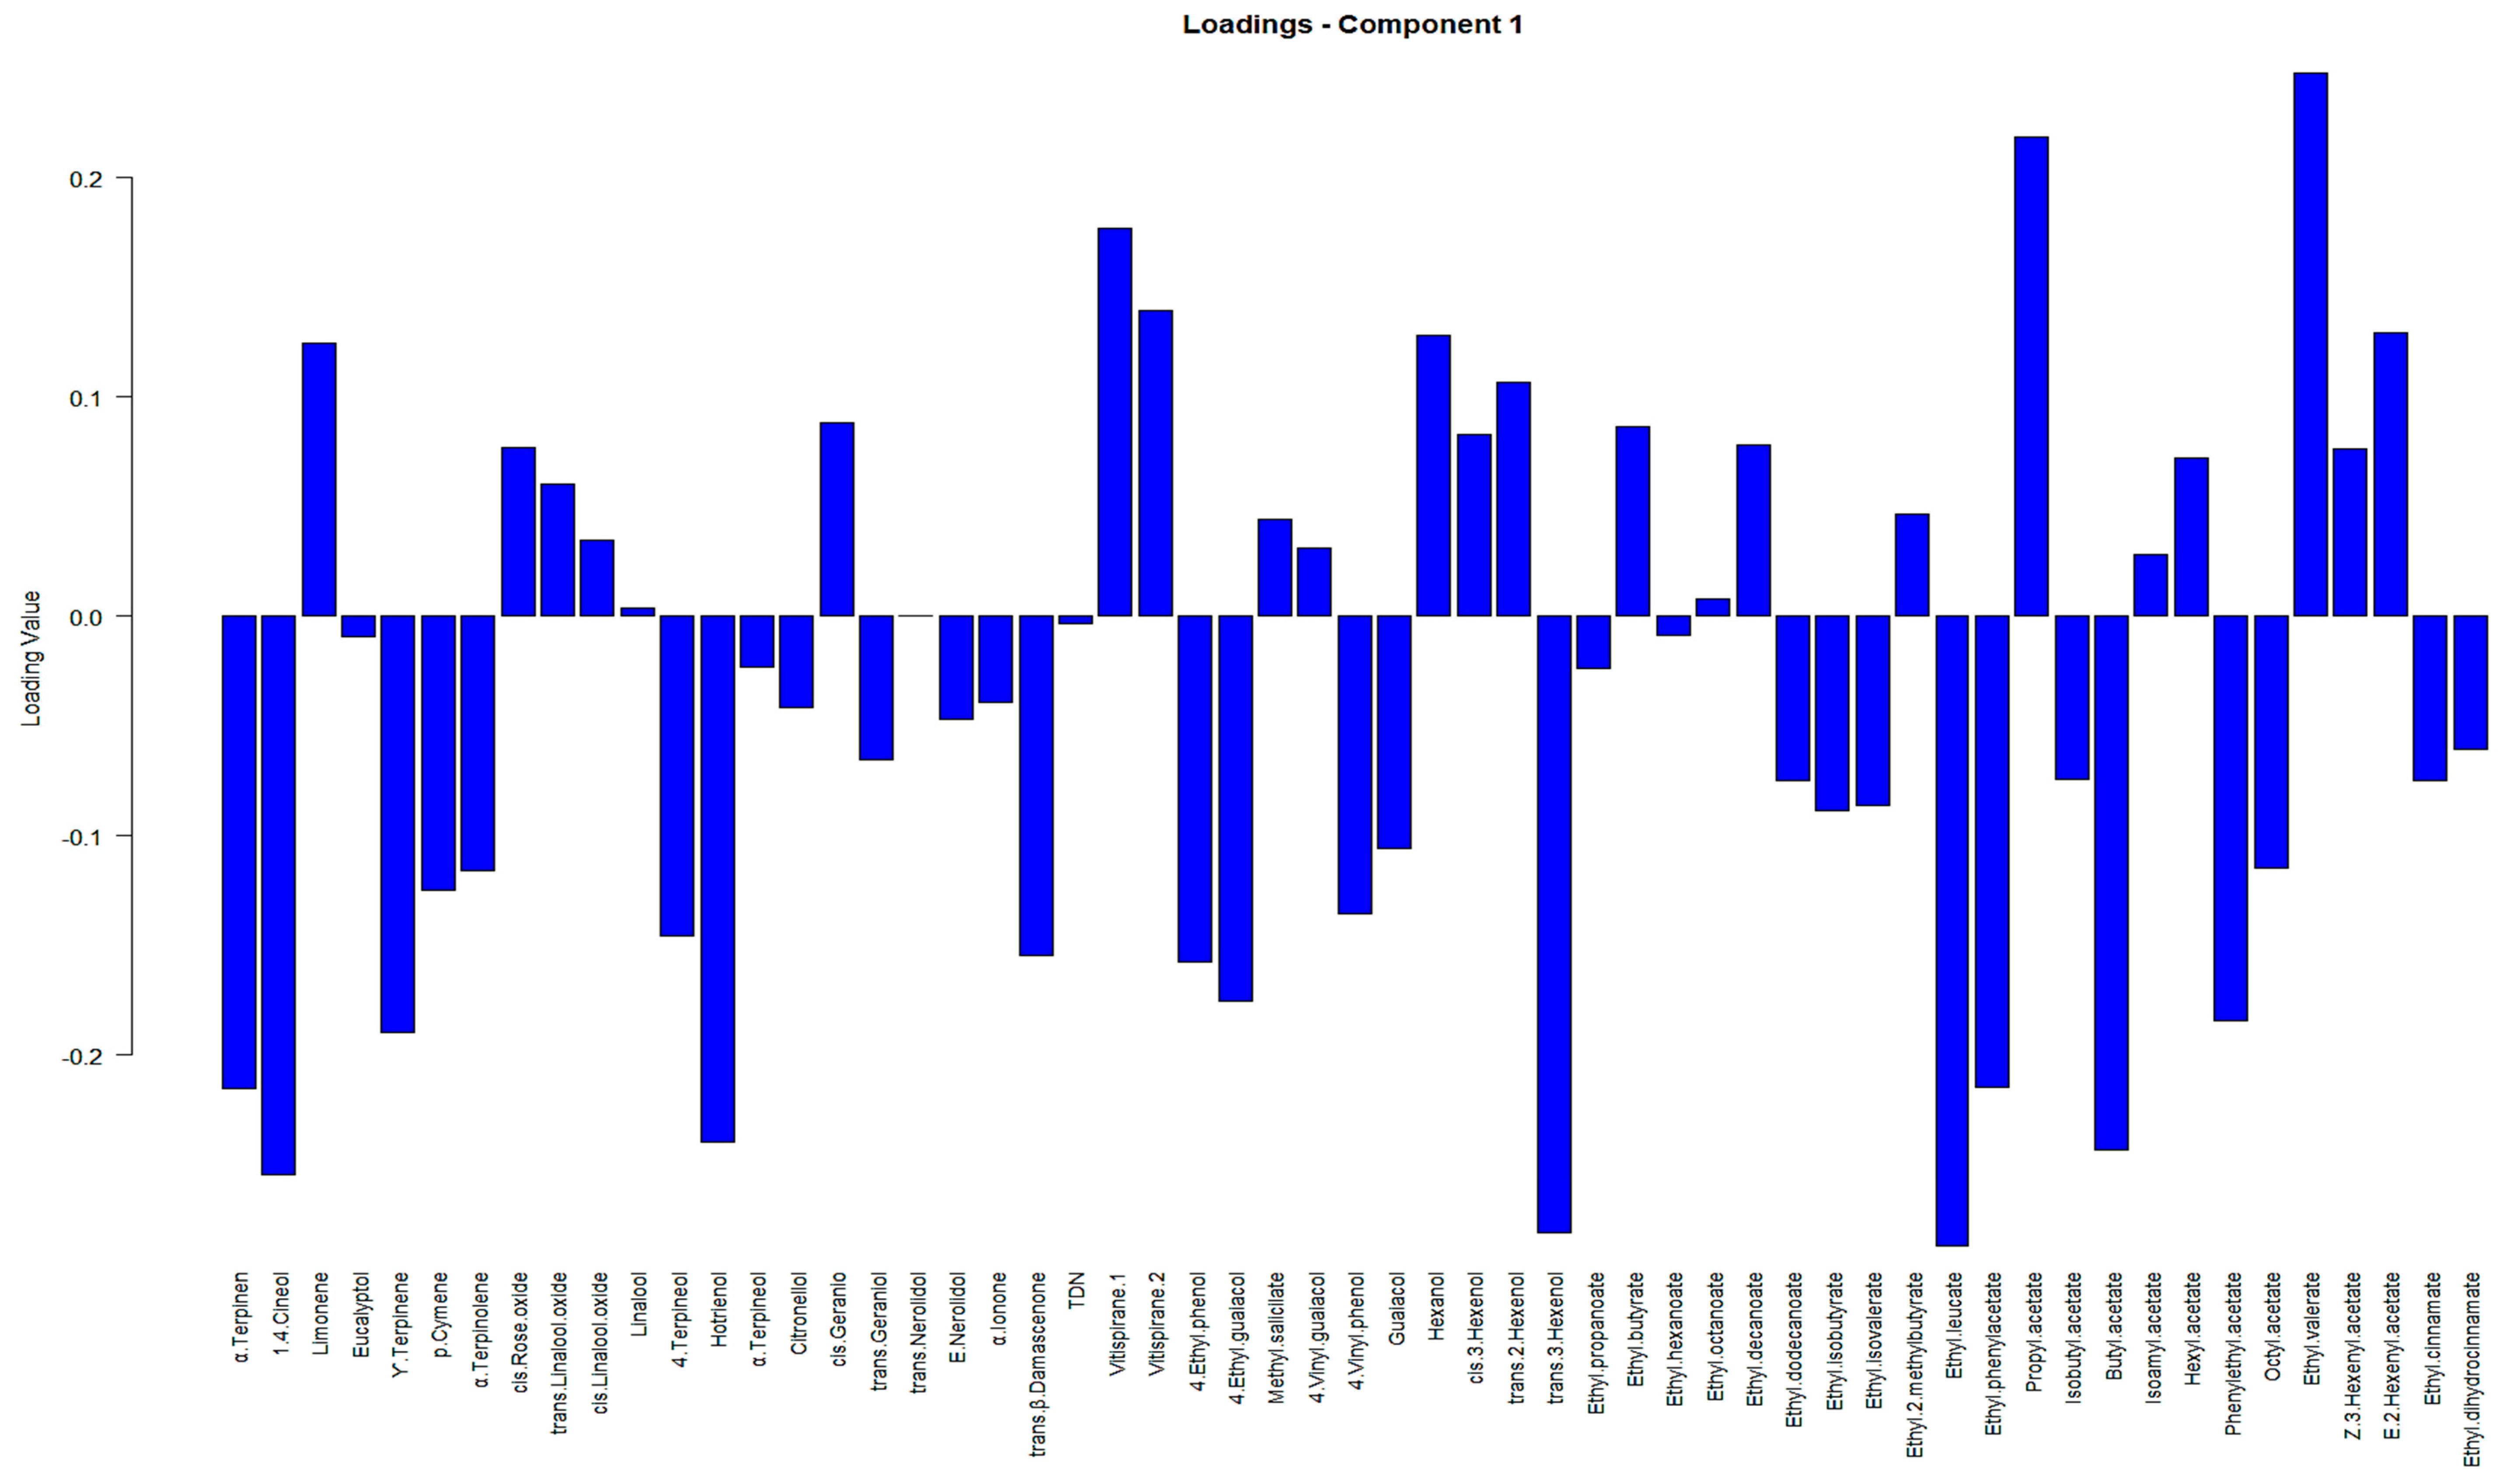
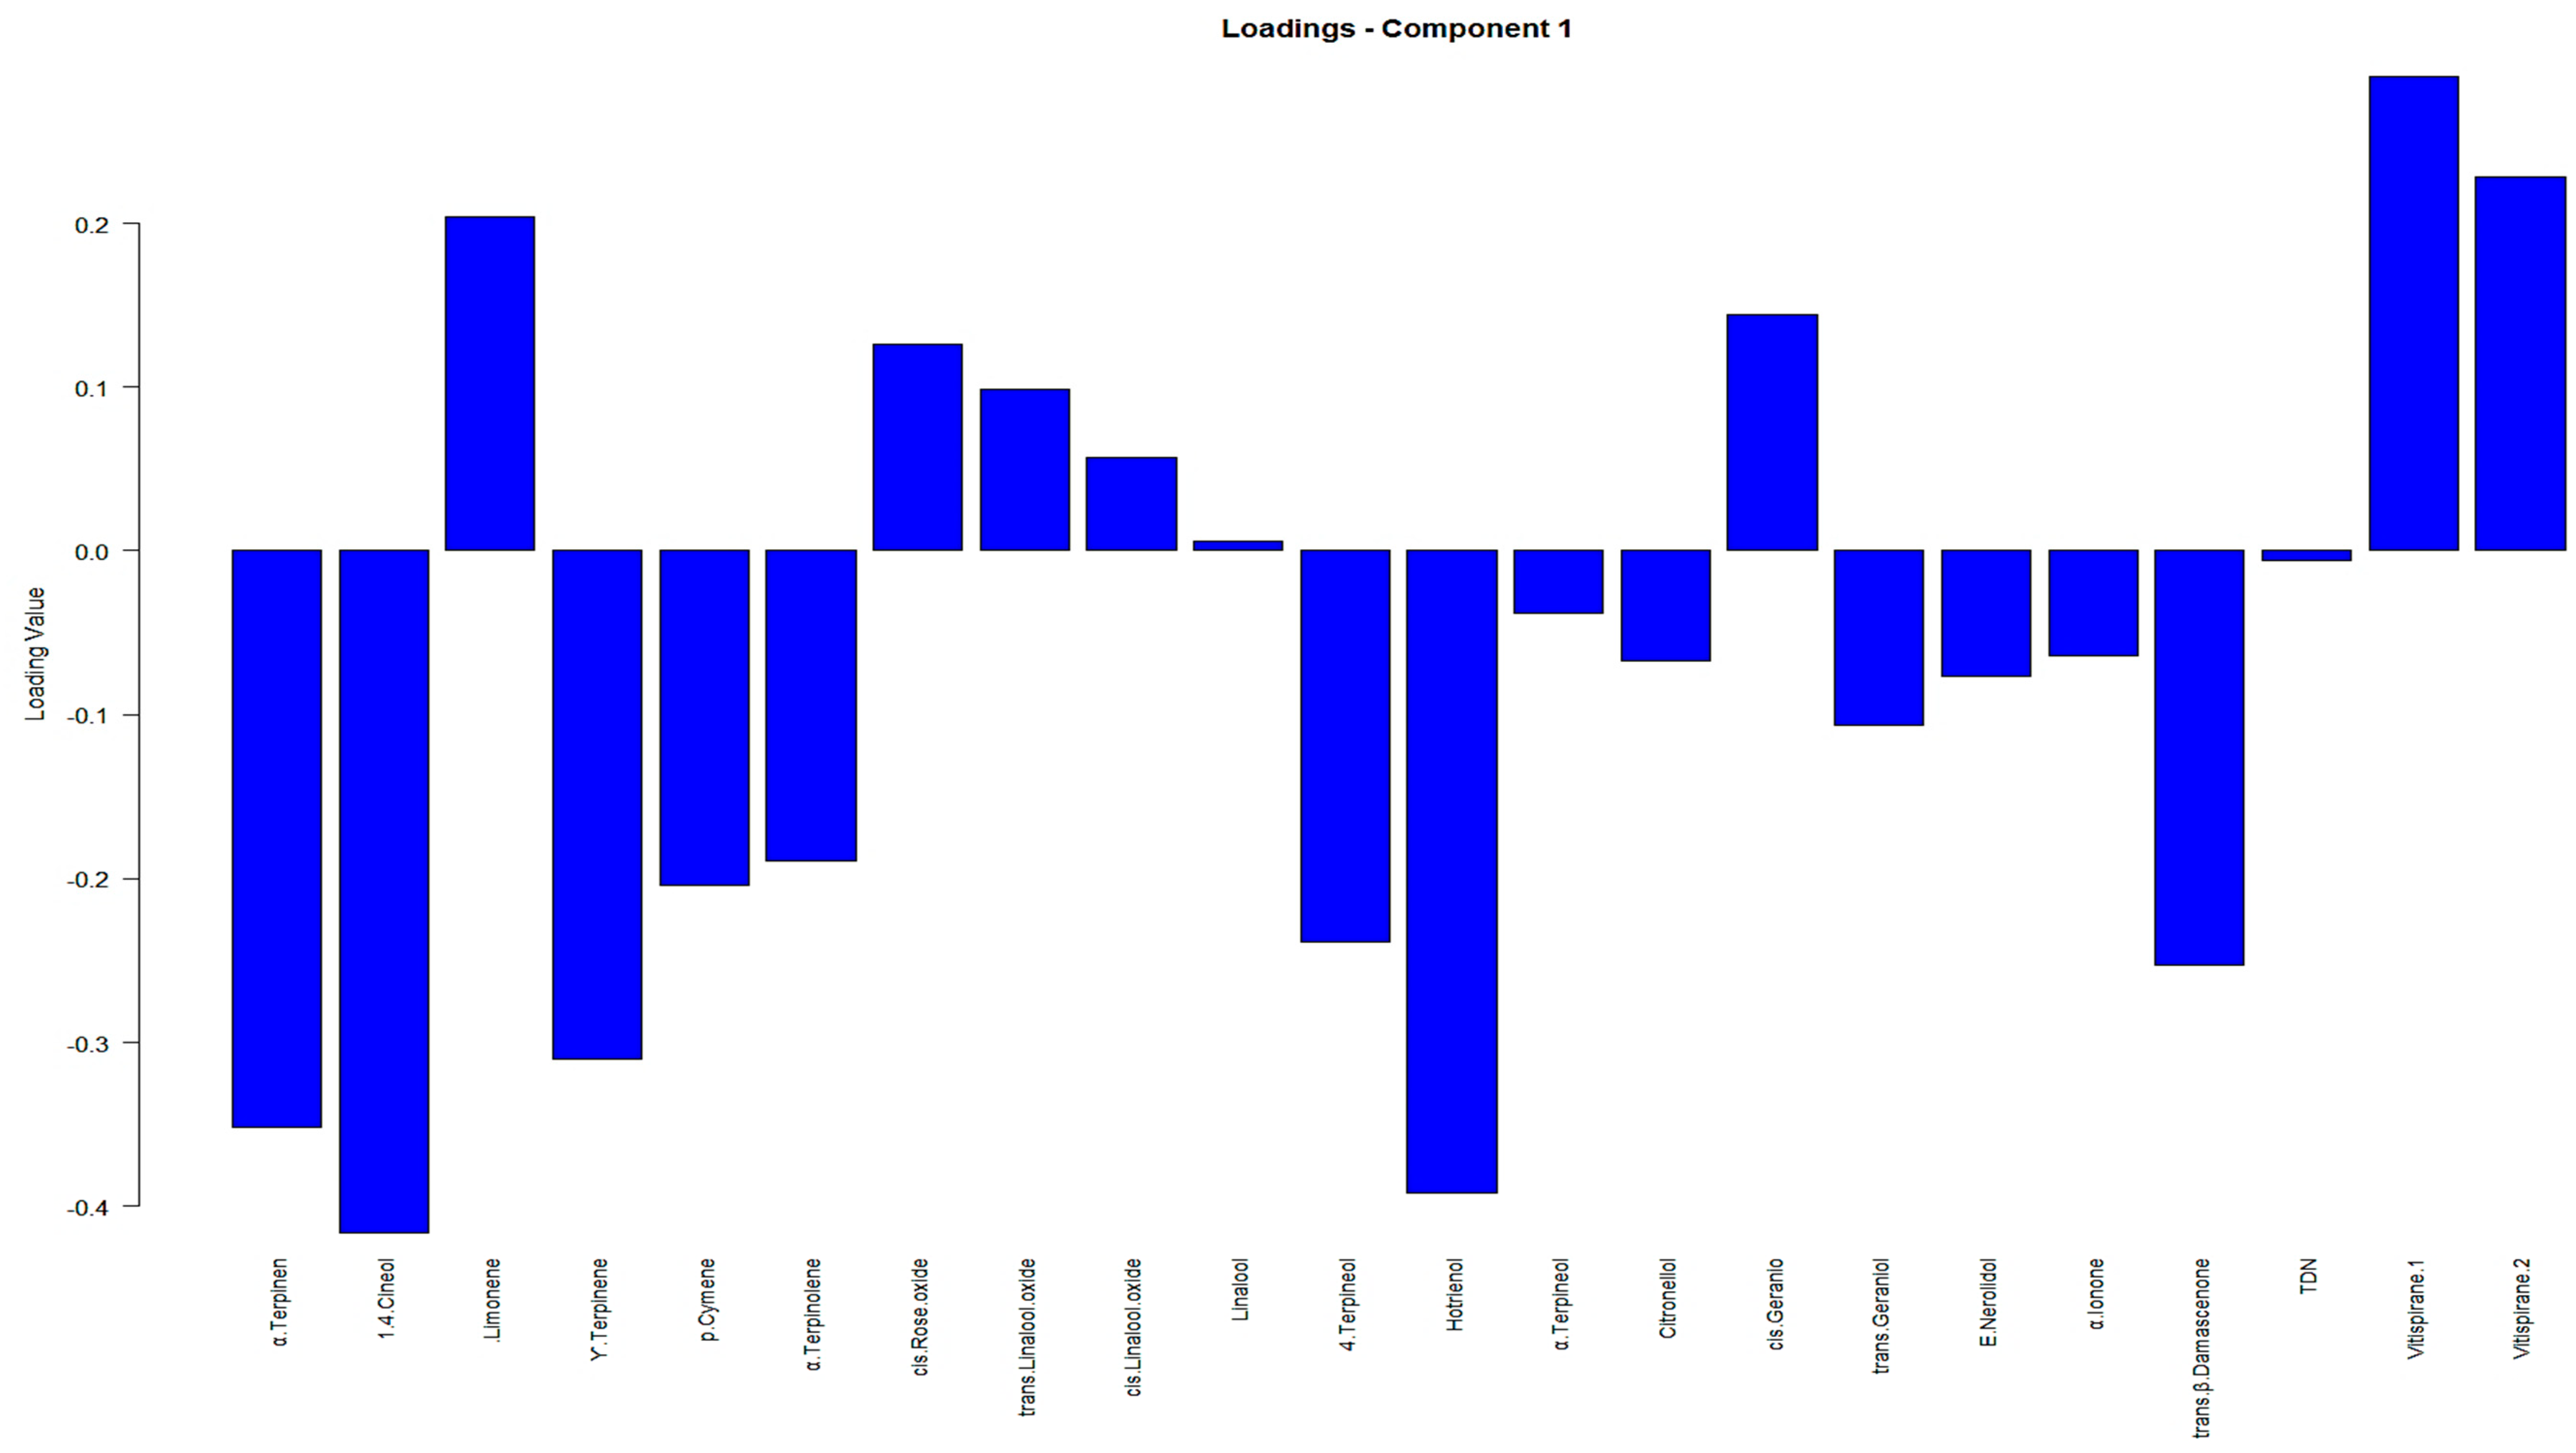
Appendix C. PLS-DA Loadings for 57 VOCs and 22 VOCs

In Partial Least Squares-Discriminant Analysis (PLS-DA), loadings represent the relationships between the predictor variables (VOCs) and the latent variables that discriminate between different groups in the response variable (geographical sub-regions Slavonia and Podunavlje). Loadings provide information on the importance and direction of each predictor variable in the construction of latent variables in the PLS-DA model.
We visualized the loadings in the loading plots (depicted in Figure A4, Figure A5, Figure A6 and Figure A7), where each variable is represented by a bar, and the length and direction of the bar indicate the strength and sign of the loading, respectively. These plots help interpret the discriminatory power of individual variables in the context of our PLS-DA model. Specifically, loadings indicate the extent to which each VOC contributes to the discrimination between classes or groups in the data. Positive loadings indicate a positive association with class, whereas negative loadings indicate a negative association.
Figure A4. The individual loadings of all 57 VOCs in the PLS-DA method on the 1st component independent of the geographical region. The larger the magnitude of the loading, the more influential the corresponding variable is in distinguishing between the classes.
Beverages 10 00024 g0a4
Figure A5. The individual loadings of all 57 VOCs in the PLS-DA method on the second component, independent of geographical regions. The larger the magnitude of the loading, the more influential the corresponding variable is in distinguishing between the classes.
Beverages 10 00024 g0a5
Figure A6. The individual loadings of the 22 VOCs in the PLS-DA method on the first component, independent of geographical regions. The larger the magnitude of the loading, the more influential the corresponding variable is in distinguishing between the classes.
Beverages 10 00024 g0a6
Figure A7. The individual loadings of the 22 VOCs in the PLS-DA method on the second component, independent of geographical regions. The larger the magnitude of the loading, the more influential the corresponding variable is in distinguishing between the classes.
Beverages 10 00024 g0a7

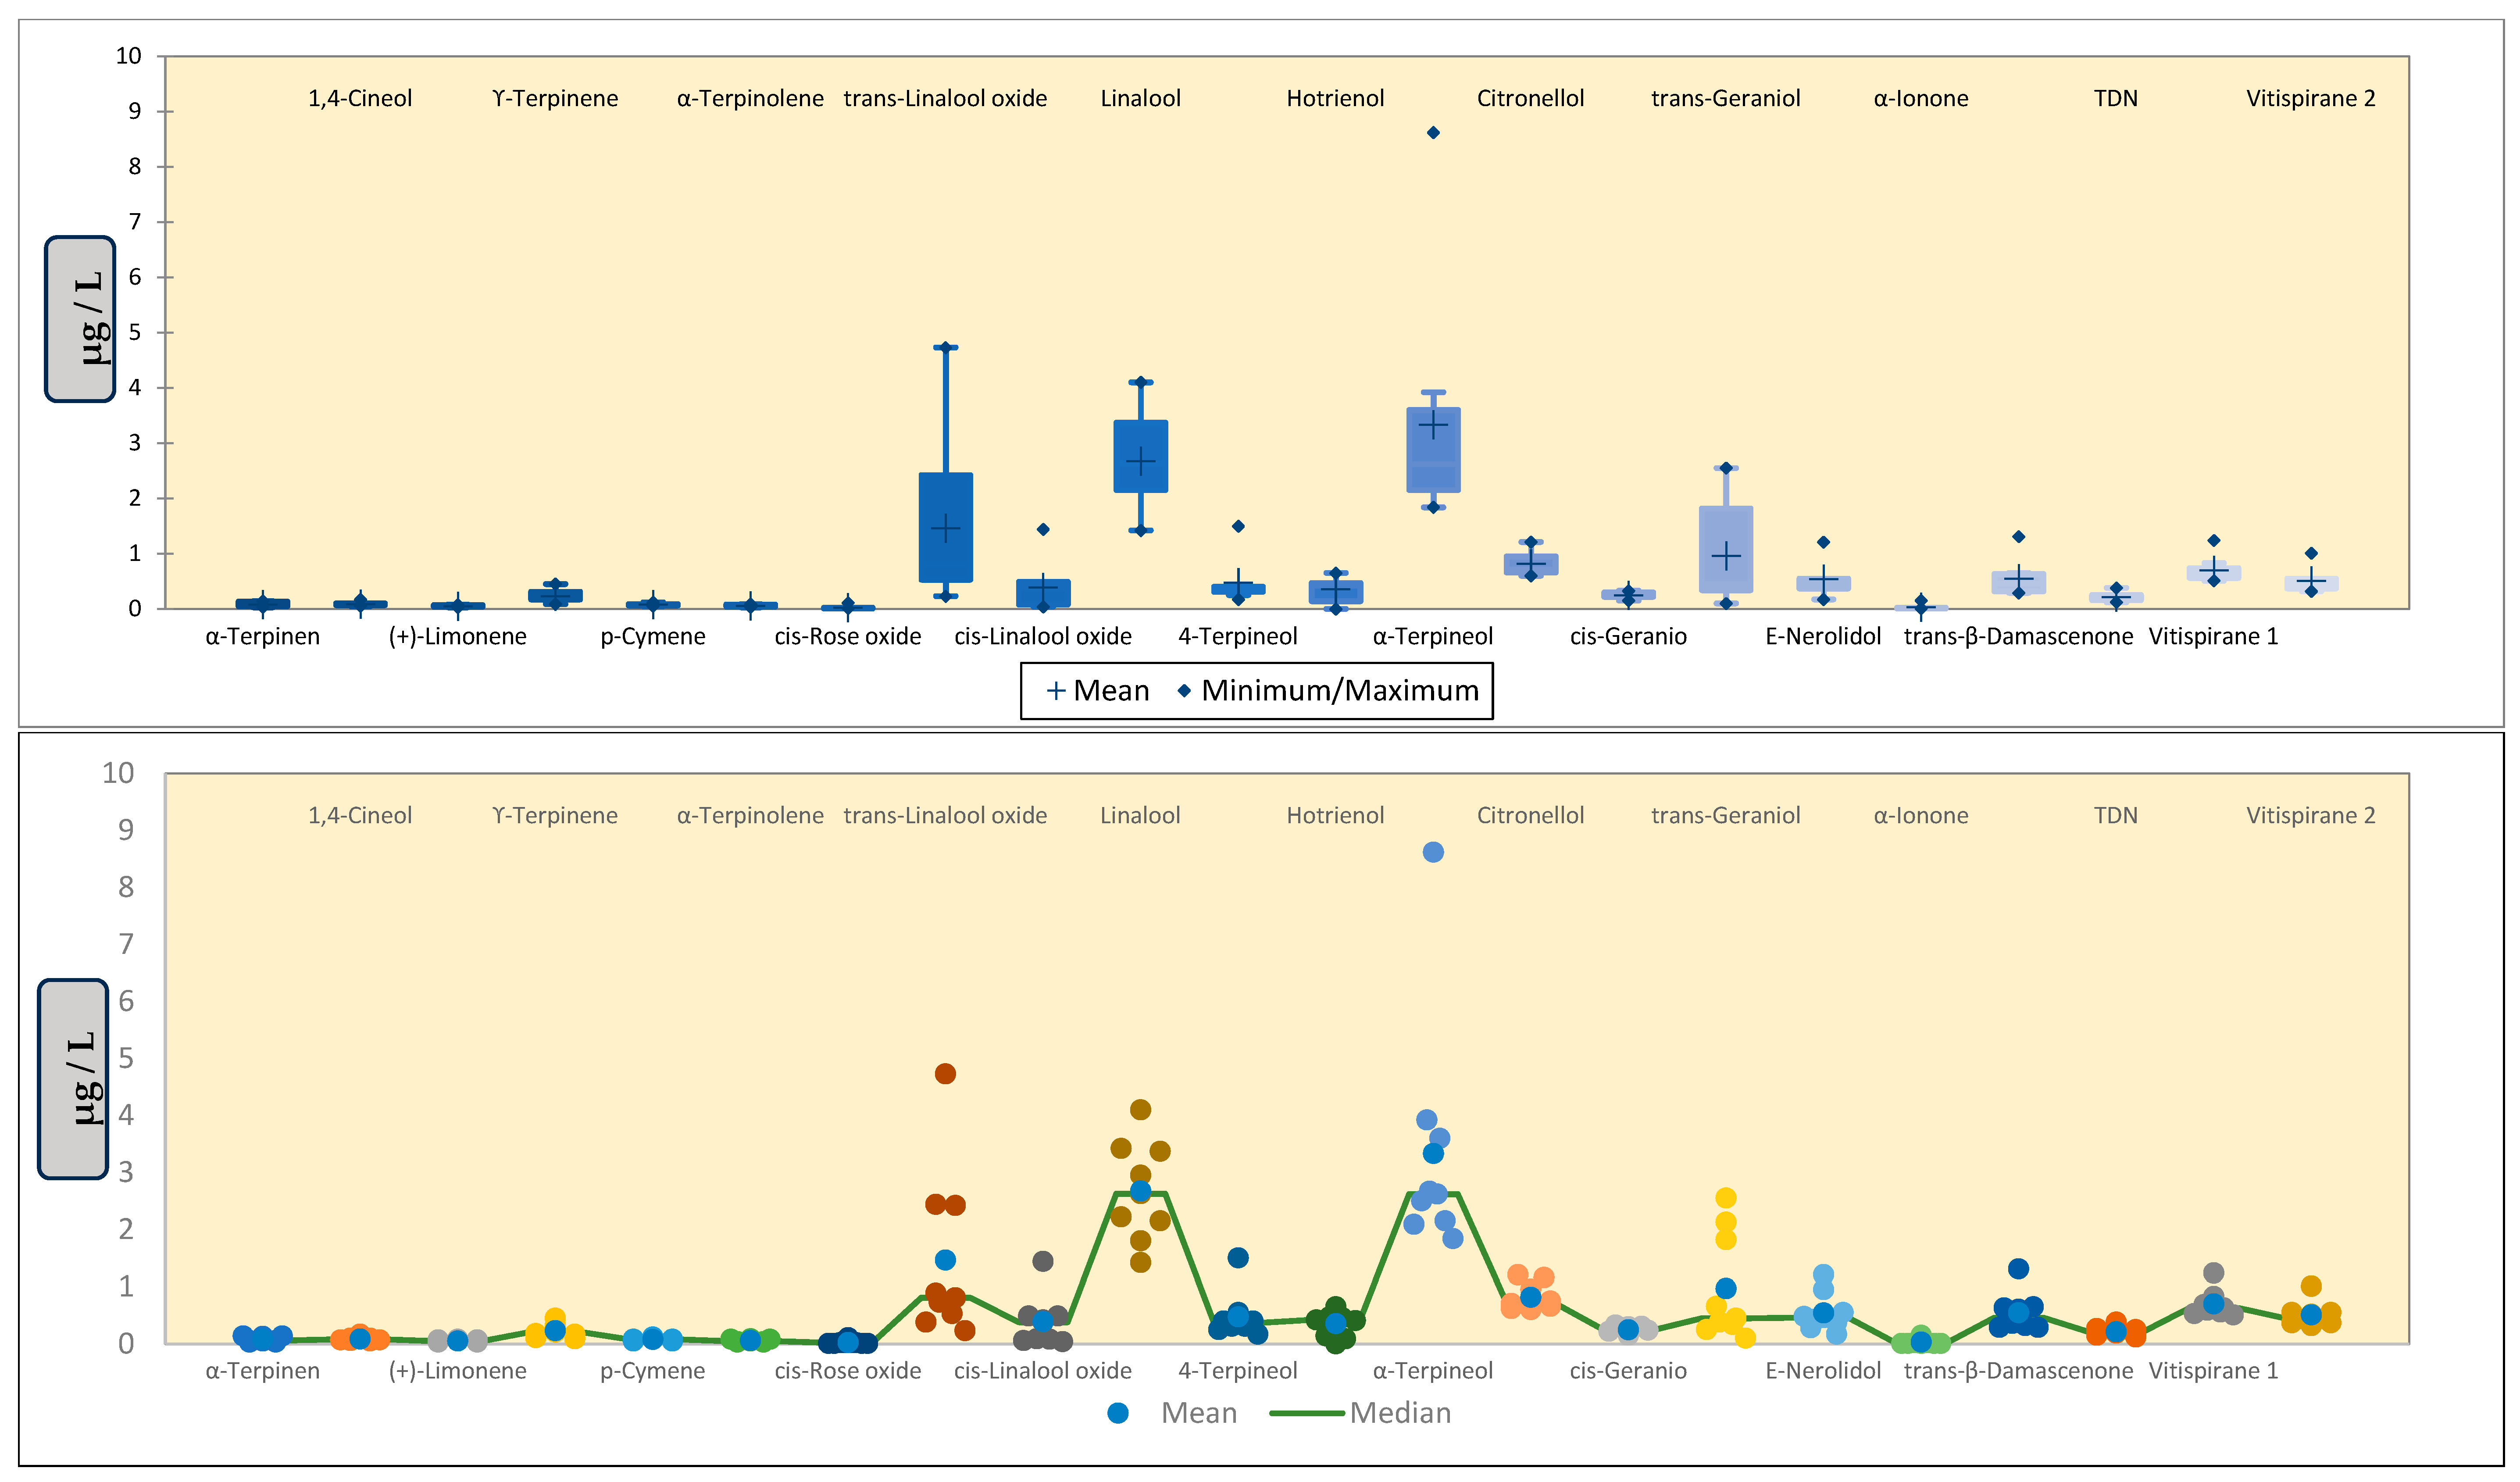
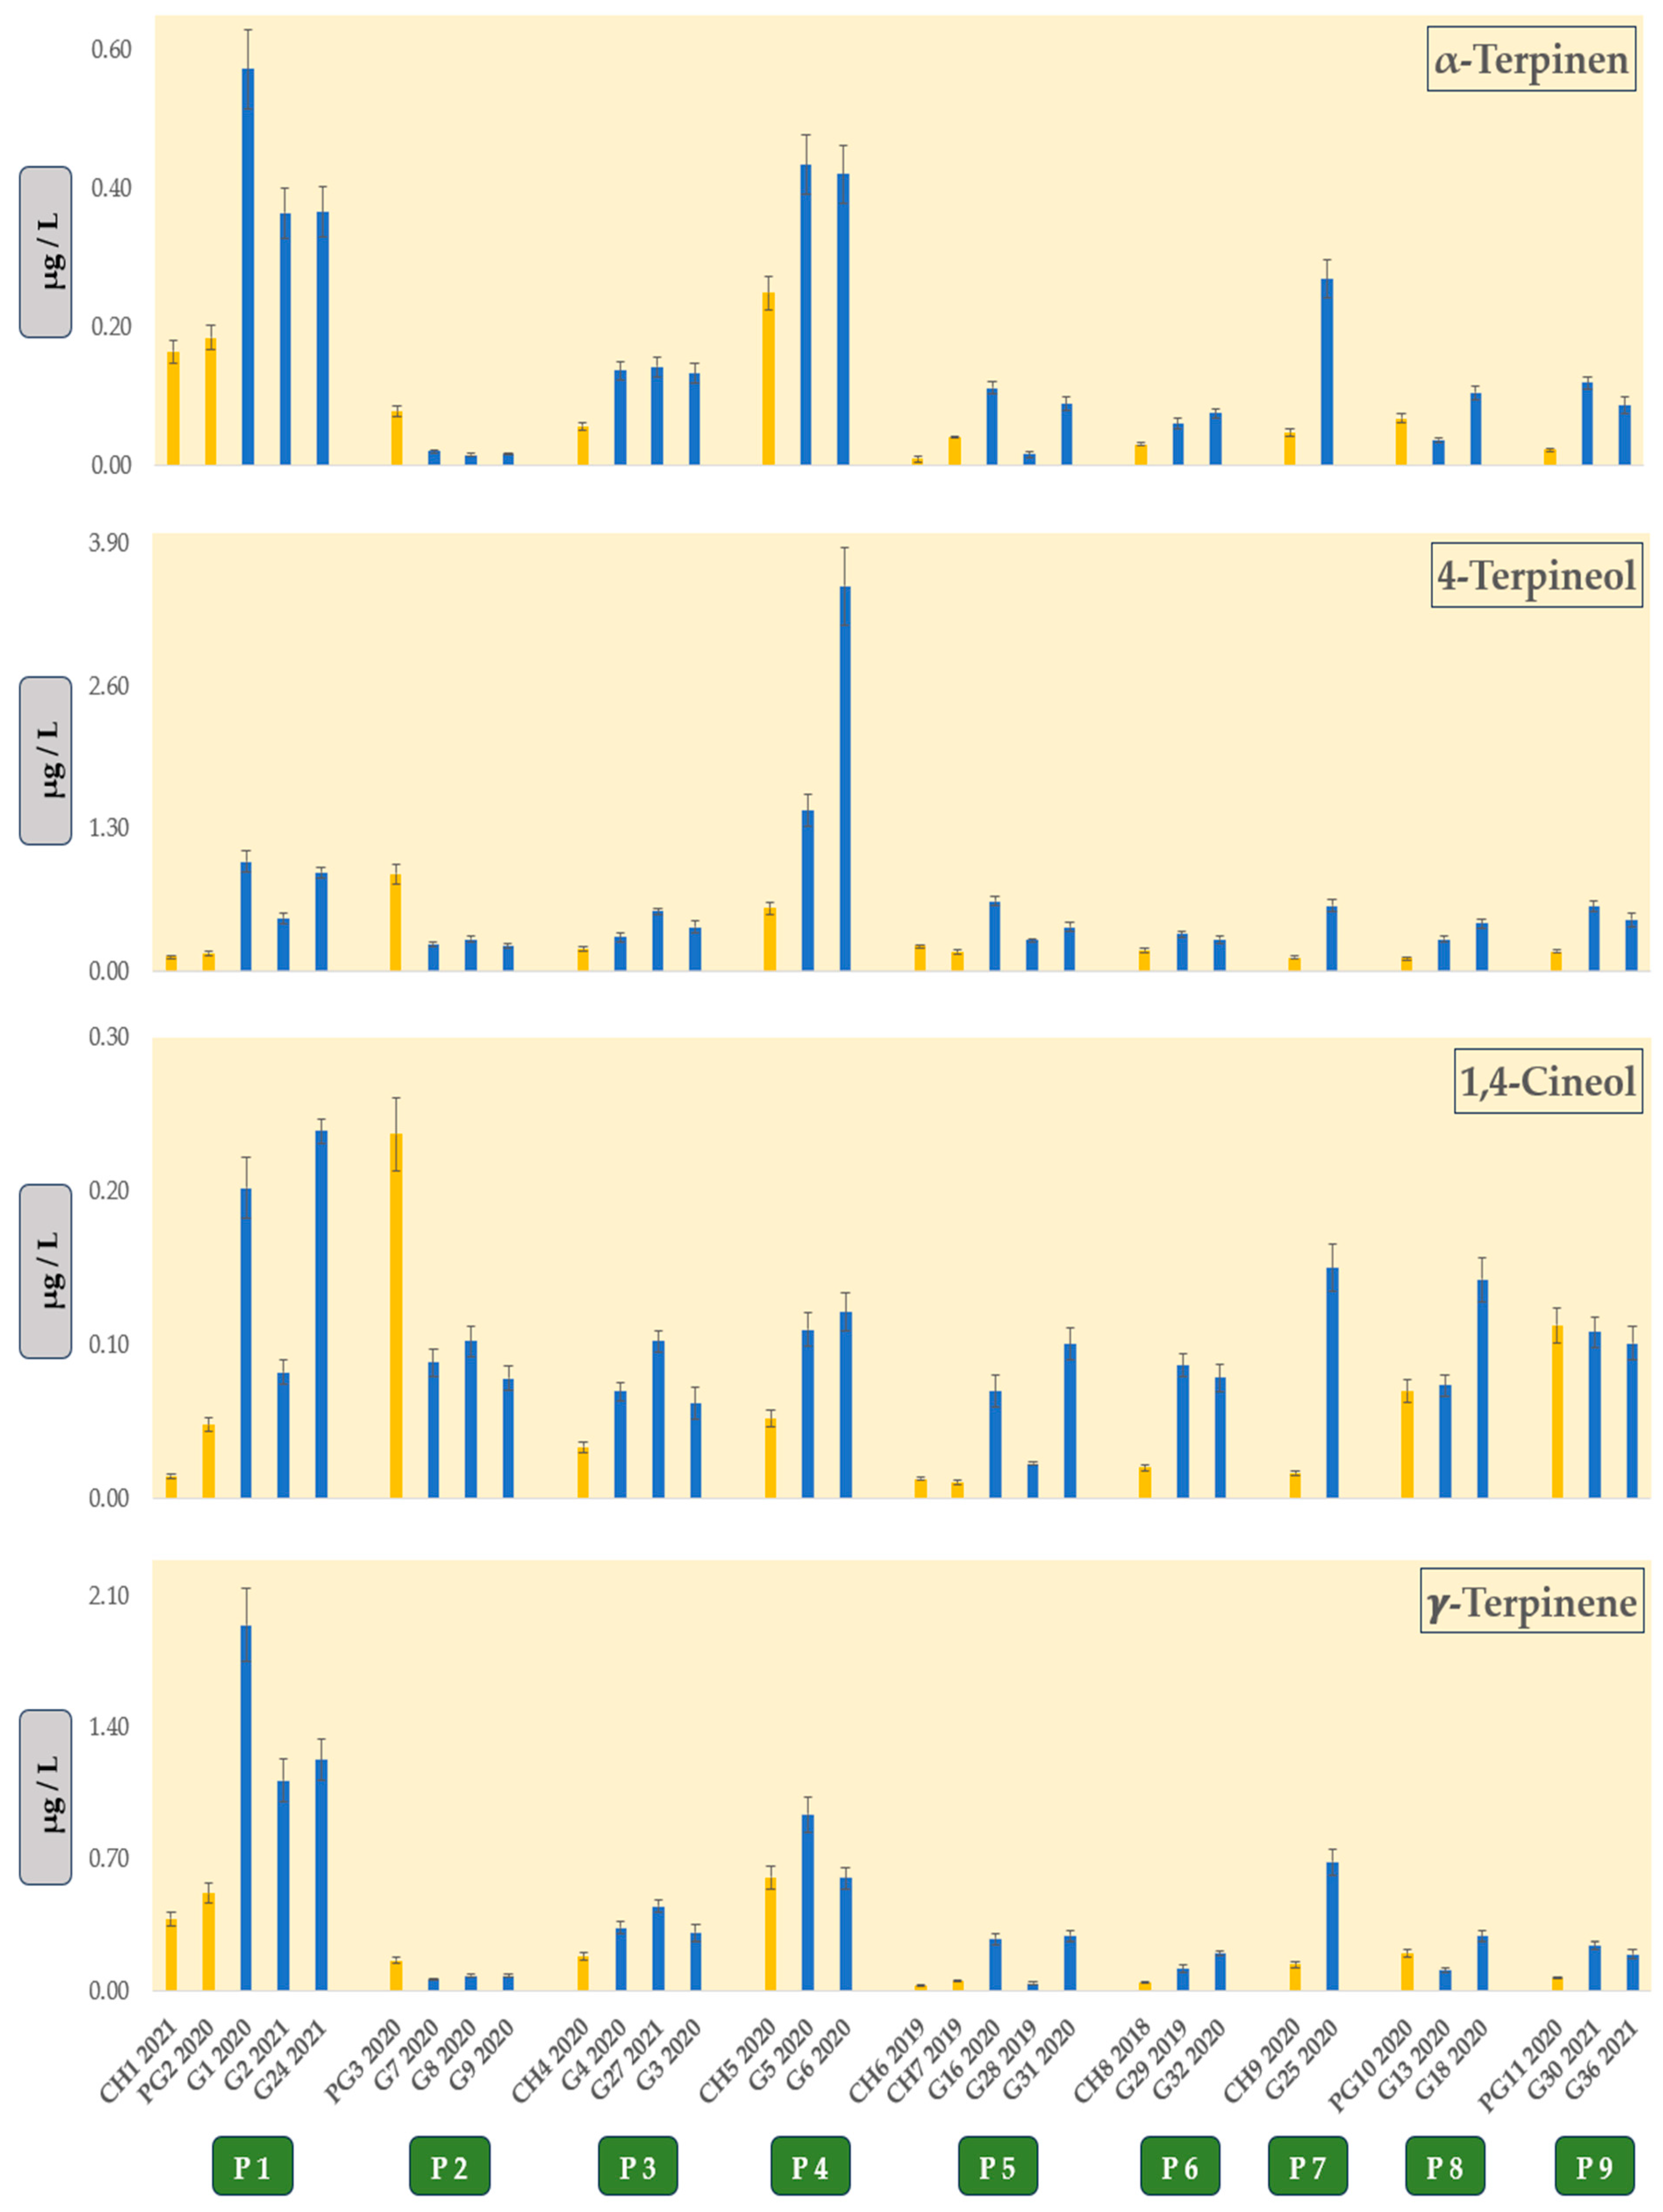
Appendix D. Boxplots and Scattergram

Figure A8. The Boxplots and the Scattergrams showing the patterns and trends in 22 VOCs from the Podunavlje sub-region.
Beverages 10 00024 g0a8
Figure A9. The Boxplots and the Scattergrams showing the patterns and trends in 22 VOCs from the Slavonia sub-region.
Beverages 10 00024 g0a9

References

  1. Andabaka, Ž.; Filaković, K.; Preiner, D.; Stupić, D.; Marković, Z.; Maletić, E.; Šikuten, I.; Karoglav Kontić, J.; Štambuk, P.; Tomaz, I. Ampelographic evaluation of clone candidates of grapevine variety Graševina bijela (Vitis vinifera L.) in the vineyards of Zagreb. Glas. Zašt. Bilja 2021, 44, 34–38. [Google Scholar] [CrossRef]
  2. Raimondi, S.; Tumino, G.; Ruffa, P.; Boccacci, P.; Gambino, G.; Schneider, A. DNA-Based Genealogy Reconstruction of Nebbiolo, Barbera and Other Ancient Grapevine Cultivars from Northwestern Italy. Sci. Rep. 2020, 10, 15782. [Google Scholar] [CrossRef] [PubMed]
  3. Flak, W.; Tscheik, G.; Krizan, R.; Wallner, E. Die Charakterisierung von Weinen der Sorte “Welschriesling” aus dem Gebiet Burgenland-Leithagebirge. Mitteilungen Klosterneubg. 2003, 53, 223–234. [Google Scholar]
  4. Flak, W.; Tscheik, G.; Krizan, R.; Wallner, E. Die Auswirkungen einer koordinierten Wein- bereitung auf die QualitaÈ t von Weinen der Sorte “Welschriesling” mit der Herkunftsbezeichnung 1Burgenland-Leithagebirgea. Mitteilungen Klosterneubg. 2006, 56, 14–21. [Google Scholar]
  5. Suklje, K.; Čuš, F. Modulation of Welschriesling Wine Volatiles through the Selection of Yeast and Lactic Acid Bacteria. OENO One 2021, 55, 245–260. [Google Scholar] [CrossRef]
  6. Tomašević, M.; Lukić, K.; Ćurko, N.; Jagatić Korenika, A.-M.; Preiner, D.; Tuščić, V.; Jeromel, A.; Kovačević Ganić, K. The Influence of Grape Clone and Yeast Strain on Varietal Thiol Concentrations and Sensory Properties of Graševina Wines. Foods 2023, 12, 985. [Google Scholar] [CrossRef] [PubMed]
  7. Šikuten, I.; Jeromel, A.; Budžaki, A.; Tomaz, I.; Jagatić Korenika, A.-M. Aromatski profil vina priznatih klonova sorte ‘Graševina’. Glas. Zašt. Bilja 2023, 46, 92–98. [Google Scholar] [CrossRef]
  8. Česnik, U.; Martelanc, M.; Øvsthus, I.; Radovanović Vukajlović, T.; Hosseini, A.; Mozetič Vodopivec, B.; Butinar, L. Functional Characterization of Saccharomyces Yeasts from Cider Produced in Hardanger. Fermentation 2023, 9, 824. [Google Scholar] [CrossRef]
  9. Antalick, G.; Perello, M.-C.; De Revel, G. Esters in Wines: New Insight through the Establishment of a Database of French Wines. Am. J. Enol. Vitic. 2014, 65, 293–304. [Google Scholar] [CrossRef]
  10. Antalick, G.; Tempère, S.; Šuklje, K.; Blackman, J.W.; Deloire, A.; de Revel, G.; Schmidtke, L.M. Investigation and Sensory Characterization of 1,4-Cineole: A Potential Aromatic Marker of Australian Cabernet Sauvignon Wine. J. Agric. Food Chem. 2015, 63, 9103–9111. [Google Scholar] [CrossRef] [PubMed]
  11. Tamura, H.; Boonbumrung, S.; Yoshizawa, T.; Varanyanond, W. The Volatile Constituents in the Peel and Pulp of a Green Thai Mango, Khieo Sawoei Cultivar (Mangifera indica L.). Food Sci. Technol. Res. 2001, 7, 72–77. [Google Scholar] [CrossRef]
  12. Chigo-Hernandez, M.M.; Tomasino, E. Aroma Perception of Limonene, Linalool and α-Terpineol Combinations in Pinot Gris Wine. Foods 2023, 12, 2389. [Google Scholar] [CrossRef] [PubMed]
  13. Ribéreau-Gayon, P.; Glories, Y.; Maujean, A.; Dubourdieu, D. Handbook of Enology, Volume 2: The Chemistry of Wine—Stabilization and Treatments; John Wiley & Sons: Hoboken, NJ, USA, 2006; ISBN 978-0-470-01038-9. [Google Scholar]
  14. Makhotkina, O.; Kilmartin, P.A. Hydrolysis and Formation of Volatile Esters in New Zealand Sauvignon Blanc Wine. Food Chem. 2012, 135, 486–493. [Google Scholar] [CrossRef] [PubMed]
  15. Šuklje, K.; Carlin, S.; Antalick, G.; Blackman, J.W.; Deloire, A.; Vrhovsek, U.; Schmidtke, L.M. Regional Discrimination of Australian Shiraz Wine Volatome by Two-Dimensional Gas Chromatography Coupled to Time-of-Flight Mass Spectrometry. J. Agric. Food Chem. 2019, 67, 10273–10284. [Google Scholar] [CrossRef] [PubMed]
  16. Li, S.; Blackman, J.W.; Schmidtke, L.M. Exploring the Regional Typicality of Australian Shiraz Wines Using Untargeted Metabolomics. Aust. J. Grape Wine Res. 2021, 27, 378–391. [Google Scholar] [CrossRef]
  17. Schartner, M.; Beck, J.M.; Laboyrie, J.; Riquier, L.; Marchand, S.; Pouget, A. Predicting Bordeaux Red Wine Origins and Vintages from Raw Gas Chromatograms. Commun. Chem. 2023, 6, 247. [Google Scholar] [CrossRef] [PubMed]
  18. van Leeuwen, C.; Barbe, J.-C.; Darriet, P.; Geffroy, O.; Gomès, E.; Guillaumie, S.; Helwi, P.; Laboyrie, J.; Lytra, G.; Menn, N.L.; et al. Recent Advancements in Understanding the Terroir Effect on Aromas in Grapes and Wines. OENO One 2020, 54, 985–1006. [Google Scholar] [CrossRef]
  19. Slaghenaufi, D.; Ugliano, M. Norisoprenoids, Sesquiterpenes and Terpenoids Content of Valpolicella Wines During Aging: Investigating Aroma Potential in Relationship to Evolution of Tobacco and Balsamic Aroma in Aged Wine. Front. Chem. 2018, 6, 66. [Google Scholar] [CrossRef] [PubMed]
  20. The Good Scents Company. Flavor, Fragrance, Food and Cosmetics Ingredients Information. Available online: http://www.thegoodscentscompany.com/ (accessed on 28 January 2024).
Figure 1. Concentration level comparison of α-terpinene, γ-terpinene, 1,4-cineol, and 4-terpineol between Graševina wine samples (G—blue) and other wine samples (CH—Chardonnay, PG—Pinot gris—yellow) obtained from nine producers (P1–P9).
Beverages 10 00024 g001
Figure 2. The heatmap corresponding to 57 VOCs and 32 samples from two different geographical sub-regions, Podunavlje (P) and Slavonia (S), followed by their vintages.
Beverages 10 00024 g002
Figure 3. The PLS-DA score scatter plot (top) and the correlation circle plot (bottom) for 57 VOCs associated with 32 samples from two geographical sub-regions, Podunavlje (P) and Slavonia (S).
Beverages 10 00024 g003
Figure 4. The heatmap corresponding to a total of 22 VOCs and 32 samples from 2 different geographical sub-regions, Podunavlje (P) and Slavonia (S), followed by their vintages.
Beverages 10 00024 g004
Figure 5. The PLS-DA score scatter plot (top) and the correlation circle plot (bottom) for 22 VOCs associated with 32 samples from 2 geographical regions, Podunavlje (P) and Slavonia (S).
Beverages 10 00024 g005
Figure 6. Slavonia and Podunavlje sub-regions are divided by a red line with the geographical positions of wine producers marked in blue and violet, respectively. Producer labels are listed in Table S1. The figure was obtained using Google Earth version 6.1.
Beverages 10 00024 g006
Table 1. Validation parameters for the HS-SPME-GCMS method for the determination of terpenes and norisoprenoids, including a list of quantified compounds with appropriate ions and internal standards used for quantification.
TerpenesQuantified Ion (m/z)Calibration Curve (k 5)Calibration Range (µg/L)R2Repeatability 6
(%)
Recovery 7
(%)
3-carene 1930.03470.01–20.9976.179
α-terpinene 11360.01980.01–20.99997.093
1,4-cineole 11110.01550.01–20.99953.0108
limonene 11360.01640.01–20.99957.0112
eucalyptol 11080.00850.01–20.99973.097
δ-terpinene 11360.01230.01–20.99927.392
p-cymene 11190.00720.01–20.99978.295
α-terpinolene 11360.000540.01–20.9988.0117
cis-rose oxide 11390.07430.05–100.99977.190
trans-rose oxide 11390.04630.05–100.99967.189
trans-linalool oxide 2940.00160.5–1000.99999.3114
cis-linalool oxide 2940.00120.5–1000.99997.4102
linalool 2930.01340.5–1000.99908.4110
4-terpineol 21110.01390.05–100.99994.590
α-terpineol 2930.00810.5–1000.99996.197
cis-geraniol (nerol) 4930.00270.5–1000.99985.1102
trans geraniol 41360.00140.5–1000.9987.6104
trans-nerolidol 4930.02890.05–100.9988.787
E-nerolidol 4930.02640.05–100.9967.285
citronellol 4930.01260.5–1000.9986.8112
Norisoprenoids
vitispirane 1 31922.800.5–1000.9975.194
vitispirane 2 31922.080.5–1000.9985.297
TDN1574.790.05–100.9984.8102
trans-β-damascenone 31900.2260.05–100.99984.997
α-ionone 31210.8980.01–20.9955.4103
β -ionone 31771.3950.01–20.99986.189
1 2-octanol; 2 Linalool d5; 3 ethyl trans cinnamate d5; 4 geraniol d6; 5 linear curve y = kx; 6 repeatability was calculated as relative standard deviation (rsd) by injecting one sample six consecutive times; 7 recovery test was done in sample matrix by standard addition of each terpene to obtain the concentration range at the middle of the calibration curve.
Table 2. Concentration levels of each internal standard in different solutions.
Internal
Standards
Stock Solution
(g/L)
Stock Mix
Solution (mg/L)
Sample
Solution (µg/L)
For terpenes
geraniol d60.11033.3
linalool d50.11033.3
2-octanol0.11033.3
ethyl trans cinnamate d52.50.750.3
For norisoprenoids
ethyl trans cinnamate d52.50.750.3
Disclaimer/Publisher’s Note: The statements, opinions and data contained in all publications are solely those of the individual author(s) and contributor(s) and not of MDPI and/or the editor(s). MDPI and/or the editor(s) disclaim responsibility for any injury to people or property resulting from any ideas, methods, instructions or products referred to in the content.

