
Investigation of Factors Influencing Formation of Nanoemulsion by Spontaneous Emulsification: Impact on Droplet Size, Polydispersity Index, and Stability


Abstract
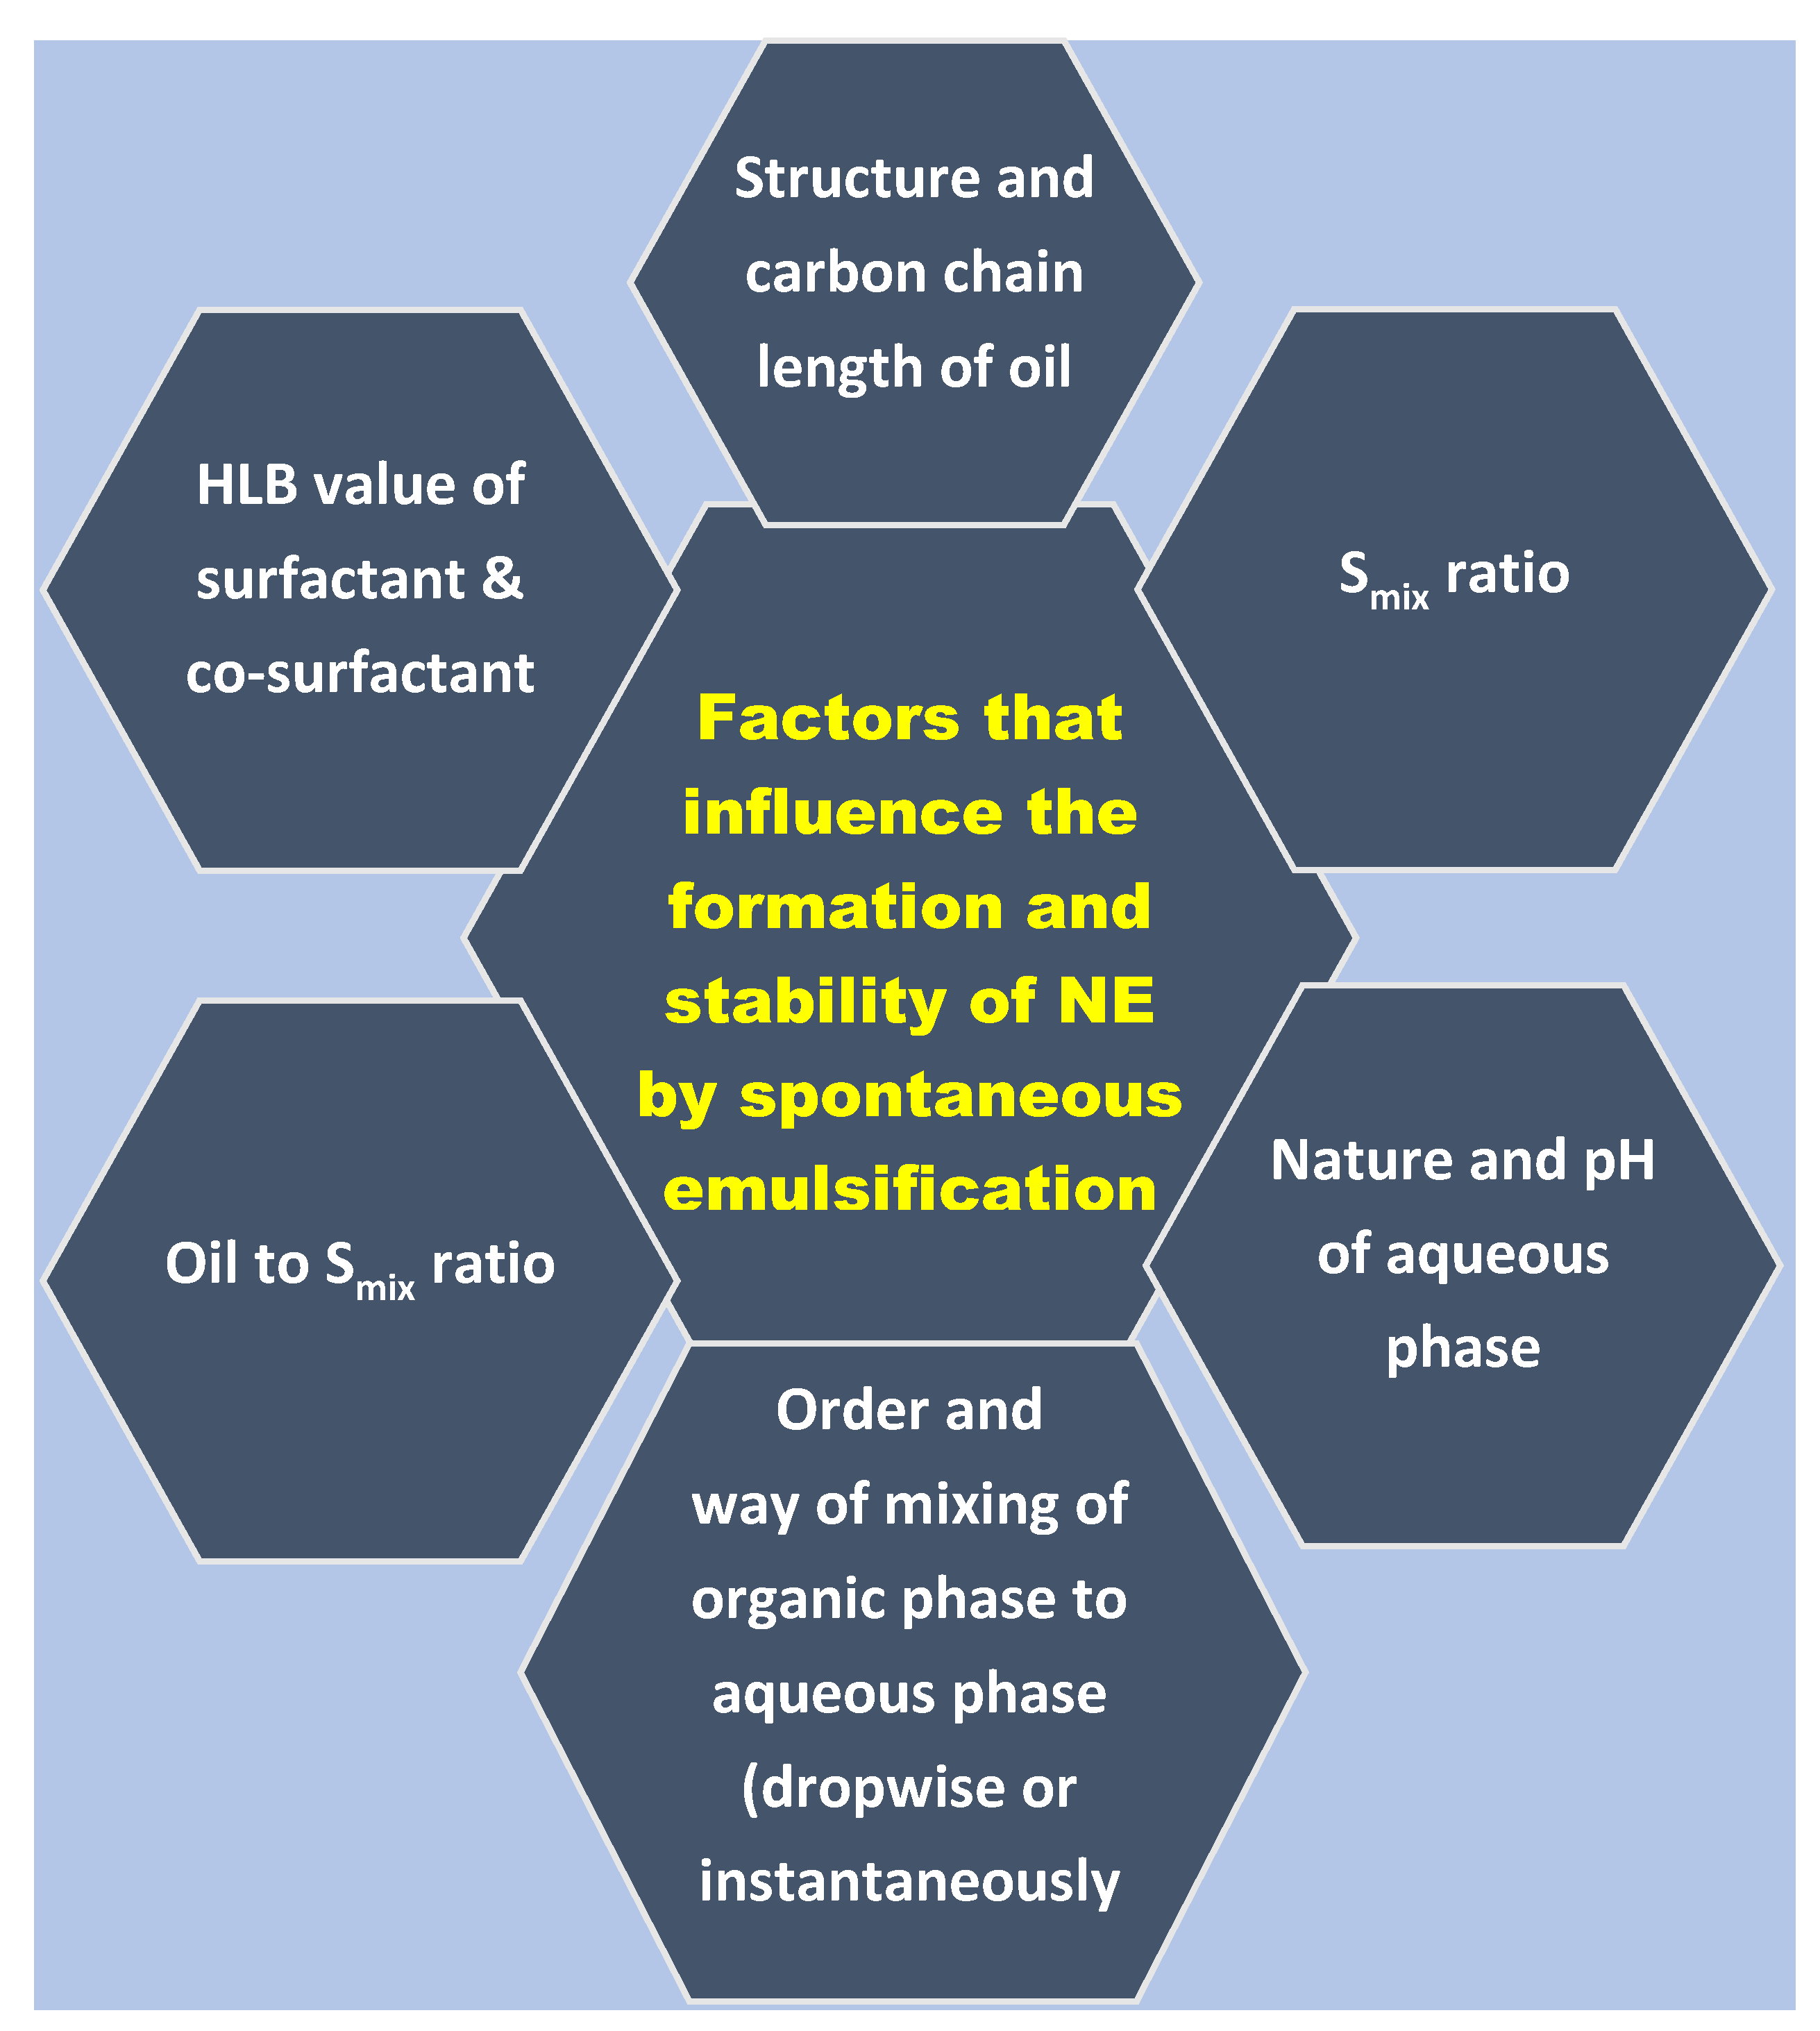
:1. Introduction
2. Materials and Methods
2.1. Materials and Preparation of Different Buffers
2.1.1. Preparation of Hydrochloric Acid Buffer pH 1.2
2.1.2. Preparation of Phosphate Buffer pH 5.5
2.1.3. Preparation of Phosphate Buffer pH 6.8
2.1.4. Preparation of Phosphate Buffer pH 7.4
2.2. Screening of Components
2.2.1. Selection of Oil
2.2.2. Selection of Surfactant
2.2.3. Selection of Co-Surfactant
2.3. Emulsifying Efficiency of Smix for OA, C90, and EO
Determination of Percentage Transmittance (%T)
2.4. Phase Behavior Study
2.4.1. Determination of Area of Nanoemulsification Region
2.5. Preparation and Optimization of the NE Formulation by Spontaneous Emulsification Method
Mean Droplet Size and PDI Determination
2.6. Stability Testing of NE System
2.7. Statistical Analysis
3. Results and Discussion
3.1. The Emulsifying Efficiency of the Smix Phase for Different Oil Phases
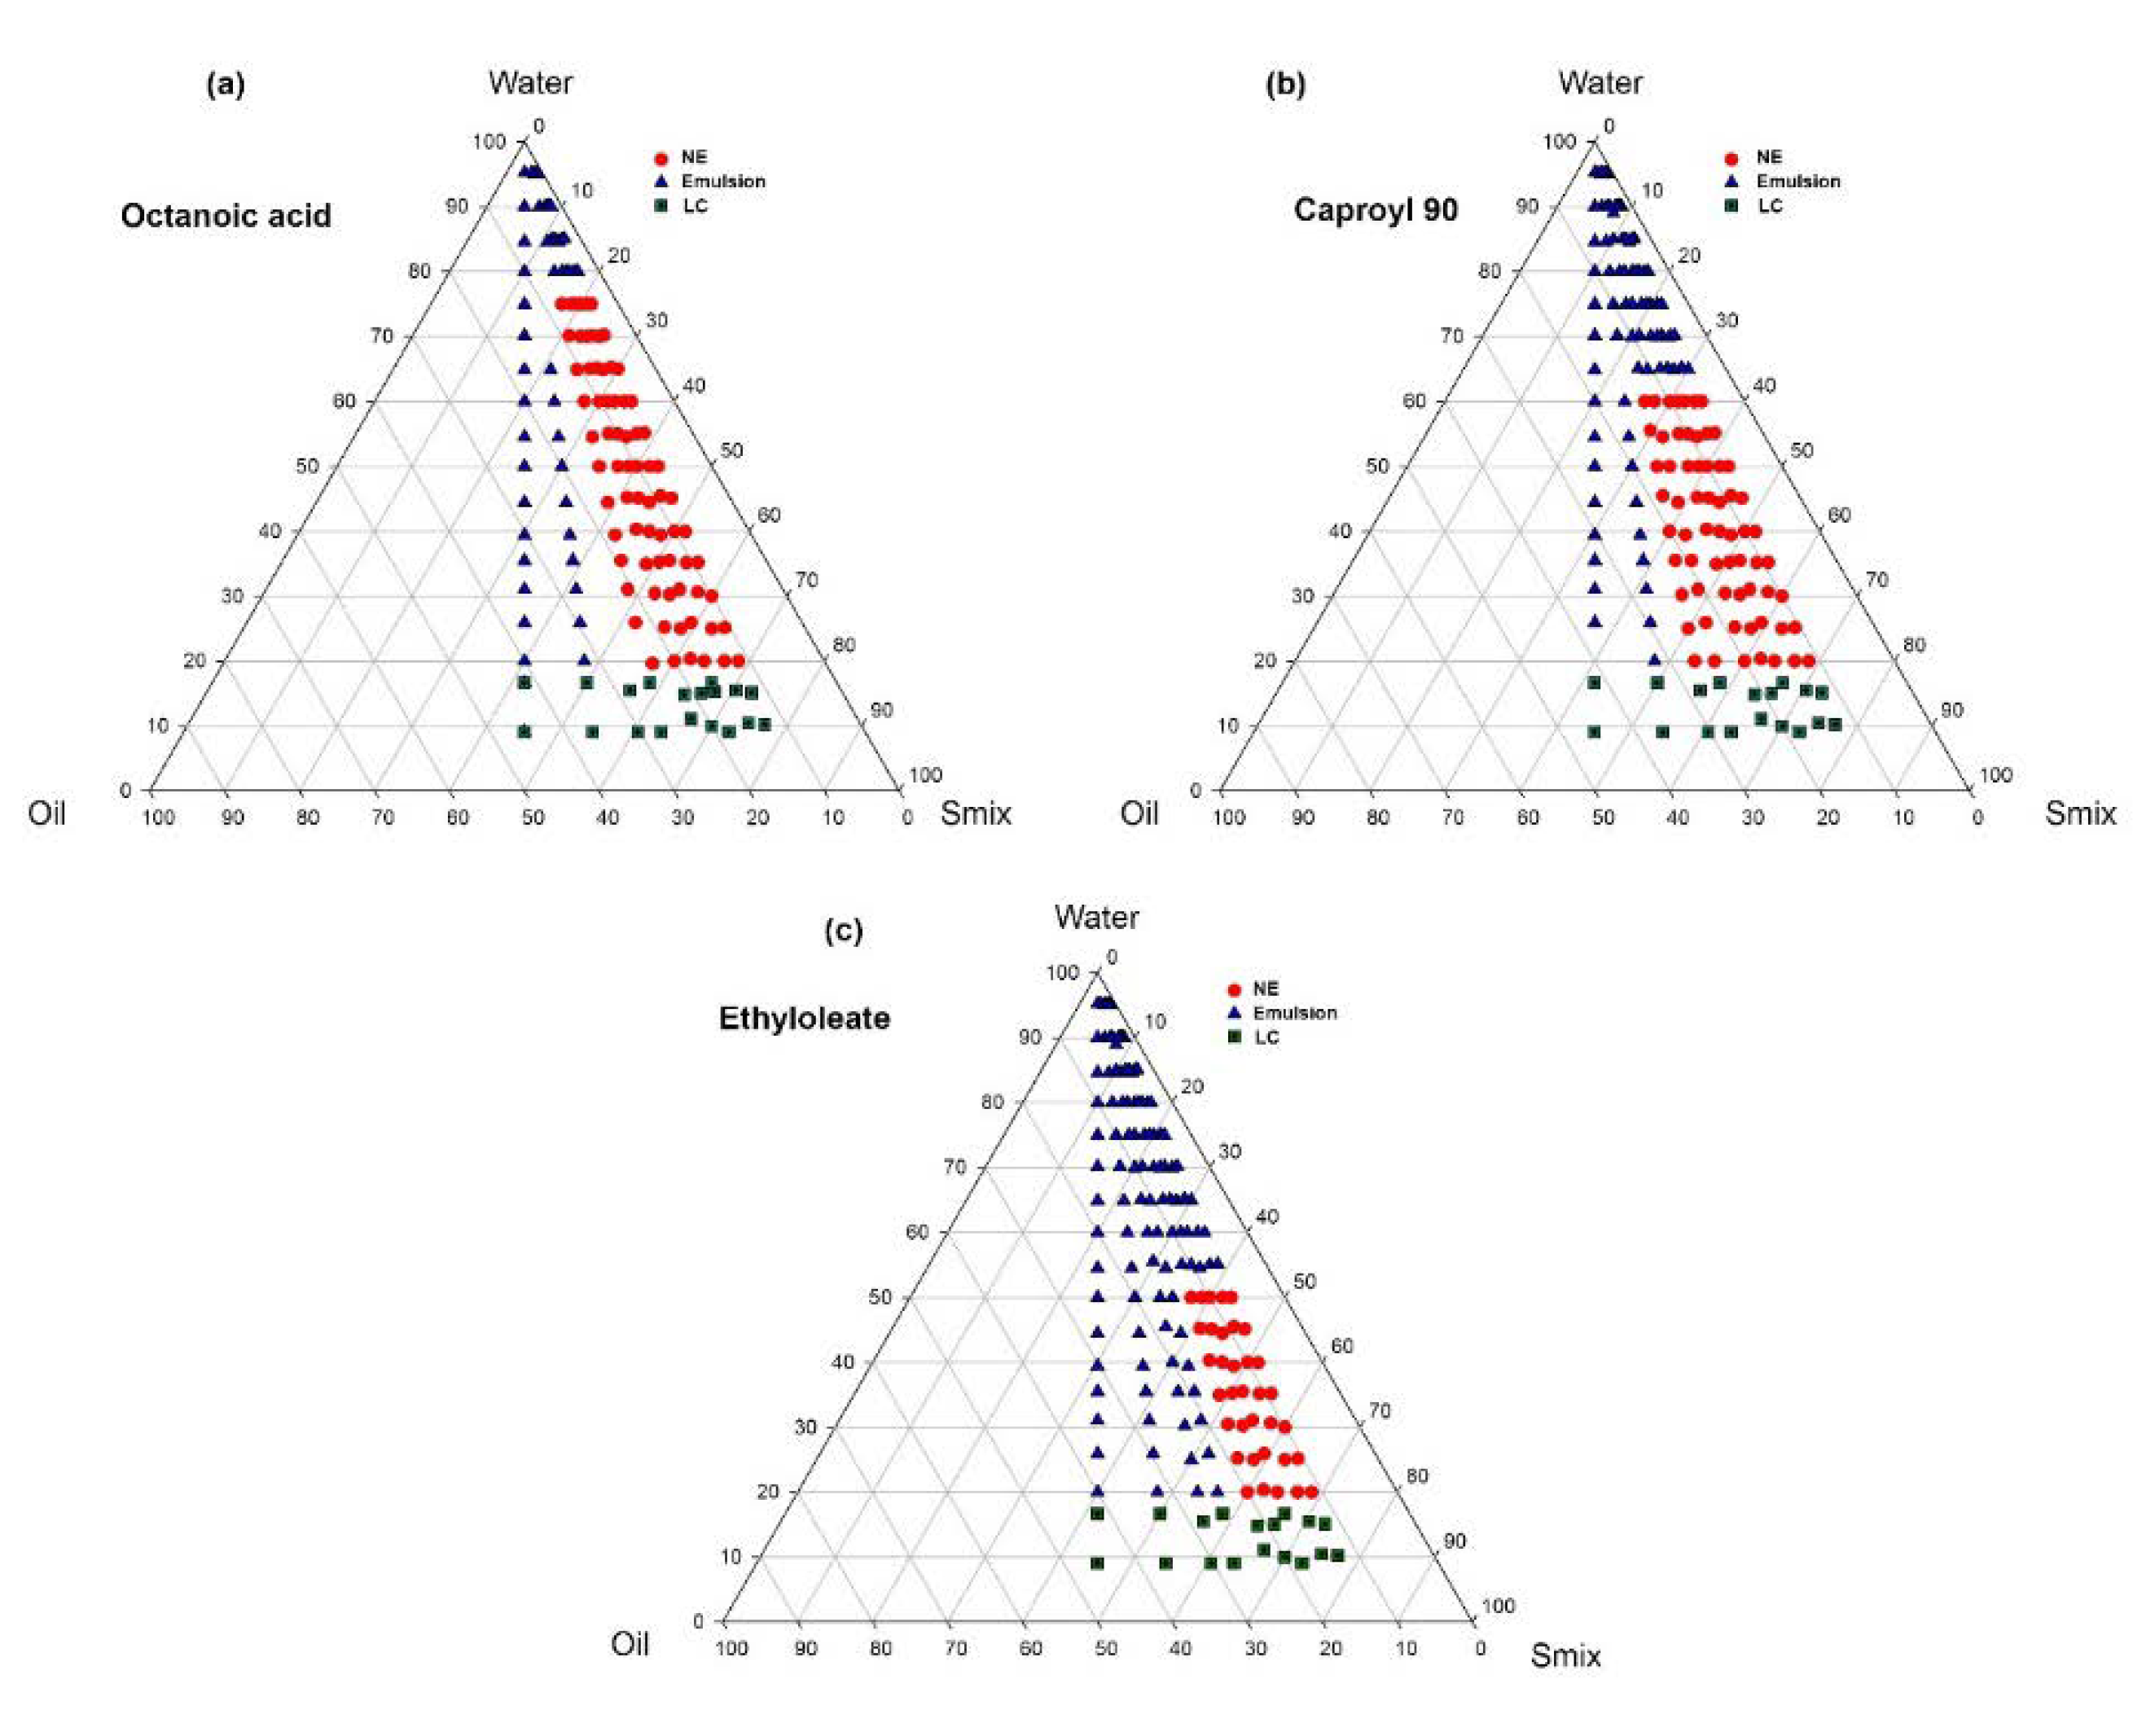
3.2. Pseudoternary Phase Diagram Study
3.3. Preparation and Optimization of NE Formulation by Spontaneous Emulsification Method
3.4. The Impact of Different Variables on the Mean Droplet Size, PDI, and the Stability of NE
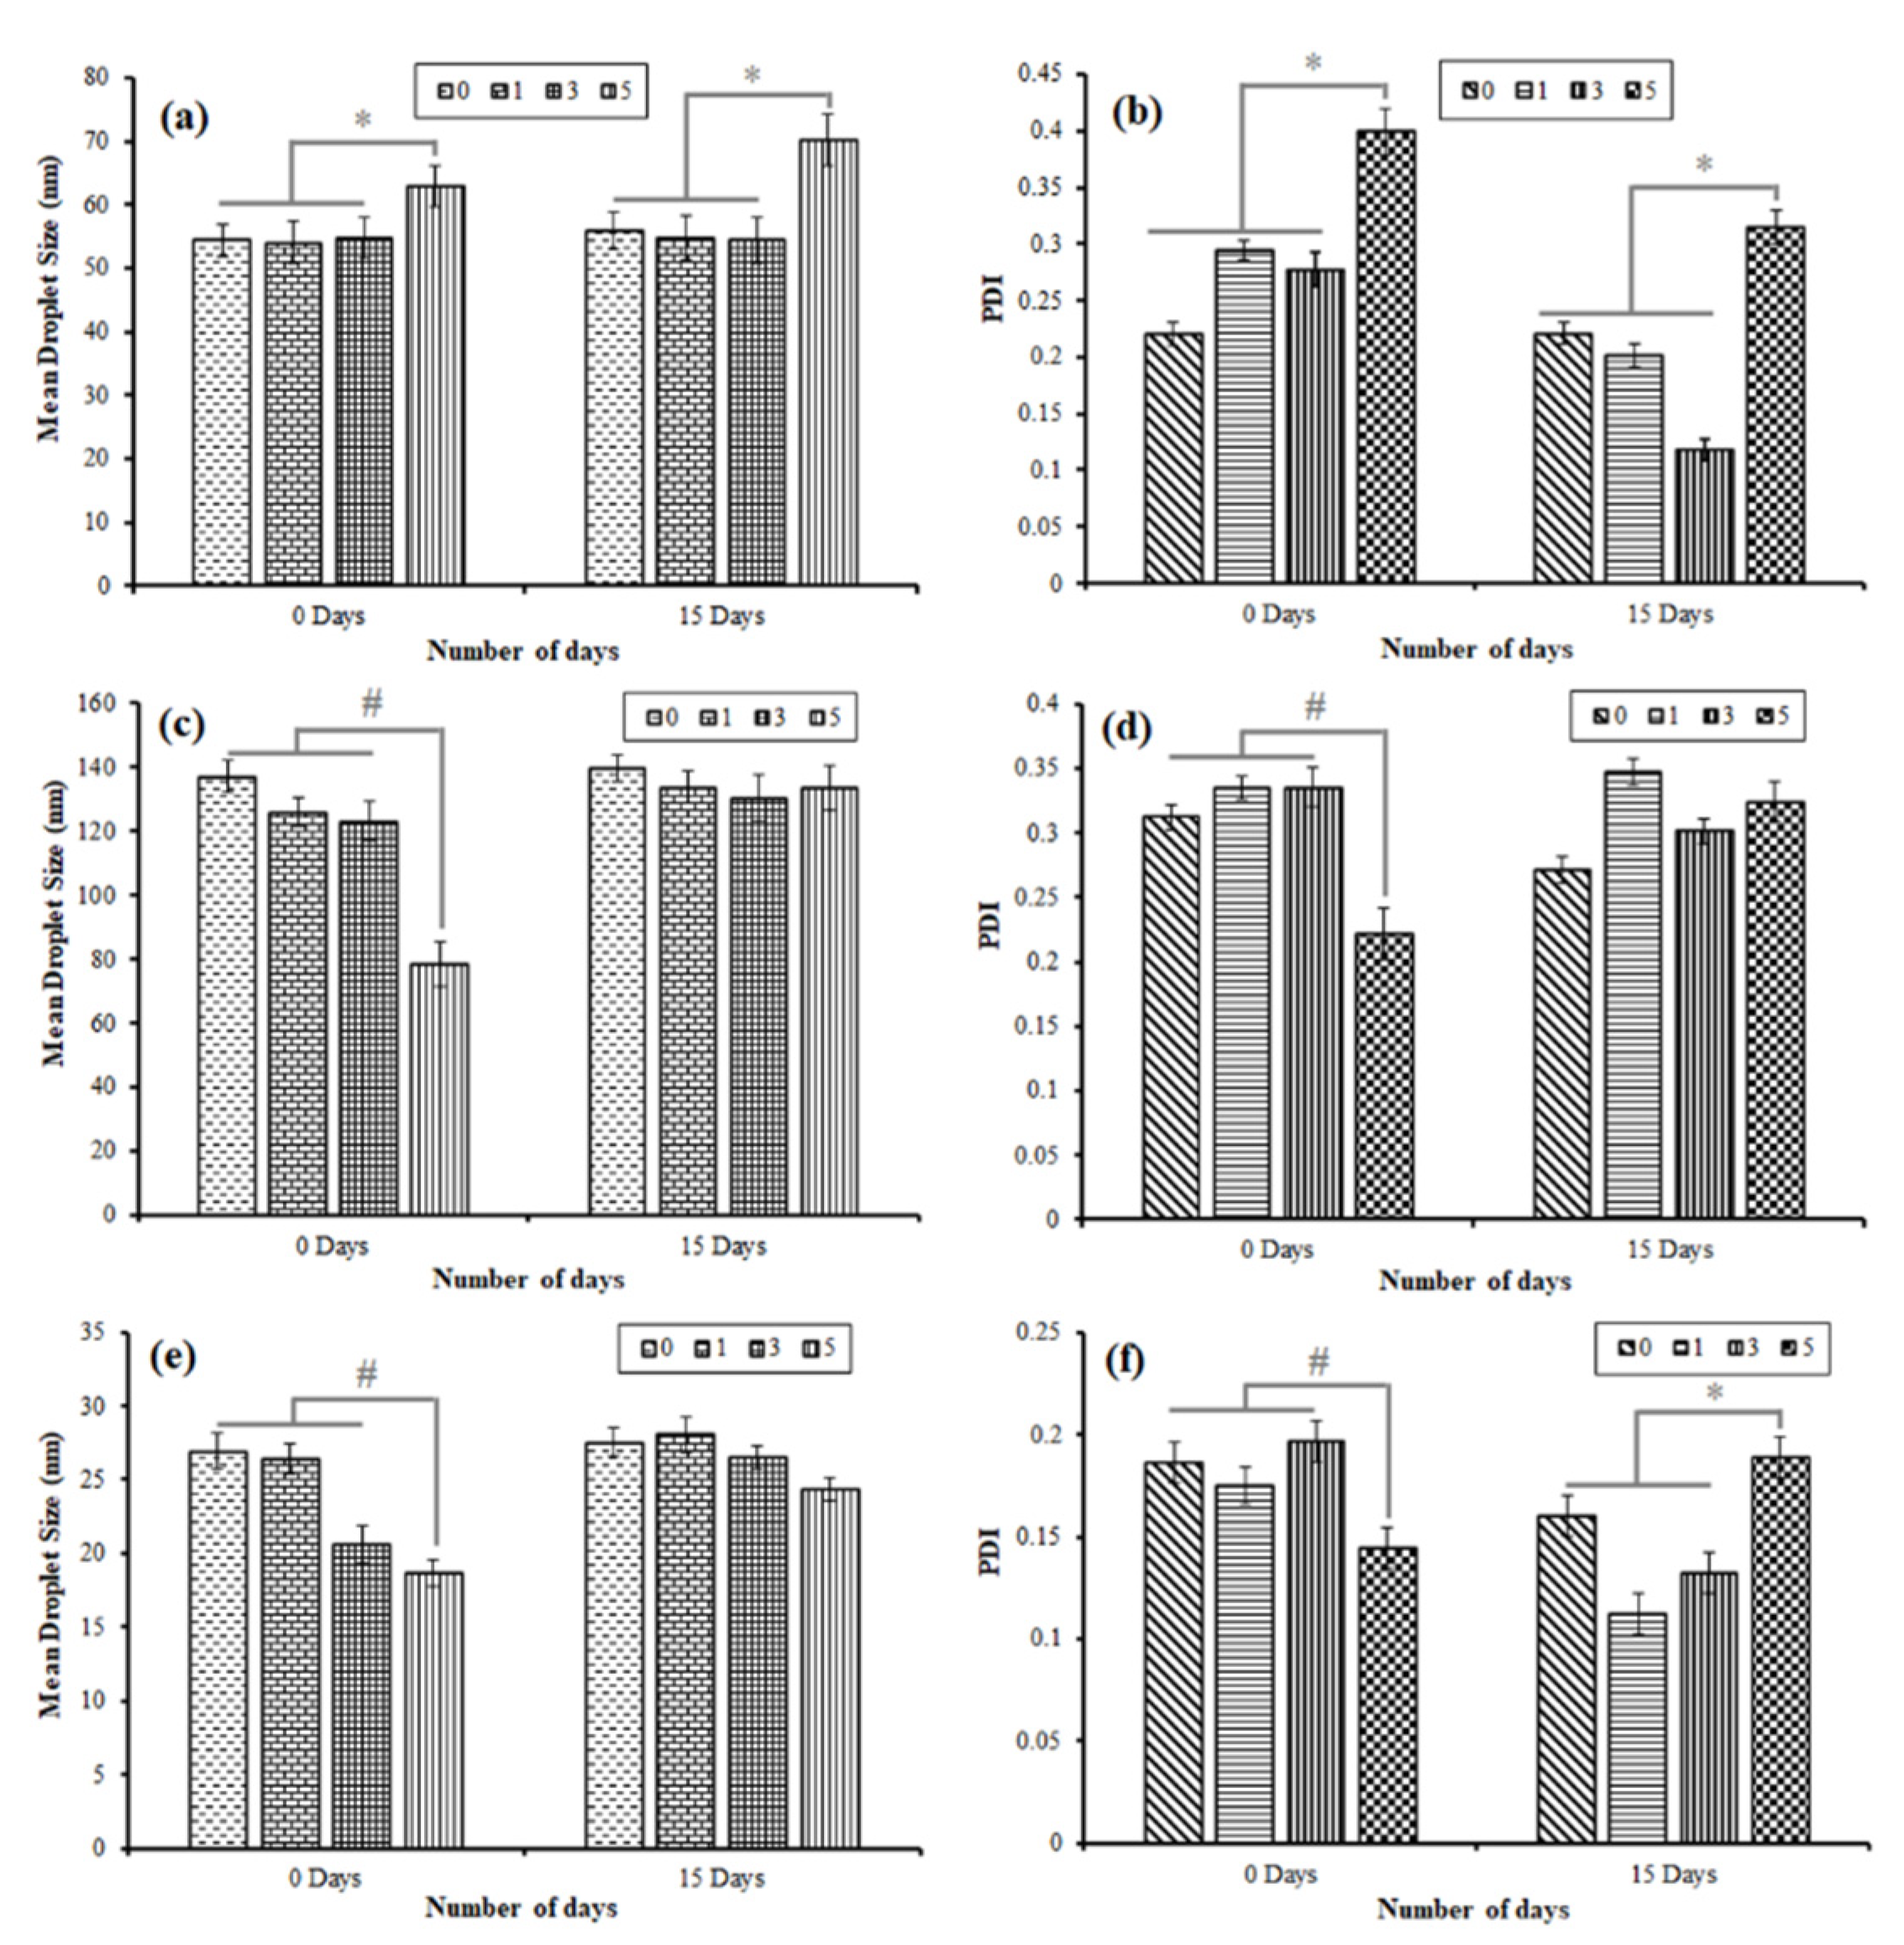
3.4.1. Mode of Mixing of Aqueous Phase to Oil–Smix Phase and Vice-Versa
3.4.2. Impact of Vortexing Time on the Droplet Size, PDI, and the Stability of the NE
3.4.3. Effect of the Buffer as Aqueous Phase (pH 1.2, 5.5, 6.8, 7.4)
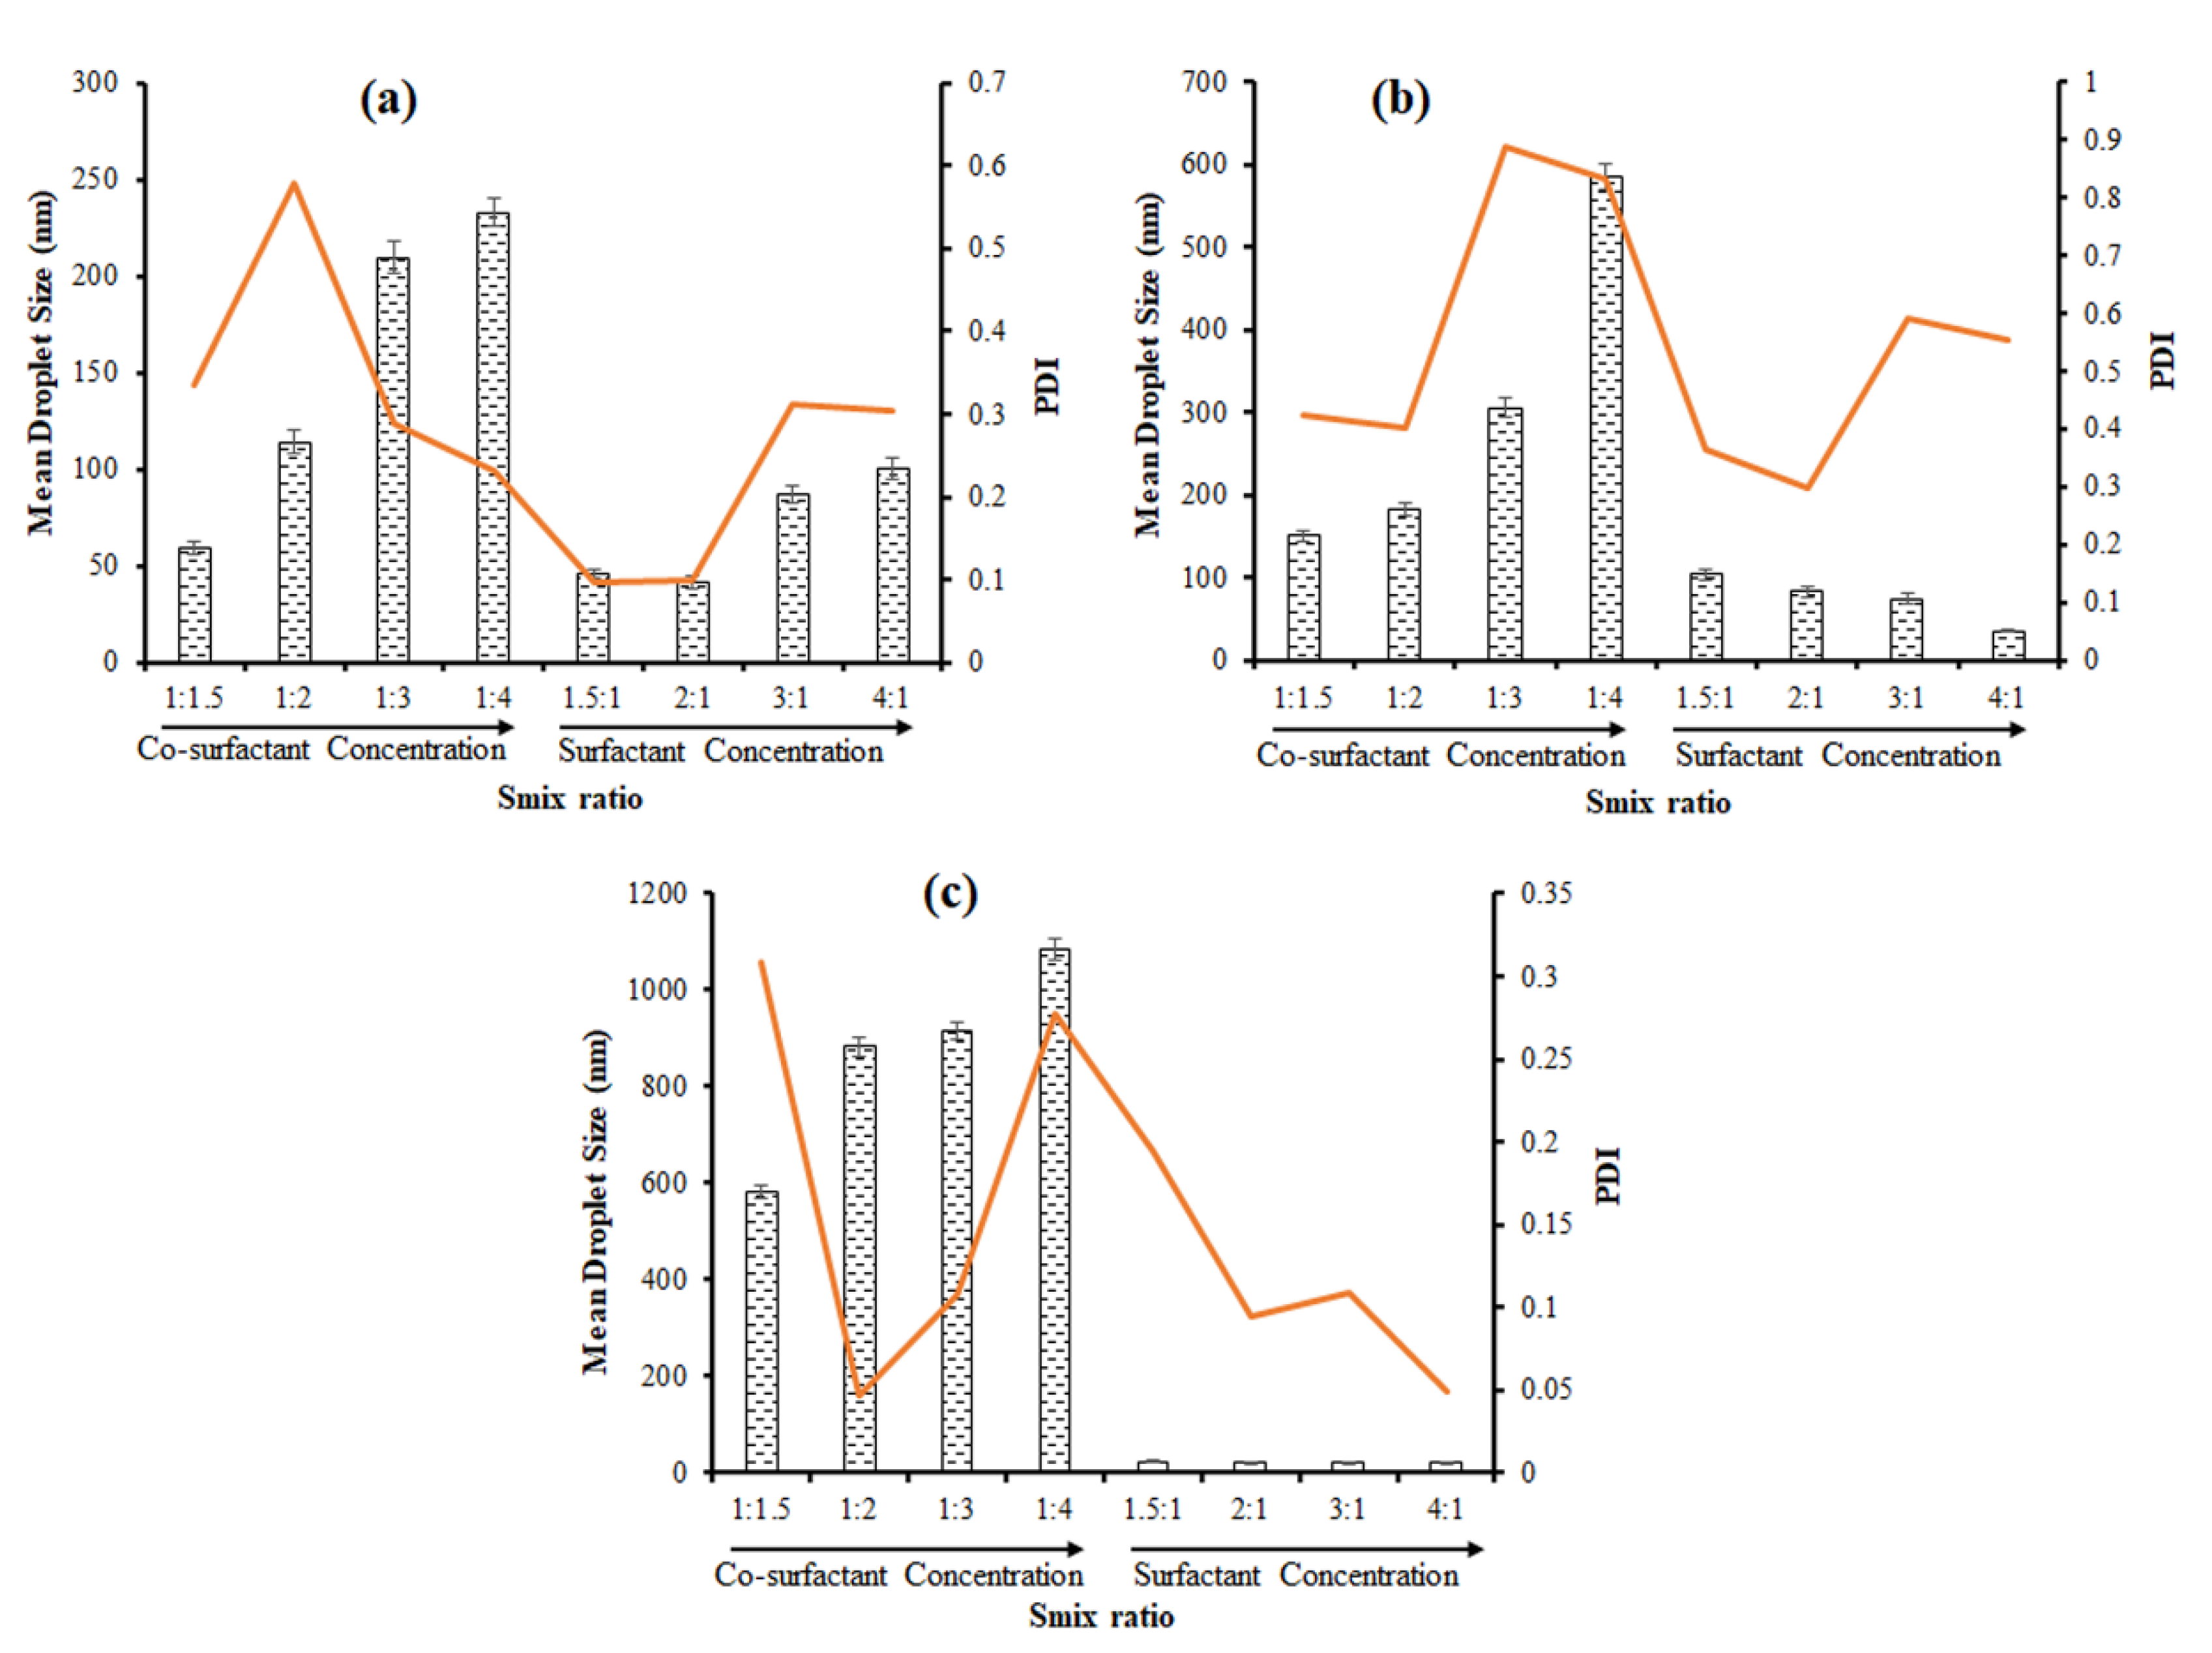
3.4.4. Effect of Km Ratio (Surfactant Co-Surfactant Mass Ratio)
3.5. Stability of NE System Composed of OA, C90, and EO as Oil Phase
4. Conclusions
Supplementary Materials
Author Contributions
Funding
Institutional Review Board Statement
Informed Consent Statement
Data Availability Statement
Acknowledgments
Conflicts of Interest
References
- Roy, A.; Nishchaya, K.; Rai, V.K. Nanoemulsion-based dosage forms for the transdermal drug delivery applications: A review of recent advances. Expert Opin. Drug Deliv. 2022, 19, 303–319. [Google Scholar] [CrossRef] [PubMed]
- Singh, Y.; Meher, J.G.; Raval, K.; Khan, F.A.; Chaurasia, M.; Jain, N.K.; Chourasia, M.K. Nanoemulsion: Concepts, development and applications in drug delivery. J. Control. Release 2017, 252, 28–49. [Google Scholar] [CrossRef]
- Barkat, M.A.; Rizwanullah, M.; Pottoo, F.H.; Beg, S.; Akhter, S.; Ahmad, F.J. Therapeutic nanoemulsion: Concept to delivery. Curr. Pharm. Des. 2020, 26, 1145–1166. [Google Scholar] [CrossRef] [PubMed]
- Zhang, Z.; Kuo, J.C.; Zhang, C.; Huang, Y.; Zhou, Z.; Lee, R.J. A Squalene-Based Nanoemulsion for Therapeutic Delivery of Resiquimod. Pharmaceutics 2021, 13, 2060. [Google Scholar] [CrossRef] [PubMed]
- Li, G.; Zhang, Z.; Liu, H.; Hu, L. Nanoemulsion-based delivery approaches for nutraceuticals: Fabrication, application, characterization, biological fate, potential toxicity and future trends. Food Funct. 2021, 12, 1933–1953. [Google Scholar] [CrossRef]
- Donsì, F.; Sessa, M.; Mediouni, H.; Mgaidi, A.; Ferrari, G. Encapsulation of bioactive compounds in nanoemulsion-based delivery systems. Procedia Food Sci. 2011, 1, 1666–1671. [Google Scholar] [CrossRef]
- Li, Y.; Zheng, J.; Xiao, H.; McClements, D.J. Nanoemulsion-based delivery systems for poorly water-soluble bioactive compounds: Influence of formulation parameters on polymethoxyflavone crystallization. Food Hydrocoll. 2012, 27, 517–528. [Google Scholar] [CrossRef]
- Tayeb, H.H.; Sainsbury, F. Nanoemulsions in drug delivery: Formulation to medical application. Nanomedicine 2018, 13, 2507–2525. [Google Scholar] [CrossRef]
- Kotta, S.; Khan, A.W.; Ansari, S.H.; Sharma, R.K.; Ali, J. Formulation of nanoemulsion: A comparison between phase inversion composition method and high-pressure homogenization method. Drug Deliv. 2015, 22, 455–466. [Google Scholar] [CrossRef]
- Asadinezhad, S.; Khodaiyan, F.; Salami, M.; Hosseini, H.; Ghanbarzadeh, B. Effect of different parameters on orange oil nanoemulsion particle size: Combination of low energy and high energy methods. J. Food Meas. Charact. 2019, 13, 2501–2509. [Google Scholar] [CrossRef]
- Pavoni, L.; Perinelli, D.R.; Bonacucina, G.; Cespi, M.; Palmieri, G.F. An Overview of Micro- and NEs as Vehicles for Essential Oils: Formulation, Preparation and Stability. Nanomaterials 2020, 10, 135. [Google Scholar] [CrossRef] [PubMed]
- Polychniatou, V.; Tzia, C. Study of Formulation and Stability of Co-surfactant Free Water-in-Olive Oil Nano- and Submicron Emulsions with Food Grade Non-ionic Surfactants. J. Am. Oil Chem. Soc. 2014, 91, 79–88. [Google Scholar] [CrossRef]
- Gupta, A.; Eral, H.B.; Hatton, T.A.; Doyle, P.S. Nanoemulsions: Formation, properties and applications. Soft Matter 2016, 12, 2826–2841. [Google Scholar] [CrossRef]
- Weerapol, Y.; Limmatvapirat, S.; Nunthanid, J.; Sriamornsak, P. Self-Nanoemulsifying Drug Delivery System of Nifedipine: Impact of Hydrophilic–Lipophilic Balance and Molecular Structure of Mixed Surfactants. AAPS PharmSciTech. 2014, 15, 456–464. [Google Scholar] [CrossRef] [PubMed]
- Ahmad, J.; Mir, S.R.; Kohli, K.; Amin, S. Effect of oil and co-surfactant on the formation of Solutol HS 15 based colloidal drug carrier by Box–Behnken statistical design. Colloids Surf. A Physicochem. Eng. Asp. 2014, 453, 68–77. [Google Scholar] [CrossRef]
- Saberi, A.H.; Fang, Y.; McClements, D.J. Fabrication of vitamin E-enriched nanoemulsions: Factors affecting particle size using spontaneous emulsification. J. Colloid Interface Sci. 2013, 391, 95–102. [Google Scholar] [CrossRef]
- Komaiko, J.; McClements, D.J. Low-energy formation of edible nanoemulsions by spontaneous emulsification: Factors influencing particle size. J. Food Eng. 2015, 146, 122–128. [Google Scholar] [CrossRef]
- Gulotta, A.; Saberi, A.H.; Nicoli, M.C.; McClements, D.J. Nanoemulsion-based delivery systems for polyunsaturated (ω-3) oils: Formation using a spontaneous emulsification method. J. Agric. Food Chem. 2014, 62, 1720–1725. [Google Scholar] [CrossRef]
- Algahtani, M.S.; Ahmad, M.Z.; Nourein, I.H.; Albarqi, H.A.; Alyami, H.S.; Alyami, M.H.; Alqahtani, A.A.; Alasiri, A.; Algahtani, T.S.; Mohammed, A.A.; et al. Preparation and Characterization of Curcumin Nanoemulgel Utilizing Ultrasonication Technique for Wound Healing: In Vitro, Ex Vivo, and In Vivo Evaluation. Gels 2021, 7, 213. [Google Scholar] [CrossRef]
- Shakeel, F.; Baboota, S.; Ahuja, A.; Ali, J.; Aqil, M.; Shafiq, S. NEs as vehicles for transdermal delivery of aceclofenac. AAPS PharmSciTech. 2007, 8, E104. [Google Scholar] [CrossRef]
- Xi, J.Q.; Chang, C.K.; Chan, Z.Y.; Meng, G.N.; Wang, J.B.; Sun, Y.T.; Wang, Y.T.; Tong, H.H.; Zheng, Y. Formulation development and bioavailability evaluation of a self-nanoemulsified drug delivery system of oleanolic acid. AAPS PharmSciTech. 2009, 10, 172–182. [Google Scholar] [CrossRef] [PubMed]
- Hua, L.; Weisan, P.; Jiayu, L.; Ying, Z. Preparation, evaluation and NMR characterization of vinpocetine microemulsion for transdermal delivery. Drug Dev. Ind. Pharm. 2004, 30, 657–666. [Google Scholar] [CrossRef] [PubMed]
- Shakeel, F.; Haq, N.; El-Badry, M.; Alanazi, F.K.; Alsarra, I.A. Ultra fine super self-nanoemulsifying drug delivery system (SNEDDS) enhanced solubility and dissolution of indomethacin. J. Mol. Liq. 2013, 180, 89–94. [Google Scholar] [CrossRef]
- Shafiq, S.; Shakeel, F.; Talegaonkar, S.; Ahmad, F.J.; Khar, R.K.; Ali, M. Development and bioavailability assessment of ramipril NE formulation. Eur. J. Pharm. Biopharm. 2007, 66, 227–243. [Google Scholar] [CrossRef]
- Iradhati, A.H.; Jufri, M. Formulation and physical stability test of griseofulvin microemulsion gel. Int. J. Appl. Pharm. 2017, 9, 23–26. [Google Scholar] [CrossRef]
- Park, H.; Mun, S.; Kim, Y.R. UV and storage stability of retinol contained in oil-in-water NEs. Food Chem. 2019, 272, 404–410. [Google Scholar] [CrossRef]
- Gao, Z.G.; Choi, H.G.; Shin, H.J.; Park, K.M.; Lim, S.J.; Hwang, K.J.; Kim, C.K. Physico-chemical characterization and evaluation of a microemulsion system for oral delivery of cyclosporin A. Int. J. Pharm. 1998, 161, 75–86. [Google Scholar] [CrossRef]
- Wang, Z.; Sun, J.; Wang, Y.; Liu, X.; Liu, Y.; Fu, Q.; Meng, P.; He, Z. Solid self-emulsifyingnitrendipine pellets: Preparation and in vitro/in vivo evaluation. Int. J. Pharm. 2010, 383, 1–6. [Google Scholar] [CrossRef]
- Algahtani, M.S.; Ahmad, M.Z.; Ahmad, J. Nanoemulgel for Improved Topical Delivery of Retinyl Palmitate: Formulation Design and Stability Evaluation. Nanomaterials 2020, 10, 848. [Google Scholar] [CrossRef]
- Danaei, M.; Dehghankhold, M.; Ataei, S.; Hasanzadeh Davarani, F.; Javanmard, R.; Dokhani, A.; Khorasani, S.; Mozafari, M.R. Impact of particle size and polydispersity index on the clinical applications of lipidic nanocarrier systems. Pharmaceutics 2018, 10, 57. [Google Scholar] [CrossRef]
- Warisnoicharoen, W.; Lansley, A.B.; Lawrence, M.J. Nonionic oil in watermicroemulsions: Effect of oil type on phase behavior. Int. J. Pharm. 2000, 198, 7–27. [Google Scholar] [CrossRef]
- Rang, M.J.; Miller, C.A. Spontaneous emulsification of oils containing hydrocar-bon, nonionic surfactant, and oleyl alcohol. J. Colloid Interface Sci. 1999, 209, 179–192. [Google Scholar] [CrossRef] [PubMed]
- Chuesiang, P.; Siripatrawan, U.; Sanguandeekul, R.; McLandsborough, L.; McClements, D.J. Optimization of cinnamon oil NEs using phase inversion temperature method: Impact of oil phase composition and surfactant concentration. J. Colloid Interface Sci. 2018, 514, 208–216. [Google Scholar] [CrossRef] [PubMed]
- Chuesiang, P.; Siripatrawan, U.; Sanguandeekul, R.; Yang, J.S.; McClements, D.J.; McLandsborough, L. Antimicrobial activity and chemical stability of cinnamon oil in oil-in-water NEs fabricated using the phase inversion temperature method. LWT Food Sci. Technol. 2019, 110, 190–196. [Google Scholar] [CrossRef]
- Hanysova, L.; Vaclavkova, M.; Dohnal, J.; Klimes, J. Stability of ramipril in the solvents of different pH. J. Pharm. Biomed. Anal. 2005, 24, 335–342. [Google Scholar]
- Hogan, B.L.; Williams, M.; Idiculla, A.; Veysoglu, T.; Parente, E. Development and validation of a liquid chromatographic method for the determination of the related substances of ramipril in Altace capsules. J. Pharm. Biomed. Anal. 2000, 23, 637–651. [Google Scholar] [CrossRef]
- Ren, G.; Li, B.; Ren, L.; Lu, D.; Zhang, P.; Tian, L.; Di, W.; Shao, W.; He, J.; Sun, D. pH-Responsive Nanoemulsions Based on a Dynamic Covalent Surfactant. Nanomaterials 2021, 11, 1390. [Google Scholar] [CrossRef]
- Octanoic Acid. Available online: https://pubchem.ncbi.nlm.nih.gov/compound/Octanoic-acid#section=Environmental-Fate (accessed on 26 May 2022).
- Su, R.; Yang, L.; Wang, Y.; Yu, S.; Guo, Y.; Deng, J.; Zhao, Q.; Jin, X. Formulation, development, and optimization of a novel octyldodecanol-based NE for transdermal delivery of ceramide IIIB. Int. J. Nanomed. 2017, 12, 5203–5221. [Google Scholar] [CrossRef]
- Dantas, M.G.; Reis, S.A.; Damasceno, C.M.; Rolim, L.A.; Rolim-Neto, P.J.; Carvalho, F.O.; Quintans-Junior, L.J.; Almeida, J.R. Development and evaluation of stability of a gel formulation containing the monoterpene borneol. Sci. World J. 2016, 2016, 7394685. [Google Scholar] [CrossRef]
- Borrin, T.R.; Georges, E.L.; Brito-Oliveira, T.C.; Moraes, I.C.F.; Pinho, S.C. Technological and sensory evaluation of pineapple ice creams incorporating curcumin-loaded NEs obtained by the emulsion inversion point method. Int. J. Dairy Technol. 2018, 71, 491–500. [Google Scholar] [CrossRef]
- Borrin, T.R.; Georges, E.L.; Moraes, I.C.F.; Pinho, S.C. Curcumin-loaded NEs produced by the emulsion inversion point (EIP) method: An evaluation of process parameters and physico-chemical stability. J. Food Eng. 2016, 169, 1–9. [Google Scholar] [CrossRef]
- Ghiasi, Z.; Esmaeli, F.; Aghajani, M.; Ghazi-Khansari, M.; Faramarzi, M.A.; Amani, A. Enhancing analgesic and anti-inflammatory effects of capsaicin when loaded into olive oil NE: An in vivo study. Int. J. Pharm. 2019, 559, 341–347. [Google Scholar] [CrossRef] [PubMed]
- Zhang, L.; Zhang, F.; Fan, Z.; Liu, B.; Liu, C.; Meng, X. DHA and EPA NEs prepared by the low-energy emulsification method: Process factors influencing droplet size and physicochemical stability. Food Res. Int. 2019, 121, 359–366. [Google Scholar] [CrossRef] [PubMed]


| Oil Phase | Type of Smix | Vol. of Oil Emulsified (µL) | %T ± SD |
|---|---|---|---|
| Octanoic acid (OA) | Tween 20 and transcutol HP | 30.0 | 88.84 ± 0.366 |
| Tween 80 and transcutol HP | 40.0 | 83.83 ± 0.660 | |
| Solutol HS15 and transcutol HP | 28.0 | 81.89 ± 0.606 | |
| Cremophore EL and transcutol HP | 70.0 | 84.26 ± 0.113 | |
| Capryol 90 (C90) | Tween 20 and transcutol HP | 14.0 | 88.74 ± 0.581 |
| Tween 80 and transcutol HP | 15.0 | 87.95 ± 0.890 | |
| Solutol HS15 and transcutol HP | 9.0 | 87.75 ± 0.711 | |
| Cremophore EL and transcutol HP | 24.0 | 88.74 ± 0.911 | |
| Ethyl oleate (EO) | Tween 20 and transcutol HP | 7.0 | 85.74 ± 1.101 |
| Tween 80 and transcutol HP | 11.0 | 81.83 ± 1.807 | |
| Solutol HS15 and transcutol HP | 9.0 | 85.02 ± 1.378 | |
| Cremophore EL and transcutol HP | 21.0 | 87.70 ± 1.850 |
| Oil Phase | %Oil | %Smix | %Water | %T | Size (nm) | PDI | Stability (24 h) |
|---|---|---|---|---|---|---|---|
| OA | 5.56 | 9.45 | 84.99 | 91.25 ± 2.76 | 38.78 ± 0.15 | 0.210 ± 0.03 | Stable |
| 26.67 | 45.33 | 28.0 | 98.33 ± 1.96 | 47.65 ± 0.43 a | 0.497 ± 0.02 | Stable | |
| 5.56 | 45.33 | 49.11 | 96.94 ± 0.68 | 20.45 ± 0.07 | 0.321 ± 0.05 | Stable | |
| 26.67 | 9.45 | 63.88 | 81.23 ± 1.24 | 177.7 ± 1.95 a | 0.125 ± 0.04 | Stable | |
| 16.11 | 27.39 | 56.5 | 98.01 ± 0.94 | 56.35 ± 0.39 | 0.172 ± 0.02 | Stable | |
| 16.11 | 45.33 | 38.56 | 98.23 ± 2.06 | 46.90 ± 0.21 | 0.111 ± 0.04 | Unstable | |
| C90 | 16.67 | 35.33 | 48.0 | 97.43 ± 1.73 | 34.47 ± 0.18 | 0.093 ± 0.001 | Stable |
| 23.26 | 46.51 | 30.23 | 98.99 ± 0.88 | 48.37 ± 0.66 b | 0.056 ± 0.003 | Stable | |
| 16.67 | 46.51 | 36.82 | 93.61 ± 1.65 | 58.98 ± 0.72 | 0.072 ± 0.003 | Unstable | |
| 23.26 | 35.33 | 41.41 | 97.39 ± 1.79 | 136.9 ± 2.75 b | 0.527 ± 0.03 | Stable | |
| 19.96 | 45.92 | 34.12 | 83.01 ± 0.53 | 116.9 ± 1.05 | 0.550 ± 0.01 | Unstable | |
| 19.96 | 46.51 | 33.53 | 94.51 ± 1.01 | 142.7 ± 1.64 | 0.537 ± 0.04 | Unstable | |
| EO | 13.70 | 41.10 | 45.2 | 15.29 ± 0.08 | 919.9 ± 23.93 | 0.135 ± 0.05 | Unstable |
| 18.69 | 56.07 | 25.24 | 10.26 ± 0.03 | 194.17 ± 2.71 | 0.589 ± 0.04 | Unstable | |
| 13.70 | 56.07 | 30.23 | 97.28 ± 1.26 | 29.64 ± 0.04 | 0.336 ± 0.05 | Stable | |
| 18.69 | 41.10 | 40.21 | 10.35 ± 0.18 | 104.4 ± 1.08 | 0.383 ± 0.05 | Unstable | |
| 16.20 | 48.58 | 35.22 | 11.96 ± 0.29 | 127.5 ± 1.92 c | 0.432 ± 0.06 | Unstable | |
| 16.20 | 56.07 | 27.73 | 97.43 ± 1.74 | 28.04 ± 0.02c | 0.112 ± 0.01 | Stable |
| NE System Composed of OA as Oil to Smix Ratio 1:3 * | |||
|---|---|---|---|
| Mode of Mixing | Mean droplet size (nm) | PDI | %T |
| Instantaneous mixing of aqueous phase to oil–Smix phase | 55.47 ± 0.31 | 0.360 ± 0.031 | 96.36 ± 0.12 |
| Drop-by-drop mixing of aqueous phase to oil–Smix phase | 55.69 ± 0.28 | 0.261 ± 0.015 | 96.25 ± 0.04 |
| Instantaneous mixing of oil–Smix phase to the aqueous phase | 51.92 ± 0.68 | 0.248 ± 0.001 | 96.74 ± 0.25 |
| Drop-by-drop mixing of oil–Smix phase to the aqueous phase | 52.29 ± 0.43 | 0.213 ± 0.014 | 96.27 ± 0.26 |
| NE system composed of C90 as oil to Smix ratio 1:3 * | |||
| Mode of Mixing | Mean droplet size (nm) | PDI | %T |
| Instantaneous mixing of aqueous phase to oil–Smix phase | 157.49 ± 1.09 | 0.321 ± 0.012 | 93.72 ± 0.607 |
| Drop-by-drop mixing of aqueous phase to oil–Smix phase | 120.20 ± 1.08 | 0.324 ± 0.004 | 95.30 ± 0.188 |
| Instantaneous mixing of oil–Smix phase to the aqueous phase | 156.45 ± 0.65 | 0.321 ± 0.006 | 93.00 ± 0.445 |
| Drop-by-drop mixing of oil–Smix phase to the aqueous phase | 125.51 ± 1.45 | 0.338 ± 0.007 | 93.38 ± 0.404 |
| NE system composed of EO as oil to Smix ratio 1:4 # | |||
| Mode of Mixing | Mean droplet size (nm) | PDI | %T |
| Instantaneous mixing of aqueous phase to oil–Smix phase | 26.37 ± 0.198 | 0.145 ± 0.006 | 98.05 ± 0.035 |
| Drop-by-drop mixing of aqueous phase to oil–Smix phase | 26.54 ± 1.126 | 0.142 ± 0.004 | 97.98 ± 0.130 |
| Instantaneous mixing of oil–Smix phase to aqueous phase | 26.69 ± 0.850 | 0.133 ± 0.017 | 97.80 ± 0.531 |
| Drop-by-drop mixing of oil–Smix phase to aqueous phase | 27.23 ± 0.145 | 0.175 ± 0.006 | 98.18 ± 0.219 |
| Stability Study of NE Composed of Octanoic Acid as Oil Phase at Smix Ratio 1:1 | ||||||||||
|---|---|---|---|---|---|---|---|---|---|---|
| S. No | O/S Ratio | 0 Days | 15 Days | 30 Days | ||||||
| Droplet Size | PdI | %T | Droplet Size | PdI | %T | Droplet Size | PdI | %T | ||
| i. | 1:1.5 | 408.64 ± 3.09 | 0.372 ± 0.051 | 90.13 ± 0.477 | 437.94 ± 1.86 | 0.607 ± 0.021 | 89.44 ± 1.08 | 455.51 ± 4.13 | 0.655 ± 0.029 | 88.72 ± 0.457 |
| ii. | 1:1.8 | 327.66 ± 3.30 | 0.366 ± 0.089 | 86.13 ± 0.320 | 369.07 ± 16.79 | 0.478 ± 0.098 | 84.47 ± 0.480 | 411.75 ± 10.19 | 0.572 ± 0.110 | 91.14 ± 2.10 |
| iii. | 1:2 | 127.86 ± 6.43 | 0.335 ± 0.013 | 88.09 ± 0.574 | 150.64 ± 9.10 | 0.339 ± 0.019 | 84.34 ± 0.196 | 184.39 ± 12.39 | 0.384 ± 0.017 | 82.74 ± 0.542 |
| iv. | 1:2.5 | 44.43 ± 0.98 | 0.077 ± 0.018 | 97.28 ± 0.196 | 89.20 ± 2.14 | 0.230 ± 0.031 | 94.10 ± 0.111 | 98.79 ± 3.49 | 0.229 ± 0.024 | 94.06 ± 0.075 |
| v. | 1:3 | 50.69 ± 1.88 | 0.207 ± 0.008 | 97.54 ± 0.215 | 52.41 ± 1.10 | 0.230 ± 0.004 | 97.29 ± 0.140 | 54.20 ± 0.439 | 0.216 ± 0.009 | 97.14 ± 0.061 |
| vi. | 1:3.5 | 82.02 ± 1.82 | 0.430 ± 0.016 | 97.83 ± 0.036 | 80.26 ± 0.91 | 0.387 ± 0.012 | 96.74 ± 0.444 | 83.62 ± 1.10 | 0.393 ± 0.004 | 96.88 ± 0.304 |
| vii. | 1:4 | 96.33 ± 0.30 | 0.352 ± 0.059 | 97.55 ± 0.460 | 95.45 ± 1.17 | 0.252 ± 0.144 | 97.37 ± 0.149 | 97.05 ± 0.538 | 0.210 ± 0.088 | 97.10 ± 0.10 |
| Stability Study of NE Composed of Capryol 90 as Oil Phase at Smix Ratio 1:1 | ||||||||||
| S. No. | O/S Ratio | 0 days | 15 days | 30 days | ||||||
| Droplet Size | PdI | %T | Droplet Size | PdI | %T | Droplet Size | PDI | %T | ||
| i. | 1:1.5 | 329.95 ± 26.62 | 0.853 ± 0.031 | 86.74 ± 0.480 | 677.49 ± 193.3 | 0.963 ± 0.045 | 85.56 ± 1.31 | 742.1 ± 216.7 | 0.996 ± 0.005 | 88.21 ± 0.714 |
| ii. | 1:1.8 | 39.88 ± 0.830 | 0.103 ± 0.001 | 99.30 ± 0.212 | 58.27 ± 5.88 | 0.226 ± 0.026 | 98.69 ± 0.411 | 59.24 ± 5.35 | 0.256 ± 0.015 | 98.72 ± 0.143 |
| iii. | 1:2 | 51.76 ± 0.364 | 0.290 ± 0.012 | 98.60 ± 0.172 | 70.30 ± 5.01 | 0.350 ± 0.038 | 97.65 ± 0.421 | 73.59 ± 6.83 | 0.319 ± 0.009 | 97.85 ± 0.398 |
| iv. | 1:2.5 | 140.24 ± 0.668 | 0.545 ± 0.003 | 88.77 ± 0.145 | 150.05 ± 4.82 | 0.545 ± 0.040 | 86.58 ± 0.410 | 150.89 ± 4.90 | 0.563 ± 0.015 | 86.07 ± 0.413 |
| v. | 1:3 | 132.07 ± 1.40 | 0.367 ± 0.052 | 92.79 ± 0.061 | 133.21 ± 2.26 | 0.337 ± 0.044 | 92.37 ± 0.223 | 133.95 ± 1.85 | 0.230 ± 0.095 | 92.33 ± 0.144 |
| Stability Study of NE Composed of Ethyl Oleate as Oil Phase at Smix Ratio 1:1 | ||||||||||
| S. No. | O/S Ratio | 0 days | 15 days | 30 days | ||||||
| Droplet Size | PdI | %T | Droplet Size | PdI | %T | Droplet Size | PdI | %T | ||
| i. | 1:2.5 | 164.07 ± 0.701 | 0.616 ± 0.009 | 84.59 ± 0.850 | 204.59 ± 2.68 | 0.626 ± 0.059 | 82.13 ± 1.93 | 251.32 ± 26.41 | 0.590 ± 0.019 | 87.85 ± 3.74 |
| ii. | 1:2.8 | 140.86 ± 0.905 | 0.128 ± 0.001 | 83.36 ± 1.49 | 168.29 ± 3.13 | 0.217 ± 0.026 | 81.49 ± 0.405 | 270.05 ± 17.20 | 0.295 ± 0.072 | 80.20 ± 0.234 |
| iii. | 1:3 | 114.92 ± 0.402 | 0.251 ± 0.009 | 93.39 ± 0.721 | 152.12 ± 4.53 | 0.313 ± 0.027 | 91.82 ± 0.340 | 250.14 ± 8.95 | 0.315 ± 0.052 | 92.85 ± 0.254 |
| iv. | 1:3.5 | 45.02 ± 3.45 | 0.549 ± 0.108 | 89.91 ± 0.461 | 71.63 ± 4.07 | 0.618 ± 0.110 | 90.50 ± 0.125 | 86.17 ± 9.09 | 0.549 ± 0.101 | 90.40 ± 1.38 |
| v. | 1:4 | 27.76 ± 0.276 | 0.173 ± 0.026 | 98.88 ± 0.176 | 27.22 ± 0.199 | 0.191 ± 0.011 | 98.81 ± 0.533 | 27.01 ± 0.115 | 0.192 ± 0.002 | 98.46 ± 0.015 |
Publisher’s Note: MDPI stays neutral with regard to jurisdictional claims in published maps and institutional affiliations. |
© 2022 by the authors. Licensee MDPI, Basel, Switzerland. This article is an open access article distributed under the terms and conditions of the Creative Commons Attribution (CC BY) license (https://creativecommons.org/licenses/by/4.0/).
Share and Cite
Algahtani, M.S.; Ahmad, M.Z.; Ahmad, J. Investigation of Factors Influencing Formation of Nanoemulsion by Spontaneous Emulsification: Impact on Droplet Size, Polydispersity Index, and Stability. Bioengineering 2022, 9, 384. https://doi.org/10.3390/bioengineering9080384
Algahtani MS, Ahmad MZ, Ahmad J. Investigation of Factors Influencing Formation of Nanoemulsion by Spontaneous Emulsification: Impact on Droplet Size, Polydispersity Index, and Stability. Bioengineering. 2022; 9(8):384. https://doi.org/10.3390/bioengineering9080384
Chicago/Turabian StyleAlgahtani, Mohammed S., Mohammad Zaki Ahmad, and Javed Ahmad. 2022. "Investigation of Factors Influencing Formation of Nanoemulsion by Spontaneous Emulsification: Impact on Droplet Size, Polydispersity Index, and Stability" Bioengineering 9, no. 8: 384. https://doi.org/10.3390/bioengineering9080384
APA StyleAlgahtani, M. S., Ahmad, M. Z., & Ahmad, J. (2022). Investigation of Factors Influencing Formation of Nanoemulsion by Spontaneous Emulsification: Impact on Droplet Size, Polydispersity Index, and Stability. Bioengineering, 9(8), 384. https://doi.org/10.3390/bioengineering9080384