
Shock Acceleration and Attenuation during Running with Minimalist and Maximalist Shoes: A Time- and Frequency-Domain Analysis of Tibial Acceleration

 ,
,  ,
, 


Abstract
1. Introduction
2. Materials and Methods
2.1. Participants
2.2. Experiment Protocol
2.3. Data Collection and Processing
2.4. Statistical Analysis
3. Results
4. Discussion
5. Conclusions
Author Contributions
Funding
Institutional Review Board Statement
Informed Consent Statement
Data Availability Statement
Conflicts of Interest
References
- Altman, A.R.; Davis, I.S. Prospective comparison of running injuries between shod and barefoot runners. Br. J. Sports Med. 2015, 50, 476–480. [Google Scholar] [CrossRef] [PubMed]
- Murr, S.; Pierce, B. How Aging Impacts Runners’ Goals of Lifelong Running. Phys. Act. Health 2019, 3, 71–81. [Google Scholar] [CrossRef][Green Version]
- Johnson, C.D.; Tenforde, A.S.; Outerleys, J.; Reilly, J.; Davis, I.S. Impact-Related Ground Reaction Forces Are More Strongly Associated With Some Running Injuries Than Others. Am. J. Sports Med. 2020, 48, 3072–3080. [Google Scholar] [CrossRef] [PubMed]
- Tenforde, A.S.; Hayano, T.; Jamison, S.T.; Outerleys, J.; Davis, I.S. Tibial Acceleration Measured from Wearable Sensors Is Associated with Loading Rates in Injured Runners. PM&R 2020, 12, 679–684. [Google Scholar] [CrossRef]
- Esculier, J.-F.; Dubois, B.; Dionne, C.E.; Leblond, J.; Roy, J.-S. A consensus definition and rating scale for minimalist shoes. J. Foot Ankle Res. 2015, 8, 42. [Google Scholar] [CrossRef]
- Lieberman, D.E. What We Can Learn About Running from Barefoot Running: An evolutionary medical perspective. Exerc. Sport Sci. Rev. 2012, 40, 63–72. [Google Scholar] [CrossRef]
- Miller, E.E.; Whitcome, K.K.; Lieberman, D.E.; Norton, H.L.; Dyer, R.E. The effect of minimal shoes on arch structure and intrinsic foot muscle strength. J. Sport Health Sci. 2014, 3, 74–85. [Google Scholar] [CrossRef]
- Xiang, L.; Mei, Q.; Wang, A.; Shim, V.; Fernandez, J.; Gu, Y. Evaluating function in the hallux valgus foot following a 12-week minimalist footwear intervention: A pilot computational analysis. J. Biomech. 2022, 132, 110941. [Google Scholar] [CrossRef]
- Xiang, L.; Mei, Q.; Wang, A.; Fernandez, J.; Gu, Y. Gait biomechanics evaluation of the treatment effects for hallux valgus patients: A systematic review and meta-analysis. Gait Posture 2022, 94, 67–78. [Google Scholar] [CrossRef]
- Xiang, L.; Mei, Q.; Fernandez, J.; Gu, Y. Minimalist shoes running intervention can alter the plantar loading distribution and deformation of hallux valgus: A pilot study. Gait Posture 2018, 65, 65–71. [Google Scholar] [CrossRef]
- Fuller, J.T.; Thewlis, D.; Tsiros, M.D.; Brown, N.A.T.; Hamill, J.; Buckley, J.D. Longer-term effects of minimalist shoes on running performance, strength and bone density: A 20-week follow-up study. Eur. J. Sport Sci. 2018, 19, 402–412. [Google Scholar] [CrossRef] [PubMed]
- Hannigan, J.; Pollard, C.D. Differences in running biomechanics between a maximal, traditional, and minimal running shoe. J. Sci. Med. Sport 2020, 23, 15–19. [Google Scholar] [CrossRef] [PubMed]
- Sinclair, J.; Richards, J.; Selfe, J.; Fau-Goodwin, J.; Shore, H. The Influence of Minimalist and Maximalist Footwear on Patellofemoral Kinetics During Running. J. Appl. Biomech. 2016, 32, 359–364. [Google Scholar] [CrossRef] [PubMed]
- Willy, R.; Davis, I.S. Kinematic and Kinetic Comparison of Running in Standard and Minimalist Shoes. Med. Sci. Sports Exerc. 2014, 46, 318–323. [Google Scholar] [CrossRef] [PubMed]
- Chan, Z.Y.S.; Au, I.P.H.; Lau, F.O.Y.; Ching, E.C.K.; Zhang, J.H.; Cheung, R.T.H. Does maximalist footwear lower impact loading during level ground and downhill running? Eur. J. Sport Sci. 2018, 18, 1083–1089. [Google Scholar] [CrossRef] [PubMed]
- Pollard, C.D.; Ter Har, J.A.; Hannigan, J.J.; Norcross, M.F. Influence of Maximal Running Shoes on Biomechanics Before and After a 5K Run. Orthop. J. Sports Med. 2018, 6, 1–5. [Google Scholar] [CrossRef]
- Hannigan, J.; Pollard, C.D. A 6-Week Transition to Maximal Running Shoes Does Not Change Running Biomechanics. Am. J. Sports Med. 2019, 47, 968–973. [Google Scholar] [CrossRef]
- Agresta, C.; Kessler, S.; Southern, E.; Goulet, G.C.; Zernicke, R.; Zendler, J. Immediate and short-term adaptations to maximalist and minimalist running shoes. Footwear Sci. 2018, 10, 95–107. [Google Scholar] [CrossRef]
- Sinclair, J. The influence of minimalist, maximalist and conventional footwear on impact shock attenuation during running. Mov. Sport Sci. Sci. Mot. 2016, 95, 59–64. [Google Scholar] [CrossRef]
- Mo, S.; Chan, Z.Y.S.; Lai, K.K.Y.; Chan, P.P.-K.; Wei, R.X.-Y.; Yung, P.S.-H.; Shum, G.; Cheung, R.T.-H. Effect of minimalist and maximalist shoes on impact loading and footstrike pattern in habitual rearfoot strike trail runners: An in-field study. Eur. J. Sport Sci. 2020, 21, 183–191. [Google Scholar] [CrossRef]
- Gruber, A.H.; Boyer, K.A.; Derrick, T.; Hamill, J. Impact shock frequency components and attenuation in rearfoot and forefoot running. J. Sport Health Sci. 2014, 3, 113–121. [Google Scholar] [CrossRef]
- Baggaley, M.; Vernillo, G.; Martinez, A.; Horvais, N.; Giandolini, M.; Millet, G.Y.; Edwards, W.B. Step length and grade effects on energy absorption and impact attenuation in running. Eur. J. Sport Sci. 2019, 20, 756–766. [Google Scholar] [CrossRef] [PubMed]
- Busa, M.A.; Lim, J.; Van Emmerik, R.E.A.; Hamill, J. Head and Tibial Acceleration as a Function of Stride Frequency and Visual Feedback during Running. PLoS ONE 2016, 11, e0157297. [Google Scholar] [CrossRef] [PubMed]
- Reenalda, J.; Maartens, E.; Buurke, J.H.; Gruber, A.H. Kinematics and shock attenuation during a prolonged run on the athletic track as measured with inertial magnetic measurement units. Gait Posture 2018, 68, 155–160. [Google Scholar] [CrossRef]
- Ferber, R.; Davis, I.M.; Williams, D.S. Gender differences in lower extremity mechanics during running. Clin. Biomech. 2003, 18, 350–357. [Google Scholar] [CrossRef]
- Liu, Q.; Mo, S.; Cheung, V.C.; Cheung, B.M.; Wang, S.; Chan, P.P.; Malhotra, A.; Cheung, R.T.; Chan, R.H. Classification of runners’ performance levels with concurrent prediction of biomechanical parameters using data from inertial measurement units. J. Biomech. 2020, 112, 110072. [Google Scholar] [CrossRef]
- Altman, A.R.; Davis, I.S. A kinematic method for footstrike pattern detection in barefoot and shod runners. Gait Posture 2012, 35, 298–300. [Google Scholar] [CrossRef]
- England, S.A.; Granata, K.P. The influence of gait speed on local dynamic stability of walking. Gait Posture 2007, 25, 172–178. [Google Scholar] [CrossRef]
- Aubol, K.G.; Milner, C. Foot contact identification using a single triaxial accelerometer during running. J. Biomech. 2020, 105, 109768. [Google Scholar] [CrossRef]
- Shorten, M.R.; Winslow, D.S. Spectral Analysis of Impact Shock during Running. Int. J. Sport Biomech. 1992, 8, 288–304. [Google Scholar] [CrossRef]
- Hamill, J.; Derrick, T.; Holt, K. Shock attenuation and stride frequency during running. Hum. Mov. Sci. 1995, 14, 45–60. [Google Scholar] [CrossRef]
- Cohen, J. Statistical Power Analysis for the Behavioral Sciences, 2nd ed.; Routledge: New York, NY, USA, 2013. [Google Scholar]
- García-Pérez, J.A.; Pérez-Soriano, P.; Belloch, S.L.; Lucas-Cuevas, Á.G.; Sánchez-Zuriaga, D. Effects of treadmill running and fatigue on impact acceleration in distance running. Sports Biomech. 2014, 13, 259–266. [Google Scholar] [CrossRef] [PubMed]
- Willwacher, S.; Kurz, M.; Robbin, J.; Thelen, M.; Hamill, J.; Kelly, L.; Mai, P. Running-Related Biomechanical Risk Factors for Overuse Injuries in Distance Runners: A Systematic Review Considering Injury Specificity and the Potentials for Future Research. Sports Med. 2022; Advance online publication. [Google Scholar] [CrossRef]
- Hoenig, T.; Ackerman, K.E.; Beck, B.R.; Bouxsein, M.L.; Burr, D.B.; Hollander, K.; Popp, K.L.; Rolvien, T.; Tenforde, A.S.; Warden, S.J. Bone stress injuries. Nat. Rev. Dis. Prim. 2022, 8, 26. [Google Scholar] [CrossRef] [PubMed]
- Dempster, J.; Dutheil, F.; Ugbolue, U.C. The Prevalence of Lower Extremity Injuries in Running and Associated Risk Factors: A Systematic Review. Phys. Act. Health 2021, 5, 133–145. [Google Scholar] [CrossRef]
- Schütte, K.H.; Seerden, S.; Venter, R.; Vanwanseele, B. Influence of outdoor running fatigue and medial tibial stress syndrome on accelerometer-based loading and stability. Gait Posture 2018, 59, 222–228. [Google Scholar] [CrossRef]
- McErlain-Naylor, S.; King, M.; Allen, S. Surface acceleration transmission during drop landings in humans. J. Biomech. 2021, 118, 110269. [Google Scholar] [CrossRef]


| MINs | CONs | MAXs | One-Way ANOVA | |||
|---|---|---|---|---|---|---|
| F-Value | p-Value | |||||
| Time domain | ||||||
| Distal tibia | ||||||
| Time to peak acceleration (s) | 0.01 (0.00) | 0.01 (0.00) | 0.01 (0.01) | 1.18 | 0.05 | 0.31 |
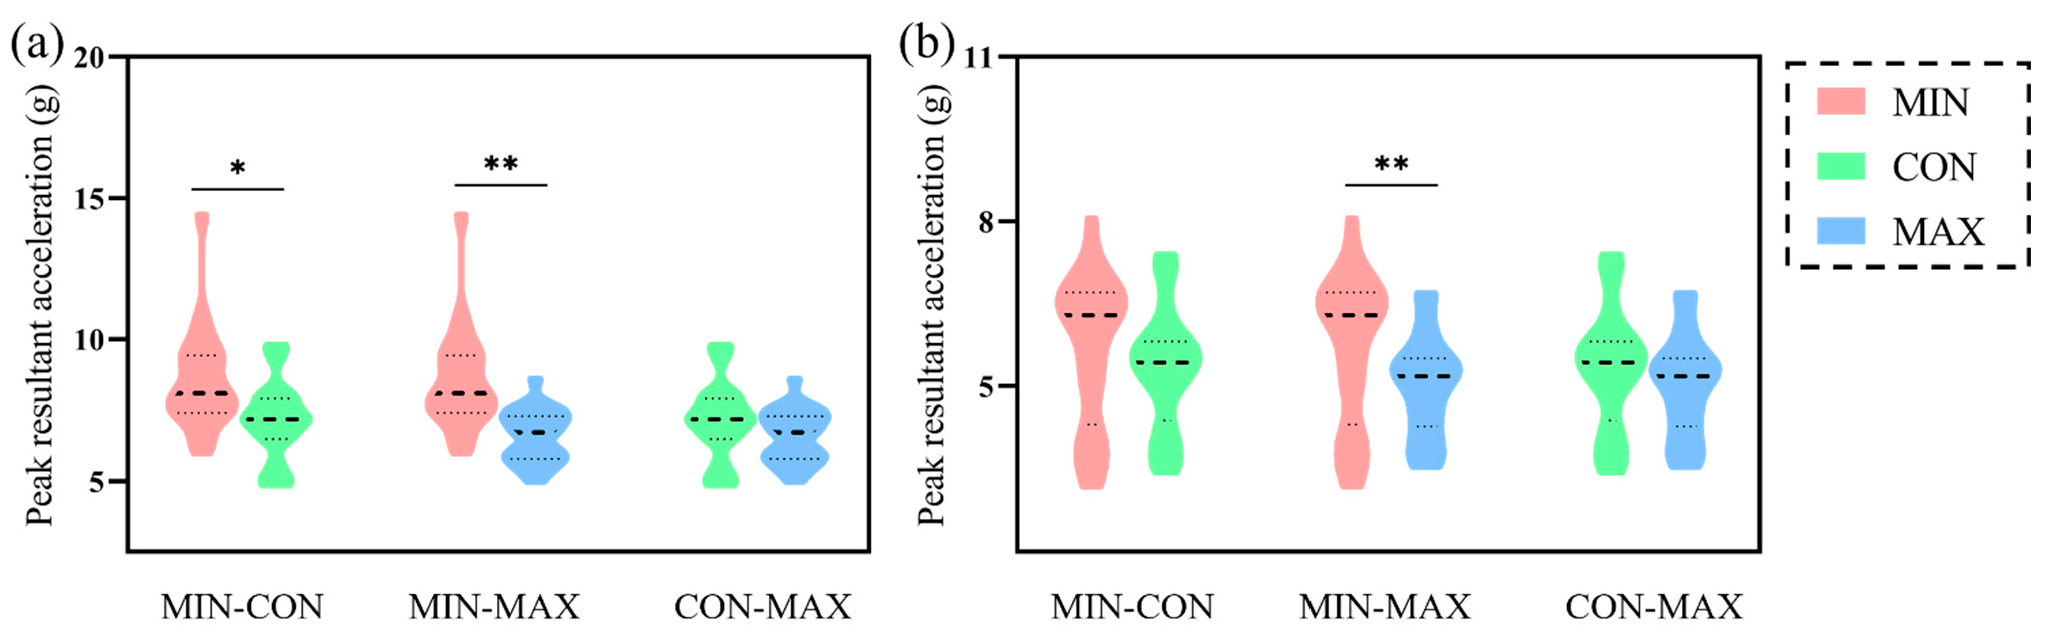
| Peak resultant acceleration (g) | 8.52 (1.75) | 7.13 (1.37) | 6.58 (0.91) | 15.27 | 0.4 | <0.01 |
| Proximal tibia | ||||||
| Time to peak acceleration (s) | 0.03 (0.03) | 0.05 (0.04) | 0.06 (0.06) | 2.01 | 0.08 | 0.15 |
| Peak resultant acceleration (g) | 5.7 (1.35) | 5.32 (1.10) | 5.02 (0.90) | 5.73 | 0.2 | 0.01 |
| Frequency domain | ||||||
| Distal tibia | ||||||
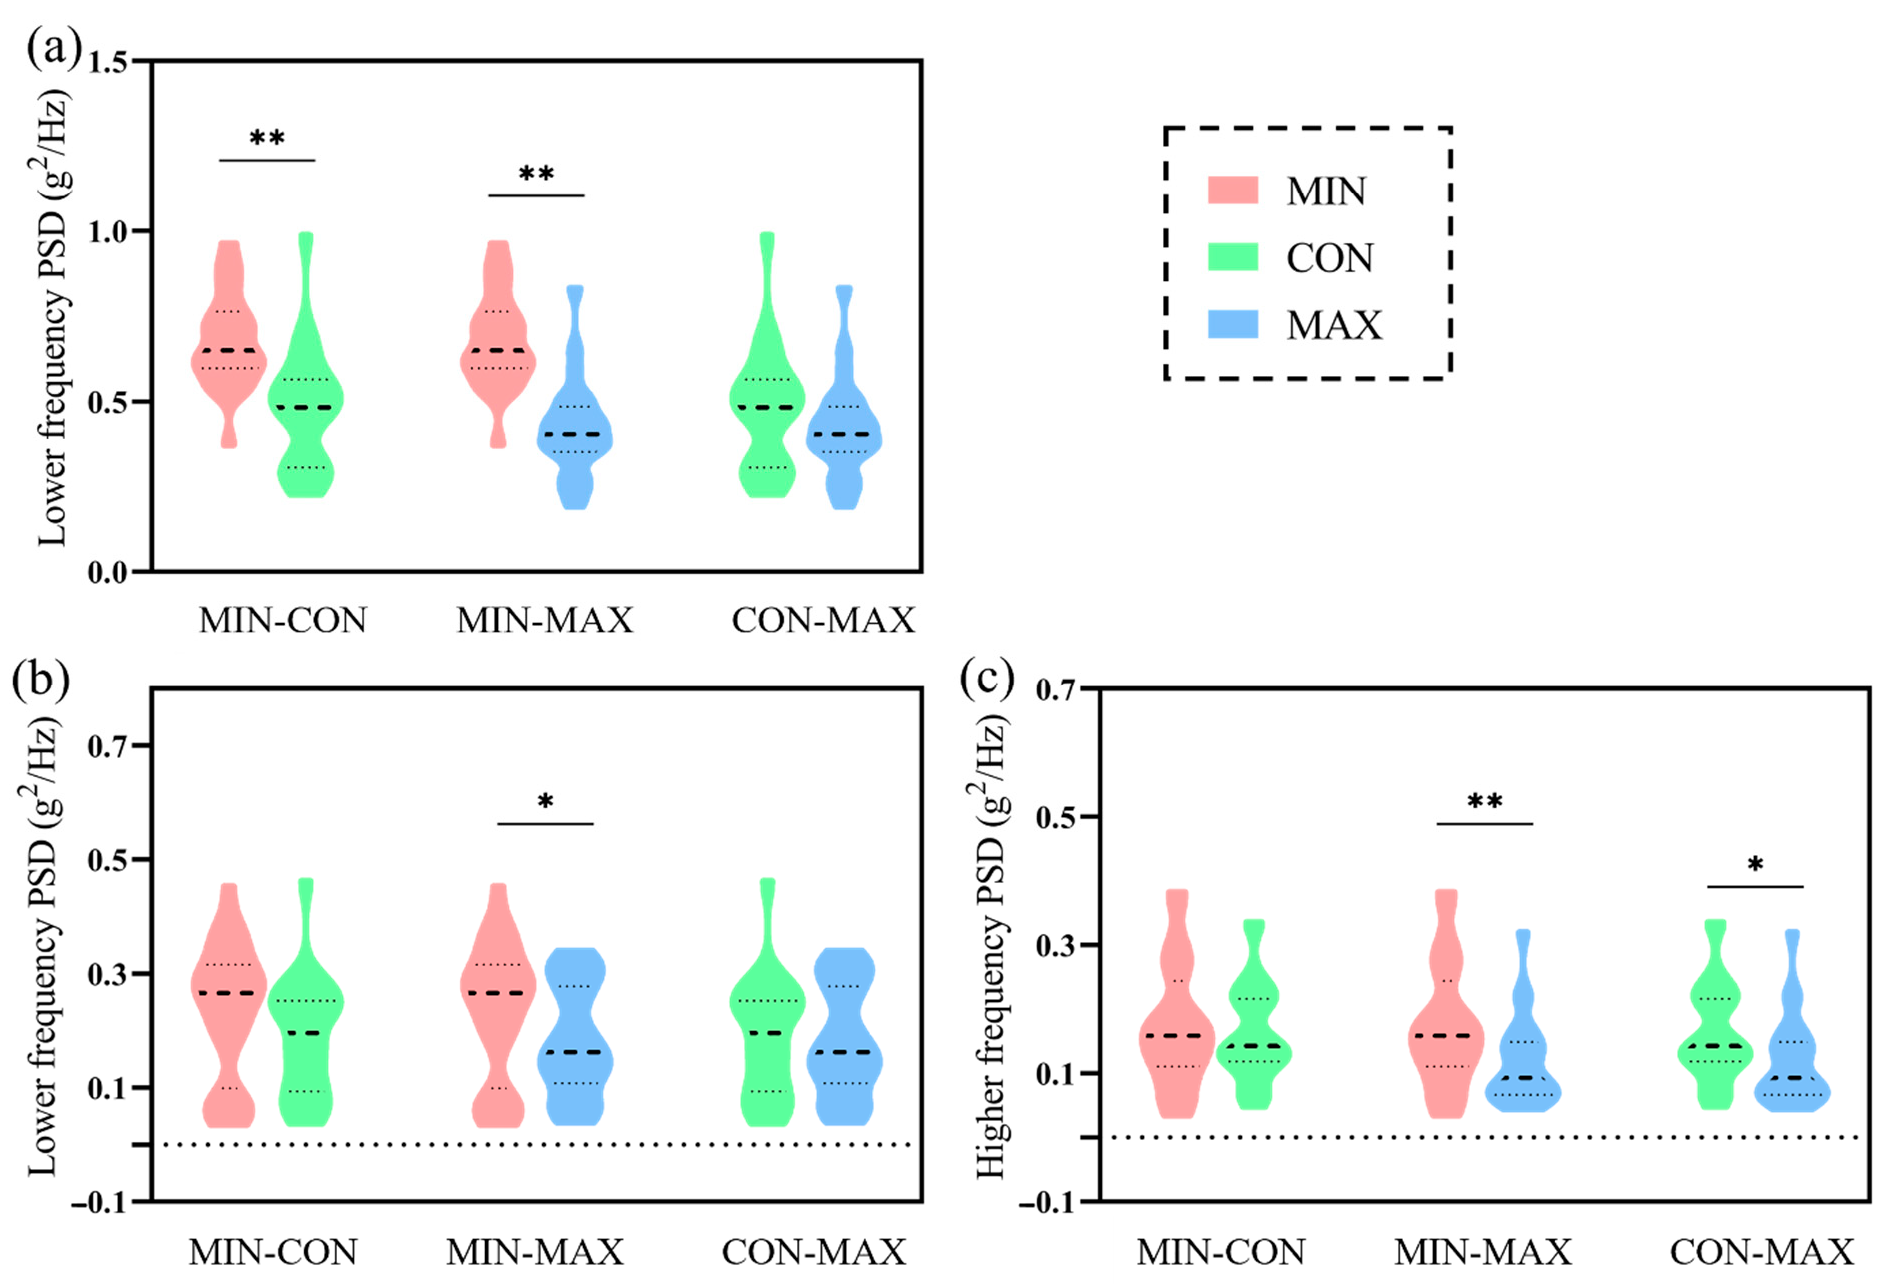
| PSD in 3–8 Hz (g2/Hz) | 0.68 (0.14) | 0.48 (0.18) | 0.42 (0.14) | 18.99 | 0.45 | <0.01 |
| PSD in 9–20 Hz (g2/Hz) | 0.32 (0.14) | 0.26 (0.14) | 0.25 (0.10) | 2.89 | 0.11 | 0.07 |
| Proximal tibia | ||||||
| PSD in 3–8 Hz (g2/Hz) | 0.23 (0.12) | 0.19 (0.10) | 0.18 (0.10) | 4.30 | 0.16 | 0.02 |
| PSD in 9–20 Hz (g2/Hz) | 0.17 (0.10) | 0.16 (0.08) | 0.12 (0.07) | 6.83 | 0.23 | <0.01 |
| Shock attenuation | ||||||
| 3–8 Hz magnitude (dB) | −32.36 (21.28) | −28.12 (23.12) | −24.61 (23.76) | 1.98 | 0.08 | 0.15 |
| 9–20 Hz magnitude (dB) | −38.27 (45.03) | −23.53 (42.64) | −54.72 (37.49) | 5.40 | 0.19 | 0.01 |
Publisher’s Note: MDPI stays neutral with regard to jurisdictional claims in published maps and institutional affiliations. |
© 2022 by the authors. Licensee MDPI, Basel, Switzerland. This article is an open access article distributed under the terms and conditions of the Creative Commons Attribution (CC BY) license (https://creativecommons.org/licenses/by/4.0/).
Share and Cite
Xiang, L.; Gu, Y.; Rong, M.; Gao, Z.; Yang, T.; Wang, A.; Shim, V.; Fernandez, J. Shock Acceleration and Attenuation during Running with Minimalist and Maximalist Shoes: A Time- and Frequency-Domain Analysis of Tibial Acceleration. Bioengineering 2022, 9, 322. https://doi.org/10.3390/bioengineering9070322
Xiang L, Gu Y, Rong M, Gao Z, Yang T, Wang A, Shim V, Fernandez J. Shock Acceleration and Attenuation during Running with Minimalist and Maximalist Shoes: A Time- and Frequency-Domain Analysis of Tibial Acceleration. Bioengineering. 2022; 9(7):322. https://doi.org/10.3390/bioengineering9070322
Chicago/Turabian StyleXiang, Liangliang, Yaodong Gu, Ming Rong, Zixiang Gao, Tao Yang, Alan Wang, Vickie Shim, and Justin Fernandez. 2022. "Shock Acceleration and Attenuation during Running with Minimalist and Maximalist Shoes: A Time- and Frequency-Domain Analysis of Tibial Acceleration" Bioengineering 9, no. 7: 322. https://doi.org/10.3390/bioengineering9070322
APA StyleXiang, L., Gu, Y., Rong, M., Gao, Z., Yang, T., Wang, A., Shim, V., & Fernandez, J. (2022). Shock Acceleration and Attenuation during Running with Minimalist and Maximalist Shoes: A Time- and Frequency-Domain Analysis of Tibial Acceleration. Bioengineering, 9(7), 322. https://doi.org/10.3390/bioengineering9070322