

Effects of Shoe Midfoot Bending Stiffness on Multi-Segment Foot Kinematics and Ground Reaction Force during Heel-Toe Running


Abstract
1. Introduction
2. Materials and Methods
2.1. Participants
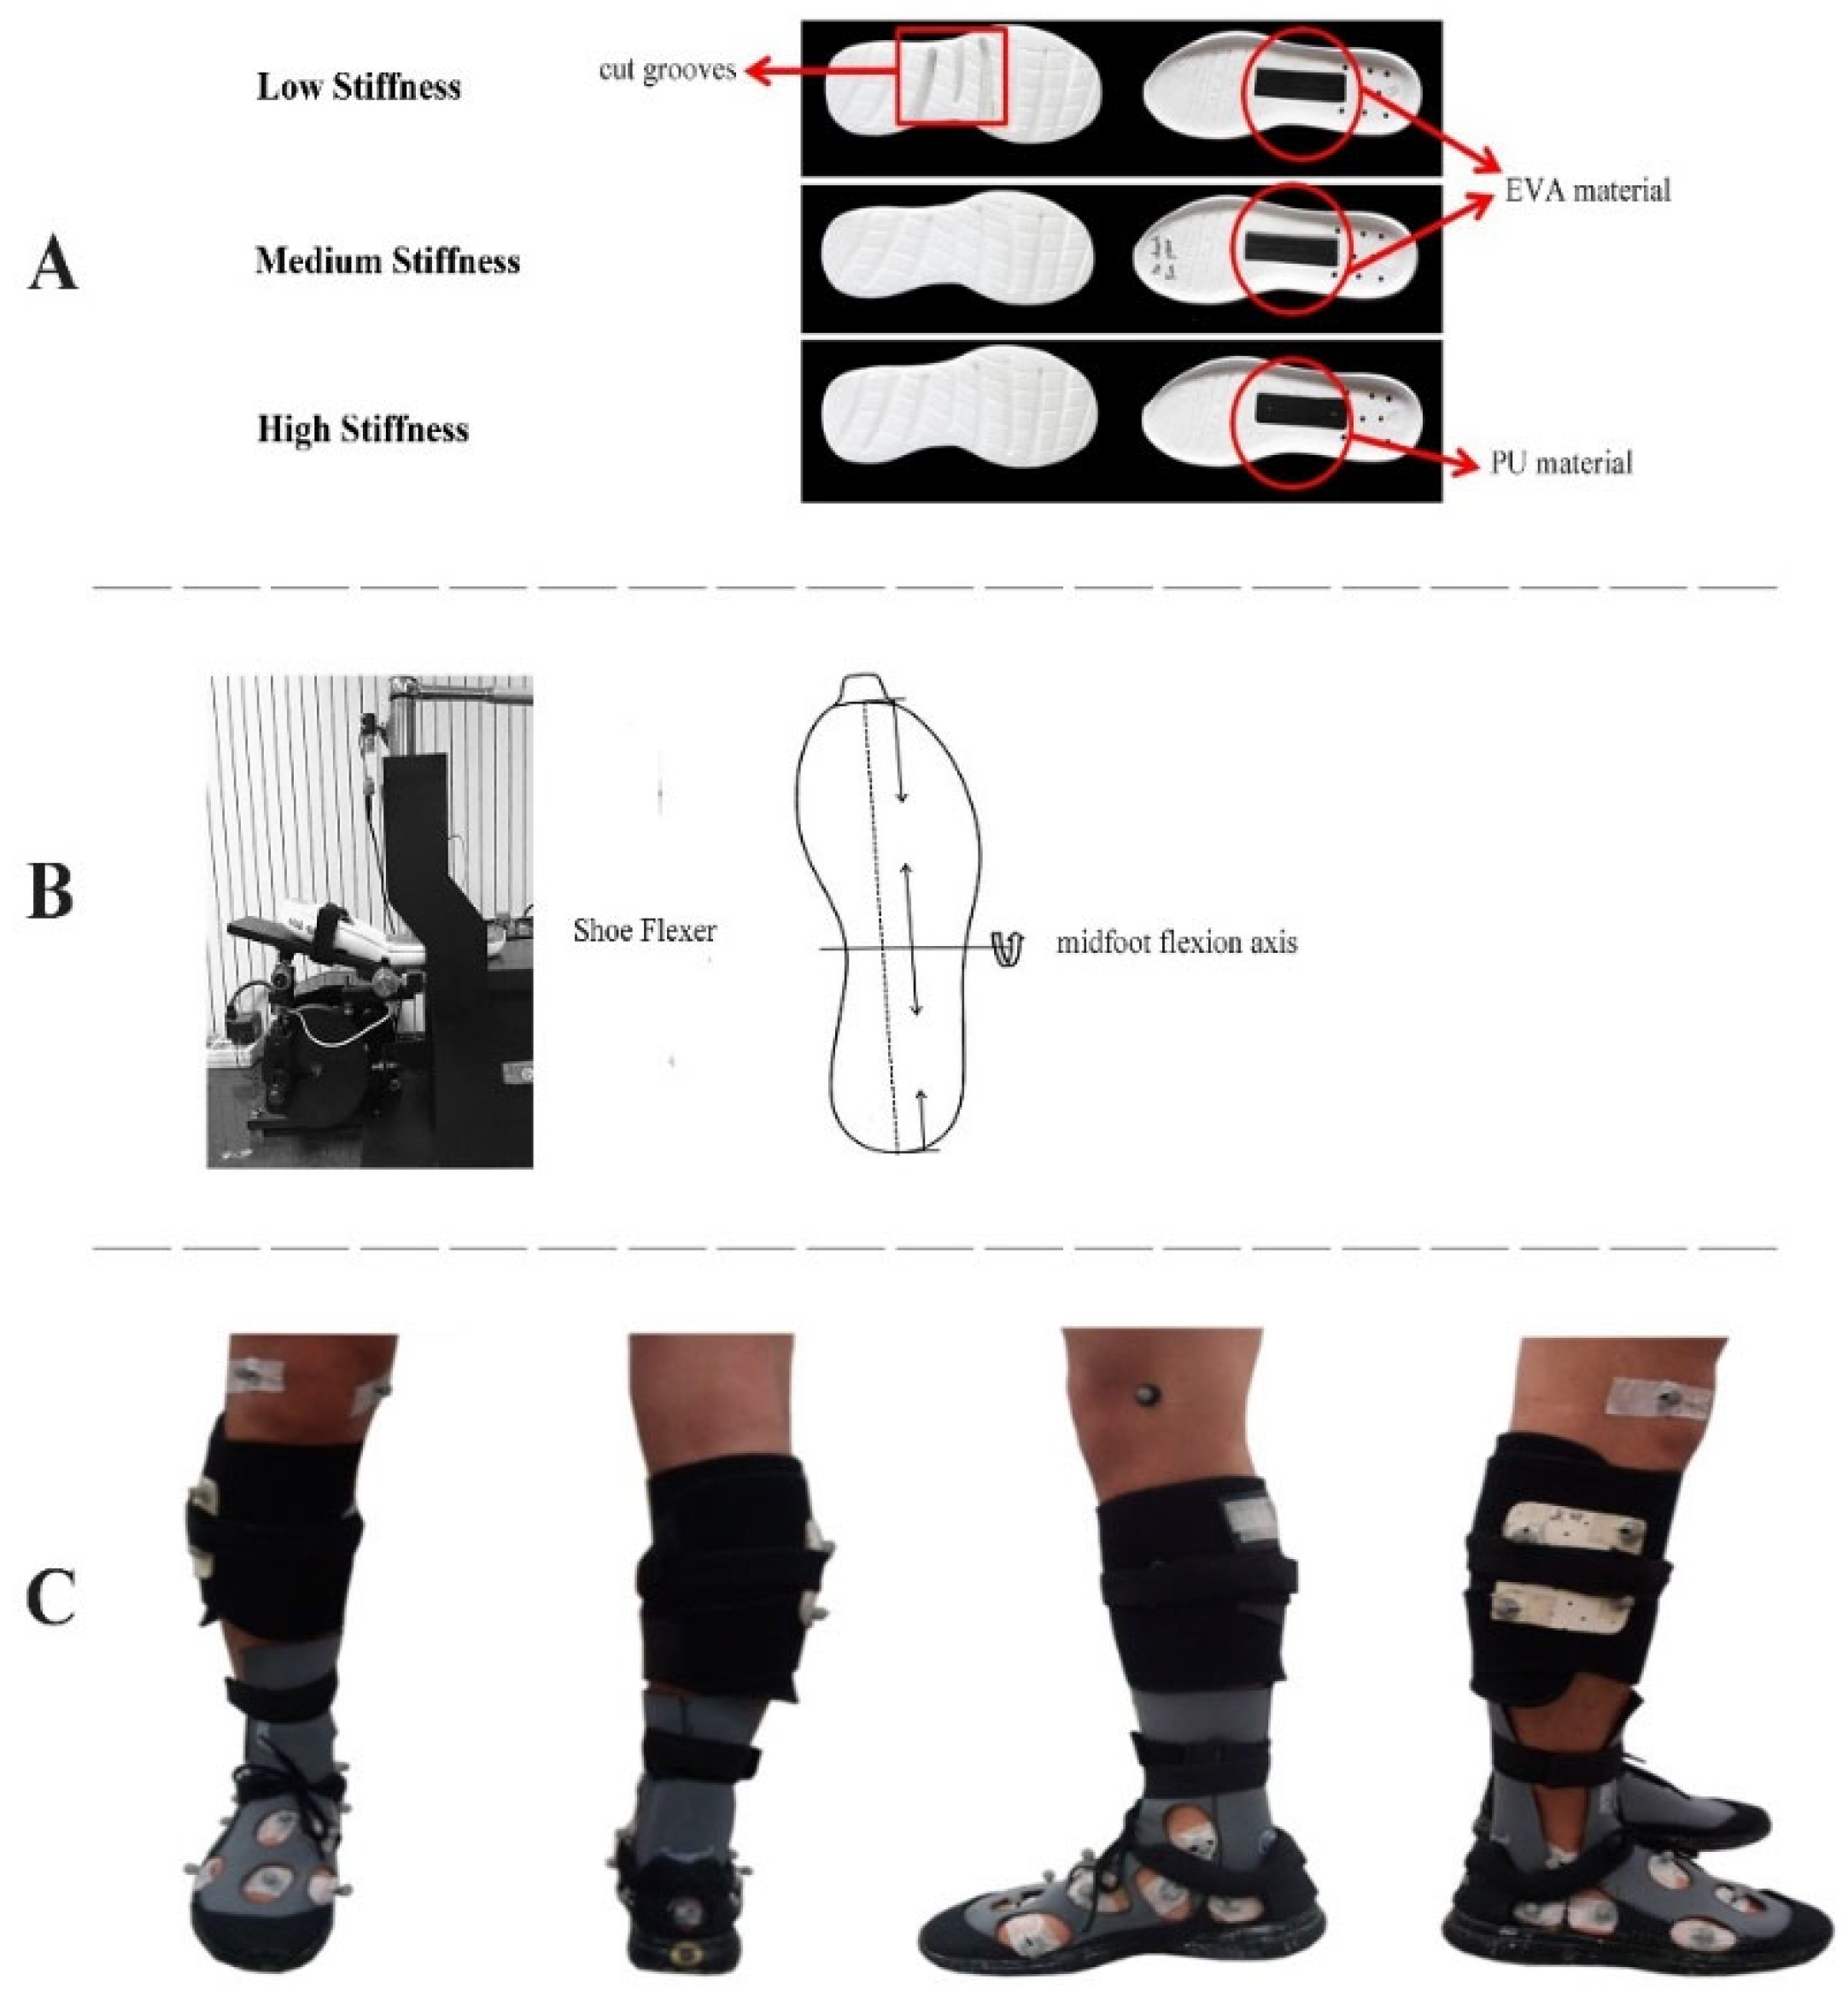
2.2. Footwear Conditions
2.3. Procedures
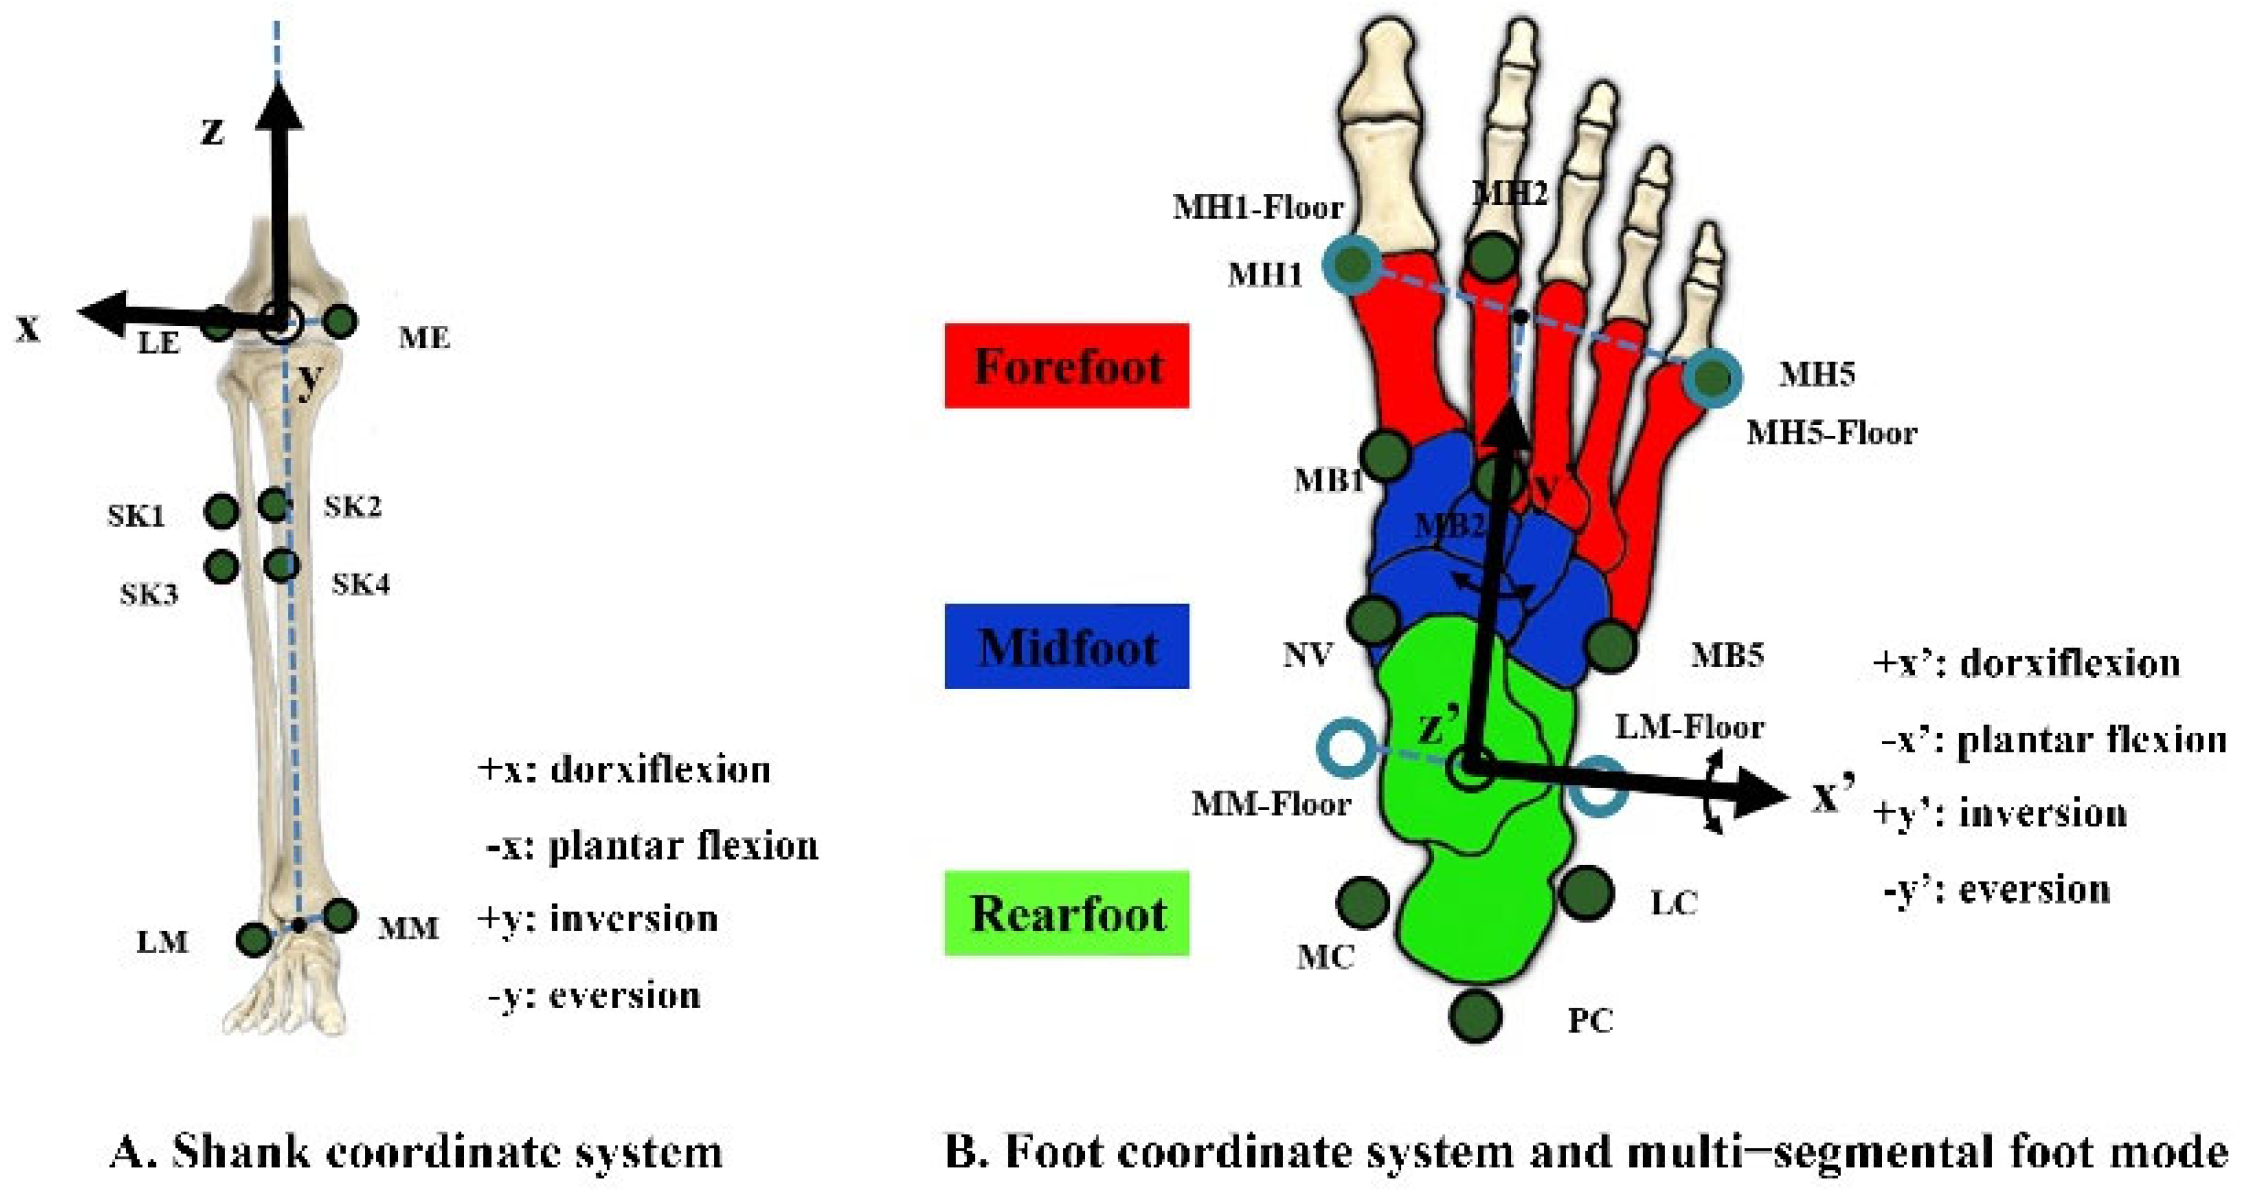
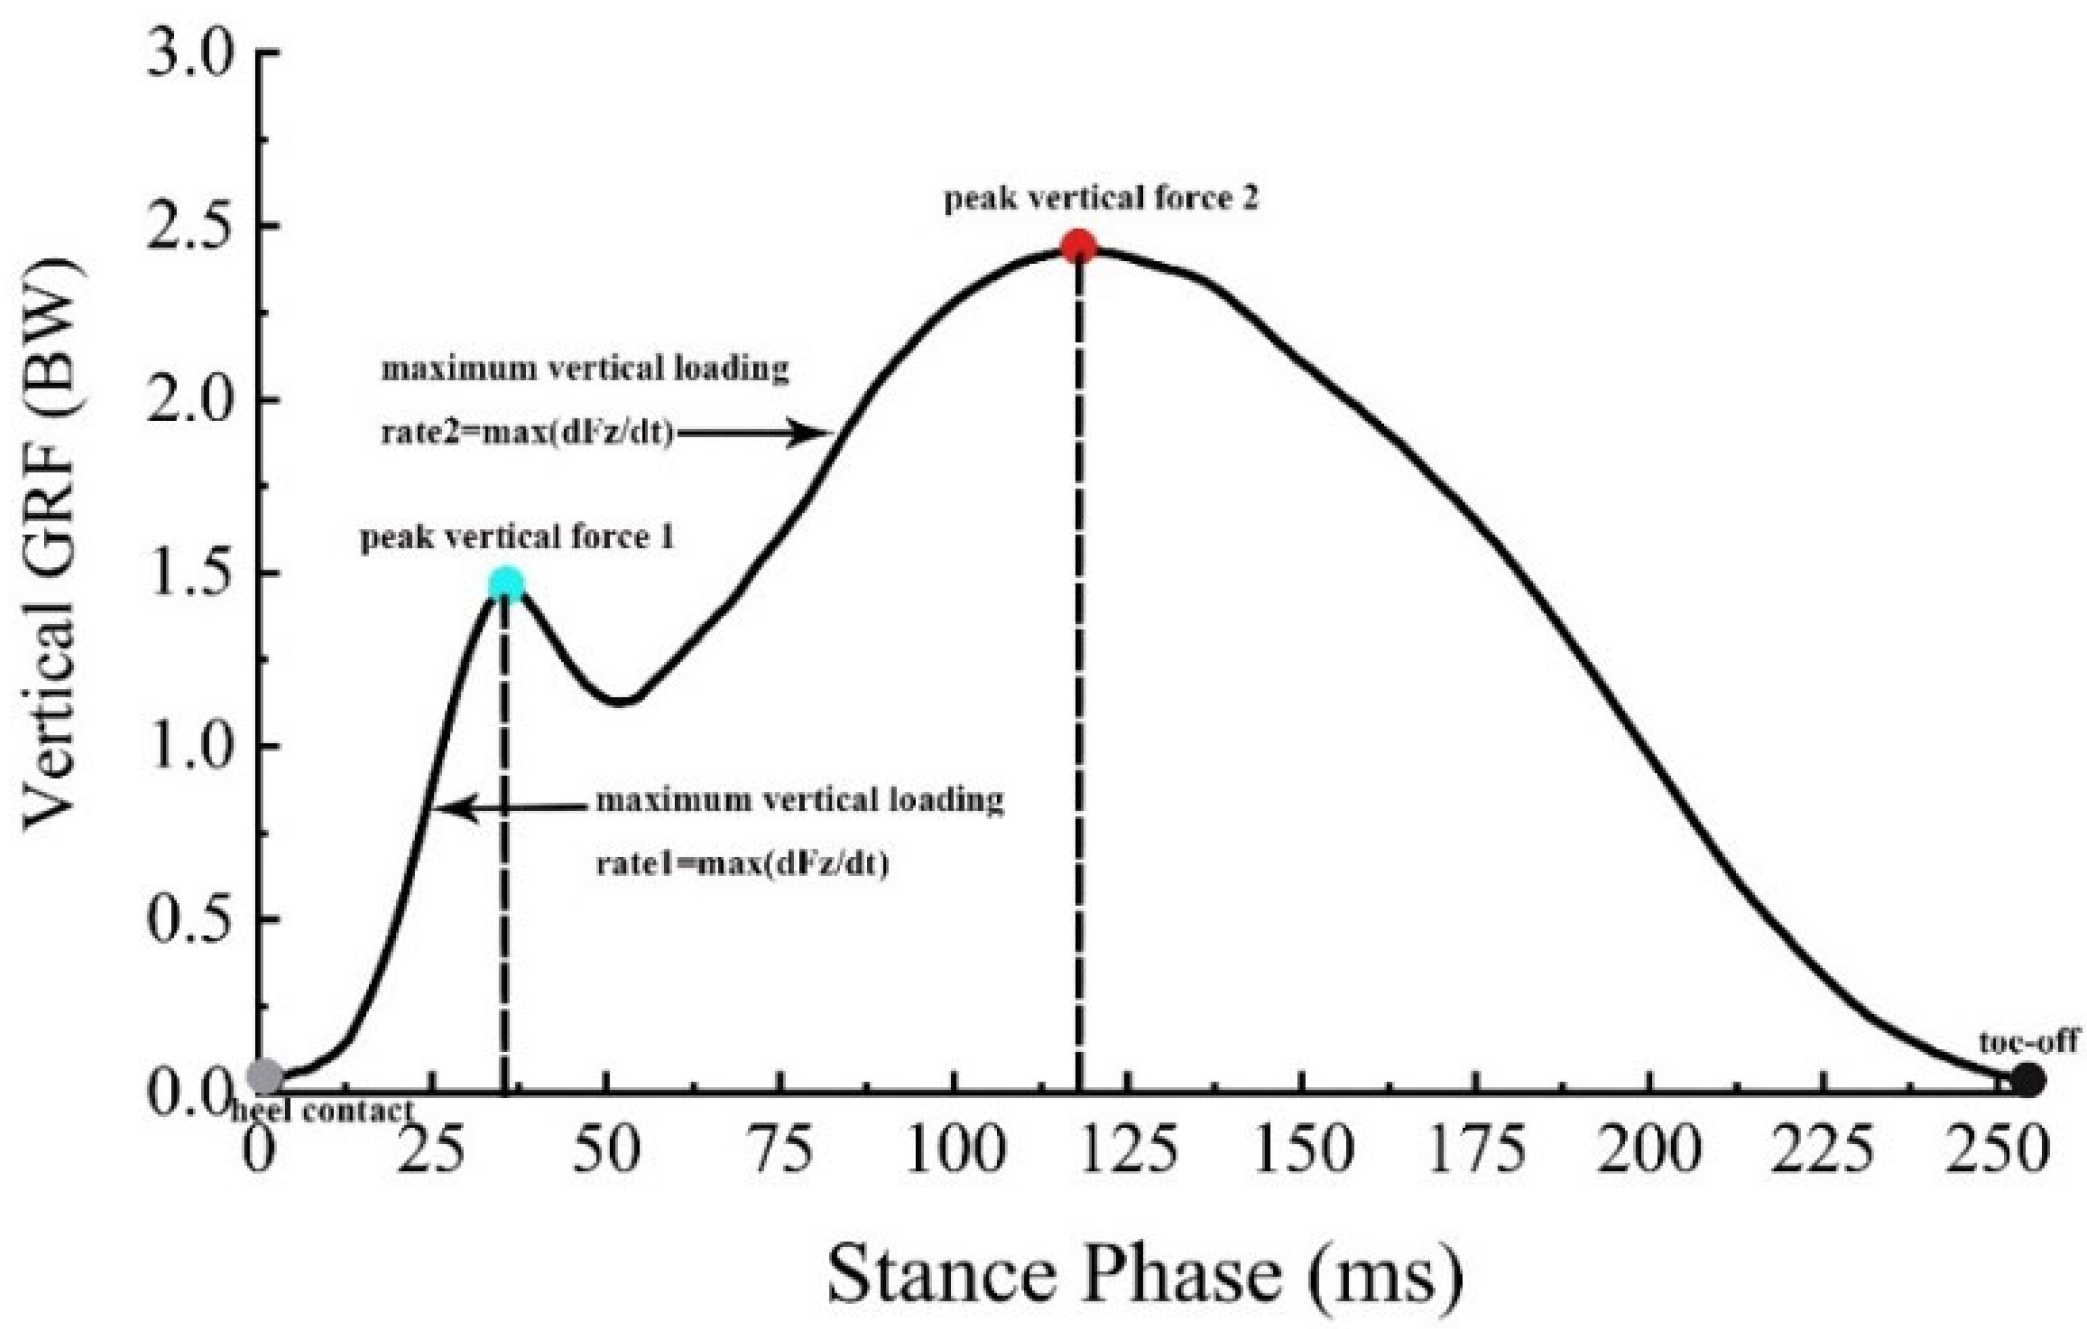
2.4. Data Processing
2.5. Statistical Analysis
3. Results
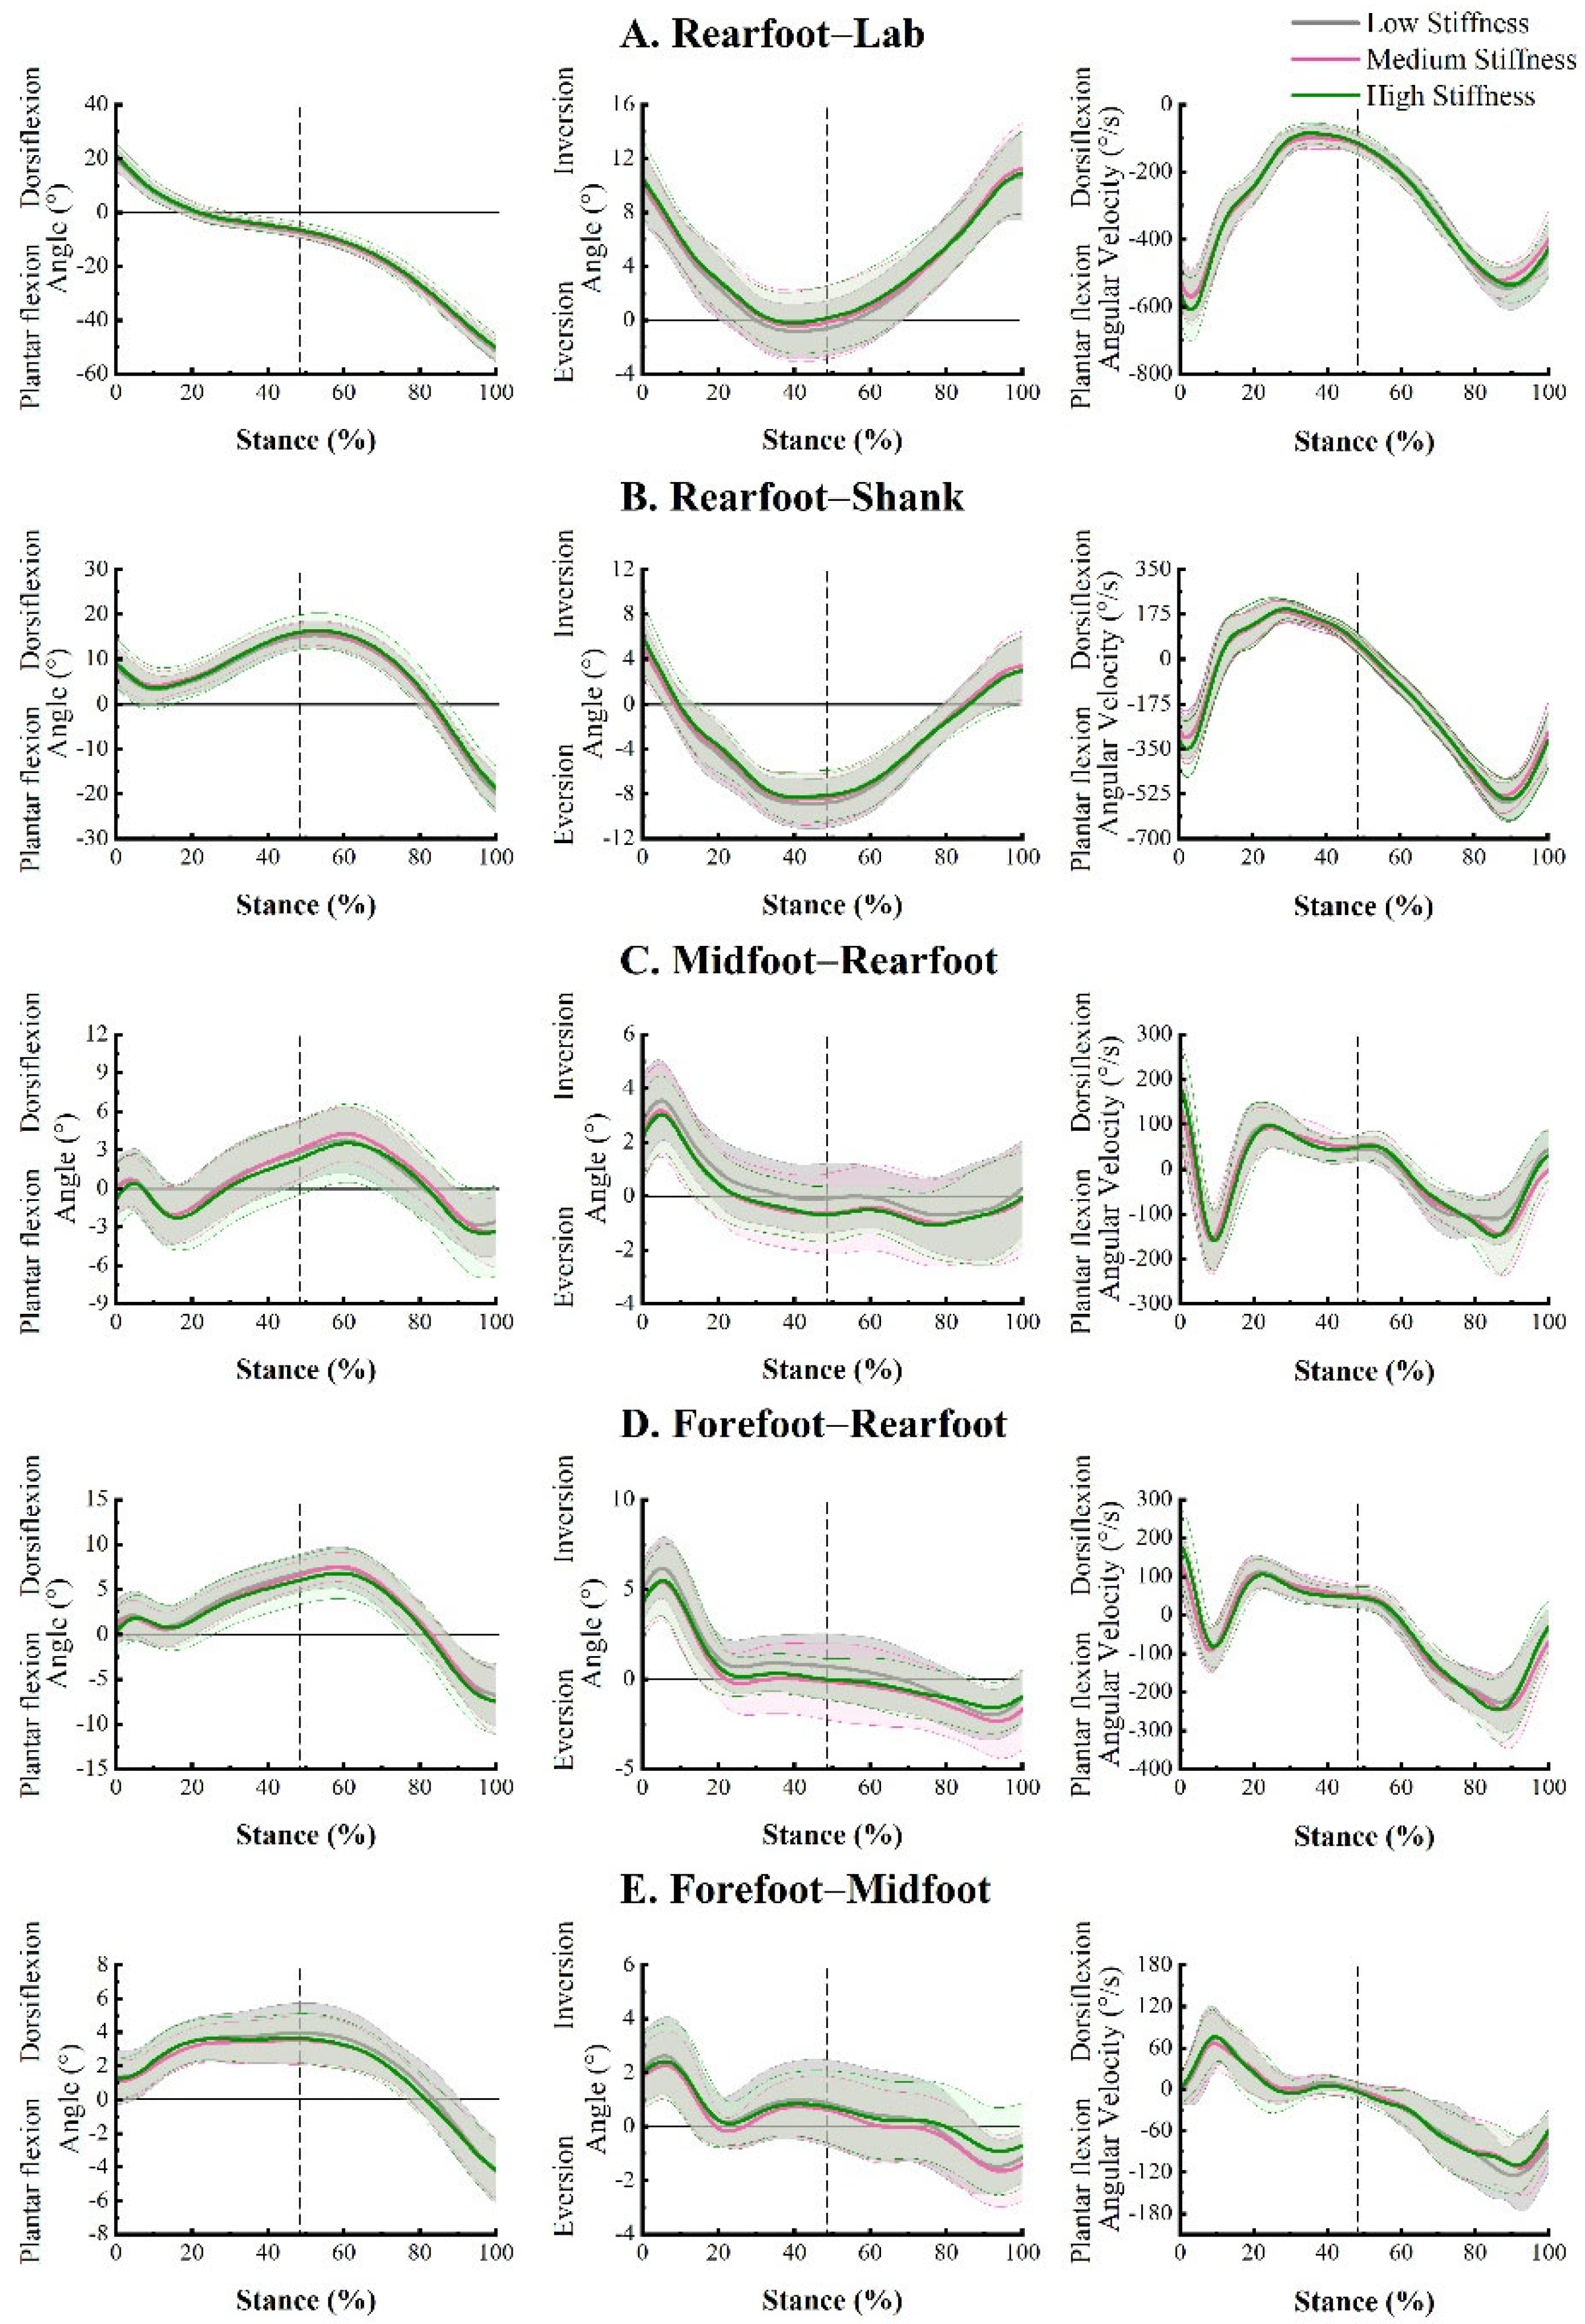
3.1. Kinematics
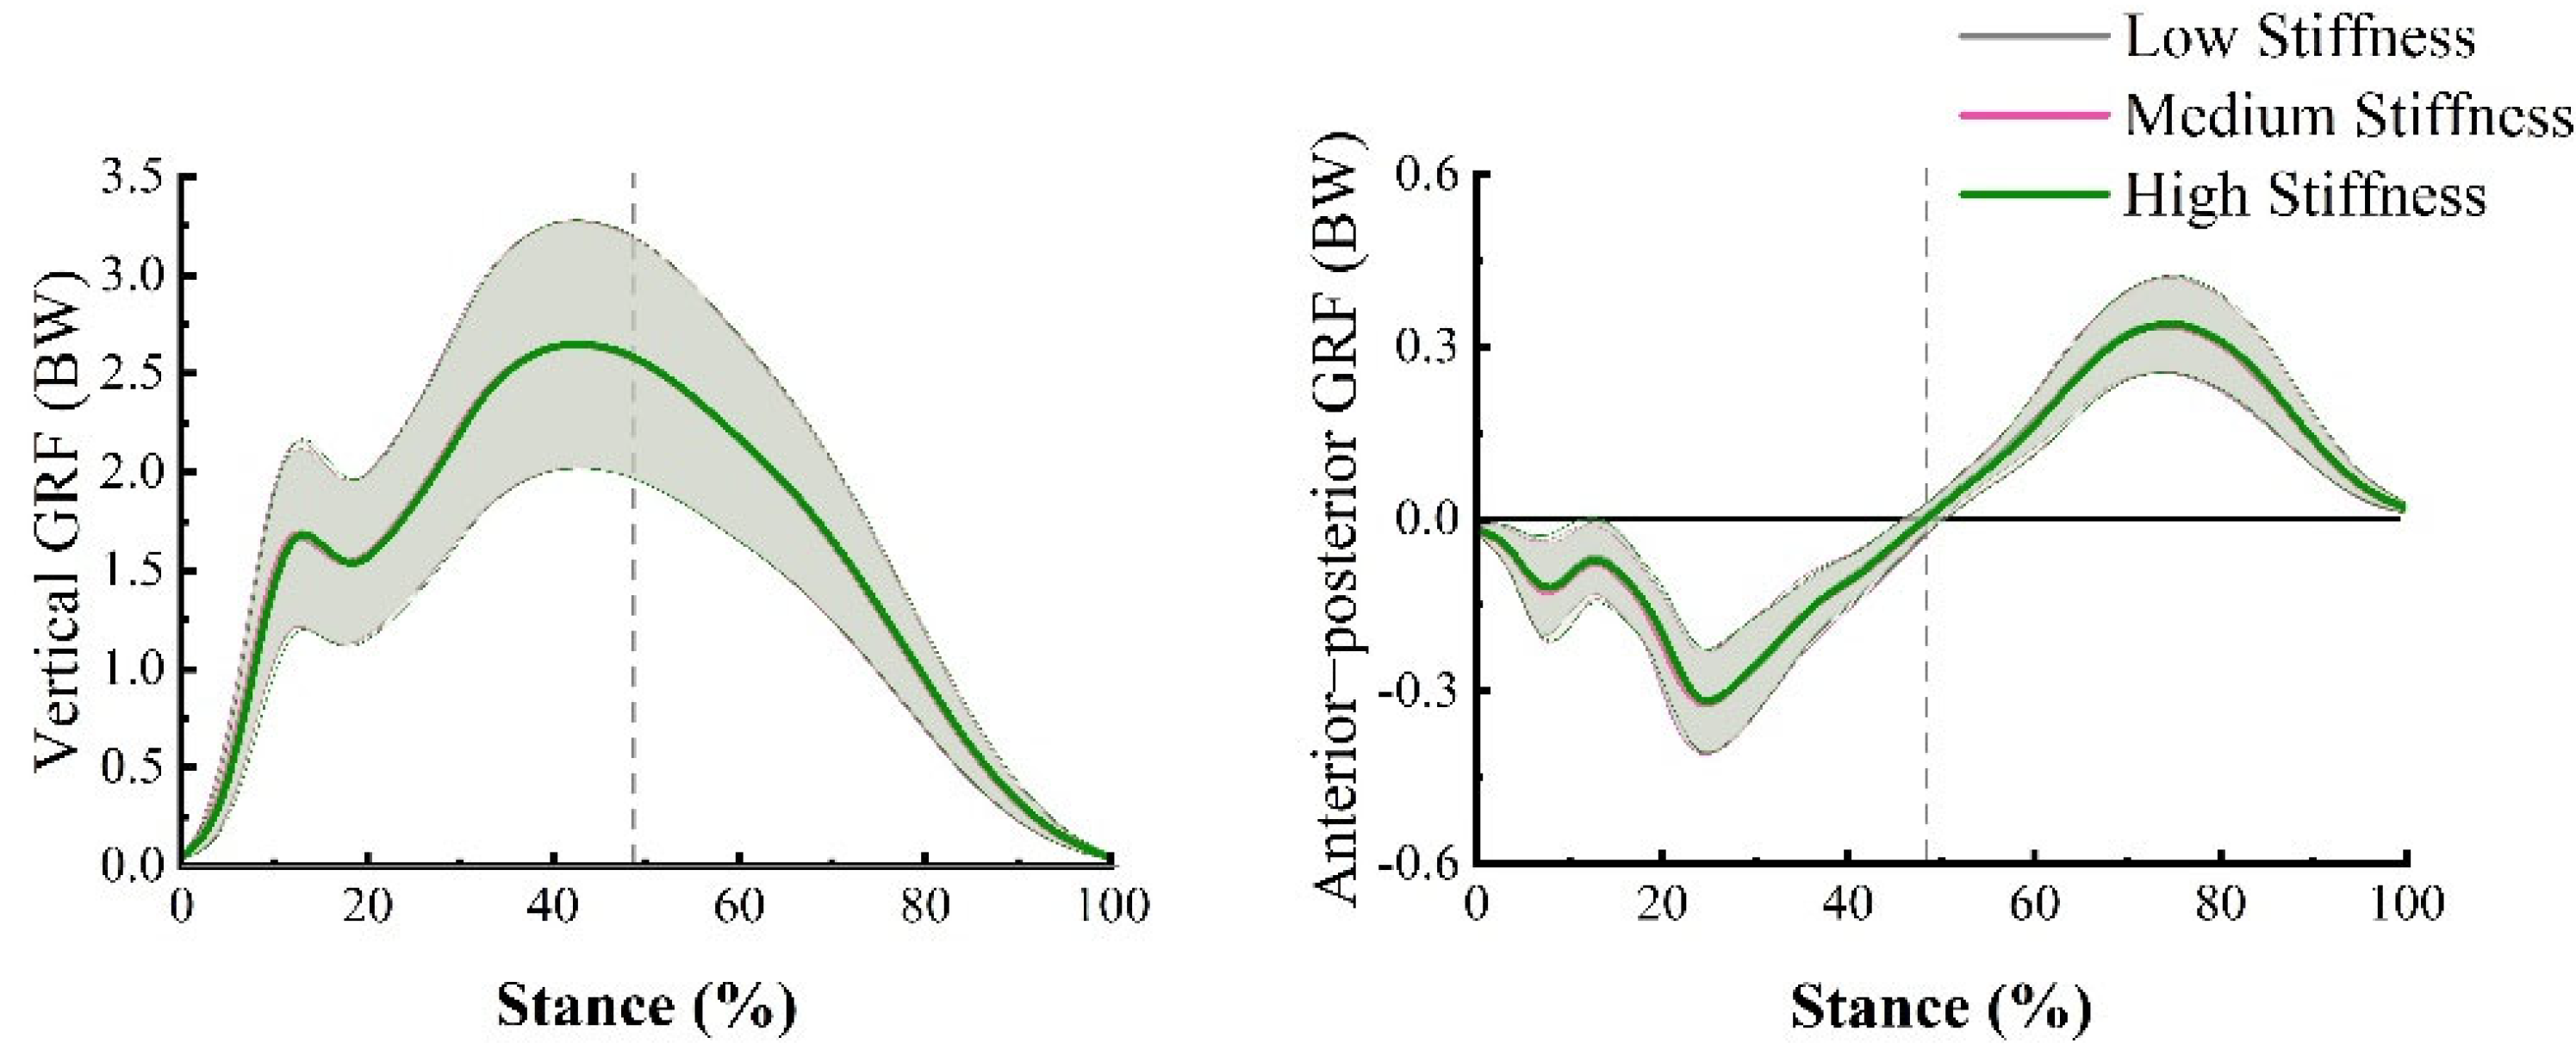
3.2. GRF
4. Discussion
5. Conclusions
Author Contributions
Funding
Institutional Review Board Statement
Informed Consent Statement
Data Availability Statement
Acknowledgments
Conflicts of Interest
References
- Hoitz, F.; Mohr, M.; Asmussen, M.; Lam, W.K.; Nigg, S.; Nigg, B. The effects of systematically altered footwear features on biomechanics, injury, performance, and preference in runners of different skill level: A systematic review. Footwear Sci. 2020, 12, 193–215. [Google Scholar] [CrossRef]
- Sun, X.; Lam, W.K.; Zhang, X.; Wang, J.; Fu, W. Systematic review of the role of footwear constructions in running biomechanics: Implications for running-related injury and performance. J. Sports Sci. Med. 2020, 19, 20–37. [Google Scholar] [PubMed]
- Hannigan, J.J.; Pollard, C.D. Differences in running biomechanics between a maximal, traditional, and minimal running shoe. J. Sci. Med. Sport 2020, 23, 15–19. [Google Scholar] [CrossRef]
- Hardin, E.C.; van den Bogert, A.J.; Hamill, J. Kinematic adaptations during running: Effects of footwear, surface, and duration. Med. Sci. Sports Exerc. 2004, 36, 838–844. [Google Scholar] [CrossRef] [PubMed]
- Morio, C.; Flores, N. Effect of shoe bending stiffness on lower limb kinetics of female recreational runners. Comput. Methods Biomech. Biomed. Eng. 2017, 20, 139–140. [Google Scholar] [CrossRef]
- Squadrone, R.; Rodano, R.; Hamill, J.; Preatoni, E. Acute effect of different minimalist shoes on foot strike pattern and kinematics in rearfoot strikers during running. J. Sport Sci. 2015, 33, 1196–1204. [Google Scholar] [CrossRef]
- Dubbeldam, R.; Buurke, J.H.; Simons, C.; Groothuis-Oudshoorn, C.G.; Baan, H.; Nene, A.V.; Hermens, H.J. The effects of walking speed on forefoot, hindfoot and ankle joint motion. Clin. Biomech. 2010, 25, 796–801. [Google Scholar] [CrossRef]
- Lundgren, P.; Nester, C.; Liu, A.; Arndt, A.; Jones, R.; Stacoff, A.; Wolf, P.; Lundberg, A. Invasive in vivo measurement of rear-, mid- and forefoot motion during walking. Gait Posture 2008, 28, 93–100. [Google Scholar] [CrossRef]
- Stebbins, J.; Harrington, M.; Thompson, N.; Zavatsky, A.; Theologis, T.J.G. Posture. Repeatability of a model for measuring multi-segment foot kinematics in children. Gait Posture 2006, 23, 401–410. [Google Scholar] [CrossRef] [PubMed]
- Cigoja, S.; Asmussen, M.J.; Firminger, C.R.; Fletcher, J.R.; Edwards, W.B.; Nigg, B.M. The effects of increased midsole bending stiffness of sport shoes on muscle-tendon unit shortening and shortening velocity: A randomised crossover trial in recreational male runners. Sports Med. Open 2020, 6, 9. [Google Scholar] [CrossRef] [PubMed]
- Renan, A.; Resende, T.S.; Fonseca, P.L.; Silva, A.E.; Pertence, R.; Kirkwood, N. Forefoot midsole stiffness affects forefoot and rearfoot kinematics during the stance phase of gait. J. Am. Podiatr. Med. Assoc. 2014, 104, 183–190. [Google Scholar]
- Stacoff, A.; Kaelin, X.; Stuessi, E.; Segesser, B. The torsion of the foot in running. J. Appl. Biomech. 1989, 5, 375–389. [Google Scholar] [CrossRef]
- Graf, E.; Stefanyshyn, D. The effect of shoe torsional stiffness on lower extremity kinematics and biomechanical risk factors for patellofemoral pain syndrome during running. Footwear Sci. 2012, 4, 199–206. [Google Scholar] [CrossRef]
- Graf, E.; Wannop, J.W.; Schlarb, H.; Stefanyshyn, D. Effect of torsional stiffness on biomechanical variables of the lower extremity during running. Footwear Sci. 2017, 9, 1–8. [Google Scholar] [CrossRef]
- Arndt, A.; Lundgren, P.; Liu, A.; Nester, C.; Maiwald, C.; Jones, R.; Lundberg, A.; Wolf, P.J.F.E. The effect of a midfoot cut in the outer sole of a shoe on intrinsic foot kinematics during walking. Footwear Sci. 2013, 5, 63–69. [Google Scholar] [CrossRef]
- Morio, C.; Lake, M.J.; Gueguen, N.; Rao, G.; Baly, L. The influence of footwear on foot motion during walking and running. J. Biomech. 2009, 42, 2081–2088. [Google Scholar] [CrossRef]
- Willwacher, S.; König, M.; Potthast, W.; Brüggemann, G.-P. Does specific footwear facilitate energy storage and return at the metatarsophalangeal joint in running? J. Appl. Biomech. 2013, 29, 583–592. [Google Scholar] [CrossRef] [PubMed]
- Oh, K.; Park, S. The bending stiffness of shoes is beneficial to running energetics if it does not disturb the natural MTP joint flexion. J. Biomech. 2017, 53, 127. [Google Scholar] [CrossRef]
- Flores, N.; Delattre, N.; Berton, E.; Rao, G. Effects of shoe energy return and bending stiffness on running economy and kinetics. Footwear Sci. 2017, 9, S11–S13. [Google Scholar] [CrossRef]
- Faul, F.; Erdfelder, E.; Lang, A.-G.; Buchner, A. G*Power 3: A flexible statistical power analysis program for the social, behavioral, and biomedical sciences. Behav. Res. Methods 2007, 39, 175–191. [Google Scholar] [CrossRef] [PubMed]
- Peters, M. Footedness: Asymmetries in foot preference and skill and neuropsychological assessment of foot movement. Psychol. Bull. 1988, 103, 179–192. [Google Scholar] [CrossRef]
- Altman, A.R.; Davis, I.S. Barefoot running: Biomechanics and implications for running injuries. Curr. Sport Med. Rep. 2012, 11, 244–250. [Google Scholar] [CrossRef]
- Lieberman, D.E.; Venkadesan, M.; Werbel, W.A.; Daoud, A.I.; D’Andrea, S.; Davis, I.S.; Mang’eni, R.O.; Pitsiladis, Y. Foot strike patterns and collision forces in habitually barefoot versus shod runners. Nature 2010, 463, 531–535. [Google Scholar] [CrossRef] [PubMed]
- Arnold, J.B.; Bishop, C.J.F.E. Quantifying foot kinematics inside athletic footwear: A review. Footwear Sci. 2013, 5, 55–62. [Google Scholar] [CrossRef]
- Wegener, C.; Greene, A.; Burns, J.; Hunt, A.E.; Vanwanseele, B.; Smith, R.M. In-shoe multi-segment foot kinematics of children during the propulsive phase of walking and running. Hum. Mov. Sci. 2015, 39, 200–211. [Google Scholar] [CrossRef] [PubMed]
- Wolf, S.; Simon, J.; Patikas, D.; Schuster, W.; Armbrust, P.; Döderlein, L. Foot motion in children shoes—A comparison of barefoot walking with shod walking in conventional and flexible shoes. Gait Posture 2008, 27, 51–59. [Google Scholar] [CrossRef]
- Sterzing, T.; Custoza, G.; Ding, R.; Cheung, T.M. Segmented midsole hardness in the midfoot to forefoot region of running shoes alters subjective perception and biomechanics during heel-toe running revealing potential to enhance footwear. Footwear Sci. 2015, 7, 63–79. [Google Scholar] [CrossRef]
- Bishop, C.; Arnold, J.B.; Fraysse, F.; Thewlis, D. A method to investigate the effect of shoe-hole size on surface marker movement when describing in-shoe joint kinematics using a multi-segment foot model. Gait Posture 2015, 41, 295–299. [Google Scholar] [CrossRef] [PubMed]
- Leardini, A.; Benedetti, M.G.; Berti, L.; Bettinelli, D.; Nativo, R.; Giannini, S. Rear-foot, mid-foot and fore-foot motion during the stance phase of gait. Gait Posture 2007, 25, 453–462. [Google Scholar] [CrossRef] [PubMed]
- Shultz, R.; Jenkyn, T. Determining the maximum diameter for holes in the shoe without compromising shoe integrity when using a multi-segment foot model. Med. Eng. Phys. 2012, 34, 118–122. [Google Scholar] [CrossRef]
- Sterzing, T.; Schweiger, V.; Ding, R.; Cheung, T.M.; Brauner, T. Influence of rearfoot and forefoot midsole hardness on biomechanical and perception variables during heel-toe running. Footwear Sci. 2013, 5, 71–79. [Google Scholar] [CrossRef]
- Liu, Z.-L.; Lam, W.-K.; Zhang, X.; Vanwanseele, B.; Liu, H. Influence of heel design on lower extremity biomechanics and comfort perception in overground running. J. Sport Sci. 2021, 39, 232–238. [Google Scholar] [CrossRef] [PubMed]
- Flores, N.; Rao, G.; Berton, E.; Delattre, N. The stiff plate location into the shoe influences the running biomechanics. Sports Biomech. 2021, 20, 815–830. [Google Scholar] [CrossRef] [PubMed]
- Delattre, N.; Lafortune, M.A.; Moretto, P. Dynamic similarity during human running: About Froude and Strouhal dimensionless numbers. J. Biomech. 2009, 42, 312–318. [Google Scholar] [CrossRef]
- Sloot, L.H.; Van der Krogt, M.M.; Harlaar, J. Energy exchange between subject and belt during treadmill walking. J. Biomech. 2014, 47, 1510–1513. [Google Scholar] [CrossRef] [PubMed]
- Leardini, A.; Stebbins, J.; Hillstrom, H.; Caravaggi, P.; Deschamps, K.; Arndt, A. ISB recommendations for skin-marker-based multi-segment foot kinematics. J. Biomech. 2021, 125, 110581. [Google Scholar] [CrossRef]
- Wu, G.; Siegler, S.; Allard, P.; Kirtley, C.; Leardini, A.; Rosenbaum, D.; Whittle, M.; D’Lima, D.D.; Cristofolini, L.; Witte, H.; et al. ISB recommendation on definitions of joint coordinate system of various joints for the reporting of human joint motion—Part I: Ankle, hip, and spine. J. Biomech. 2002, 35, 543–548. [Google Scholar] [CrossRef]
- Cohen, J. Statistical Power Analysis for the Behavioral Sciences, 2nd ed.; Lawrence Erlbaum Associates: Mahwah, NJ, USA, 1988. [Google Scholar]
- Altman, A.R.; Davis, I.S. A kinematic method for footstrike pattern detection in barefoot and shod runners. Gait Posture 2012, 35, 298–300. [Google Scholar] [CrossRef]
- Cheung, R.T.H.; Ng, G.Y. A systematic review of running shoes and lower leg biomechanics: A possible link with patellofemoral pain syndrome? Int. SportMed. J. 2007, 8, 107–116. [Google Scholar] [CrossRef]
- Kaufman, K.R.; Brodine, S.K.; Shaffer, R.; Johnson, C.W.; Cullison, T.R. The effect of foot structure and range of motion on musculoskeletal overuse injuries. Am. J. Sports Med. 1999, 27, 585. [Google Scholar] [CrossRef]
- Willems, T.M.; Witvrouw, E.; De Cock, A.; De Clercq, D. Gait-related risk factors for exercise-related lower-leg pain during shod running. Med. Sci. Sports Exerc. 2007, 39, 330–339. [Google Scholar] [CrossRef]


| Segment | Tracking Markers |
|---|---|
| Rearfoot | PC, LC, and MC |
| Midfoot | MB2, MB5, and NV |
| Forefoot | MH1, MH2, MH5, MB1, and MB5 |
| Shank | SK1-4 |
| Segment Interaction | Variable | Low Stiffness | Medium Stiffness | High Stiffness | p-Value | ηp2 |
|---|---|---|---|---|---|---|
| Rearfoot-lab | Dorsiflexion angle at initial contact (°) | 19.6 ± 4.1 [17.6, 21.6] | 20.5 ± 4.9 [18.1, 22.8] | 21.1 ± 4.8 [18.8, 23.4] | 0.050 | 0.154 |
| Peak plantar flexion angular velocity during the braking phase (°/s) | 577.4 ± 73.5 [542.0, 612.8] | 580.5 ± 81.5 [541.2, 619.8] | 617.4 ± 96.0 [571.1, 663.6] | 0.035 | 0.170 | |
| Rearfoot-shank | Peak eversion angle (°) | 9.1 ± 2.2 [8.0, 10.1] | 8.7 ± 2.2 [7.6, 9.8] | −8.5 ± 2.2 [7.5, 9.6] | 0.360 | 0.055 |
| Frontal plane range of motion (°) | 14.2 ± 3.1 [12.7, 15.6] | 14.0 ± 4.0 [12.0, 15.9] | 14.5 ± 3.9 [12.6, 16.4] | 0.389 | 0.051 | |
| Midfoot-rearfoot | Peak dorsiflexion angle (°) | 4.1 ± 2.4 [2.9, 5.2] | 4.5 ± 2.1 [3.5, 5.5] | 3.9 ± 2.8 [2.6, 5.3] | 0.630 | 0.025 |
| Frontal plane range of motion (°) | 5.3 ± 2.0 [4.3, 6.2] | 5.2 ± 1.9 [4.3, 6.0] | 5.1 ± 2.0 [4.2, 6.1] | 0.812 | 0.012 | |
| Peak plantar flexion angular velocity during the braking phase (°/s) | 188.5 ± 37.7 [170.3, 206.6] | 176.2 ± 64.4 [145.1, 207.2] | 182.1 ± 51.5 [157.2, 206.9] | 0.653 | 0.023 | |
| Peak plantar flexion angular velocity during the propulsion phase (°/s) | 151.7 ± 41.2 [131.8, 171.5] | 177.3 ± 62.7 [147.1, 207.5] | 172.1 ± 70.2 [138.2, 205.9] | 0.080 | 0.143 | |
| Forefoot-rearfoot | Peak dorsiflexion angle (°) | 7.7 ± 2.3 [6.6, 8.8] | 7.7 ± 1.6 [7.0, 8.5] | 7.0 ± 2.7 [5.7, 8.3] | 0.428 | 0.046 |
| Frontal plane range of motion (°) | 8.7 ± 2.1 [7.7, 9.7] | 8.4 ± 2.0 [7.4, 9.4] | 7.8 ± 2.0 [6.8, 8.8] | 0.005 a | 0.258 | |
| Peak plantar flexion angular velocity during the braking phase (°/s) | 109.8 ± 40.3 [90.4, 129.3] | 106.2 ± 46.2 [83.9, 128.5] | 100.8 ± 47.5 [77.9, 123.7] | 0.680 | 0.021 | |
| Peak plantar flexion angular velocity during the propulsion phase (°/s) | 244.9 ± 55.7 [218.0, 271.7] | 266.1 ± 77.6 [228.7, 303.6] | 265.5 ± 63.3 [235.0, 296.0] | 0.066 | 0.140 | |
| Forefoot-midfoot | Peak dorsiflexion angle (°) | 4.4 ± 1.7 [3.5, 5.2] | 3.9 ± 1.4 [3.3, 4.6] | 4.3 ± 1.3 [3.6, 4.9] | 0.135 | 0.105 |
| Frontal plane range of motion (°) | 4.7 ± 1.3 [4.1, 5.4] | 4.6 ± 0.9 [4.2, 5.0] | 4.2 ± 1.1 [3.7, 4.8] | 0.020 b | 0.196 | |
| Peak dorsiflexion angular velocity during the braking phase (°/s) | 102.0 ± 33.5 [85.9, 118.2] | 95.2 ± 32.0 [79.8, 110.6] | 102.5 ± 34.0 [86.1, 118.9] | 0.512 | 0.036 | |
| Peak plantar flexion angular velocity during the propulsion phase (°/s) | 154.4 ± 46.0 [132.2, 176.6] | 144.8 ± 35.8 [127.6, 162.0] | 136.5 ± 32.7 [120.7, 152.2] | 0.043 | 0.182 |
| Variable | Low Stiffness | Medium Stiffness | High Stiffness | p-Value | ηp2 |
|---|---|---|---|---|---|
| Ground contact time (ms) | 232.8 ± 17.3 [224.5, 241.1] | 233.4 ± 15.9 [225.8, 241.1] | 233.4 ± 16.2 [225.6, 241.2] | 0.870 | 0.008 |
| Peak vertical force 1 (BW) | 1.74 ± 0.27 [1.61, 1.87] | 1.75 ± 0.30 [1.61, 1.90] | 1.75 ± 0.31 [1.60, 1.90] | 0.858 | 0.008 |
| Maximum vertical loading rate 1 (BW/s) | 105.9 ± 25.2 [93.8, 118.1] | 109.9 ± 29.5 [95.7, 124.1] | 107.8 ± 27.61 [94.5, 121.1] | 0.941 | 0.003 |
| Peak vertical force 2 (BW) | 2.67 ± 0.22 [2.56, 2.77] | 2.67 ± 0.21 [2.60, 2.77] | 2.67 ± 0.22 [2.57, 2.78] | 0.336 | 0.059 |
| Maximum vertical loading rate 2 (BW/s) | 39.58 ± 6.69 [36.36, 42.81] | 39.00 ± 5.84 [36.19, 41.82] | 39.37 ± 6.96 [36.01, 42.72] | 0.743 | 0.016 |
| Peak braking force (BW) | 0.34 ± 0.01 [0.33, 0.36] | 0.34 ± 0.01 [0.33, 0.36] | 0.35 ± 0.01 [0.33, 0.36] | 0.886 | 0.008 |
| Peak propulsion force (BW) | 0.35 ± 0.01 [0.32, 0.38] | 0.35 ± 0.01 [0.32, 0.37] | 0.34 ± 0.01 [0.31, 0.37] | 0.340 | 0.058 |
| Braking impulse (Ns/BW) | 0.016 ± 0.003 [0.018, 0.014] | 0.016 ± 0.003 [0.018, 0.015] | 0.016 ± 0.004 [0.018, 0.014] | 0.574 | 0.030 |
| Propulsion impulse (Ns/BW) | 0.023 ± 0.003 [0.021, 0.024] | 0.023 ± 0.003 [0.021, 0.024] | 0.023 ± 0.003 [0.021, 0.024] | 0.886 | 0.007 |
Publisher’s Note: MDPI stays neutral with regard to jurisdictional claims in published maps and institutional affiliations. |
© 2022 by the authors. Licensee MDPI, Basel, Switzerland. This article is an open access article distributed under the terms and conditions of the Creative Commons Attribution (CC BY) license (https://creativecommons.org/licenses/by/4.0/).
Share and Cite
Ma, R.; Lam, W.-K.; Ding, R.; Yang, F.; Qu, F. Effects of Shoe Midfoot Bending Stiffness on Multi-Segment Foot Kinematics and Ground Reaction Force during Heel-Toe Running. Bioengineering 2022, 9, 520. https://doi.org/10.3390/bioengineering9100520
Ma R, Lam W-K, Ding R, Yang F, Qu F. Effects of Shoe Midfoot Bending Stiffness on Multi-Segment Foot Kinematics and Ground Reaction Force during Heel-Toe Running. Bioengineering. 2022; 9(10):520. https://doi.org/10.3390/bioengineering9100520
Chicago/Turabian StyleMa, Ruiya, Wing-Kai Lam, Rui Ding, Fan Yang, and Feng Qu. 2022. "Effects of Shoe Midfoot Bending Stiffness on Multi-Segment Foot Kinematics and Ground Reaction Force during Heel-Toe Running" Bioengineering 9, no. 10: 520. https://doi.org/10.3390/bioengineering9100520
APA StyleMa, R., Lam, W.-K., Ding, R., Yang, F., & Qu, F. (2022). Effects of Shoe Midfoot Bending Stiffness on Multi-Segment Foot Kinematics and Ground Reaction Force during Heel-Toe Running. Bioengineering, 9(10), 520. https://doi.org/10.3390/bioengineering9100520