1. Introduction
Degenerative aortic valve stenosis (AS) is the most common valvular heart disease in the developed world. If left untreated the disease has a devastating course, rapidly causing death when symptoms develop. AS is caused by calcification of the aortic valve (AV). This could also lead to aortic valve regurgitation (AR) which also causes heart failure. The treatment for severe aortic valve disease consisted until recently of surgical aortic valve replacement (SAVR). However, in recent years transcatheter aortic valve implantation (TAVI, diagram in
Figure 1) has been developed and approved for use in severe- to intermediate-risk AV disease. Recently, two randomized controlled trials have been published where use in low-risk TAVI patients was non-inferior compared to SAVR. Despite the increasing development of this technique, there still is a risk bound to it. The broad use of TAVI in the last few years has shown a high chance of successful outcomes. However, the frailest patients sometimes do not benefit and can have complications after the procedure. The cause for this partial success is still not known.
Hence, careful patient selection is paramount. Identifying those patients who have improvements or those who are at a higher risk after TAVI is essential to maximize their survival, by providing an alternative treatment or therapy. Moreover, this would lead to an improvement in the use of the limited resources, which reduces the waiting lists. However, the identification of the patients that can have improvements from the TAVI procedure is a complex and still unsolved task because it is difficult to objectively quantify the improvements of a patient in a daily routine. Furthermore, the patients that are at a higher risk are often frail patients with several comorbidities and with an important medical history. Unfortunately, they can have severe complications, leading in the worst case to mortality, which further increases the motivation to find out why the identification was incorrect [
1]. EuroSCORE II [
2] and STS [
3] risk scores are currently used for patient selection, assessing mortality risk at 30 days, but they were not developed for TAVI. Current risk scores or predictors specifically designed for assessing one-year mortality for TAVI are TAVI
2-SCORe [
4] and Arnold SV et al. [
5]. Other predictors are also available but are specifically designed to predict 30 days mortality such as Iung et al. [
6], Capodanno et al. [
7], and Martin et al. [
8]. Although several options are available, in current clinical practice EuroSCORE II and STS are still preferred because they are more extensively accepted as risk scores by the cardiologist worldwide and they consequently largely benefited from extensive validations.
With this paper, we aim to develop with a supervised machine learning approach, a very specific model to predict one-year mortality for the TAVI use-case. In fact, mortality at one year has been identified by the medical experts as the life expectancy threshold, above which the TAVI procedure is enabled and worth being performed. We aim to validate its performance on a dataset of 270 patients that have undergone TAVI in 2015 and 2016. All these patients were already selected by the heart team of clinicians, therefore, the decision whether to undertake TAVI or not was already made. The aim of this research is to develop a model that will have to be intended as a supporting tool available for consultation to provide further insights, whether required, to the current patient selection workflow. The heart team will always retain the role and responsibility for the final decision, thus assessing whether, or not, a patient will be an optimal candidate for TAVI.
We obtained promising prediction results and our work has the following contributions. Firstly, to the best of our knowledge, this is the first successful application of gradient boosting on decision trees for one-year mortality risk prediction of TAVI. Secondly, by applying a state-of-the-art model explanation technique, we have created useful feature insight that allows the medical doctors and us to interpret the model and perform an optimal feature selection. Thirdly, we have validated our model on a retrospective clinical dataset and we have compared our prediction results with other studies in literature and existing patient outcome predictors currently used in cardiac surgery.
2. Materials and Methods
2.1. Dataset
The anonymized dataset obtained from the Catharina Hospital consisted of 270 consecutive TAVI procedures that were performed between January 2015 and December 2016 using the following different brands and models of artificial aortic valves:
SAPIEN XT (9 patients) and SAPIEN 3 (127 patients), Edwards LifeSciences (Irvine, CA, USA);
CoreValve (10 patients) and CoreValve Evolut (124 patients), Medtronic (Minneapolis, MN, USA).
For most of the patients, the procedures were performed through standard transfemoral access and only 7.4% of them required an alternative access site, namely the subclavian artery (five patients), the transapical (seven patients), and the direct transaortic (eight patients).
The average age of the patients, when the TAVI procedure was performed, was 80.7 years, with a minimum age of 50.3 years and a maximum age of 94 years (standard deviation of 6.2 years). In our population, 48% of the patients were female.
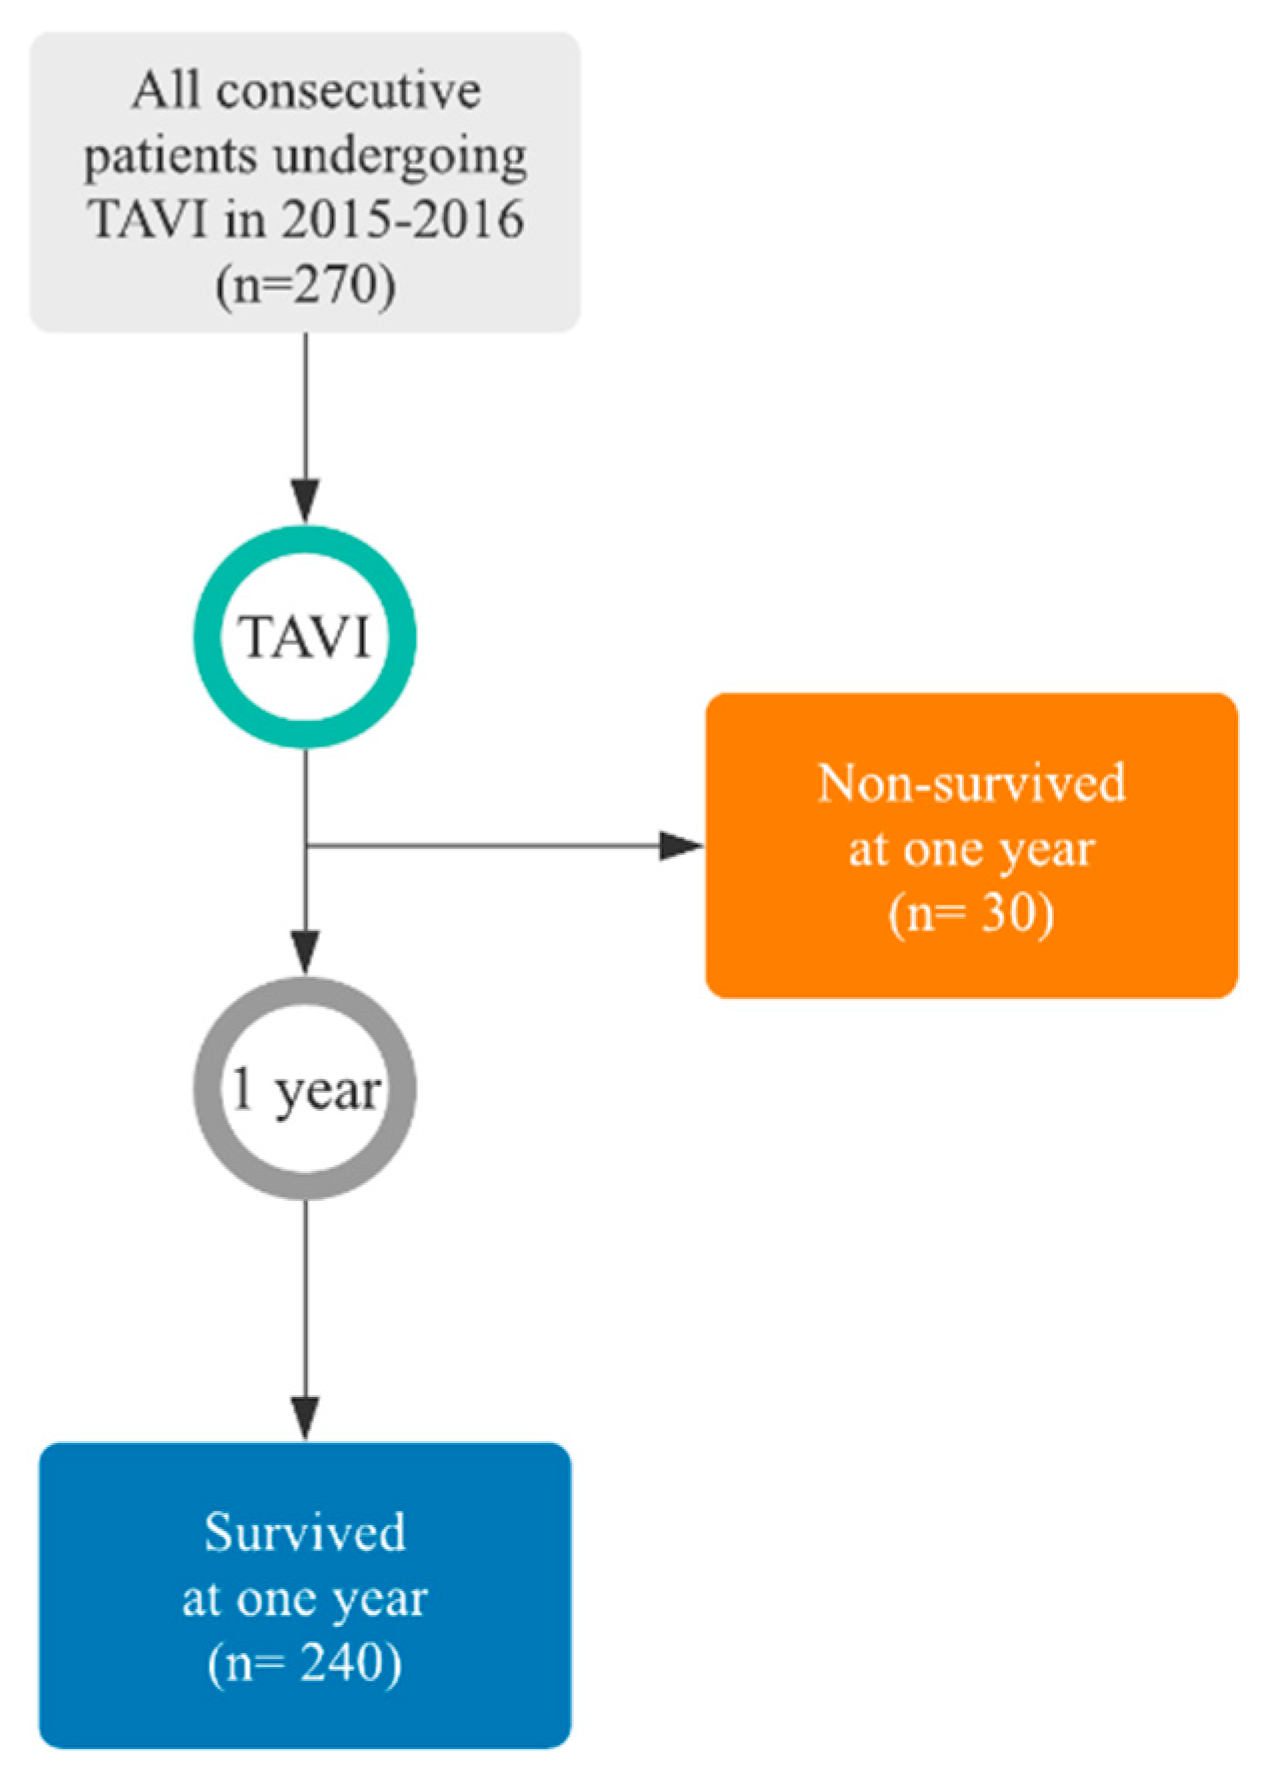
The retrospective data were divided into two categories and one classification label was assigned to each category to create two different groups of patients according to their survival to one year from the date of TAVI, as shown in
Figure 2. Therefore, we obtained the following two classes and groups:
Survived within the first year (240 patients);
Non-survived within the first year (30 patients, 50% of which did not survive within the first two months or did not survive to the procedure (five patients)).
The mortality information was collected in 2019 from the census of the national population of the Netherlands. The dataset consisted of numerous numerical and categorical information data, which could be divided, as shown in
Table 1, in five principal categories: medical history, clinical data, patient questionnaires, risk scores, and medications. All clinical data were collected in the days and weeks prior to the TAVI procedure.
The retrospective study was approved by the local ethics committee and all enrolled patients signed informed consent. The reporting of this paper adheres to the “transparent reporting of a multivariable prediction model for individual prognosis or diagnosis” (TRIPOD) guidelines [
6]. TRIPOD statement can be found in the
supplementary materials.
2.2. Initial Processing of the Dataset
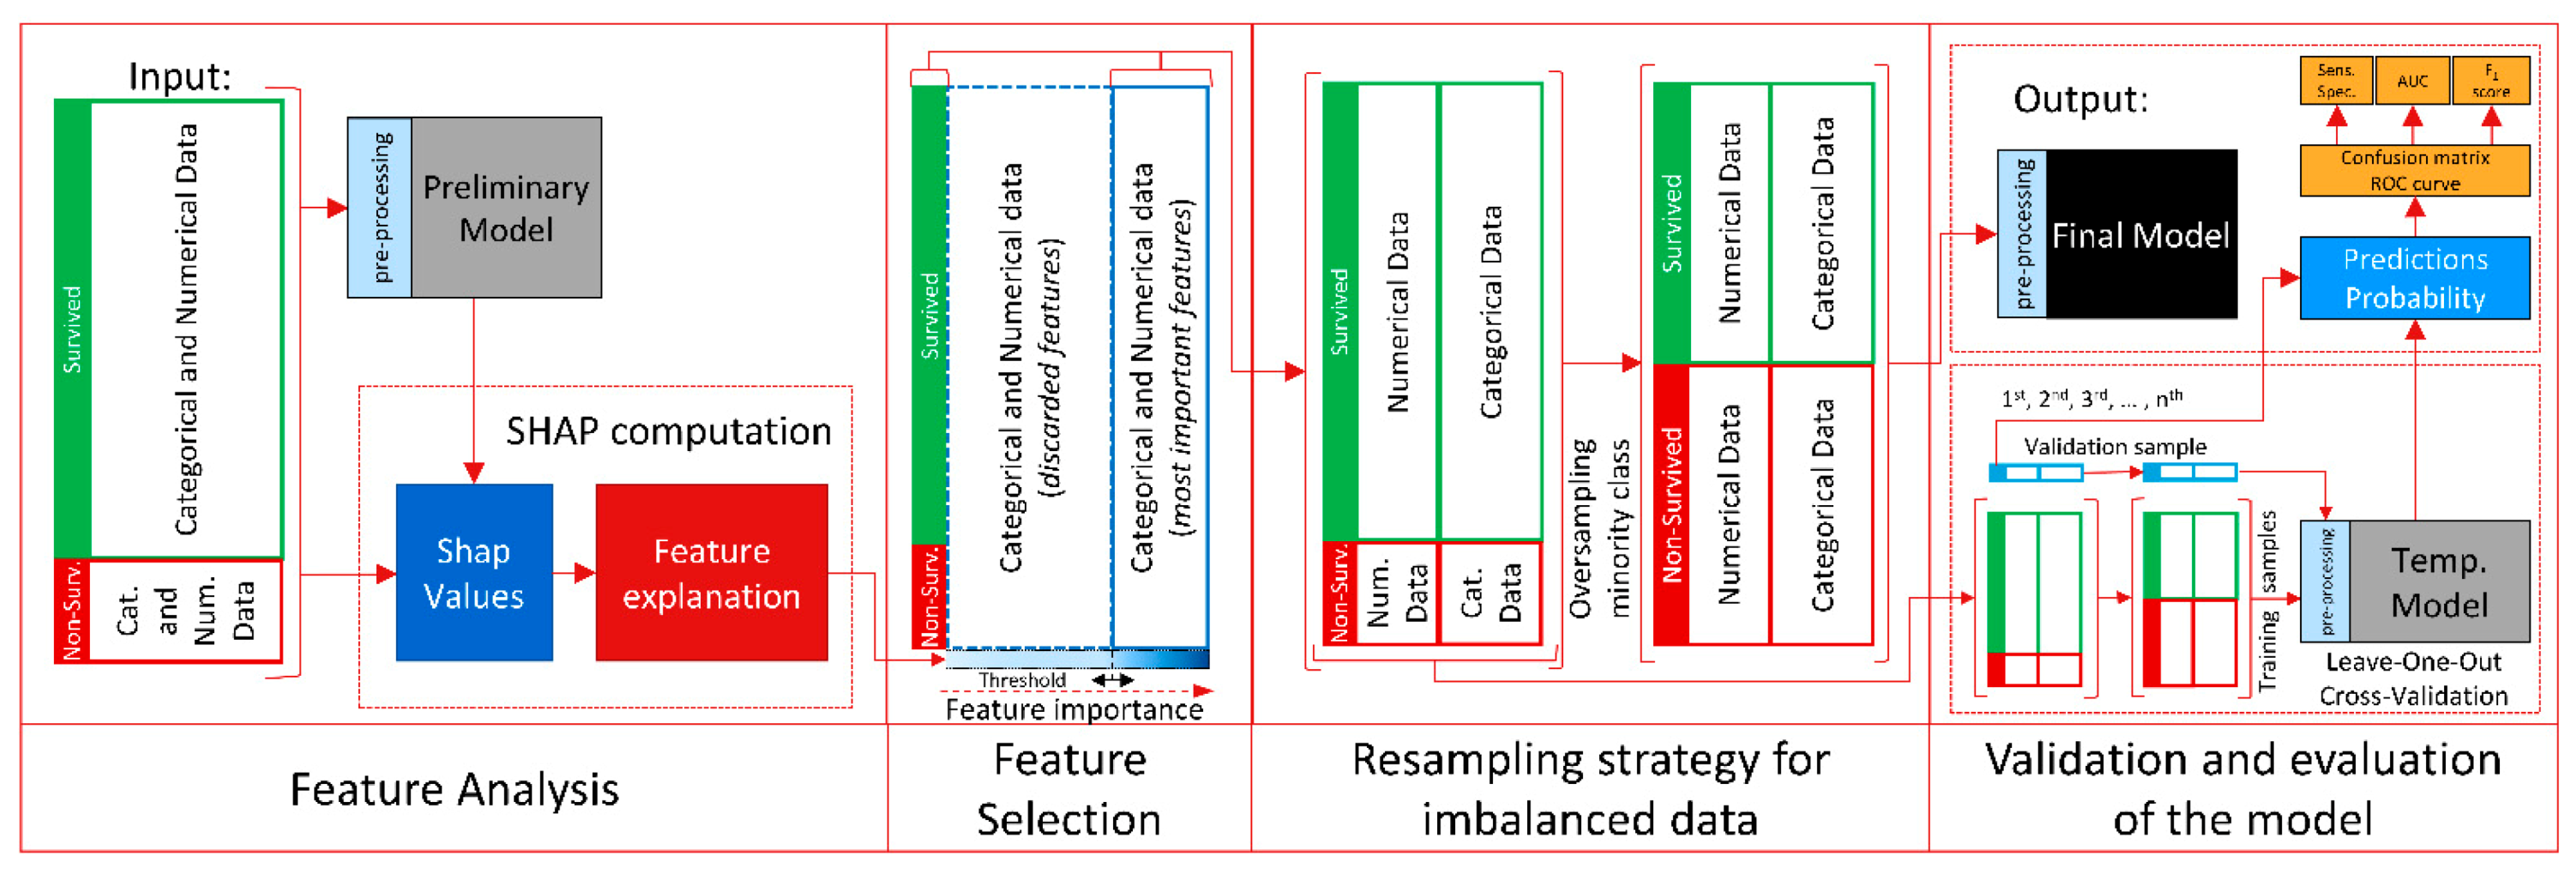
The overall processing steps of our data are depicted in
Figure 3. The initial processing described here is preceding the diagram and is based on discriminating between numerical and categorical features. Once each feature is defined, we analyze each individual feature in detail, by considering the mean, range, and standard deviation of the numerical features, and the recurrence and instances of the categorical features.
We have reorganized some initially given features and some have been introduced, resulting from combining original features. For example, we mention the body mass index (BMI) computed from the height and the weight. An alternative feature processing has been applied for multiple answer questionnaires by using one-hot encoding. An additional approach has been reserved for the list of prescribed medicines. After analysis with the medical experts, we added and divided them into 28 pharmacological macro-categories (angiotensin-converting-enzyme inhibitors, alfa blocker, angiotensin II receptor antagonist, antiarrhythmic, antibiotics, anticoagulant, antidepressants, antiepileptic, anti-inflammatory, antiplatelet, benzodiazepines, beta-blocker, beta-2 sympathomimetics, calcium channel blockers, corticosteroids, diabetic medications, diuretics, hormones, inhalers, insulin, laxatives, nitrates, proton-pump inhibitors, renin inhibitors, statins, supplements, thyroid-stimulating hormone, others), according to their class of medication therapy and to their mechanism of functioning. Concerning the dates included in the original dataset, that were describing when certain events occurred prior to TAVI, it was decided to define them relative to the TAVI procedure date. Finally, we computed the intermediate and final scores (emotional well-being, energy/fatigue, general health, pain, physical functioning, role limitations due to emotional problems, role limitations due to physical health, social functioning) for the RAND-36 questionnaire [
7] according to the clinical guidelines.
2.3. Gradient Boosting on Decision Tree Classifier
Gradient boosting on decision trees (GBDTs) is a supervised machine learning technique, which currently represents one of the state-of-the-art techniques for models based on decision trees. On the other hand, well-established neural network techniques have emerged in several fields including the one for cardiovascular outcome predictions, often providing promising results, with respect to other more classical machine learning techniques, when large datasets are involved [
8,
9,
10]. Generally, decision trees are less data demanding and GBDTs techniques are typically optimal for small datasets, whereas neural networks usually perform better on large datasets [
11]. In other words, decision trees can allow the model to reach optimal convergence without requiring those large datasets which are necessary for neural networks. Furthermore, decision trees offer better interpretability potential and, with respect to neural networks, they are better capable to handle categorical features (which are not differentiable by definition) in their decisional node splitting, while still accounting, as neural networks, for non-linear relationships. What has been mentioned goes in support of our choice to prefer, as classifiers for this study, decision trees over neural networks.
Recently, a new categorical feature-specific classifier called CatBoost has been designed that outperforms several gradient boosting on decision trees (GBDTs) classifiers [
12,
13] such as XGBoost [
14] which does not have a dedicated pre-processing for categorical features and LightGBM [
15] which is not advisable on small-scale data.
The CatBoost classifier was used, since in clinical practice and consequently in this dataset, categorical features are common. Therefore, we can more easily exploit all the information provided in the dataset, leaving this innovative approach for pre-processing of the categorical and numerical features to the preliminary stage of CatBoost (see
Figure 3), at each input stage of each model. In fact, at the preliminary stage, CatBoost converts all the categorical features into numerical data by incorporating the recurrence of each instance, missing values are considered as an instance of the feature. Numerical features are then processed by aggregating different feature values in a histogram, which is specifically optimized for an efficient and fast memory access and elaboration. Missing values are processed as the minimum value of that feature to guarantee the split in the decision tree and to separate them more effectively from other numerical features.
The second stage of CatBoost involves an algorithm that builds an ensemble model with an iterative approach. At the 1st iteration, the algorithm learns from the dataset the first decision tree, to reduce the training error. At the 2nd iteration, the algorithm learns from the dataset one more decision tree, to reduce the error made by the decision tree obtained at the 1st iteration and the algorithm repeats this procedure for all succeeding iterations until the iteration count is exceeded. This count is chosen to maximize the training of the model without overfitting the data and, therefore, reducing the generalization capabilities of the model.
2.4. Feature Analysis and Selection
The feature analysis stage is achieved by exploiting a new method that, with a local-level approach and its foundations in game theory, is able to provide interpretations and explanations of machine learning models, as shown in the first stage of
Figure 3.
We exploited the SHapley Additive exPlanations unified approach [
16,
17], using Shapley values, which is a technique recently published and applied to compute the importance of each feature of a model. Once extracted, using all the importance values for each feature, we compute the following average:
where
is the importance value of the feature
m for a patient
j on the total amount of
n patients. We obtain then the estimate of the most important features in the decision making of the model. Consequently, we reorder them from the most relevant downwards by reordering the feature vector list.
The most important features were then discussed with the medical experts to find possible patterns and clinical explanations related to patient mortality. The validated relevant features which were confirmed by the clinical experts and that were found more discriminative in the decision process were used to train the final model.
2.5. Classifier Training and Resampling Strategy
At the feature analysis stage, we trained the classifier on a deep decision tree by including the entire dataset. We then analyzed the model to evaluate the importance of each feature. The temporary and the final model were trained only with the most informative features by imposing a threshold, to discard all non-relevant features. We conducted also a visual inspection of the SHapley Additive exPlanations summary plot, which proved to be useful when discussing the results with the medical experts.
The training parameters of the final model were chosen after performing hyperparameter research, further details are shown in
Table 2. Different combinations of possible parameters have been iterated as well as different levels of feature thresholds, ranging from the most important two to the most important 40.
We then identified which were more suitable for maximizing the F1 score and AUC metric, by performing k-fold cross-validation multiple times with different randomizations per iteration. The temporary models used for validation utilize the same parameters as the final one.
The intrinsic imbalanced nature of the medical datasets, as known in the literature [
18], led us to apply a random over-sampling strategy to the minority class (non-survived patients) until a balanced ratio with the majority class (survived patients) was reached.
2.6. Validation and Evaluation
Validation of the model was been performed with five-times leave-one-out cross-validation (LOOCV), with a dedicated pipeline for each iteration. In fact, the previously discussed random over-sampling of the minority class is applied at each iteration, but only after each test sample is removed, to reduce any possible uncertainty in the results that could be caused by the randomization of the minority class samples. LOOCV was chosen because the minority class population was limited to only 30 patients and consequently a sufficient amount of information would not have been available to train the model if a more sophisticated validation approach would have been implemented (i.e., training, test, and validation set split). Current state-of-the-art prognostic risk scores in cardiac surgery use the area under the curve (AUC) of the receiver operating characteristic curve (ROC or C-statistic) as the benchmark metric. However, this metric is not always the best choice, especially in the case of validation performed on a dataset with imbalanced classes. Therefore, we adopted other metrics such as sensitivity, specificity, accuracy, precision (or positive predictive value), and F1 score. As suggested in the literature, calibrated risk models are of vital importance for valid decision support [
19,
20]. Therefore, we reported also a calibration study for each of the classifiers that have been implemented. Due to the small size of the dataset, we did not train any regression model to calibrate the classifiers.
3. Results
3.1. Selected Features
According to the results obtained with the SHapley Additive exPlanations and the related discussion of these results with the cardiologists, we identified the most relevant features for the prediction of one-year mortality for TAVI.
The selected features are presented in alphabetical order and in order of importance, according to the SHapley Additive exPlanations, in
Table 3 and in
Figure 4, respectively.
Other relevant features that have been discarded to maximize the results at the risk of a reduced generalization capability on another population are risk scores related to bleeding with antiplatelet and nonsteroidal anti-inflammatory drugs (NSAIDs), New York heart association functional classification (NYHA class), QTC interval, gender, glomerular filtration rate (GFR), recent coronary artery bypass grafting (CABG) interventions, previous myocardial infarction and further classes of medicines e.g., angiotensin-converting-enzyme (ACE) inhibitors, angiotensin II receptor blockers (ARBs), and proton pump inhibitors (PPIs).
We emphasize here that several factors are influencing the feature selection and the classifier training. Particularly, the order of the most important features can be highly influenced by the missing values. In fact, a certain feature can ascend or descend the list of the most important features proportionally to the amount of its missing values. It must be said that missing values contain information as well because they are a natural consequence of the clinical workflow, of the internal protocols adopted by each hospital, and of the varying urgencies that characterize each patient journey. However, by including all the features shown in
Table 3 in the final model, we ensured an optimal overview of the patient, acquired with a multi-disciplinary approach, which has shown promising generalization capability on this dataset.
3.2. Evaluation of the Model
In Table 6, the performance of the mortality predictor achieved in this work is compared to the ones achieved in other studies available in the literature. As previously mentioned, EuroSCORE II and STS, which are extensively accepted as risk scores by the cardiologist worldwide, reached in a TAVI study AUCs of 0.81 and 0.77, respectively. However, only 59 symptomatic patients with severe aortic stenosis were selected for this 30-day mortality study [
21]. Two prognostic risk scores for one-year mortality prediction for the TAVI procedure are the TAVI2-SCORe [
4] which when validated on 511 patients, showed an AUC of 0.72, and the Arnold SV et al. [
5] which when validated on 1830 patients, achieved an AUC of 0.66. Other 30-day mortality predictors for TAVI which are worth mentioning for comparison as they have been validated on a large population, are the ones presented in the works of Iung et al. [
22], Capodanno et al. [
23], and Martin et al. [
24]. On population sizes of 3833, 1878, and 6339, they reached AUCs of 0.59, 0.71, and 0.66, respectively.
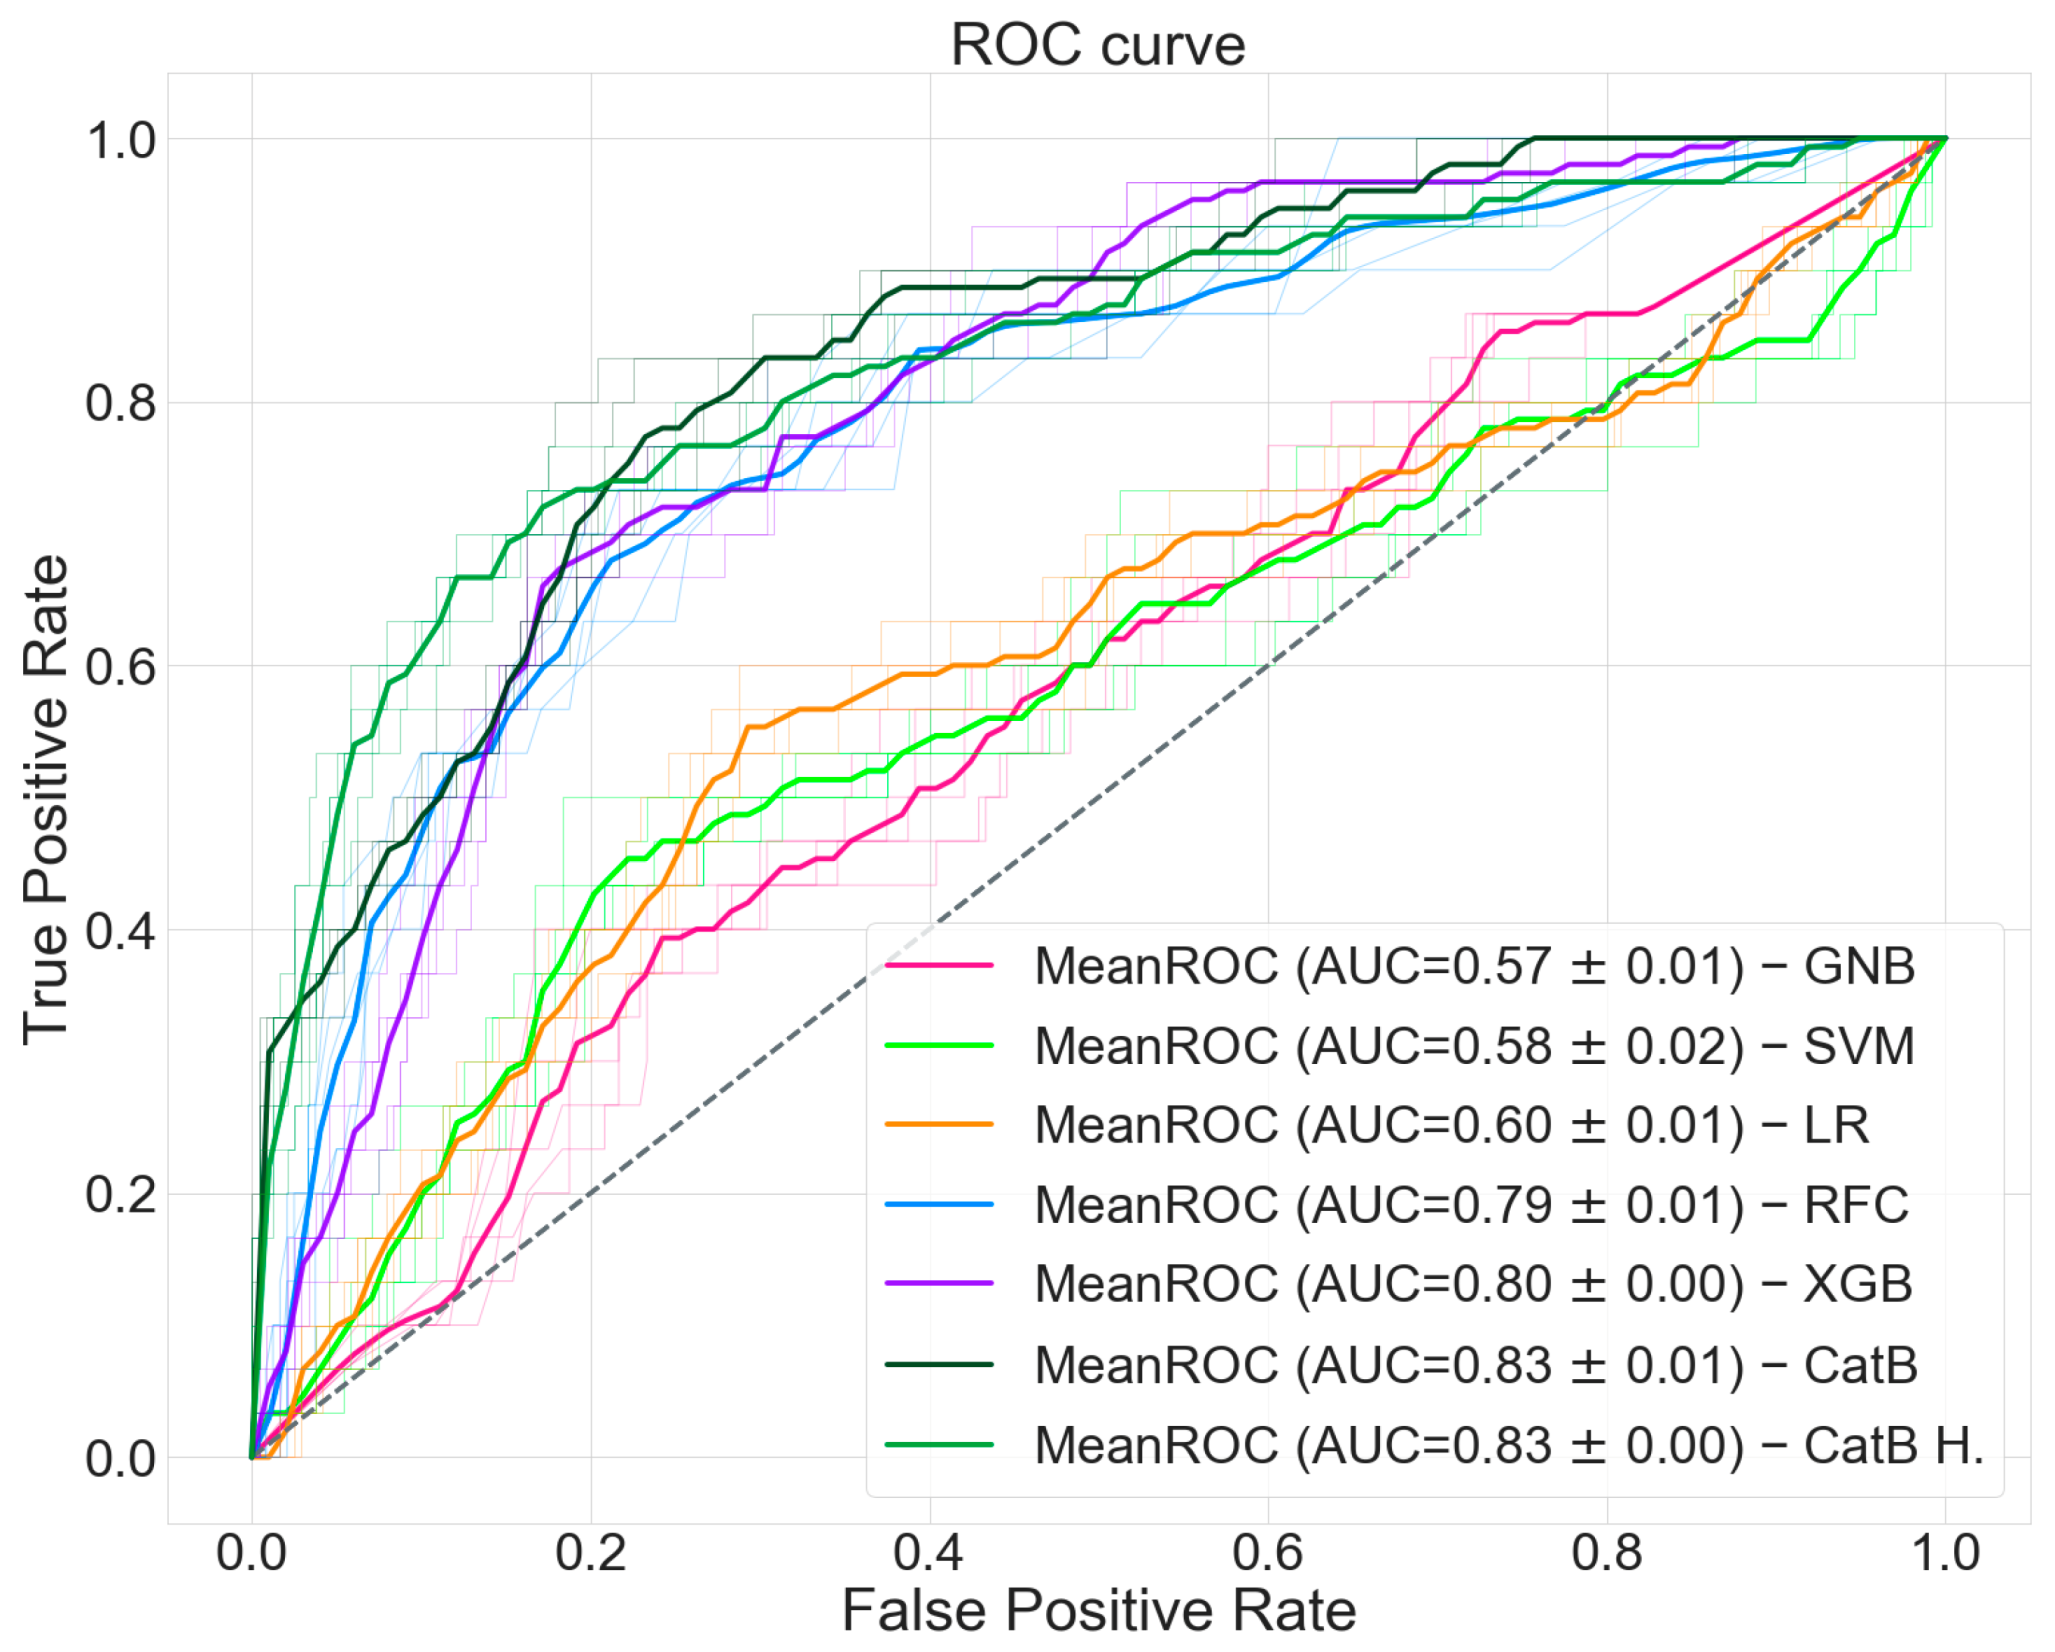
We computed the ROC curve shown in
Figure 5 with an AUC of 0.83. We reached an accuracy of 0.90 with a specificity of 0.97 and a sensitivity of 0.37. Finally, we computed an F
1 score of 0.45. All the evaluation metrics and classification predictions acquired during the validation of our prediction model are shown in
Table 4 as value ± standard deviation and
Table 5 as computed patient amounts. As a comparison, we re-performed the entire validation pipeline with other well-known machine learning classifiers. For this purpose, numerical values were scaled in the range ±1, replacing missing values with zero and one-hot encoding was applied for categorical features, considering missing values as an instance apart. Numerical missing values have been replaced also with the mean, weighted mean, median, weighted median, and minimum value of the numerical feature, leading to slightly worse results.
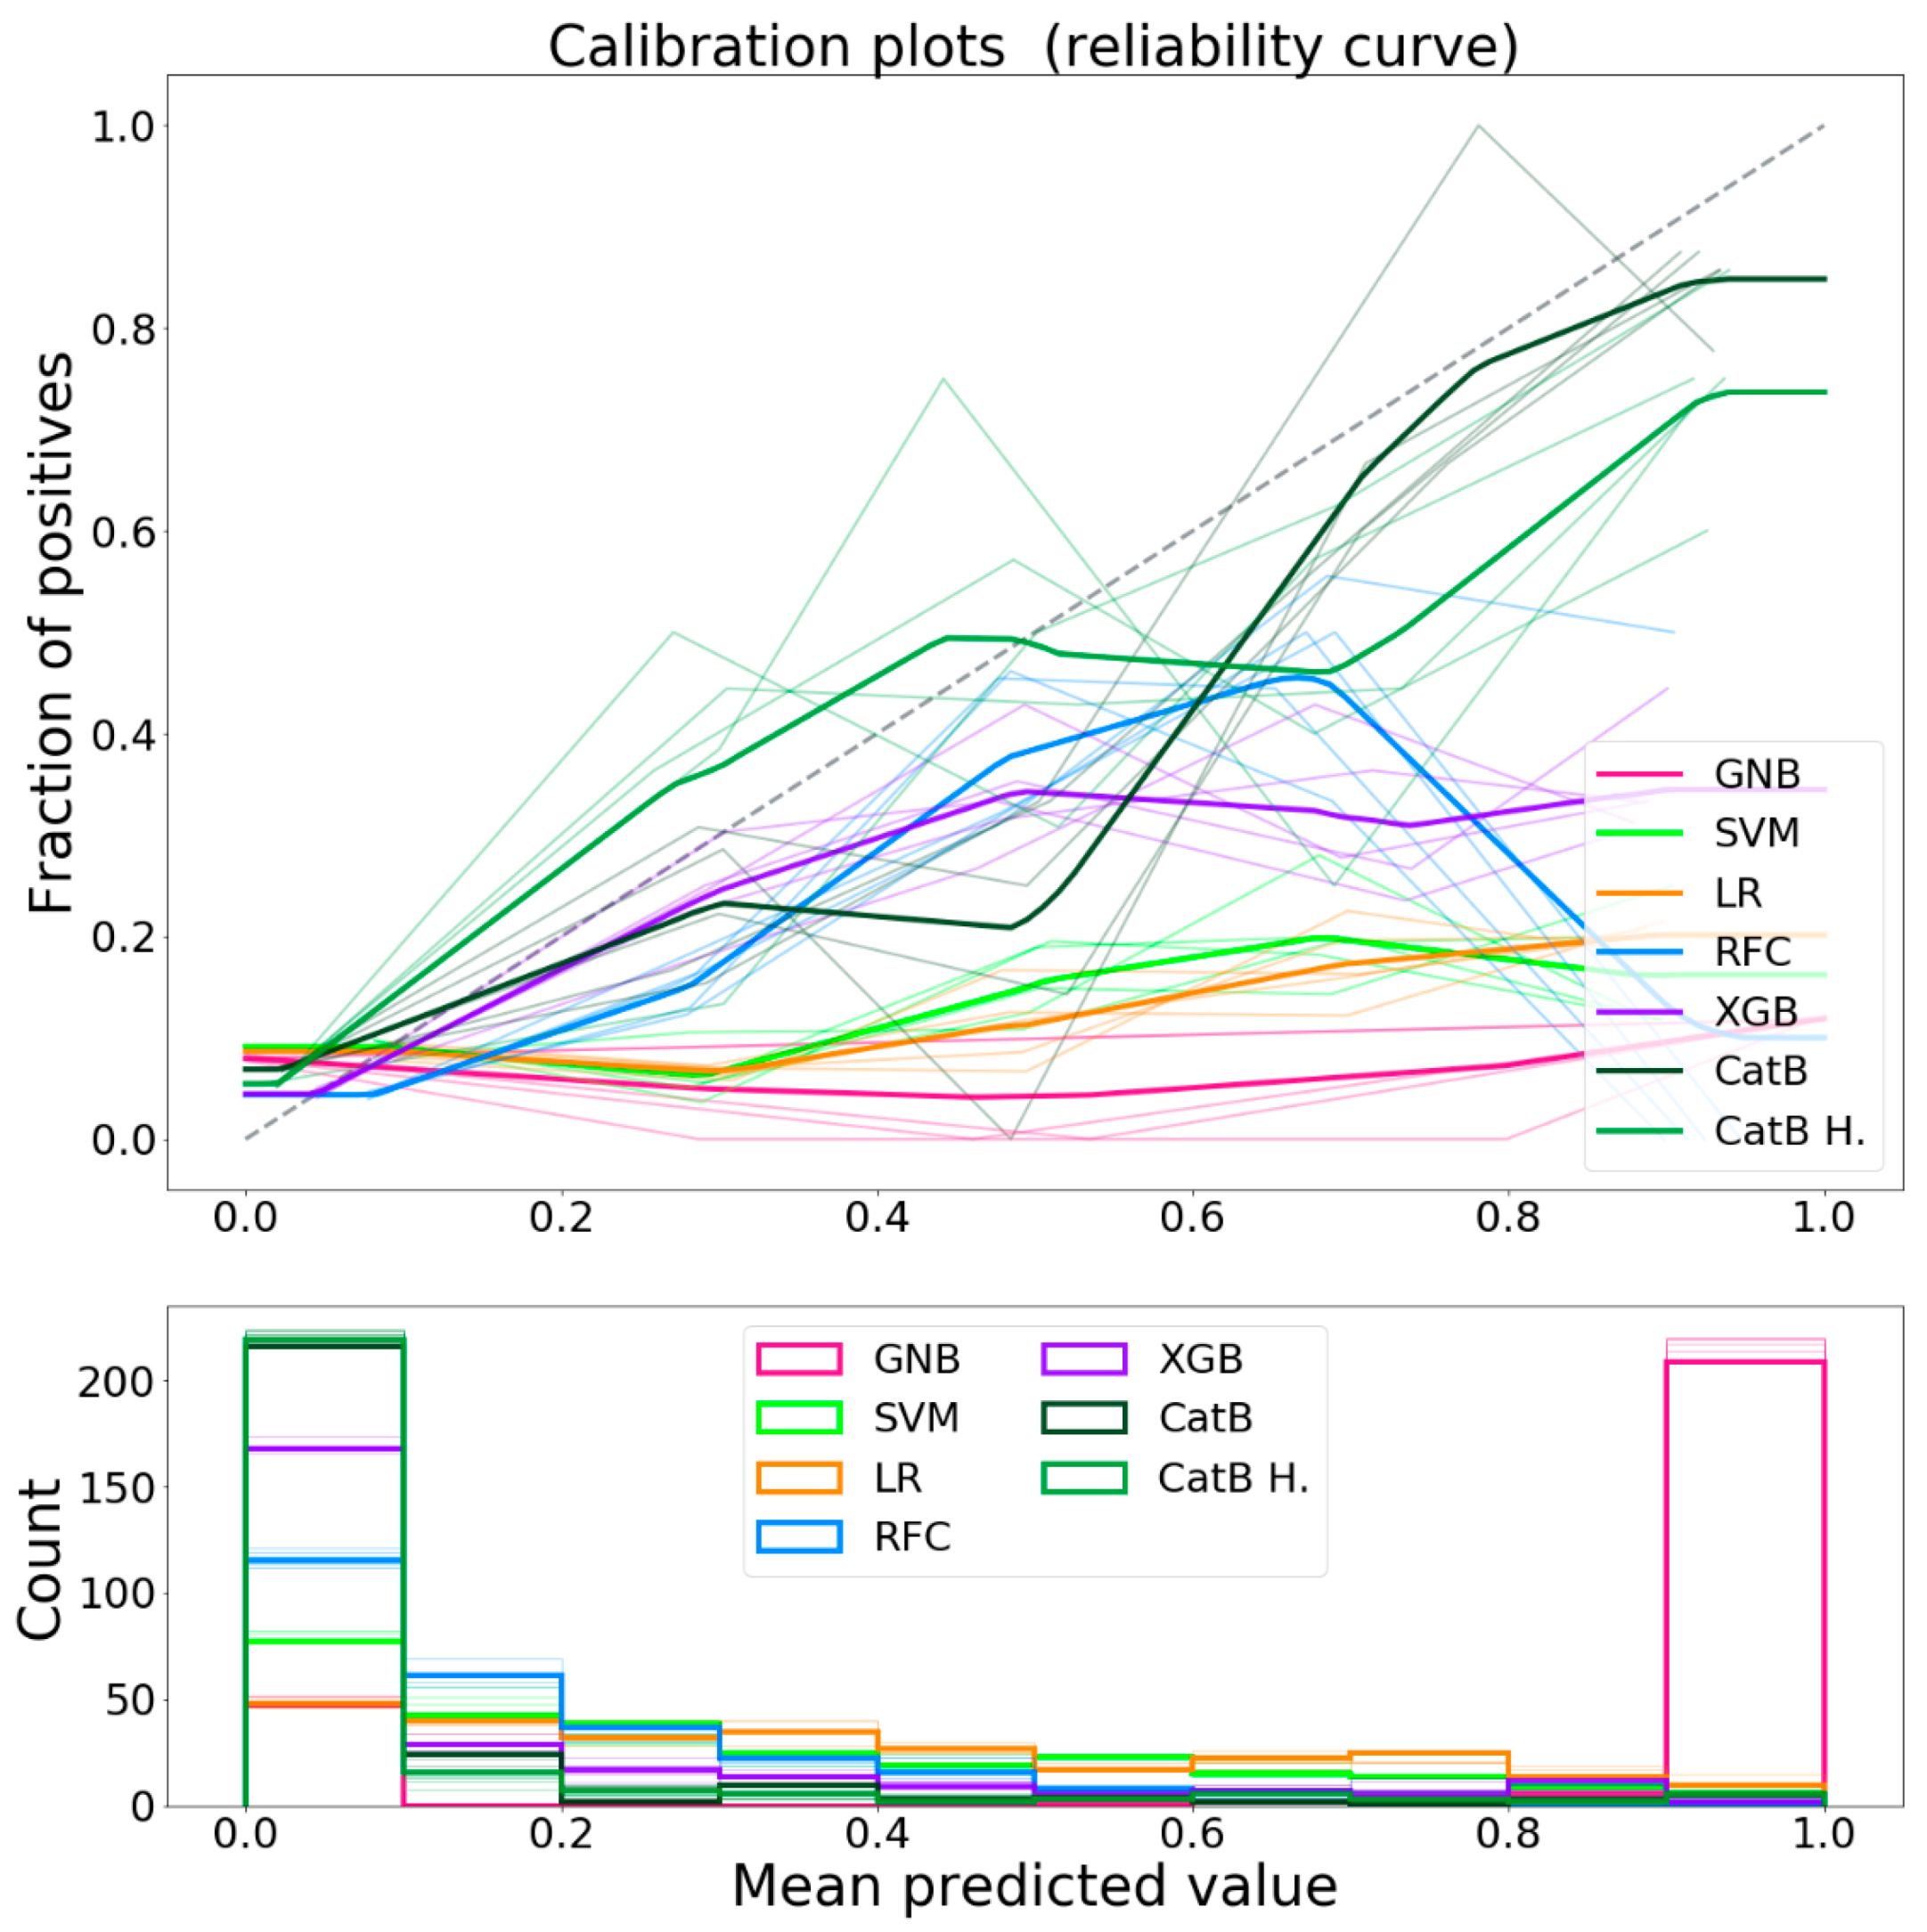
The calibration curves for each classifier are shown in
Figure 6. As previously mentioned, the classifiers calibration was not been performed because the data available was not sufficient to generate a regression model to calibrate the output. Despite the uncalibrated predictions, CatBoost was shown to have, with respect to the other classifiers, a calibration curve that approaches the ideal one.
As shown in
Table 5, our prediction model was able to identify from 10.0 to 11.0 patients (true positive) that would not benefit from TAVI. An amount that grows from 5.8 to 8.2 patients being misclassified (false positive) suggesting these patients would not benefit from TAVI, although being good candidates. Despite the small number of false positives, a positive predictive value (precision) ranging from 57% to 64% is achieved, suggesting that improvements of the patient selection with respect to the current clinical workflow is possible. In this regard, the other classifiers have shown not comparable prediction capabilities.
As shown in
Table 6, the prediction model presented in this study has shown promising potential to evaluate the risk score for TAVI patients, with respect also to current state-of-the-art or other studies predictors. It should be noted that one-year mortality is generally more challenging than 30-day mortality or in-hospital mortality.
4. Discussion
To clarify and discuss the findings of SHapley Additive exPlanations, clinical experts were consulted to better understand why certain features were considered important for the prediction and for an improved understanding of the possible interaction between all the different variables. With the goal of finding an answer to why certain features were considered more important than others in the decision making of the model, we infer the following conclusions.
Severe AV regurgitation is linked to heart failure and mortality, which is found also in our analysis. Paravalvular regurgitation after TAVI is a common complication. Paravalvular regurgitation is most common in patients with severe calcification of the native aortic valve leaflets. When a TAVI valve is deployed, it may not be able to fully operate properly, resulting in leakage. The severity of the regurgitation is correlated to a worse prognosis since patients will develop heart failure and require in-hospital treatment.
A low AV peak gradient can be related to less severe aortic stenosis or to a dysfunctional left ventricle. High values indicate severe/critical aortic stenosis, that if left untreated, can lead to mortality for sudden cardiac death or heart failure. In severe aortic valve stenosis, the valve is narrowed resulting in a higher resistance over the aortic valve. The left ventricle needs to develop a higher pressure to open the valve. Severe symptomatic aortic valve stenosis is a devastating disease if left untreated and has a high mortality rate.
Atrioventricular block is linked to higher syncope and mortality and needs to be treated with a pacemaker giving complications, which reduces survival. Atrioventricular block is a common complication after TAVI. This complication is related to valve size and calcifications of the native aortic valve. The atrioventricular node is positioned in the septum of the ventricle and when a TAVI valve is deployed, the stent frame or calcifications of the native valve can impose pressure on the node causing damage, which in turn results in several degrees of atrioventricular block. If left untreated, this can cause syncope or even heart failure. Monitoring the first days after TAVI for the development of atrioventricular blocks is required, as the function may sometimes return. If not, a pacemaker is implanted to bypass the node.
Beta-blocker class of medication is used to manage heart rhythms (atrial fibrillation or ventricular arrhythmia) and in the case of heart failure. Both cases have an impact on survival. Atrial fibrillation is often seen in patients with aortic valve stenosis. To treat this rhythm problem, beta-blockers are often the first choice for rate control.
Extreme values of body mass index (BMI) are unhealthy factors, even though there is clinical relevance that being slightly overweight gives a better prognosis after surgery.
High blood creatinine concentrations suggest that there is a kidney deficiency. Kidney failure is linked to higher mortality. A high blood creatinine concentration is an indication that the renal function is declined.
Very low values for the RAND-36 [
27] general health score indicate that the life quality of the patient is very low. This can be related to other comorbidities that reduce survival.
A low hematocrit and hemoglobin value may suggest anemia, which is linked to mortality. Patients with anemia may require a higher cardiac output to deliver oxygen to the organs. Patients with aortic stenosis can develop heart failure and are thus unable to increase their cardiac output sufficiently. This may result in the deterioration of patients’ hemodynamics and eventually could increase mortality.
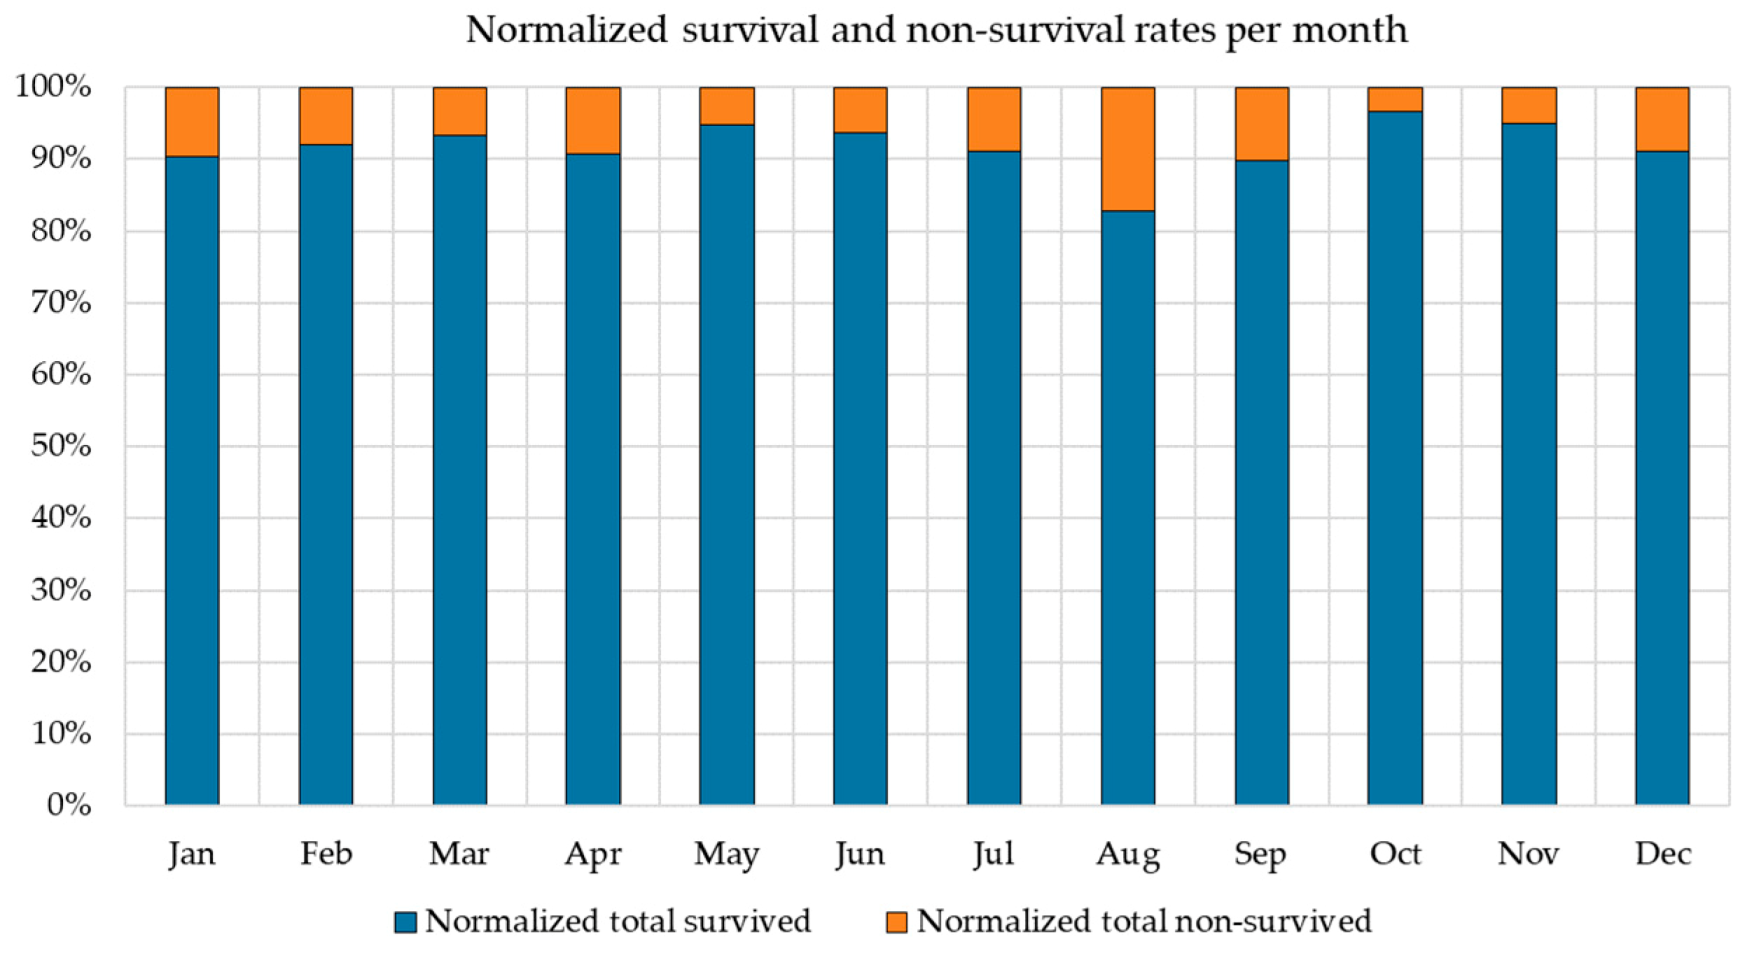
The month on which each patient faces its post-procedure recovery has been shown to be statistically related to survival. Our assumption has been verified on the survival distribution of another center showing a similar survival trend over certain months, as shown in
Figure A3 (
Appendix A). Certain cardiovascular complications are temperature-related, while seasonal diseases also impact survival. This has to be more carefully considered as part of the comorbidities affecting the post-procedure recovery.
Previous devices such as pacemakers are implanted when rhythm disturbances are present and may lead to long-term complications. Implantable cardioverter-defibrillator (ICD) or cardiac resynchronization therapy with defibrillator (CRT-D) are implanted when the left ventricular function is very low, or when the patient has deadly arrhythmia. Both factors lead to a lower life expectancy.
A high QRS duration is an index of a more diseased conduction system. This can lead to heart failure. The conduction system can be damaged by TAVI valves. As the valve is deployed, the stent frame or the calcification of the aortic valve may cause temporary or permanent damage to the conduction system. This can lead to a further widening of the QRS on the electrocardiogram. In some studies, this is linked to a higher mortality.
Smoking leads to a higher risk of any cardiovascular disease, again proof of the fact that smoking leads to a lower chance of survival after an operation.
This twofold approach, technical and clinical, provides a more solid background for this research, enabling the identification of important features for the prediction incorporating clinical expertise and the capability of analyzing a large amount of clinical data exploiting extensive and computationally intensive feature analysis.
5. Limitations of the Study
Similar conclusions of the most important features that have been identified cannot be guaranteed on a larger population or on another clinical center, especially when considering datasets larger than one or two orders of magnitude in size. The validation approach used in this research was chosen because of the clear limitations resulting from a small dataset size. Furthermore, extending the validation on a larger dataset would assess the prediction potential of this model on a larger population, possibly using other validation techniques that take advantage of a threefold split for training, validation, and test set. As this research is a single-center study, we firmly believe that external validations would give added value to the research field. Cross validating the models which are available in the literature could provide validation metrics completely exempt from bias that might be present on each center dataset and could, therefore, lead the model to non-ideally fit or overfit the data. This can represent a risk to be considered when validations are performed on single-center studies, especially when small populations with imbalanced classes are involved.
6. Conclusions
With this research, we aim to develop a predictive model for patient selection in cardiac surgery, specifically for the TAVI use-case, by exploiting a new state-of-the-art machine learning classifier designed for categorical features. We have successfully identified the most important features to predict the one-year mortality and have developed a model based on the most relevant features. We validated our model on 270 patients, obtaining promising results also with respect to widespread prognostic risk scores or predictive models for TAVI. The model is able to discriminate the two populations of survived and non-survived patients with an AUC on the ROC of 0.83 with CI [0.82, 0.84] and with a specificity and sensitivity of 0.97 with CI [0.96, 0.97] and 0.37 with CI [0.28, 0.45], respectively. Since our dataset was intrinsically imbalanced with a ratio of 1/8, we measured also the F1 score as an evaluation metric for this model, which resulted in a value of 0.45 with CI [0.36, 0.53]. The model has achieved a positive predictive value (precision) ranging from 57% to 64%, suggesting that the patient selection with respect to the current clinical workflow can be improved. It is important to extend the validation of the model on other patient data, possibly by performing a validation on a larger dataset, as well as in an inter-center validation process. Summarizing, we evaluated the predictive potential of a model developed for exploiting ML techniques on a set of features found to be important for one-year survival. The model has shown promising predictive potential for the TAVI procedure, offering attractive and powerful insights and results for the prediction of one-year mortality. The methodology presented in this study can be easily scaled up incorporating larger datasets and can be translated to other use-cases. This preliminary study forms a solid basis for further technical investigation and clinical studies to further consider, validate, and extend our approach.
Author Contributions
Conceptualization, M.M., J.M.Z., and P.A.L.T.; methodology, M.M.; software, M.M.; validation, M.M. and J.M.Z.; formal analysis, M.M. and J.M.Z.; investigation, M.M. and J.M.Z.; resources, P.A.L.T. and P.H.N.d.W.; data curation, M.M. and J.M.Z.; writing—original draft preparation, M.M. and J.M.Z.; writing—review and editing, M.M., J.M.Z., P.A.L.T., S.Z., and P.H.N.d.W.; visualization, M.M.; supervision, S.Z. and P.H.N.d.W.; project administration, S.Z. and P.H.N.d.W.; funding acquisition, P.H.N.d.W. All authors have read and agreed to the published version of the manuscript.
Funding
This research was funded by the European ITEA3 funding agency, project PARTNER (acronym of Patient-care Advancement with Responsive Technologies aNd Engagement togetheR), grant number 16017.
Institutional Review Board Statement
The study was conducted according to the guidelines of the Declaration of Helsinki, and approved by the Institutional Review Board (or Ethics Committee) of Catharina Hospital (Eindhoven, the Netherlands) (protocol code W18.194 with date of approval 8th November 2018).
Informed Consent Statement
Informed consent was obtained from all subjects involved in the study.
Data Availability Statement
The data presented in this study are not publicly available due to privacy and ethical restrictions. Data were obtained from Catharina Hospital (Eindhoven, the Netherlands) and have been made available after the permission and approval, through formal request, of the Catharina Hospital ethical committee. The models presented in this study are available for further validation and cross-validation studies with other centers. Contact the corresponding author to this extent.
Acknowledgments
Words of appreciation go to S. Agnolin and V. Cechetto (PhD candidates), for the realization of the drawings shown in
Figure 1.
Conflicts of Interest
The authors declare no conflict of interest.
Appendix A
Data Distribution
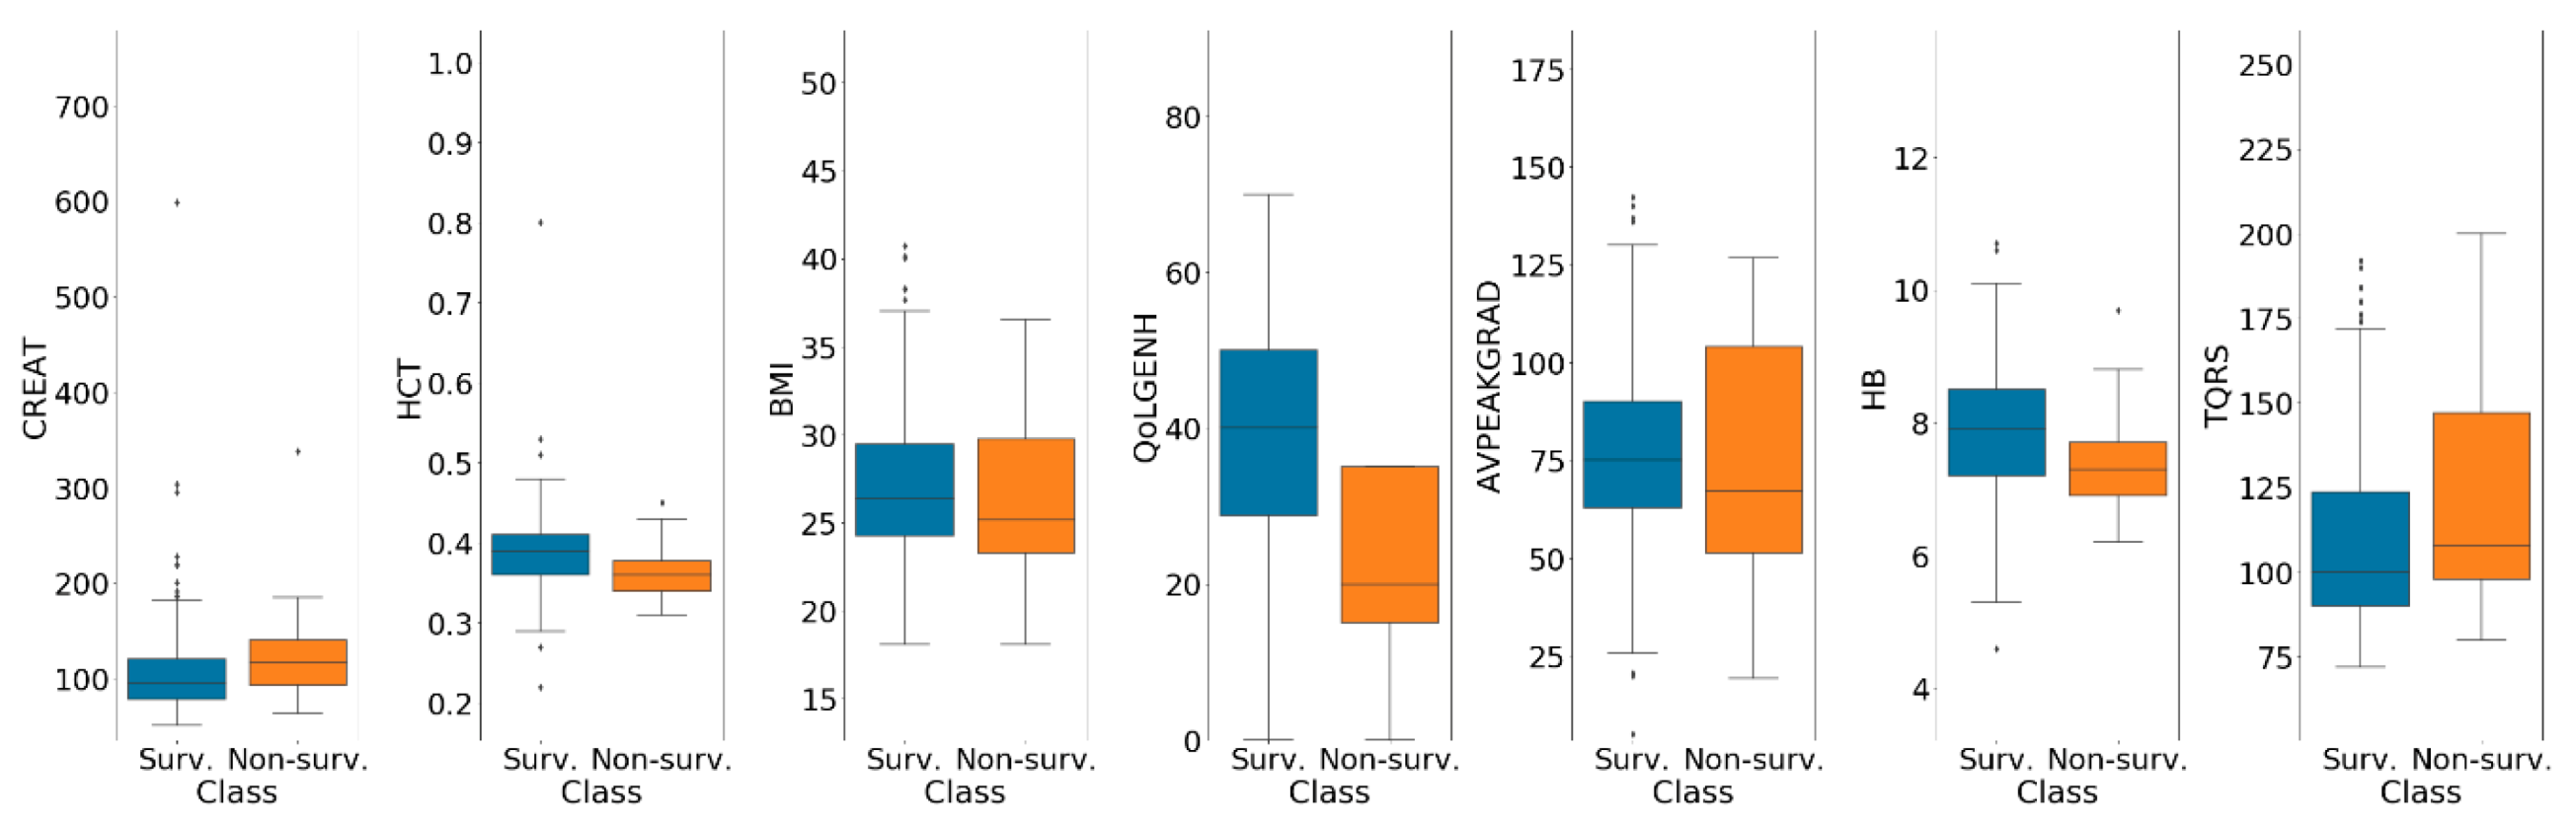
Boxplots representing the numerical features distribution for both classes of the population are shown in
Figure A1.
Figure A1.
Boxplots of numerical features are shown for both classes of the population. Non-survived and survived patient distributions are shown in orange and blue, respectively.
Figure A1.
Boxplots of numerical features are shown for both classes of the population. Non-survived and survived patient distributions are shown in orange and blue, respectively.
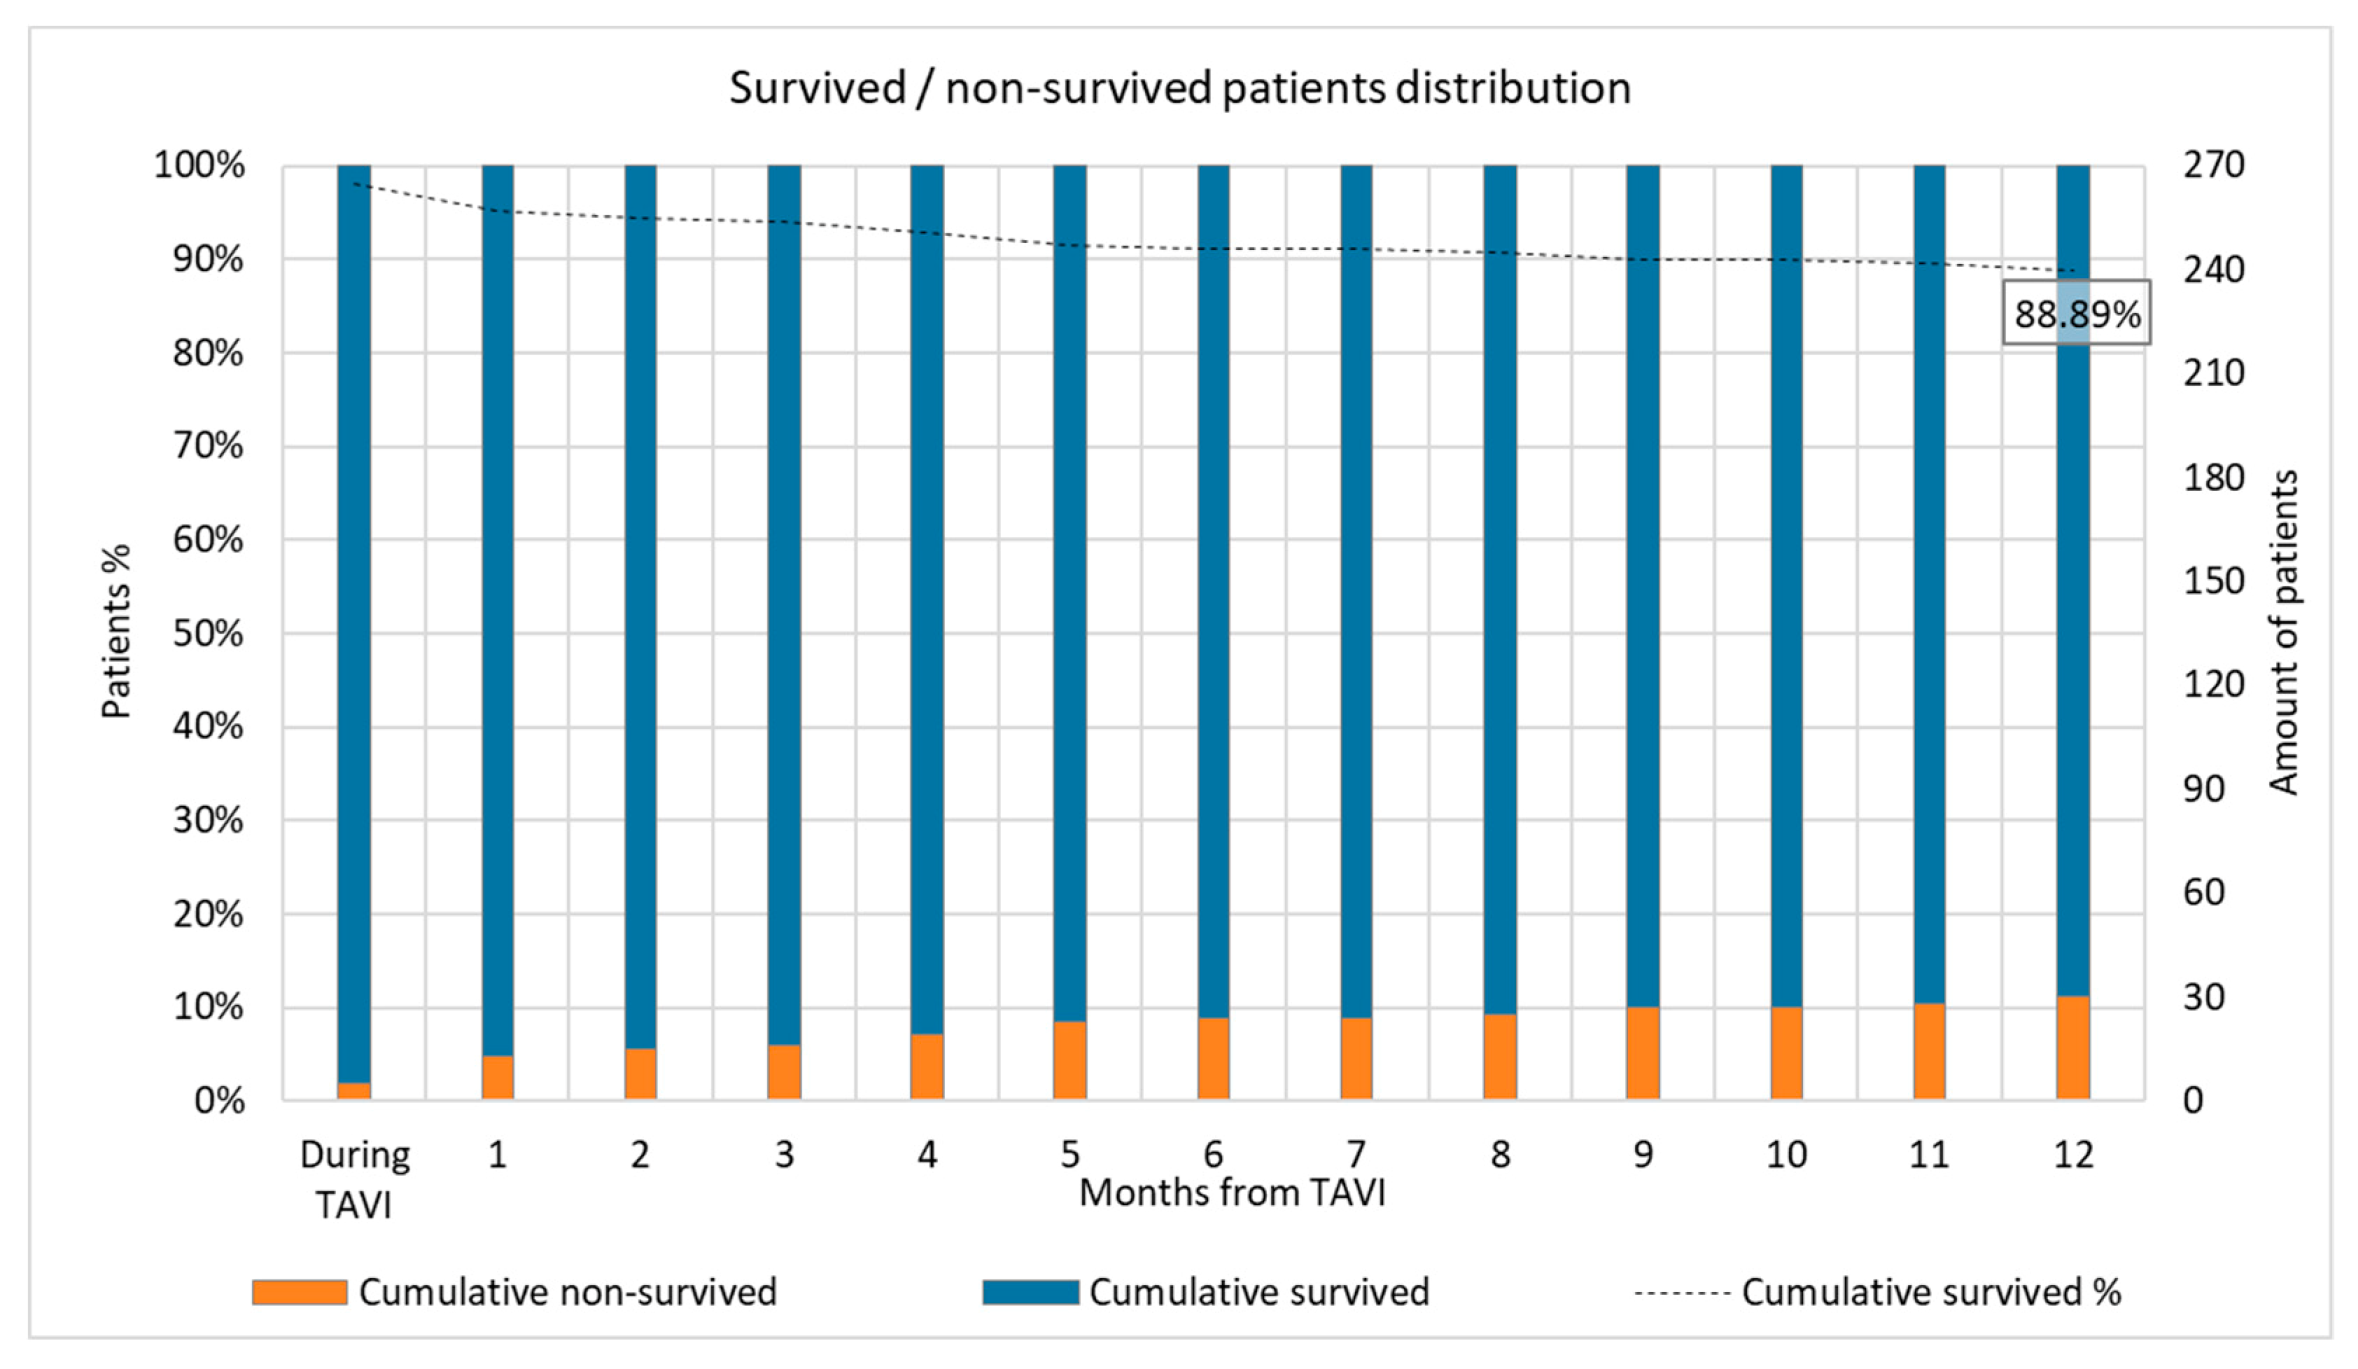
Further details concerning survival distribution over the first year of the population are shown in
Figure A2.
Figure A2.
Survival distribution over the first year.
Figure A2.
Survival distribution over the first year.
In
Figure A3, information about survival for two TAVI centers for a total amount of 2183 patients is shown.
Figure A3.
Survival and non-survival rates per month.
Figure A3.
Survival and non-survival rates per month.
References
- Baumgartner, H.; Falk, V.; Bax, J.J.; De Bonis, M.; Hamm, C.; Holm, P.J.; Iung, B.; Lancellotti, P.; Lansac, E.; Rodriguez Muñoz, D.; et al. 2017 ESC/EACTS Guidelines for the management of valvular heart disease. Eur. Heart J. 2017, 38, 2739–2791. [Google Scholar] [CrossRef] [PubMed]
- Nashef, S.A.M.; Roques, F.; Sharples, L.D.; Nilsson, J.; Smith, C.; Goldstone, A.R.; Lockowandt, U. Euroscore ii. Eur. J. Cardio-Thoracic Surg. 2012, 41, 734–745. [Google Scholar] [CrossRef] [PubMed]
- The Society of Thoracic Surgeons (STS) STS Web Risk Calculator v2.9. Available online: http://riskcalc.sts.org (accessed on 8 February 2021).
- Debonnaire, P.; Fusini, L.; Wolterbeek, R.; Kamperidis, V.; Van Rosendael, P.; Van Der Kley, F.; Katsanos, S.; Joyce, E.; Tamborini, G.; Muratori, M. Value of the “TAVI2-SCORe” versus surgical risk scores for prediction of one year mortality in 511 patients who underwent transcatheter aortic valve implantation. Am. J. Cardiol. 2015, 115, 234–242. [Google Scholar] [CrossRef]
- Arnold, S.V.; Afilalo, J.; Spertus, J.A.; Tang, Y.; Baron, S.J.; Jones, P.G.; Reardon, M.J.; Yakubov, S.J.; Adams, D.H.; Cohen, D.J. Prediction of poor outcome after transcatheter aortic valve replacement. J. Am. Coll. Cardiol. 2016, 68, 1868–1877. [Google Scholar] [CrossRef] [PubMed]
- Collins, G.S.; Reitsma, J.B.; Altman, D.G.; Moons, K.G.M. Transparent Reporting of a Multivariable Prediction Model for Individual Prognosis or Diagnosis (TRIPOD) the TRIPOD Statement. Circulation 2015, 131, 211–219. [Google Scholar] [CrossRef] [PubMed]
- Hays, R.D.; Sherbourne, C.D.; Mazel, R.M. The rand 36-item health survey 1.0. Health Econ. 1993, 2, 217–227. [Google Scholar] [CrossRef]
- Voss, R.; Cullen, P.; Schulte, H.; Assmann, G. Prediction of risk of coronary events in middle-aged men in the Prospective Cardiovascular Münster Study (PROCAM) using neural networks. Int. J. Epidemiol. 2002, 31, 1253–1262. [Google Scholar] [CrossRef]
- Weng, S.F.; Reps, J.; Kai, J.; Garibaldi, J.M.; Qureshi, N. Can machine-learning improve cardiovascular risk prediction using routine clinical data? PLoS ONE 2017, 12, e0174944. [Google Scholar] [CrossRef]
- Van der Ploeg, T.; Austin, P.C.; Steyerberg, E.W. Modern modelling techniques are data hungry: A simulation study for predicting dichotomous endpoints. BMC Med. Res. Methodol. 2014, 14, 1–13. [Google Scholar] [CrossRef]
- Jiang, J.; Wang, R.; Wang, M.; Gao, K.; Nguyen, D.D.; Wei, G.-W. Boosting tree-assisted multitask deep learning for small scientific datasets. J. Chem. Inf. Model. 2020, 60, 1235–1244. [Google Scholar] [CrossRef]
- Dorogush, A.V.; Ershov, V.; Gulin, A. CatBoost: Gradient boosting with categorical features support. arXiv 2018, arXiv:1810.11363. [Google Scholar]
- Prokhorenkova, L.; Gusev, G.; Vorobev, A.; Dorogush, A.V.; Gulin, A. CatBoost: Unbiased boosting with categorical features. arXiv 2017, arXiv:1706.09516. [Google Scholar]
- Chen, T.; Guestrin, C. Xgboost: A scalable tree boosting system. In Proceedings of the 22nd ACM SIGKDD International Conference on Knowledge Discovery and Data Mining, San Francisco, CA, USA, 13–17 August 2016; ACM: San Francisco, CA, USA, 2016; pp. 785–794. [Google Scholar]
- Ke, G.; Meng, Q.; Finley, T.; Wang, T.; Chen, W.; Ma, W.; Ye, Q.; Liu, T.-Y. Lightgbm: A highly efficient gradient boosting decision tree. Adv. Neural Inf. Process. Syst. 2017, 30, 3146–3154. [Google Scholar]
- Lundberg, S.M.; Erion, G.G.; Lee, S.-I. Consistent individualized feature attribution for tree ensembles. arXiv 2018, arXiv:1802.03888. [Google Scholar]
- Lundberg, S.M.; Lee, S.-I. A unified approach to interpreting model predictions. arXiv 2017, arXiv:1705.07874. [Google Scholar]
- Rahman, M.M.; Davis, D.N. Addressing the class imbalance problem in medical datasets. Int. J. Mach. Learn. Comput. 2013, 3, 224. [Google Scholar] [CrossRef]
- Van Calster, B.; Nieboer, D.; Vergouwe, Y.; De Cock, B.; Pencina, M.J.; Steyerberg, E.W. A calibration hierarchy for risk models was defined: From utopia to empirical data. J. Clin. Epidemiol. 2016, 74, 167–176. [Google Scholar] [CrossRef]
- Van Calster, B.; McLernon, D.J.; Van Smeden, M.; Wynants, L.; Steyerberg, E.W. Calibration: The Achilles heel of predictive analytics. BMC Med. 2019, 17, 1–7. [Google Scholar] [CrossRef]
- Rosa, V.E.E.; de Santis Andrade Lopes, A.S.; Accorsi, T.A.D.; Fernandes, J.R.C.; Spina, G.S.; Sampaio, R.O.; Paixão, M.R.; Pomerantzeff, P.M.; Lemos Neto, P.A.; Tarasoutchi, F. EuroSCORE II and STS as mortality predictors in patients undergoing TAVI. Rev. Assoc. Med. Bras. 2016, 62, 32–37. [Google Scholar] [CrossRef]
- Iung, B.; Laouénan, C.; Himbert, D.; Eltchaninoff, H.; Chevreul, K.; Donzeau-Gouge, P.; Fajadet, J.; Leprince, P.; Leguerrier, A.; Lièvre, M. Predictive factors of early mortality after transcatheter aortic valve implantation: Individual risk assessment using a simple score. Heart 2014, 100, 1016–1023. [Google Scholar] [CrossRef]
- Capodanno, D.; Barbanti, M.; Tamburino, C.; D’Errigo, P.; Ranucci, M.; Santoro, G.; Santini, F.; Onorati, F.; Grossi, C.; Covello, R.D. A simple risk tool (the OBSERVANT score) for prediction of 30-day mortality after transcatheter aortic valve replacement. Am. J. Cardiol. 2014, 113, 1851–1858. [Google Scholar] [CrossRef] [PubMed]
- Martin, G.P.; Sperrin, M.; Ludman, P.F.; de Belder, M.A.; Redwood, S.R.; Townend, J.N.; Gunning, M.; Moat, N.E.; Banning, A.P.; Buchan, I. Novel United Kingdom prognostic model for 30-day mortality following transcatheter aortic valve implantation. Heart 2018, 104, 1109–1116. [Google Scholar] [CrossRef] [PubMed]
- Breiman, L. Random forests. Mach. Learn. 2001, 45, 5–32. [Google Scholar] [CrossRef]
- Cortes, C.; Vapnik, V. Support-vector networks. Mach. Learn. 1995, 20, 273–297. [Google Scholar] [CrossRef]
- 36-Item Short Form Survey (SF-36) Scoring Instructions. Available online: https://www.rand.org/health-care/surveys_tools/mos/36-item-short-form/scoring.html (accessed on 8 February 2021).
| Publisher’s Note: MDPI stays neutral with regard to jurisdictional claims in published maps and institutional affiliations. |
© 2021 by the authors. Licensee MDPI, Basel, Switzerland. This article is an open access article distributed under the terms and conditions of the Creative Commons Attribution (CC BY) license (http://creativecommons.org/licenses/by/4.0/).


