
Rotational Projection Errors in Coronal Knee Alignment on Weight-Bearing Whole-Leg Radiographs: A 3D CT Reference Across CPAK Morphotypes


Abstract
1. Introduction
2. Materials and Methods
2.1. Study Design and Cohort
2.2. Imaging Protocol
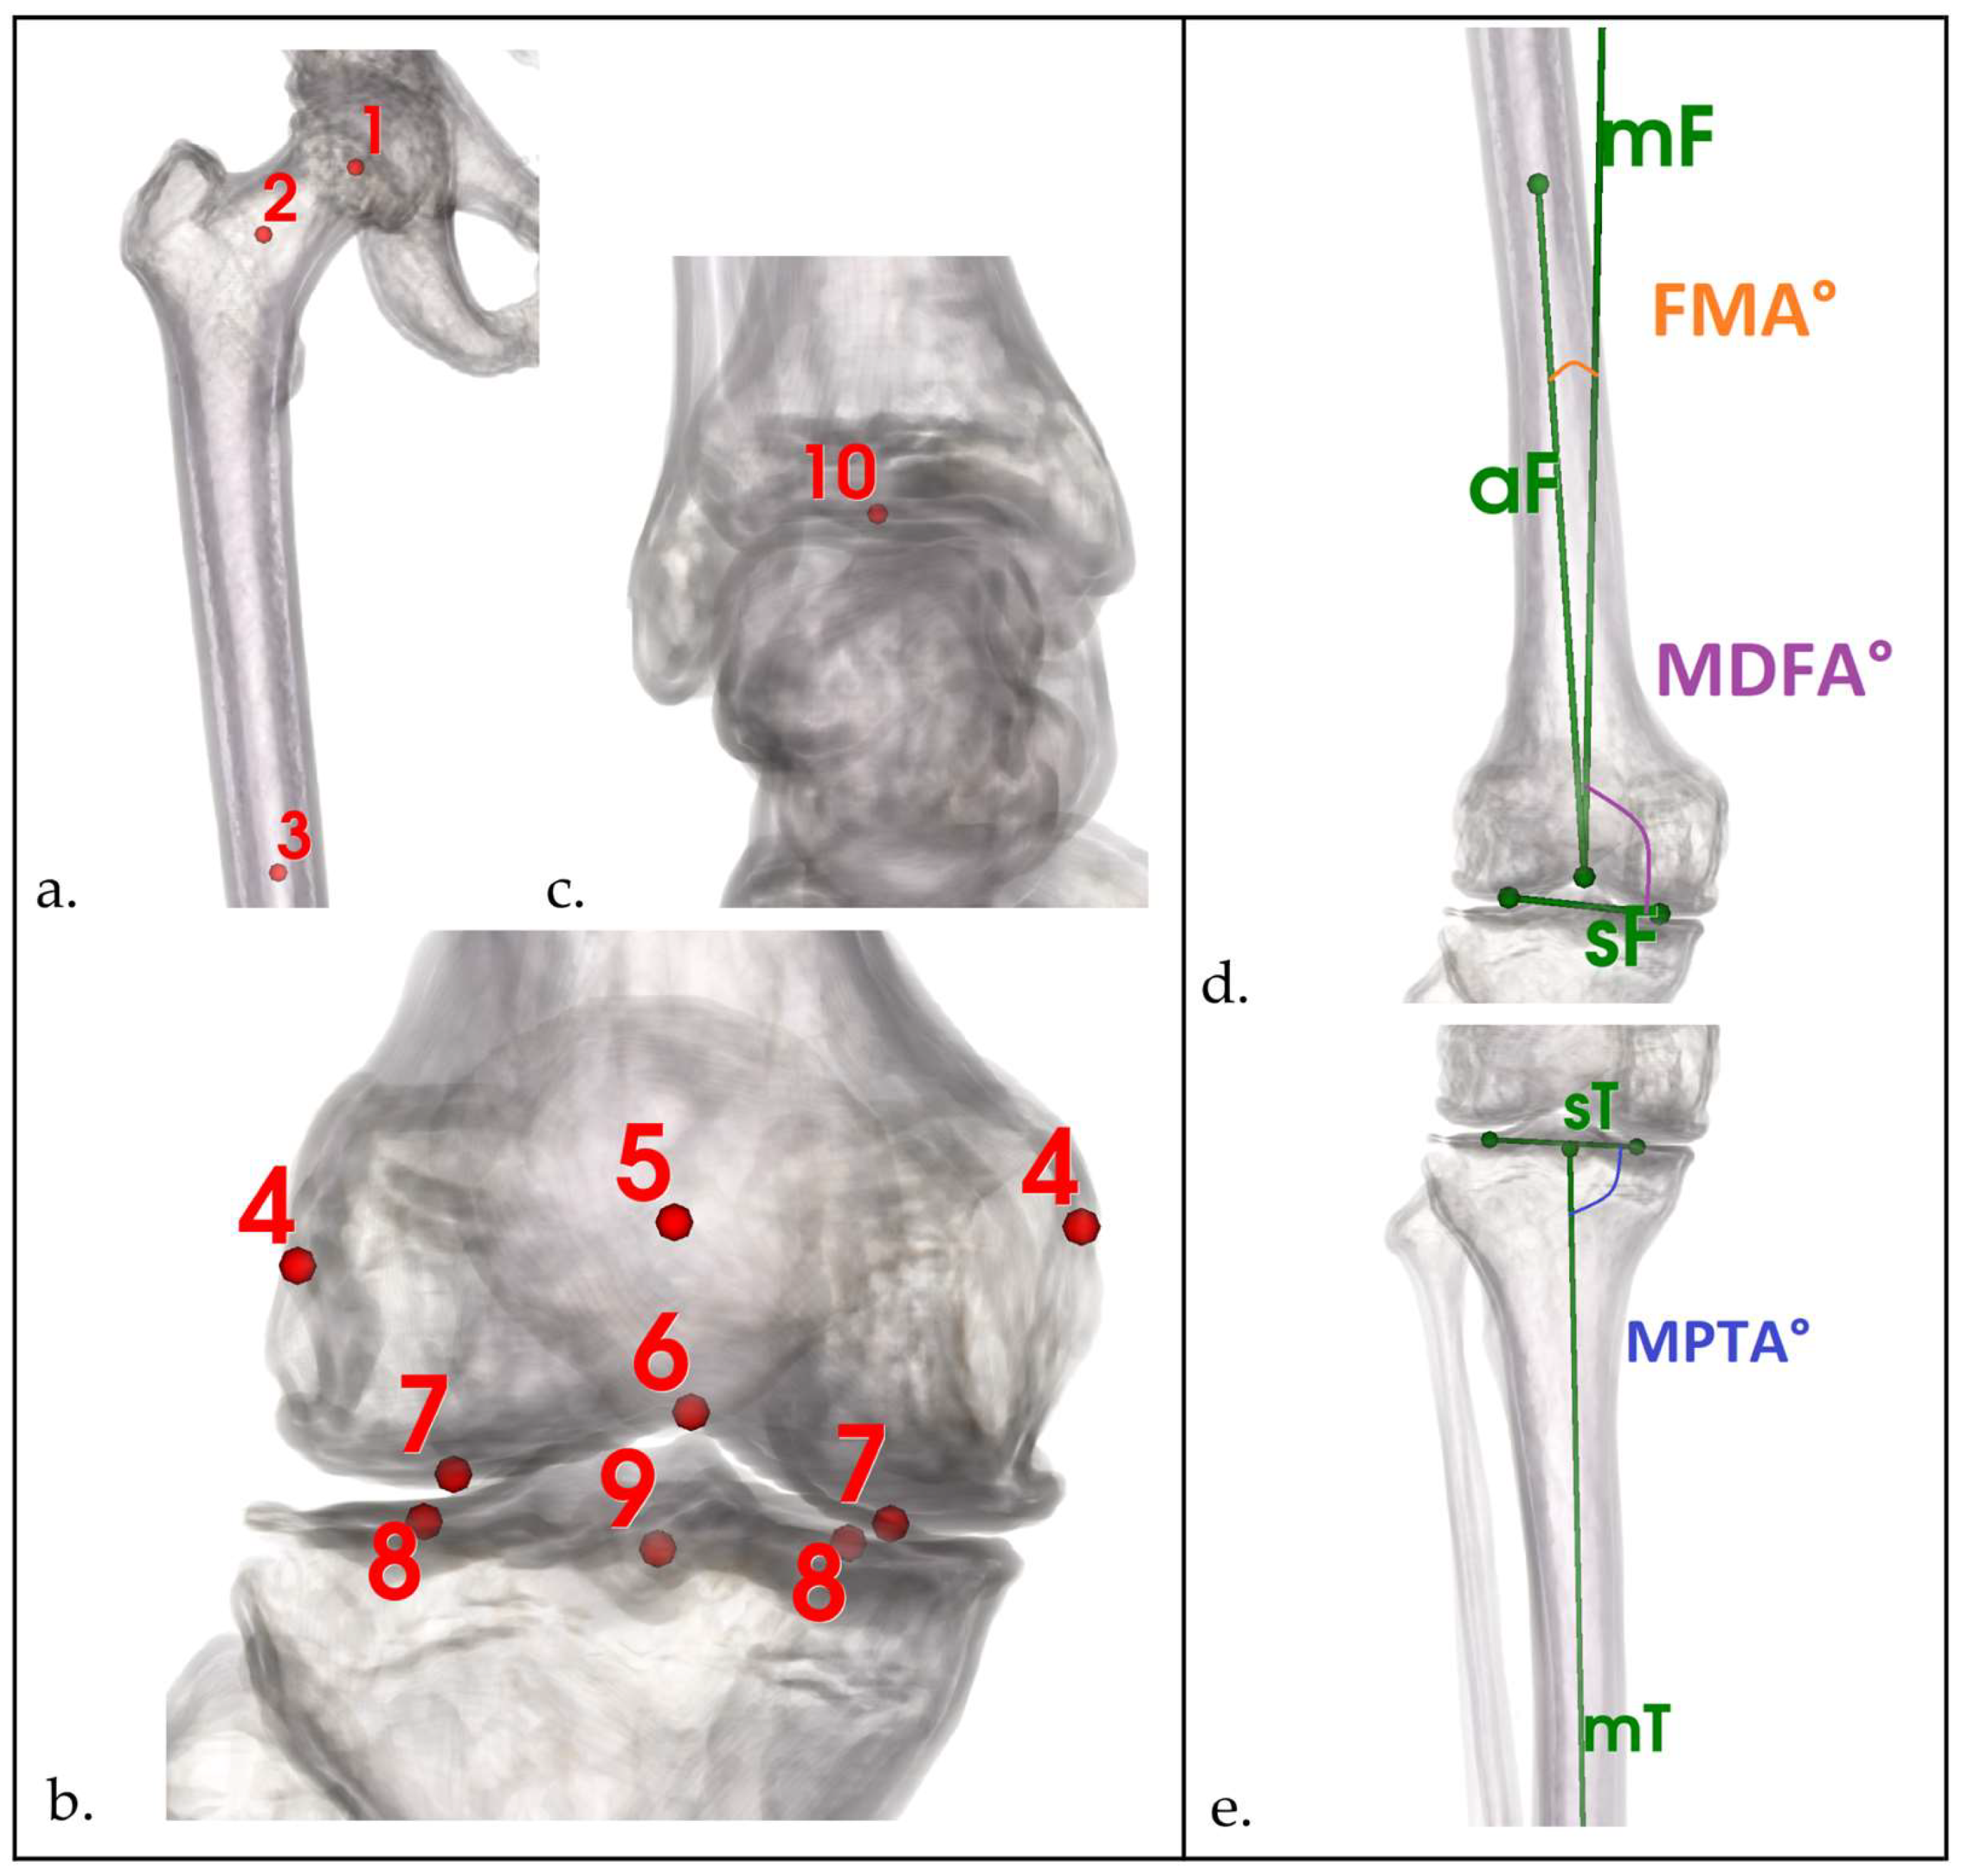
2.3. Landmark Definition and Measurement
2.4. Statistical Analysis
3. Results
3.1. Demographic and Interrater Analysis
3.2. Coronal Alignment Parameters Analysis
3.3. Correlation Between FNPR and CT-Based Torsional Parameters
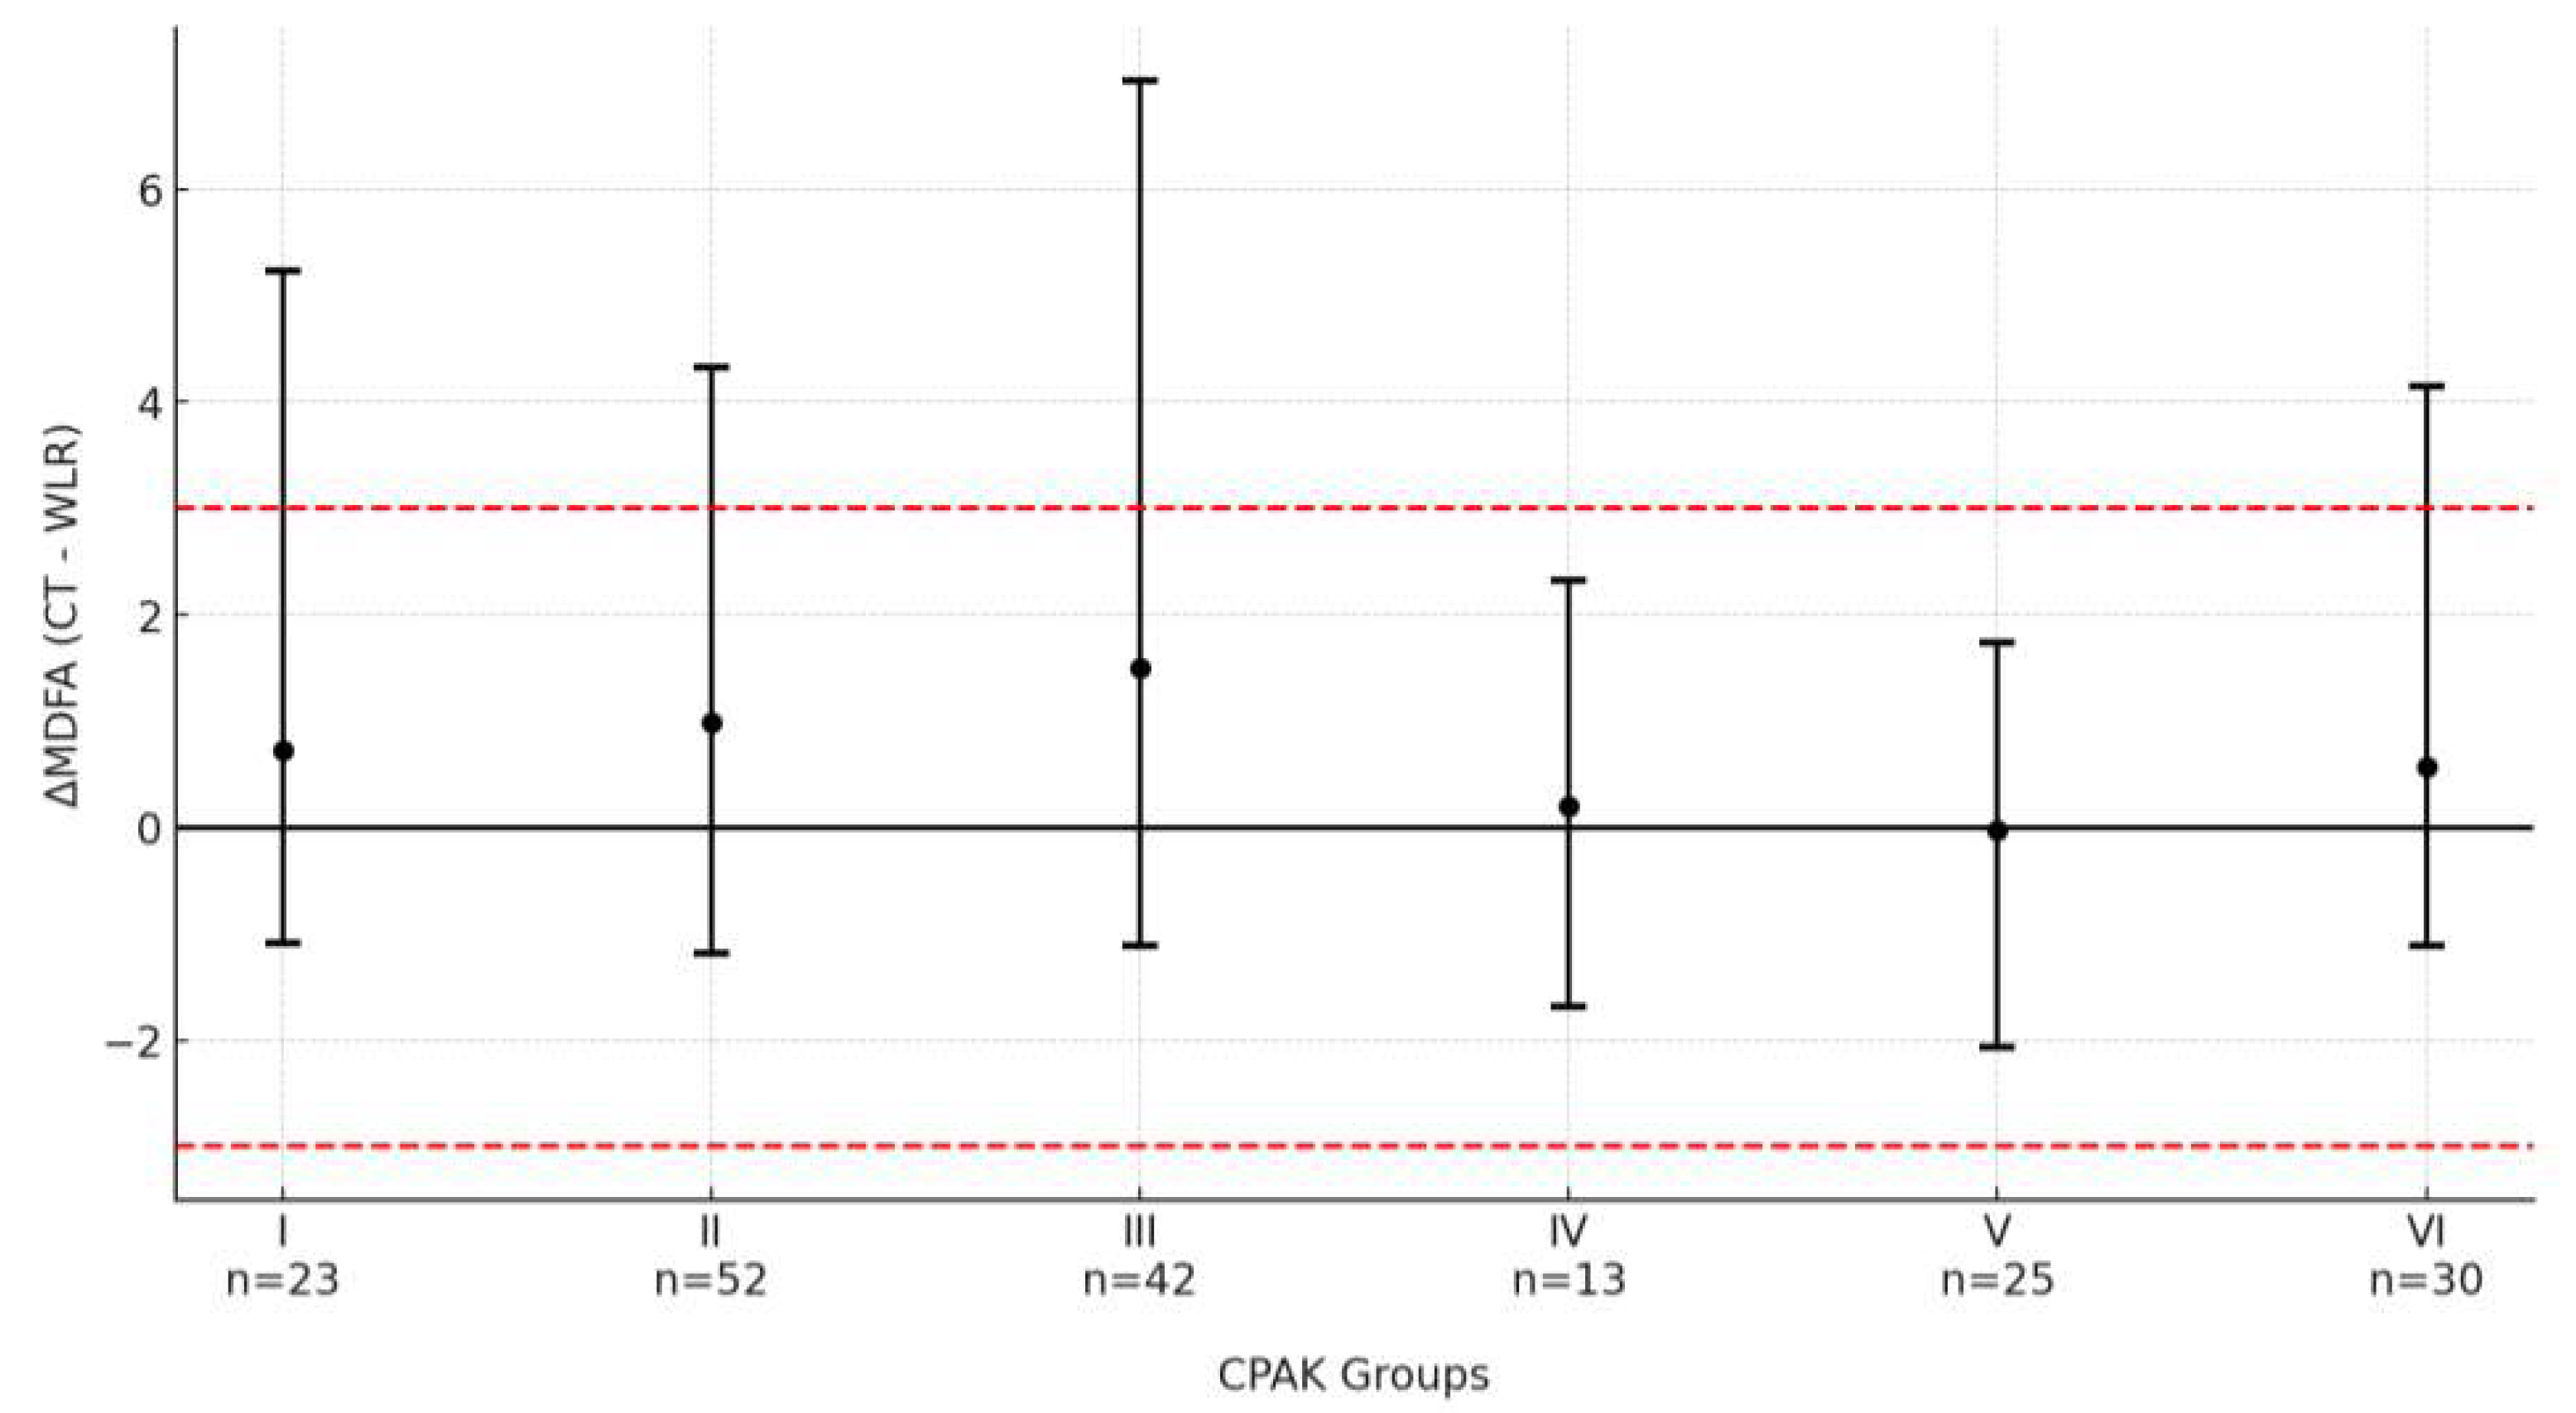
3.4. Measurement Analysis by CPAK Groups
3.5. Outlier Analysis
3.6. Subgroup Analysis by Sex and Age
4. Discussion
4.1. Accuracy of WLR and Morphotype-Specific Projection Errors
4.2. Comparison with Prior Literature
4.3. FNPR as an Indicator of Rotational Malprojection
4.4. Future Directions
4.5. Limitations
5. Conclusions
Clinical Recommendation
Author Contributions
Funding
Institutional Review Board Statement
Informed Consent Statement
Data Availability Statement
Acknowledgments
Conflicts of Interest
Abbreviations
| TKA | total knee arthroplasty |
| WLR | weight-bearing whole-limb radiographs |
| CT | computer tomography |
| FMA° | angle between the femoral mechanical and anatomical axes |
| MDFA° | mechanical medial distal femoral angle |
| LDFA° | mechanical lateral distal femoral angle |
| MPTA° | mechanical medial proximal tibial angle |
| HKA° | hip–knee–ankle angle |
| aHKA° | arithmetical hip–knee–ankle angle |
| sF | most distal point of the central articular surface of the medial and lateral femoral condyles. |
| sT | most proximal point of the central articular surface of the medial and lateral tibial condyles |
| tF° | femoral torsion |
| tT° | tibial torsion |
| ICC | intraclass correlation coefficient |
| ∆ | difference/bias between CT and WLR |
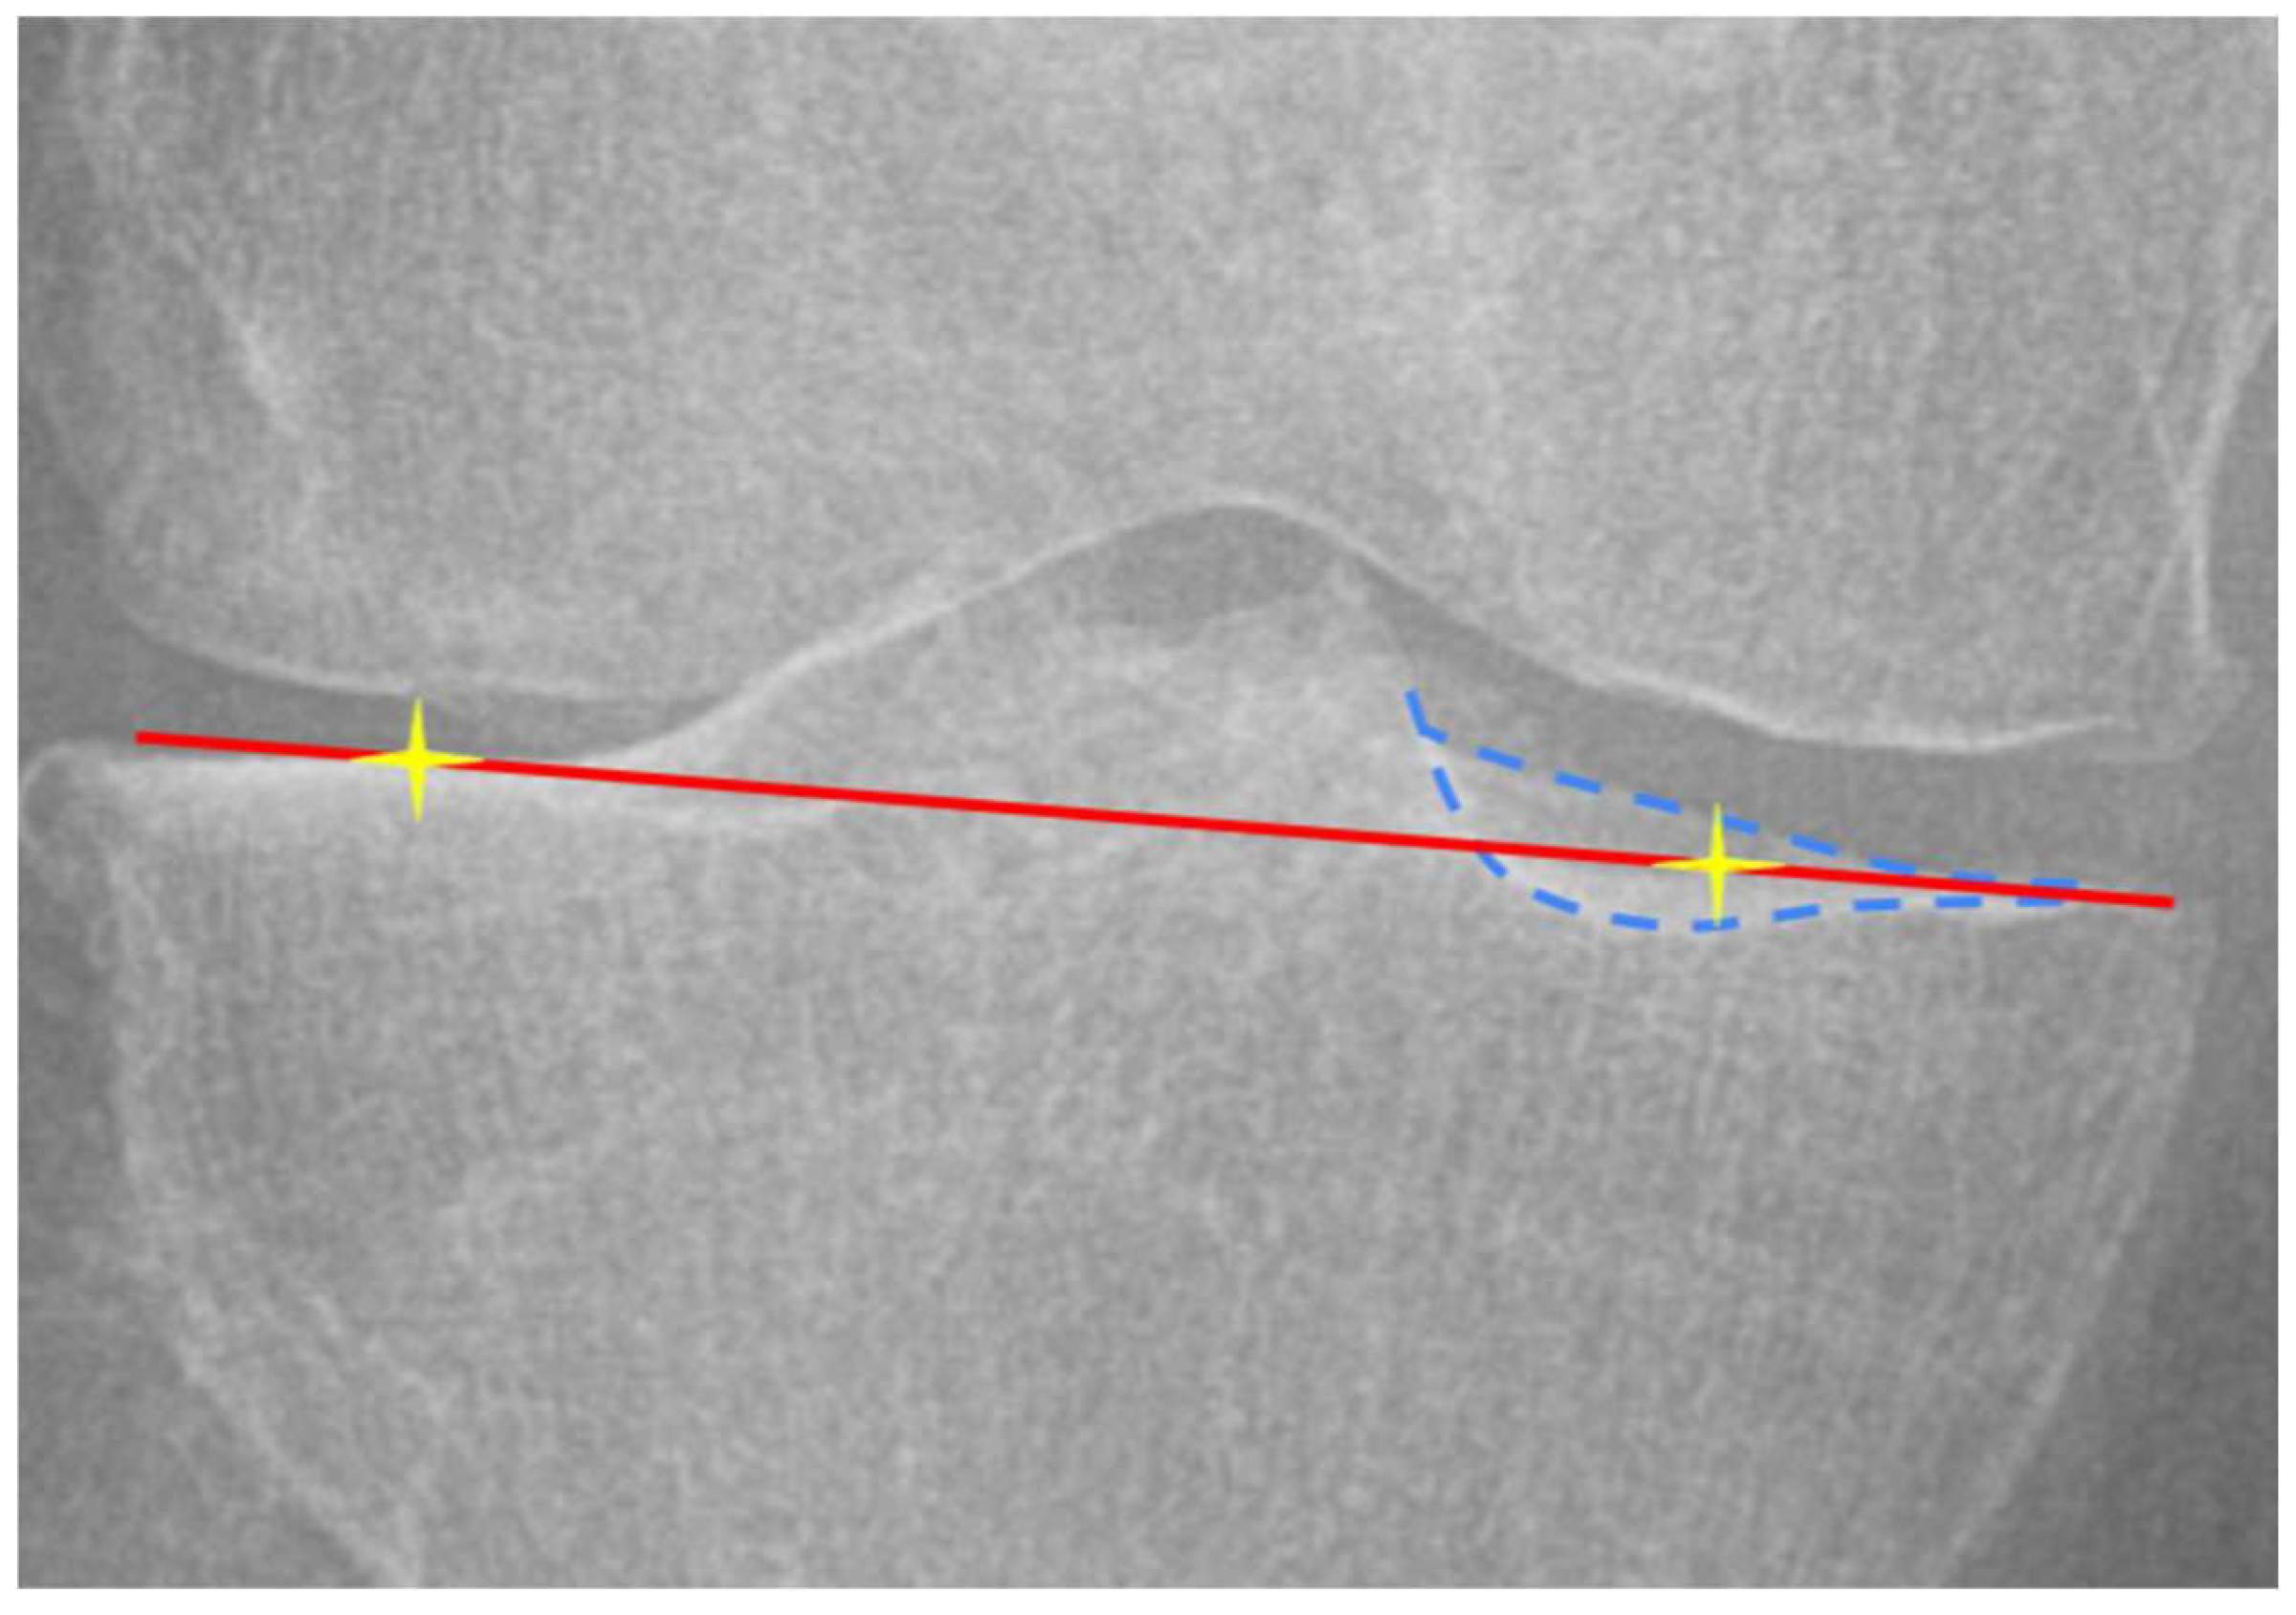
| FNPR | femoral notch projection ratio index |
| PPR | patellar projection ratio index |
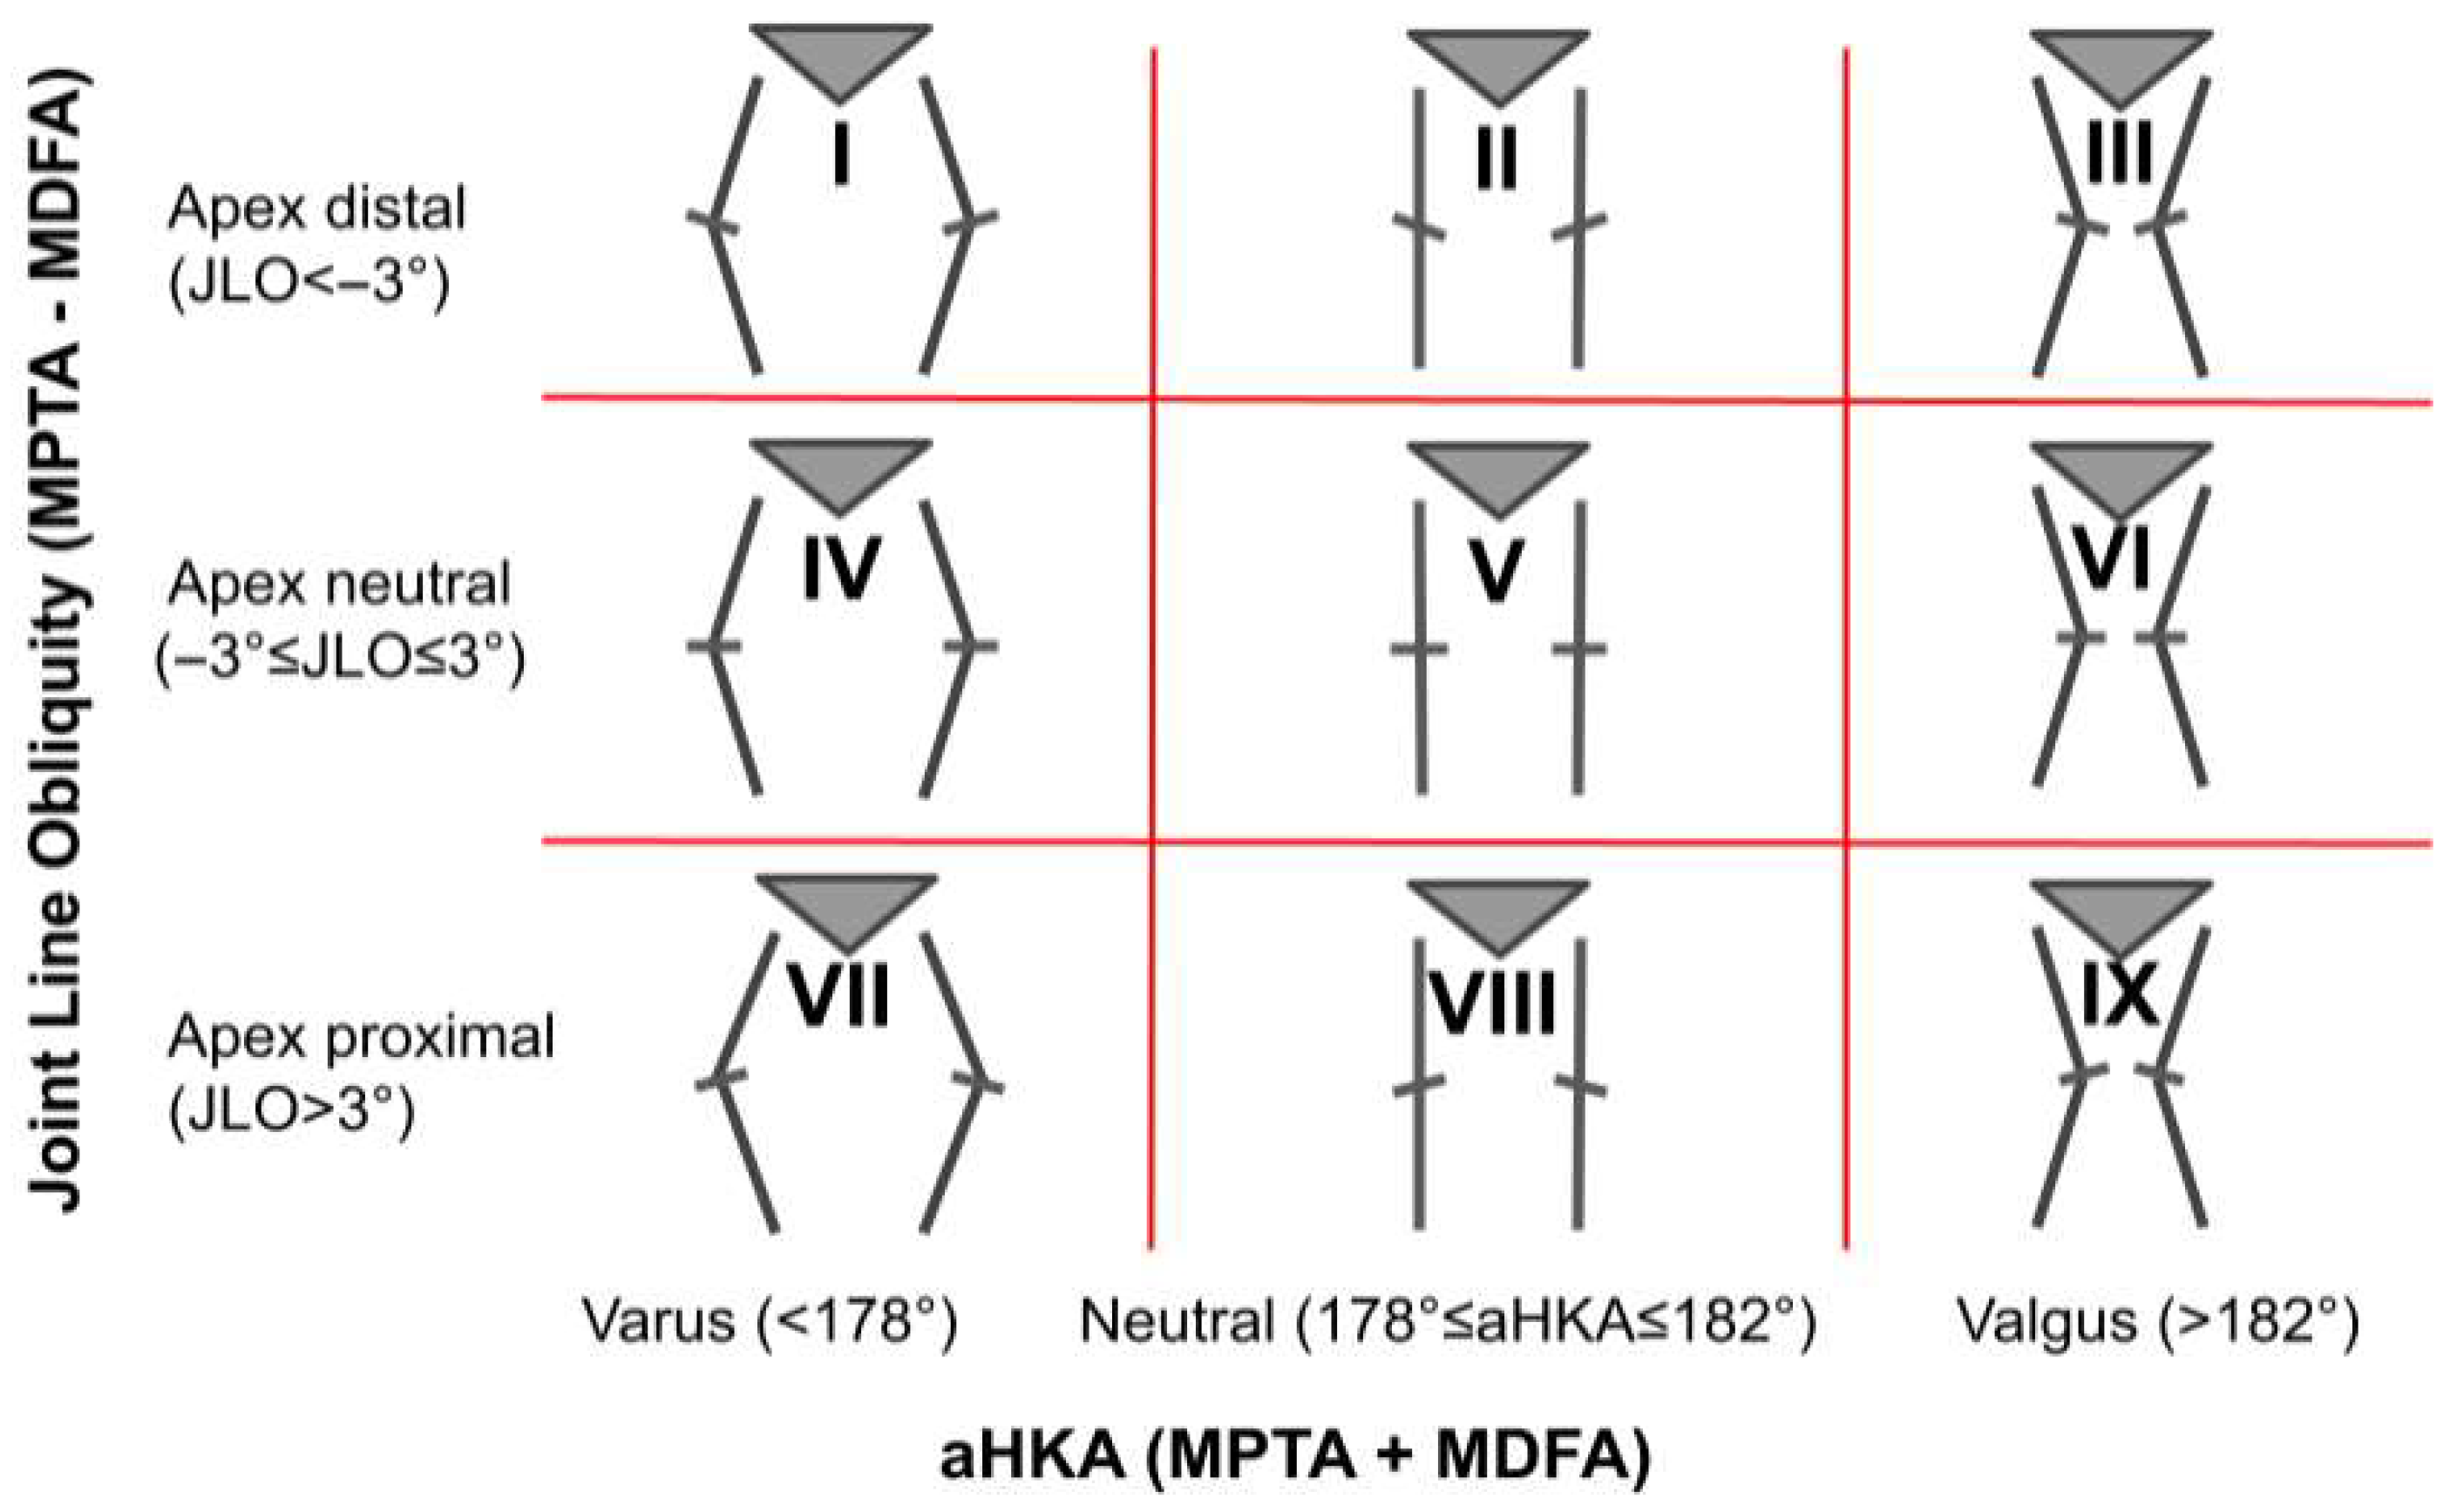
| CPAK | Coronal Plane Alignment of the Knee |
| KL | Kellgren–Lawrence grading |
References
- Ethgen, O.; Bruyère, O.; Richy, F.; Dardennes, C.; Reginster, J.-Y. Health-Related Quality of Life in Total Hip and Total Knee Arthroplasty: A Qualitative and Systematic Review of the Literature. JBJS 2004, 86, 963. [Google Scholar] [CrossRef]
- Bourne, R.B.; Chesworth, B.M.; Davis, A.M.; Mahomed, N.N.; Charron, K.D.J. Patient Satisfaction after Total Knee Arthroplasty: Who Is Satisfied and Who Is Not? Clin. Orthop. 2010, 468, 57–63. [Google Scholar] [CrossRef] [PubMed]
- Collins, M.; Lavigne, M.; Girard, J.; Vendittoli, P.-A. Joint Perception after Hip or Knee Replacement Surgery. Orthop. Traumatol. Surg. Res. 2012, 98, 275–280. [Google Scholar] [CrossRef] [PubMed]
- Bellemans, J.; Colyn, W.; Vandenneucker, H.; Victor, J. The Chitranjan Ranawat Award: Is Neutral Mechanical Alignment Normal for All Patients?: The Concept of Constitutional Varus. Clin. Orthop. 2012, 470, 45–53. [Google Scholar] [CrossRef]
- Sharma, L.; Song, J.; Dunlop, D.; Felson, D.; Lewis, C.E.; Segal, N.; Torner, J.; Cooke, T.D.V.; Hietpas, J.; Lynch, J.; et al. Varus and Valgus Alignment and Incident and Progressive Knee Osteoarthritis. Ann. Rheum. Dis. 2010, 69, 1940–1945. [Google Scholar] [CrossRef]
- An, V.V.G.; Twiggs, J.; Leie, M.; Fritsch, B.A. Kinematic Alignment Is Bone and Soft Tissue Preserving Compared to Mechanical Alignment in Total Knee Arthroplasty. Knee 2019, 26, 466–476. [Google Scholar] [CrossRef]
- MacDessi, S.J.; Griffiths-Jones, W.; Harris, I.A.; Bellemans, J.; Chen, D.B. Coronal Plane Alignment of the Knee (CPAK) Classification. Bone Jt. J. 2021, 103-B, 329–337. [Google Scholar] [CrossRef]
- Larose, G.; Fuentes, A.; Lavoie, F.; Aissaoui, R.; de Guise, J.; Hagemeister, N. Can Total Knee Arthroplasty Restore the Correlation between Radiographic Mechanical Axis Angle and Dynamic Coronal Plane Alignment during Gait? Knee 2019, 26, 586–594. [Google Scholar] [CrossRef]
- Courtney, P.M.; Lee, G.-C. Early Outcomes of Kinematic Alignment in Primary Total Knee Arthroplasty: A Meta-Analysis of the Literature. J. Arthroplast. 2017, 32, 2028–2032.e1. [Google Scholar] [CrossRef]
- Babazadeh, S.; Dowsey, M.M.; Bingham, R.J.; Ek, E.T.; Stoney, J.D.; Choong, P.F.M. The Long Leg Radiograph Is a Reliable Method of Assessing Alignment When Compared to Computer-Assisted Navigation and Computer Tomography. Knee 2013, 20, 242–249. [Google Scholar] [CrossRef]
- Lazennec, J.Y.; Chometon, Q.; Folinais, D.; Robbins, C.B.; Pour, A.E. Are Advanced Three-Dimensional Imaging Studies Always Needed to Measure the Coronal Knee Alignment of the Lower Extremity? Int. Orthop. 2017, 41, 917–924. [Google Scholar] [CrossRef]
- Moon, H.-S.; Choi, C.-H.; Jung, M.; Lee, D.-Y.; Kim, J.-H.; Kim, S.-H. The Effect of Knee Joint Rotation in the Sagittal and Axial Plane on the Measurement Accuracy of Coronal Alignment of the Lower Limb. BMC Musculoskelet. Disord. 2020, 21, 470. [Google Scholar] [CrossRef] [PubMed]
- Nguyen, H.C.; Gielis, W.P.; van Egmond, N.; Weinans, H.; Slump, C.H.; Sakkers, R.J.B.; Custers, R.J.H. The Need for a Standardized Whole Leg Radiograph Guideline: The Effects of Knee Flexion, Leg Rotation, and X-ray Beam Height. J. Cartil. Jt. Preserv. 2021, 1, 100022. [Google Scholar] [CrossRef]
- Jamali, A.A.; Meehan, J.P.; Moroski, N.M.; Anderson, M.J.; Lamba, R.; Parise, C. Do Small Changes in Rotation Affect Measurements of Lower Extremity Limb Alignment? J. Orthop. Surg. 2017, 12, 77. [Google Scholar] [CrossRef] [PubMed]
- León-Muñoz, V.J.; López-López, M.; Martínez-Martínez, F.; Santonja-Medina, F. Comparison of Weight-Bearing Full-Length Radiographs and Computed-Tomography-Scan-Based Three-Dimensional Models in the Assessment of Knee Joint Coronal Alignment. Knee 2020, 27, 543–551. [Google Scholar] [CrossRef]
- Yazdanpanah, O.; Mobarakeh, M.K.; Nakhaei, M.; Baneshi, M.R. Comparison of Double and Single Leg Weight-Bearing Radiography in Determining Knee Alignment. Arch. Bone Jt. Surg. 2017, 5, 174–180. [Google Scholar]
- Specogna, A.V.; Birmingham, T.B.; Hunt, M.A.; Jones, I.C.; Jenkyn, T.R.; Fowler, P.J.; Giffin, J.R. Radiographic Measures of Knee Alignment in Patients with Varus Gonarthrosis: Effect of Weightbearing Status and Associations with Dynamic Joint Load. Am. J. Sports Med. 2007, 35, 65–70. [Google Scholar] [CrossRef]
- Saltybaeva, N.; Jafari, M.E.; Hupfer, M.; Kalender, W.A. Estimates of Effective Dose for CT Scans of the Lower Extremities. Radiology 2014, 273, 153–159. [Google Scholar] [CrossRef]
- Fedorov, A.; Beichel, R.; Kalpathy-Cramer, J.; Finet, J.; Fillion-Robin, J.-C.; Pujol, S.; Bauer, C.; Jennings, D.; Fennessy, F.; Sonka, M.; et al. 3D Slicer as an Image Computing Platform for the Quantitative Imaging Network. Magn. Reson. Imaging 2012, 30, 1323–1341. [Google Scholar] [CrossRef]
- Fürmetz, J.; Sass, J.; Ferreira, T.; Jalali, J.; Kovacs, L.; Mück, F.; Degen, N.; Thaller, P.H. Three-Dimensional Assessment of Lower Limb Alignment: Accuracy and Reliability. Knee 2019, 26, 185–193. [Google Scholar] [CrossRef]
- Ariumi, A.; Sato, T.; Kobayashi, K.; Koga, Y.; Omori, G.; Minato, I.; Endo, N. Three-Dimensional Lower Extremity Alignment in the Weight-Bearing Standing Position in Healthy Elderly Subjects. J. Orthop. Sci. 2010, 15, 64–70. [Google Scholar] [CrossRef]
- Degen, N.; Sass, J.; Jalali, J.; Kovacs, L.; Euler, E.; Prall, W.C.; Böcker, W.; Thaller, P.H.; Fürmetz, J. Three-Dimensional Assessment of Lower Limb Alignment: Reference Values and Sex-Related Differences. Knee 2020, 27, 428–435. [Google Scholar] [CrossRef] [PubMed]
- Griffiths-Jones, W.; Chen, D.B.; Harris, I.A.; Bellemans, J.; MacDessi, S.J. Arithmetic Hip-Knee-Ankle Angle (aHKA): An Algorithm for Estimating Constitutional Lower Limb Alignment in the Arthritic Patient Population. Bone Jt. Open 2021, 2, 351–358. [Google Scholar] [CrossRef] [PubMed]
- Chan, E.F.; Cockman, M.D.; Goel, P.; Newman, P.S.; Hipp, J.A. Characterization of the Mid-Coronal Plane Method for Measurement of Radiographic Change in Knee Joint Space Width across Different Levels of Image Parallax. Osteoarthr. Cartil. 2021, 29, 1306–1313. [Google Scholar] [CrossRef]
- Paley, D. Malalignment and Malorientation in the Frontal Plane. In Principles of Deformity Correction; Paley, D., Ed.; Springer: Berlin/Heidelberg, Germany, 2002; pp. 19–30. ISBN 978-3-642-59373-4. [Google Scholar]
- Onakpojeruo, E.P.; Sancar, N. A Two-Stage Feature Selection Approach Based on Artificial Bee Colony and Adaptive LASSO in High-Dimensional Data. AppliedMath 2024, 4, 1522–1538. [Google Scholar] [CrossRef]
- Sancar, N.; Onakpojeruo, E.P.; Inan, D.; Uzun Ozsahin, D. Adaptive Elastic Net Based on Modified PSO for Variable Selection in Cox Model With High-Dimensional Data: A Comprehensive Simulation Study. IEEE Access 2023, 11, 127302–127316. [Google Scholar] [CrossRef]
- Gieroba, T.J.; Marasco, S.; Babazadeh, S.; Di Bella, C.; Van Bavel, D. Arithmetic Hip Knee Angle Measurement on Long Leg Radiograph versus Computed Tomography—Inter-Observer and Intra-Observer Reliability. Arthroplasty 2023, 5, 35. [Google Scholar] [CrossRef]
- Aunan, E.; Alhaug, E.; Schuller, S.G.; Rundfloen, J.E. 3-Dimensional Computer Tomography Is More Accurate than Traditional Long-Leg Radiographs in the Planning and Evaluation of Coronal Alignment in Total Knee Arthroplasty: A Prospective Study on 121 Knees. Acta Orthop. 2023, 94, 530–536. [Google Scholar] [CrossRef]
- Buck, F.M.; Guggenberger, R.; Koch, P.P.; Pfirrmann, C.W.A. Femoral and Tibial Torsion Measurements With 3D Models Based on Low-Dose Biplanar Radiographs in Comparison With Standard CT Measurements. Am. J. Roentgenol. 2012, 199, W607–W612. [Google Scholar] [CrossRef]
- Sorin, G.; Pasquier, G.; Drumez, E.; Arnould, A.; Migaud, H.; Putman, S. Reproducibility of Digital Measurements of Lower-Limb Deformity on Plain Radiographs and Agreement with CT Measurements. Orthop. Traumatol. Surg. Res. 2016, 102, 423–428. [Google Scholar] [CrossRef] [PubMed]
- Jud, L.; Trache, T.; Tondelli, T.; Fürnstahl, P.; Fucentese, S.F.; Vlachopoulos, L. Rotation or Flexion Alters Mechanical Leg Axis Measurements Comparably in Patients with Different Coronal Alignment. Knee Surg. Sports Traumatol. Arthrosc. 2020, 28, 3128–3134. [Google Scholar] [CrossRef]
- Kawakami, H.; Sugano, N.; Yonenobu, K.; Yoshikawa, H.; Ochi, T.; Hattori, A.; Suzuki, N. Effects of Rotation on Measurement of Lower Limb Alignment for Knee Osteotomy. J. Orthop. Res. 2004, 22, 1248–1253. [Google Scholar] [CrossRef]
- Guggenberger, R.; Pfirrmann, C.W.A.; Koch, P.P.; Buck, F.M. Assessment of Lower Limb Length and Alignment by Biplanar Linear Radiography: Comparison With Supine CT and Upright Full-Length Radiography. Am. J. Roentgenol. 2014, 202, W161–W167. [Google Scholar] [CrossRef]
- Lonner, J.H.; Laird, M.T.; Stuchin, S.A. Effect of Rotation and Knee Flexion on Radiographic Alignment in Total Knee Arthroplasties. Clin. Orthop. 1996, 331, 102–106. [Google Scholar] [CrossRef]
- Hirschmann, M.T.; Moser, L.B.; Amsler, F.; Behrend, H.; Leclerq, V.; Hess, S. Functional Knee Phenotypes: A Novel Classification for Phenotyping the Coronal Lower Limb Alignment Based on the Native Alignment in Young Non-Osteoarthritic Patients. Knee Surg. Sports Traumatol. Arthrosc. Off. J. ESSKA 2019, 27, 1394–1402. [Google Scholar] [CrossRef]
- Hess, S.; Moser, L.B.; Amsler, F.; Behrend, H.; Hirschmann, M.T. Highly Variable Coronal Tibial and Femoral Alignment in Osteoarthritic Knees: A Systematic Review. Knee Surg. Sports Traumatol. Arthrosc. 2019, 27, 1368–1377. [Google Scholar] [CrossRef]
- Chang, M.J.; Jeong, H.J.; Kang, S.-B.; Chang, C.B.; Yoon, C.; Shin, J.Y. Relationship Between Coronal Alignment and Rotational Profile of Lower Extremity in Patients with Knee Osteoarthritis. J. Arthroplast. 2018, 33, 3773–3777. [Google Scholar] [CrossRef]
- Luyckx, T.; Zambianchi, F.; Catani, F.; Bellemans, J.; Victor, J. Coronal Alignment Is a Predictor of the Rotational Geometry of the Distal Femur in the Osteo-Arthritic Knee. Knee Surg. Sports Traumatol. Arthrosc. 2013, 21, 2331–2337. [Google Scholar] [CrossRef]
- Matsui, Y.; Kadoya, Y.; Uehara, K.; Kobayashi, A.; Takaoka, K. Rotational Deformity in Varus Osteoarthritis of the Knee: Analysis with Computed Tomography. Clin. Orthop. 2005, 433, 147–151. [Google Scholar] [CrossRef]
- Khan, M.S.; Seon, J.K.; Song, E.K. Rotational Profile of Lower Limb and Axis for Tibial Component Alignment in Varus Osteoarthritic Knees. J. Arthroplast. 2012, 27, 797–802. [Google Scholar] [CrossRef]
- Strahovnik, A.; Strahovnik, I.; Fokter, S.K. Coronal Knee Alignment and Tibial Rotation in Total Knee Arthroplasty: A Prospective Cohort Study of Patients with End-Stage Osteoarthritis. Bioengineering 2024, 11, 296. [Google Scholar] [CrossRef] [PubMed]
- Cilengir, A.H.; Cetinoglu, Y.K.; Kazimoglu, C.; Gelal, M.F.; Mete, B.D.; Elmali, F.; Tosun, O. The Relationship between Patellar Tilt and Quadriceps Patellar Tendon Angle with Anatomical Variations and Pathologies of the Knee Joint. Eur. J. Radiol. 2021, 139, 109719. [Google Scholar] [CrossRef] [PubMed]


| Patient Demographics | ||
|---|---|---|
| Parameter | Value | |
| Number of knees | 187 | |
| Age, years (mean [95% CI]) | 69.7 [68.4–70.8] | |
| Age group (n) | ||
| 46 | |
| 62 | |
| 79 | |
| Gender, n (F/M) | 107/80 | |
| Side, n (right/left) | 93/94 | |
| Kellgren–Lawrence grade (2/3/4) | 20/55/112 | |
| CPAK Classification: | ||
| CPAK Type | CT (n) | WLR (n) |
| I | 23 | 28 |
| II | 52 | 40 |
| III | 42 | 28 |
| IV | 13 | 27 |
| V | 25 | 28 |
| VI | 30 | 30 |
| VII | 0 | 2 |
| VIII | 1 | 3 |
| IX | 1 | 1 |
| Inter-Observer | Intra-Observer | ||
|---|---|---|---|
| Parameter | ICC (CT) | ICC (WLR) | ICC (WLR) |
| aHKA° | 0.81 | 0.78 | 0.80 |
| MDFA° | 0.80 | 0.76 | 0.76 |
| MPTA° | 0.88 | 0.85 | 0.86 |
| FMA° | 0.95 | 0.90 | 0.94 |
| FNPR | - | 0.70 | 0.76 |
| Angle | CT | WLR | ∆ (CT − WLR) | p-Value |
|---|---|---|---|---|
| aHKA° | 181.3° ± 3.1° | 180.4° ± 3.2° | 1° ± 1.8° | <0.001 |
| MDFA° | 92.7° ± 1.8° | 91.9° ± 1.9° | 0.8° ± 1.7° | <0.001 |
| MPTA° | 88.6° ± 1.6° | 88.5° ± 1.6° | 0.2° ± 1.0° | 0.028 |
| FMA° | 6.6° ± 1.0° | 5.6° ± 1.0° | 1.0° ± 0.8° | <0.001 |
| Torsional Parameter | Pearson r | p-Value |
|---|---|---|
| Femoral torsion (tF) | 0.150 | 0.040 |
| Tibial torsion (tT) | −0.209 | 0.001 |
| Knee torsion | −0.237 | 0.001 |
| Total limb torsion | ±0.204 | 0.005 |
| CPAK Type | n | ∆MDFA° | SD | p-Value |
|---|---|---|---|---|
| I | 23 | +0.7° | 1.7° | 0.092 |
| II | 52 | +1.0° | 1.5° | <0.001 |
| III | 42 | +1.5° | 2.0° | <0.001 |
| IV | 13 | +0.2° | 1.4° | 0.735 |
| V | 25 | –0.0° | 1.1° | 0.958 |
| VI | 30 | +0.6° | 1.6° | 0.177 |
| CPAK Group | n | Outliers (±1.96 SD) | Outliers (±3°) |
|---|---|---|---|
| I | 23 | 2 (8.7%) | 2 (8.7%) |
| II | 52 | 2 (3.8%) | 7 (13.5%) |
| III | 42 | 5 (11.9%) | 8 (19.0%) |
| IV | 13 | 0 (0.0%) | 0 (0.0%) |
| V | 25 | 1 (4.0%) | 0 (0.0%) |
| VI | 30 | 1 (3.3%) | 2 (6.7%) |
| VII | 0 | – | – |
| VIII | 1 | 0 (0.0%) | 0 (0.0%) |
| IX | 1 | 0 (0.0%) | 0 (0.0%) |
| All groups | 187 | 11 (5.9%) | 19 (10.2%) |
| Group | FNPR | PPR | ∆MDFA° | PPR–FNPR | Outlier > 3° |
|---|---|---|---|---|---|
| Female | +0.5 | −0.9 | 1.1 | −1.3 | 12.7% |
| Male | −0.4 | −2.4 | 0.4 | −2.0 | 3.3% |
| Age < 67 | +0.9 | −0.6 | 1.1 | −1.5 | 12.2% |
| Age 67–72 | −0.3 | −1.3 | 0.6 | −1.0 | 10.3% |
| Age > 72 | −0.4 | −3.2 | 0.7 | −2.8 | 1.7% |
Disclaimer/Publisher’s Note: The statements, opinions and data contained in all publications are solely those of the individual author(s) and contributor(s) and not of MDPI and/or the editor(s). MDPI and/or the editor(s) disclaim responsibility for any injury to people or property resulting from any ideas, methods, instructions or products referred to in the content. |
© 2025 by the authors. Licensee MDPI, Basel, Switzerland. This article is an open access article distributed under the terms and conditions of the Creative Commons Attribution (CC BY) license (https://creativecommons.org/licenses/by/4.0/).
Share and Cite
Strahovnik, I.; Strahovnik, A.; Fokter, S.K. Rotational Projection Errors in Coronal Knee Alignment on Weight-Bearing Whole-Leg Radiographs: A 3D CT Reference Across CPAK Morphotypes. Bioengineering 2025, 12, 794. https://doi.org/10.3390/bioengineering12080794
Strahovnik I, Strahovnik A, Fokter SK. Rotational Projection Errors in Coronal Knee Alignment on Weight-Bearing Whole-Leg Radiographs: A 3D CT Reference Across CPAK Morphotypes. Bioengineering. 2025; 12(8):794. https://doi.org/10.3390/bioengineering12080794
Chicago/Turabian StyleStrahovnik, Igor, Andrej Strahovnik, and Samo Karel Fokter. 2025. "Rotational Projection Errors in Coronal Knee Alignment on Weight-Bearing Whole-Leg Radiographs: A 3D CT Reference Across CPAK Morphotypes" Bioengineering 12, no. 8: 794. https://doi.org/10.3390/bioengineering12080794
APA StyleStrahovnik, I., Strahovnik, A., & Fokter, S. K. (2025). Rotational Projection Errors in Coronal Knee Alignment on Weight-Bearing Whole-Leg Radiographs: A 3D CT Reference Across CPAK Morphotypes. Bioengineering, 12(8), 794. https://doi.org/10.3390/bioengineering12080794