By combining the capabilities of CV and NLP, AI systems can analyze complex radiological images and extract key information from reports. This synergy enables the development of AI-driven solutions that automatically generate comprehensive and detailed reports. Such advancements significantly reduce the time required to produce accurate reports, highlighting critical findings and identifying abnormalities. This paper reviews the most prominent applications and studies on RRG using AI. These applications are categorized into three main approaches: deep learning-based methods, LLM/VLM-based methods, and graph-based methods, each of which will be examined in detail. Summary tables for each category are provided after each section.
2.2. VLM- and LLM-Based Methods
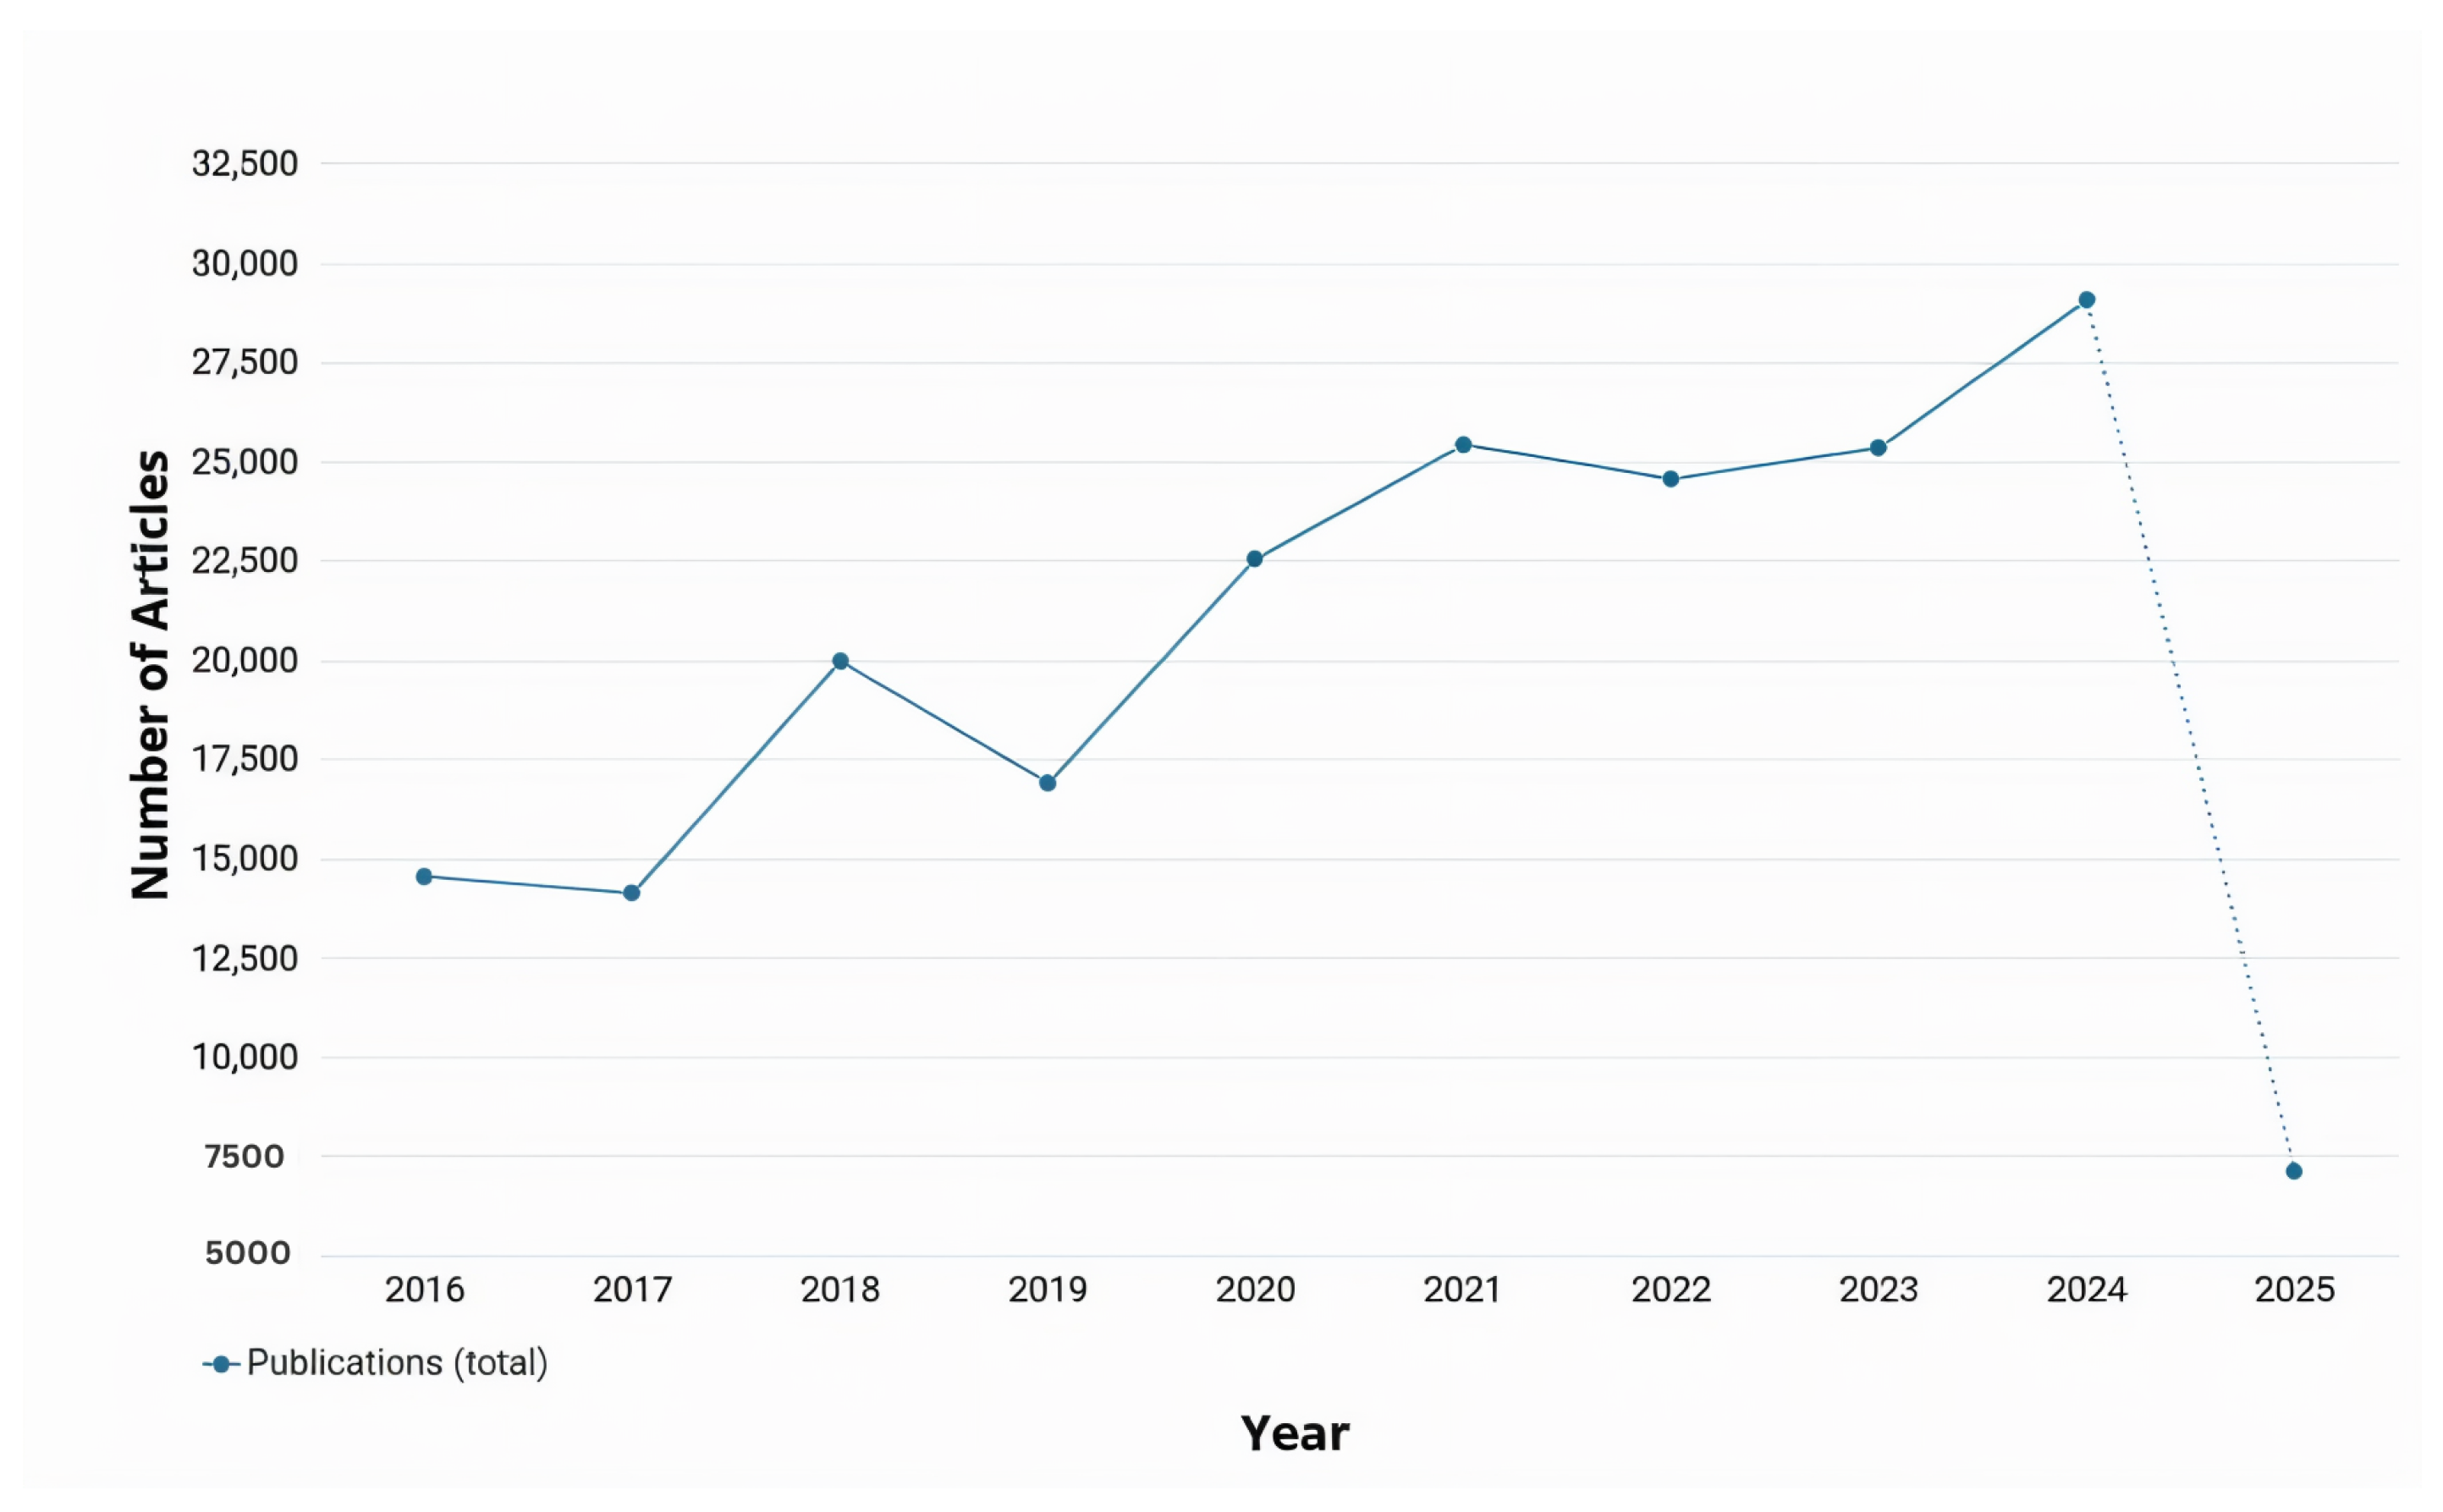
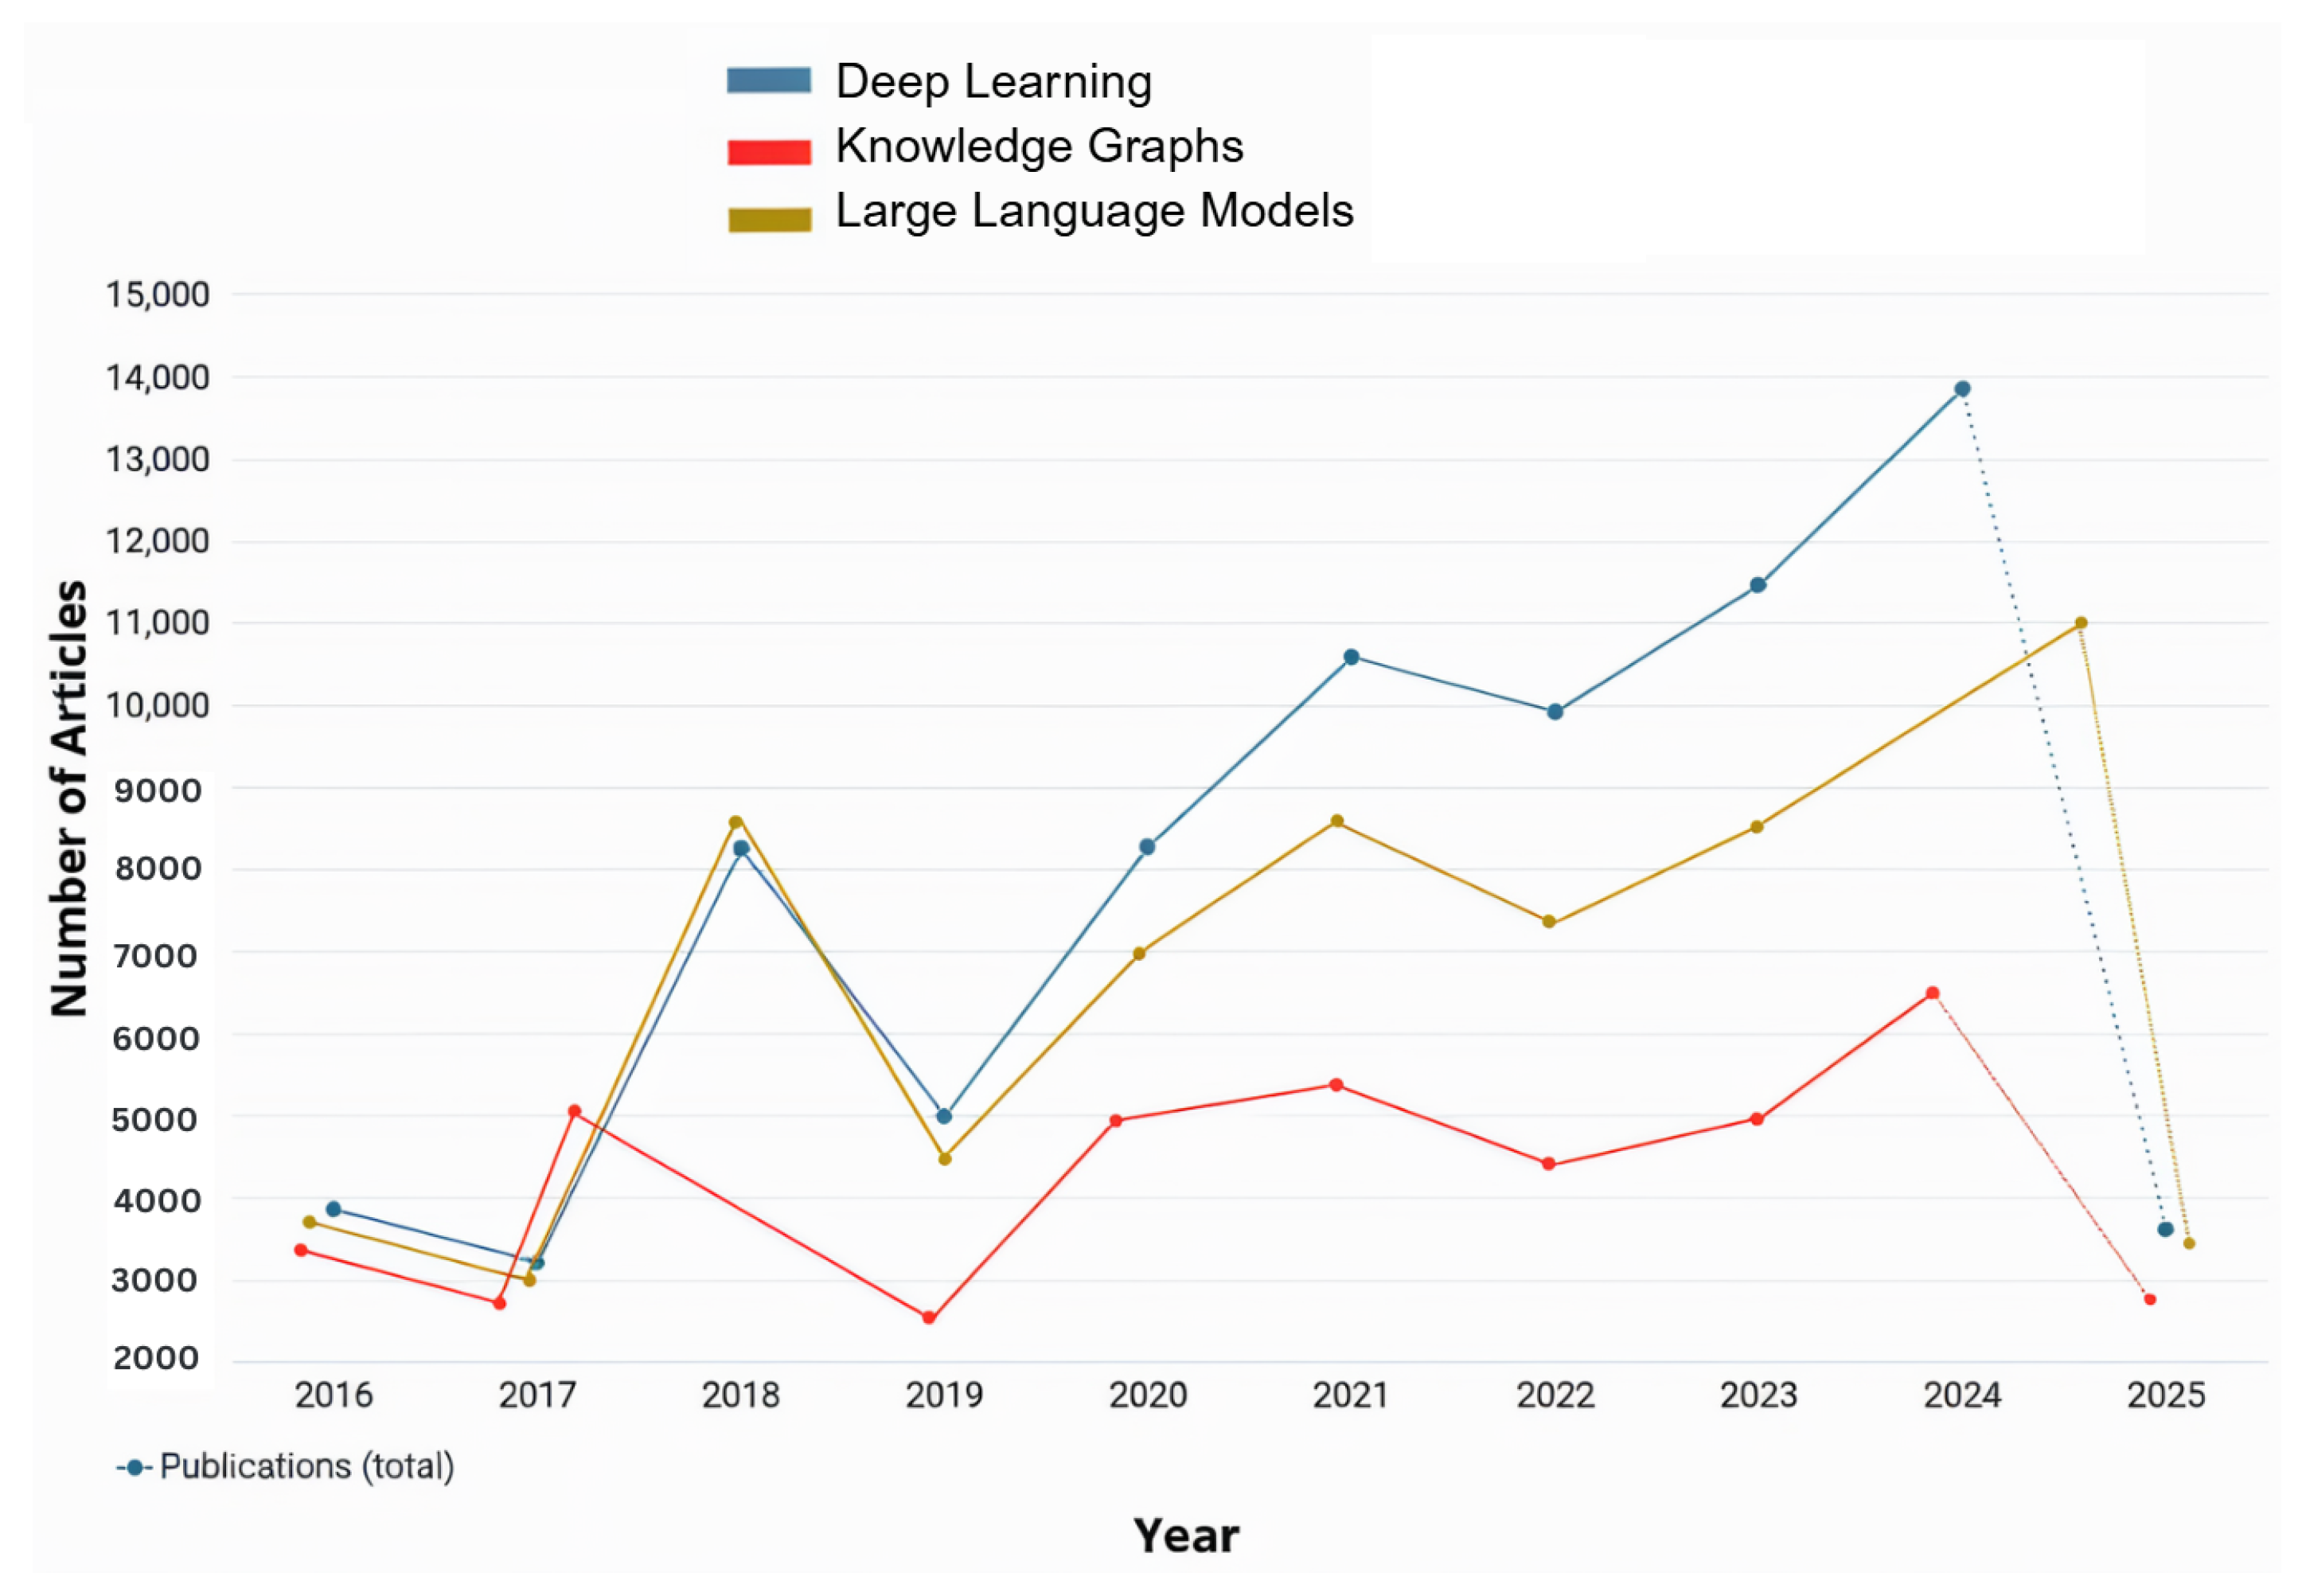
As observed in
Figure 2, the number of applications and studies conducted about RRG implemented or integrated with LLMs or vision-language models (VLMs) has risen significantly over the past two years and is expected to continue increasing. This growth is driven by the ongoing advancements in LLM and VLM architectures, which provided powerful tools for RRG. This trend is further explored in the following section, where some of the most recent studies on the utilization of LLMs/VLMs for RRG are reviewed. LLMs are pre-trained on large corpora of general and domain-specific text, enabling them to understand complex language structures and produce coherent and contextually accurate narratives. When applied to RRG, LLMs can be fine-tuned or prompted to generate radiology reports from either structured findings or embedded image features. On the other hand, VLMs use pre-trained vision encoders (e.g., CNNs or Vision Transformers) to extract image features and then align them with the text generation capabilities of an LLM. This integration allows the model to capture both visual pathology and relevant clinical context, enabling more accurate, fluent, and interpretable radiology reports.
Voinea et al. explored the potential of LLMs in automating RRG, focusing on fine-tuning the Llama 3-8B model, a variant within Meta’s Llama series [
38]. Their research evaluated whether a fine-tuned model, trained on a radiology-specific dataset, could enhance medical diagnostics by generating accurate and contextually appropriate clinical conclusions. Fine-tuning was employed to adapt the pre-trained model to the unique linguistic, stylistic, and contextual demands of medical diagnoses, enabling it to produce meaningful and precise findings. Traditionally, radiologists invested significant time and cognitive effort in analyzing medical data to derive concise and actionable summaries. By leveraging the capabilities of LLMs, the authors aimed to alleviate this workload and provide a robust tool to streamline the generation of radiology report conclusions.
Pellegrini et al. introduced the RaDialog architecture, which integrates VLMs with vision encoders (e.g., BioViL-T) and language decoders (e.g., GPT variants) for multimodal RRG [
39]. By combining image features from chest X-rays with structured text inputs using multimodal fusion, RaDialog produces accurate, clinically relevant, and context-sensitive reports. Its instruct-tuning capability allows interactive adjustments, such as incorporating user feedback and refining language for specific audiences. Additionally, the CheXpert findings classifier improved pathology predictions, ensuring high clinical accuracy. RaDialog’s multimodal and interactive features streamlined radiology workflows, making it a transformative tool for generating tailored and efficient medical reports.
Liu et al. proposed an adaptation of the MiniGPT-4 model for RRG. Their architecture introduced two key components—In-domain Instance Induction (I3) and Coarse-to-Fine Decoding (C2FD)—which aimed to enhance the model’s ability to generate accurate and domain-specific radiology reports from chest X-ray images [
14]. The I3 module adapted the general-purpose MiniGPT-4 to the medical field by fine-tuning it with annotated radiology image–text pairs, enabling the model to learn medical terminology, anatomical structures, and diagnostic patterns effectively. The C2FD module improved coherence and clinical precision in reports through a two-step process: it generated a coarse draft from input images and then refined it by correcting errors, removing irrelevant details, and enhancing clinical accuracy. When combined with I3 and evaluated on the IU X-Ray and MIMIC-CXR datasets, this approach significantly enhanced report quality and enabled the model to generalize effectively across diverse medical scenarios. The combination of I3 for domain adaptation and C2FD for report refinement substantially improved the accuracy and relevance of the generated reports. The architecture enhanced the model’s comprehension of medical terminology, anatomical details, and diagnostic patterns, resulting in precise and coherent outputs. Furthermore, the C2FD module refined report quality by correcting errors and filtering irrelevant content, offering reliable and valuable outputs for healthcare professionals. This approach also demonstrated the potential to adapt general-purpose LLMs to specialized domains with limited data, providing a practical framework for similar applications.
In the field of AI for medical applications like RRG, a critical challenge has been the occurrence of fabricated content in AI-generated reports that does not align with real-world medical data. To address this issue, Zhang et al. developed RadFlag, a black-box hallucination detection model [
40]. RadFlag uses an entailment-based evaluation approach to compare generated reports with ground-truth medical findings, categorizing content as fully, partially, or not supported by the input data. This process aims to ensure that diagnoses and observations in generated reports are grounded in the provided evidence. The model’s performance is measured using entity precision and relation precision, which assesses its ability to accurately identify and relate medical concepts in reports. To evaluate RadFlag, Zhang et al. tested it on two state-of-the-art RRG models, Medversa and RaDialog, using chest X-ray datasets with paired medical images and reports. The experiments demonstrated that RadFlag effectively detected hallucinated findings by cross-checking generated content against established medical knowledge. This improved the reliability of automatic RRG systems, making RadFlag a valuable tool for enhancing the quality and trustworthiness of AI-generated medical reports.
Udomlapsakul et al. proposed an advanced system for RRG using a domain-specific multimodal language model tailored for interpreting chest X-rays and producing clinically relevant reports [
41]. The system followed a two-stage approach. First, the model was pre-trained on the LLaVa-MED multimodal medical dataset, augmented with a randomly initialized adapter to embed domain-specific medical knowledge. This pre-training provided a strong foundation in medical contexts and terminologies. Next, the model was fine-tuned on the interpret-cxr dataset, containing over one million image–text pairs. To enhance efficiency and accuracy, the dataset was refined to include only the first X-ray image from each study, resulting in a diverse set of 700,000 image–text pairs. The authors addressed challenges in radiology report datasets, which often contain extraneous details such as dates and doctor names. Initially, GPT-3.5 Turbo was used to clean the dataset by removing irrelevant information. However, this cleaning led to performance inconsistencies due to mismatches with uncleaned test datasets. As a result, the model was trained on the original uncleaned dataset. Two innovative prompts were introduced to improve output quality: the “Report Refinement” prompt, which enhances readability and clarity, and the “First, Do No Harm” SafetyNet, which leverages the X-Raydar classifier to identify and rectify potential errors. These strategies significantly enhanced the model’s ability to generate accurate and contextually reliable reports, demonstrating its potential as a valuable AI tool for clinical decision-making.
Li et al. introduced Knowledge-enhanced Radiology Report Generation (KARGEN), a framework that combined LLMs with a medical knowledge graph to produce detailed and clinically accurate radiology reports [
42]. The core innovation of KARGEN is its use of a Graph Convolutional Network (GCN) to incorporate domain-specific knowledge from a medical knowledge graph. This knowledge was fused with visual features extracted from chest X-ray images using a pre-trained Swin Transformer, a robust architecture designed for vision tasks. LLaMA2-7B was used for report generation, integrating fused features from X-ray images and disease-specific knowledge. KARGEN was trained and evaluated on the MIMIC-CXR and IU-Xray (Indiana University X-ray dataset) datasets, which provided extensive paired chest X-ray images and radiology reports. By combining image-based and knowledge-based features, KARGEN constructed nuanced and contextually sensitive representations of medical images, enabling it to generate linguistically accurate and medically informative reports.
Srivastav et al. introduced Multimodal AI for Radiology Applications (MAIRA), a large multimodal model designed to generate radiology reports from chest X-ray images [
43]. MAIRA built upon the MAIRA-1 architecture and integrated both frontal and lateral image views to enhance the accuracy and comprehensiveness of its reports. It utilizes a RAD-DINO-like image encoder, optimized for medical imaging within the radiology domain, and was trained in a multitask setup to generate detailed findings and summary impressions. The model was trained and evaluated using multiple public datasets, including MIMIC-CXR (Medical Information Mart for Intensive Care Chest X-ray dataset), CheXpert, PadChest, BIMCV-COVID19, and Open-I, which provided a diverse collection of X-rays and radiology reports for benchmarking and training.
Additionally, MAIRA employed GPT-4 to produce multiple candidate reports, selecting the most accurate and comprehensive one, effectively minimizing hallucinated or incomplete information. The architecture’s scalability enabled larger versions, such as Vicuna-7B and Vicuna-13B, to improve performance while maintaining competitive results with smaller-scale models. Wang et al. introduced History-Enhanced Radiology Report Generation (HERGen), an advanced AI-driven framework designed to streamline and accelerate RRG from medical images [
44]. By integrating cutting-edge CV and NLP technologies, HERGen generated detailed, accurate, and clinically relevant reports. The framework utilized state-of-the-art models like DistilGPT2 for text generation and CXR-BERT for understanding medical language, ensuring high-quality outputs. One of HERGen’s most innovative features was its ability to perform longitudinal studies by analyzing sequences of radiographs taken over time. This capability allowed the framework to track disease progression or improvement, assisting radiologists in efficiently reviewing a patient’s medical history. HERGen also minimized the risk of missing critical details in medical images and provided consistent, reliable reports, making it an invaluable tool for augmenting manual reporting processes.
Alkhaldi et al. introduced MiniGPT-Med, a state-of-the-art multimodal AI model designed for radiology diagnostics [
45]. This model combines the strengths of LLMs and ViTs to tackle complex medical vision-language tasks. MiniGPT-Med excels in generating radiology reports, detecting diseases, and answering medical questions based on imaging data. Its architecture integrates vision and language components, utilizing large pre-trained vision-language models fine-tuned on specialized medical datasets. A key dataset used in its training is MIMIC-CXR, which provided over 200,000 chest X-ray images paired with radiology reports. This dataset enables the model to learn intricate relationships between visual features and textual descriptions, resulting in accurate and contextually appropriate outputs. MiniGPT-Med outperforms both specialist and generalist models in tasks such as abnormality detection and report generation, achieving state-of-the-art performance. It demonstrates proficiency in grounding tasks, like associating specific abnormalities with descriptive text, and non-grounding tasks, such as generating free-form radiology reports.
Kumar et al. described Flamingo-CXR, a VLM designed to process both visual and textual data for generating radiology reports from chest X-ray images [
6]. Based on the Flamingo architecture, the model utilizes a pre-trained transformer fine-tuned specifically for medical report generation tasks. Flamingo-CXR combines a vision encoder to extract features from X-ray images and a language decoder to translate these features into coherent, human-like radiology reports. Its zero-shot learning capability allows it to adapt to diverse clinical scenarios without requiring explicit training for every condition. Flamingo-CXR was trained on large-scale datasets like MIMIC-CXR, which provide labeled chest X-rays paired with radiology reports, and IND1, a dataset reflecting diverse patient populations in India. These datasets cover a wide range of pathologies, including pneumonia, cardiomegaly, and pulmonary edema, forming a robust foundation for the model’s training. Additionally, Flamingo-CXR benefits from fine-tuning with expert radiologist feedback to ensure clinical accuracy. However, it faced challenges with rare or out-of-distribution conditions, requiring additional fine-tuning with specialized datasets to address such limitations.
Kapadnis et al. introduced SERPENT-VLM, a multimodal framework for generating accurate radiology reports from chest X-rays [
46]. Combining a frozen visual encoder with a LLM, SERPENT-VLM processes radiographic images into high-dimensional feature representations, which the LLM uses to generate initial reports. To improve accuracy, the model employs a novel self-refining loss mechanism, iteratively aligning generated reports with relevant image features and addressing inaccuracies, particularly in noisy or low-quality images. SERPENT-VLM was evaluated on the benchmark datasets IU-Xray and ROCO(Radiology Objects in COntext dataset), which included noisy and diverse radiographic images paired with reports. The model demonstrated resilience to variable image quality and successfully generated contextually grounded reports. An attention-based aggregation mechanism ensured focus on the most relevant image regions, reducing hallucinations and enhancing diagnostic reliability.
Campanini et al. developed iHealth-Chile-1, a multimodal architecture for RRG that combines advanced vision encoders (e.g., CLIP and BiomedCLIP) with language models (e.g., LLaMA and Vicuna) [
47]. The vision encoder extracts features from chest X-rays, while the language model generates detailed textual reports. BiomedCLIP, trained exclusively on medical data, enhances the system’s precision in interpreting chest X-rays. The report generation process involves two stages: training on image data to extract key features and refining reports using enriched prompts with predefined templates and a DenseNet-121 classifier. These prompts structured findings into concise, contextually accurate reports, though they introduced trade-offs, such as a decline in pathology classification metrics like F1-cheXbert. The model was trained on datasets like CheXpert, which provided annotated chest X-rays and detailed reports on conditions like pneumonia and fractures.
Hou et al. proposed RADAR, a two-stage framework for radiology report generation that integrates both the internal knowledge of LLMs and externally retrieved domain-specific information [
48]. In the first stage, a multimodal LLM such as BLIP-3 processes the chest X-ray image along with clinical prompts to produce preliminary findings. These generated statements are then filtered using an expert observation classifier, built on DenseNet-121 and trained to recognize clinical observations from images, to extract only the high-confidence observations. In the second stage, RADAR enhances the report by retrieving supplementary findings from a structured database of similar annotated radiology cases, using a KL-divergence-based similarity measure. Only findings that are complementary (i.e., not already captured by the internal model) are integrated into the prompt, which is then passed again to the LLM to generate the final report. This architecture allows RADAR to leverage the reasoning capability of LLMs while anchoring its outputs in both visual evidence and prior expert knowledge, significantly reducing hallucinations and improving clinical fidelity. A summary of models that use LLMs/VLMs can be seen in
Table 2.
2.3. Graph-Based Methods
One of the primary challenges in RRG research is bridging the gap between image and text modalities to generate clinically accurate reports. The use of graphs in RRG helps address this challenge by linking image and text data more effectively. Graph-based methods model the relationships between entities, such as anatomical structures, pathologies, and clinical findings, using nodes and edges. Two forms of graph representation in RRG are knowledge graphs and scene graphs.
Knowledge graphs incorporate prior medical knowledge, where nodes represent clinical concepts (e.g., “lung opacity” and “pneumothorax”) and edges encode semantic or causal relationships between them (e.g., “indicates” and “associated with”). These graphs can be used to guide the report generation process by constraining or informing the model based on established medical ontologies or diagnosis hierarchies.
Scene graphs, in contrast, are derived directly from visual data and capture the spatial or contextual relationships within an image. For radiology, this may include representations like “nodule inside lung” or “consolidation adjacent to pleura.” Scene graphs provide a structured abstraction of the visual content, allowing the model to reason over object interactions and generate more detailed and anatomically detailed descriptions.
2.3.1. Knowledge Graphs
One of the most prominent tools used for RRG is knowledge graphs, which were formally introduced by Google in 2012 to enhance their search engine. Since then, knowledge graphs have played a significant role in various studies related to RRG.
A knowledge graph is a structured representation of knowledge where nodes represent entities or concepts, and edges define the semantic relationships between these entities or concepts. In some cases, entities also contain attributes [
49]. In the context of RRG, knowledge graphs have been constructed around disease-related topics, with nodes representing disease labels and edges illustrating the relationships between them. X-ray images are used to extract visual features, which are then combined with the knowledge graph to generate RRGs [
49]. Knowledge graphs are typically extracted from textual data, such as radiology reports [
49,
50,
51,
52,
53], although some studies have attempted to derive them directly from radiologic images. Additionally, some approaches integrated text and image features to refine the knowledge graph’s nodes, linking regional image features with disease class embeddings extracted from the reports [
42].
Knowledge graphs improve the accuracy and reliability of RRG models, particularly when combined with advanced modalities such as transformers [
54], VLMs, and LLMs [
42,
49,
52,
55]. They are often employed as backbones for encoders and decoders. Gune et al. introduced the Knowledge Graph Augmented Vision Language BART (KGVL-BART), which takes two images as input, one frontal and one lateral, along with tags [
52]. They also constructed a knowledge graph called chestX-KG from text reports in the IU X-ray dataset, which was verified by two experienced radiologists.
Knowledge graphs were used as knowledge bases to enhance the accuracy of generated reports [
49,
54,
55]. Given the vast amount of specialized knowledge in the medical domain, structuring this knowledge into graphs makes it easier to integrate into modeling frameworks [
56], improving understanding and data correlation between text and image modalities [
50,
55,
57]. Additionally, knowledge graphs serve as repositories for prior knowledge to support RRG [
49,
54].
Hou et al. [
55] developed a module called Knowledge Enhanced Attention (KEA) to mitigate bias in textual data by integrating the IU Medical Knowledge Graph (IU-MKG) [
58]. This module mines relationships among medical findings and provides background medical information, combining this with the visual features extracted from radiological data [
55]. Similarly, Kang et al. utilized knowledge graphs to bridge the gap between visual and textual data. They proposed a cross-modal knowledge-driven network (CKNet) to improve cross-modal knowledge transfer [
57].
Another issue that knowledge graphs help alleviate is the lack of consideration for interconnections between diseases and symptoms, as well as between different diseases, in RRG [
50,
53]. Knowledge graphs address this by representing diseases and their associated symptom features, which are then combined with visual features extracted from images to generate radiology report [
50,
53].
As defined by Yin et al., contrastive learning is a self-supervised learning method often used with knowledge graphs to distinguish between similar and dissimilar sample pairs, enhancing the ability to extract data features [
56]. It is employed to detect abnormal areas in radiologic images and to manage unlabeled medical images, which are common in the medical field. This method is particularly effective when dealing with unlabeled data, such as in radiology, and when multimodal alignment is required [
55].
Given the excellent results achieved by knowledge graphs in RRG, the research focus has shifted toward improving their detail and scope [
51]. Earlier methods used knowledge graphs that covered only a limited number of diseases and focused on those explicitly mentioned in reports, often neglecting normal or abnormal attributes associated with diseases, an oversight critical for medical accuracy in RRG [
51,
53]. To address this, one study proposed a novel approach called Divide-and-Conquer (DCG), which improves knowledge graphs by creating disease-free and disease-specific nodes. These nodes were extracted from reports, continuously distinguishing between normal conditions and specific diseases [
51].
Zhang et al. created the ReXKG system to evaluate the constructed radiology knowledge graphs [
59]. The system consists of three metrics: ReXKG-NSC to evaluate the similarity of nodes, REXKG-AMS to evaluate the distribution of edges, and REXKG-SCS to measure the coverage of sub-graphs across various knowledge graphs. They also conducted an in-depth analysis to comparing AI-generated reports with human-written reports. Their findings indicated that while generalist models trained on multiple modalities provided broader coverage and demonstrated improved radiological knowledge, they lacked the depth and detail typically found in human-written reports.
2.3.2. Scene Graphs
In the field of CV, accurately interpreting and understanding visual scenes is critical for various applications, including manufacturing, augmented reality, and medical imaging. As these applications grew in complexity, there was a corresponding need for effective methods to handle the diverse and complex data involved. Additionally, the integration of NLP with CV helped advance CV applications and propel more research into applications such as image captioning, visual question answering (VQA), and visual dialog. These applications required a deeper and more accurate understanding of visual scenes [
60]. Consequently, scene graphs, a visually grounded graph over the object attributes in a given image, was one of the methods introduced by Johnson et al. [
61]. In the context of RRG, the graph nodes represent the object-bounding boxes with their object categories, while the edges depict their pair-wise relationships.
Scene graph generation (SGG) aims to localize and identify objects in images while visualizing their relationships. It serves as an auxiliary representation to improve image retrieval. The varied semantic concepts and compositional structures of visual relations resulted in a wide concept space, making this task complex. Visual scene graphs often include knowledge of the objects present, their associated properties, and the pairwise relationships between distinct objects, capturing the high-level semantic content of an image [
62]. SGG has played an important role in enhancing and understanding the visual content in images.
SGG, as explained in [
63], is a technique used to understand and visualize image content in a structured manner. The process involves first detecting and classifying objects, identifying their locations, and determining their types. Scene graphs have proved to be efficient in various CV and NLP applications, motivating researchers to integrate them into medical imaging applications such as RRG. However, only a few studies have explored the use of scene graphs for RRG, with two primary studies published in 2024.
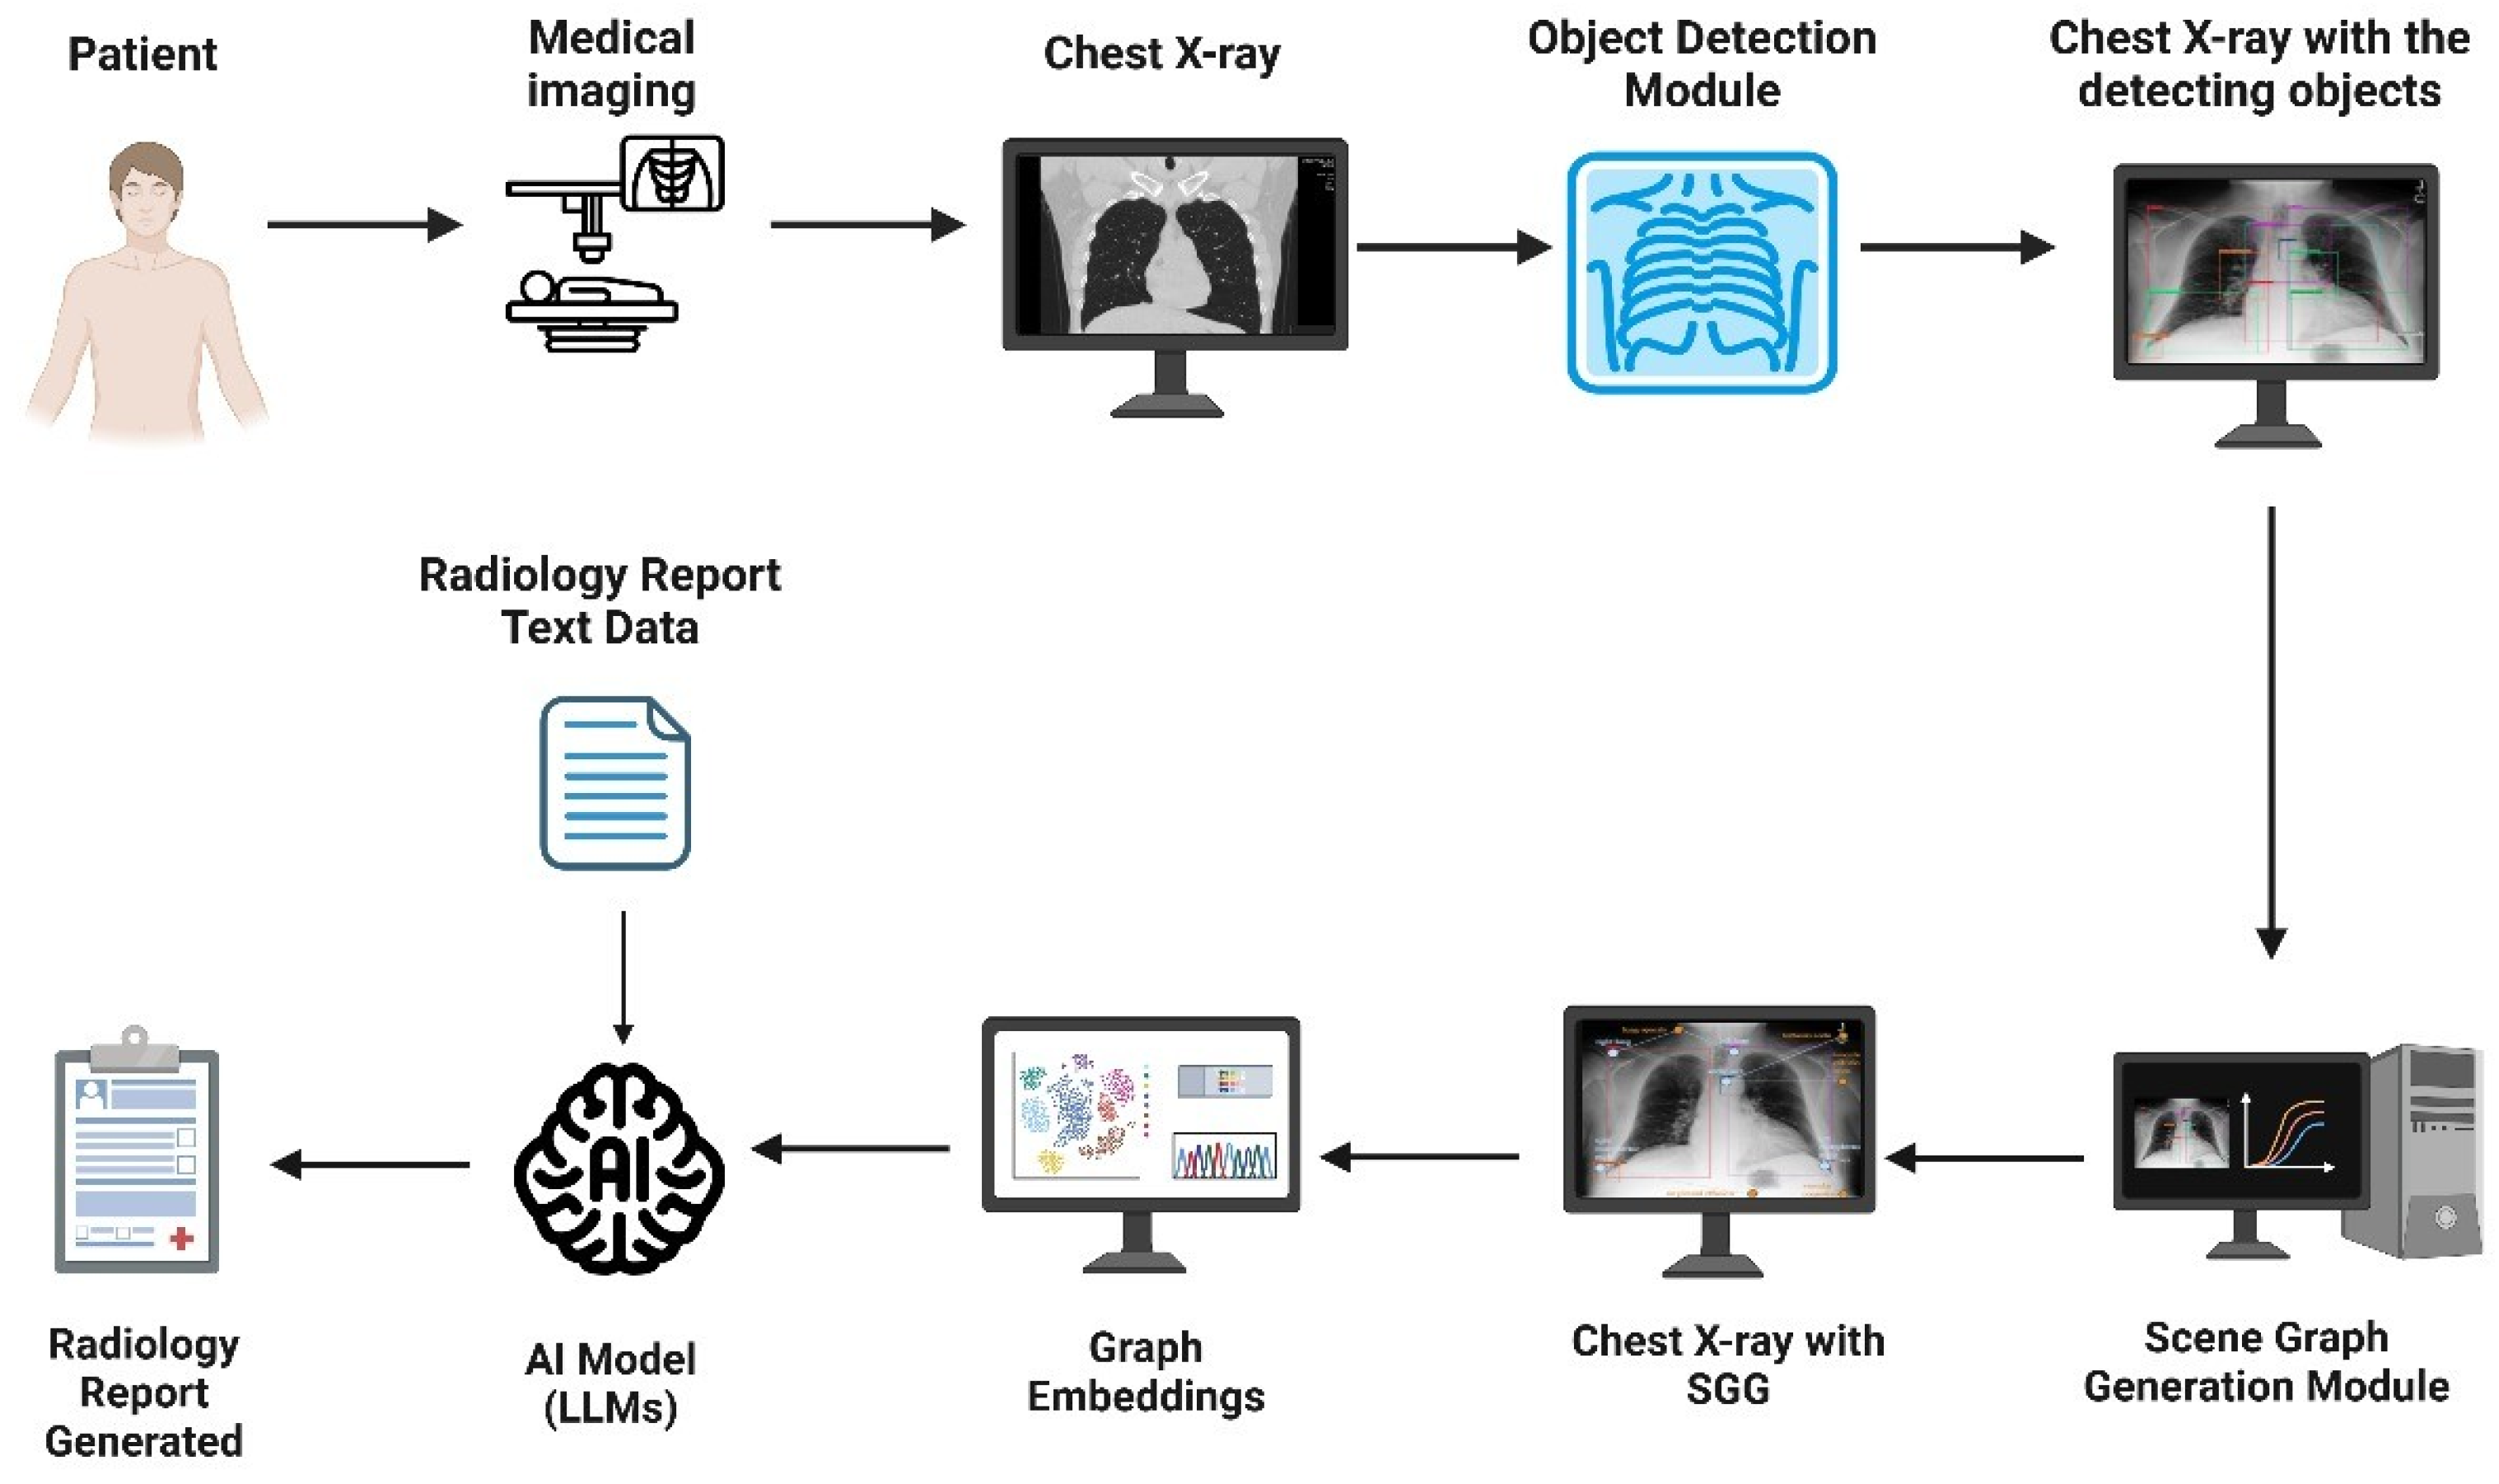
First, Wang et al. introduced the Scene Graph-aided RRG (SGRRG) network [
64]. SGRRG is a framework designed to achieve medical knowledge distillation in an end-to-end manner by generating region-level visual features, predicting anatomical attributes, and leveraging an automatically generated scene graph. Afterward, the scene graph is translated using a scene graph encoder, and a fine-grained token-type embedding method is introduced to help solve the problem of overlapping anatomical regions in radiology scene graphs. The encoded scene graph, along with the visual and textual tokens, were fed into a scene graph-aided decoder with a fine-grained distillation attention mechanism to extract the scene graph information into the model. By utilizing both global and local information, SGRRG improved its accuracy. SGRRG produced promising results on the MIMIC-CXR dataset, surpassing multiple state-of-the-art methods and showcasing superior capabilities in capturing abnormal findings.
Second, Zhang et al. incorporated SGG into RRG due to traditional methods struggling to capture the significant semantic disparity between image and text modalities, which sometimes lead to suboptimal generated reports that may lack interpretability and does not take advantage of the spatial and contextual information present in the images [
62]. Their framework utilizes a module named iterative scene graph generation, which aims to represent the relationships between anatomical regions in the image. This module also uses an auto-regressive scheme and a contextualization mechanism to enhance the scene graph. The enhanced scene graph, along with the learned attributes, is then used to generate the radiology reports, which are found to be accurate and interpretable, as they closely reflect the anatomical regions and relationships identified in the X-ray images. Their approach demonstrated exceptional results on the Chest ImaGenome dataset. Using these two papers, an overview of a representative scene graph pipeline for RRG is constructed in
Figure 4. It is important to note that SGG represents only one subclass of image-based radiology report generation methods, and not a universal or standard approach across all models.
Additionally, scene graphs have expanded to other medical areas, such as the operating room, where semantic scene graphs were employed to model relationships between actors, including medical staff, patients, and equipment. These models enabled a better understanding of complex surgical images and functioned automatically, proving effective in tasks such as function prediction [
65]. The development of medical semantic scene graphs (MSSGs) successfully provided a unified, symbolic, and spatial representation of surgical procedures. MSSGs modeled the relationships between objects, such as medical personnel, equipment, and imaging systems, highlighting the versatility and power of scene graphs in medical environments [
66]. Scene graphs significantly impact medical accuracy and efficiency by establishing sequential relationships within medical data. They facilitate better data interpretation, improved surgical planning, enhanced decision-making in the operating room, and ultimately contribute to better patient outcomes. A brief summary of Graph-based models can be seen in
Table 3.


 ,
, 


