
Contributions of External, Muscle, and Ligament Forces to Tibiofemoral Contact Loads in Patients with Knee Osteoarthritis and Healthy Individuals


Abstract

1. Introduction
2. Materials and Methods
2.1. Participants
2.2. Experimental Instruments
2.3. Experimental Procedure
2.4. Musculoskeletal Model
2.5. Experimental Data Processing
2.6. Statistical Analysis
3. Results
4. Discussion
5. Conclusions
Author Contributions
Funding
Institutional Review Board Statement
Informed Consent Statement
Data Availability Statement
Acknowledgments
Conflicts of Interest
References
- GBD 2021 Osteoarthritis Collaborators. Global, regional, and national burden of osteoarthritis, 1990–2020 and projections to 2050: A systematic analysis for the global burden of disease study 2021. Lancet Rheumatol. 2023, 5, e508–e522. [Google Scholar] [CrossRef] [PubMed]
- Expert Group of Chinese Guidelines for Diagnosis and Treatment of Osteoarthritis. The Pain Disease Branch of the Chinese Aging Well Association. Chinese guidelines for diagnosis and treatment of osteoarthritis (2024 edition). Chin. J. Painology 2024, 20, 323–338. [Google Scholar]
- Cui, A.; Li, H.; Wang, D.; Zhong, J.; Chen, Y.; Lu, H. Global, regional prevalence, incidence and risk factors of knee osteoarthritis in population-based studies. EClinicalMedicine 2020, 29–30, 100587. [Google Scholar] [CrossRef] [PubMed]
- Diamond, L.E.; Grant, T.; Uhltich, S.D. Osteoarthritis year in review 2023: Biomechanics. Osteoarthr. Cartil. 2024, 32, 138–147. [Google Scholar] [CrossRef]
- Walter, J.P.; Korkmaz, N.; Fregly, B.J.; Pandy, M.G. Contribution of tibiofemoral joint contact to net loads at the knee in gait. J. Orthop. Res. 2015, 33, 1054–1060. [Google Scholar] [CrossRef]
- Hunt, M.A.; Charlton, J.M.; Felson, D.T.; Liu, A.; Chapman, G.J.; Graffos, A.; Jones, R.K. Frontal plane knee alignment mediates the effect of frontal plane rearfoot motion on knee joint load distribution during walking in people with medial knee osteoarthritis. Osteoarthr. Cartil. 2021, 29, 678–686. [Google Scholar] [CrossRef]
- Uhlrich, S.D.; Kolesar, J.A.; Kidzinski, L.; Boswell, M.A.; Silder, A.; Gold, G.E.; Delp, S.L.; Beaupre, G.S. Personalization improves the biomechanical efficacy of foot progression angle modifications in individuals with medial knee osteoarthritis. J. Biomech. 2022, 144, 111312. [Google Scholar] [CrossRef]
- Sharifi, M.; Shirazi-Adl, A. Knee flexion angle and muscle activations control the stability of an anterior cruciate ligament deficient joint in gait. J. Biomech. 2021, 117, 110258. [Google Scholar] [CrossRef] [PubMed]
- Alfayyadh, A.; Williams, J.R.; Neal, K.; Khandha, A.; Manal, K.; Snyder-Mackler, L.; Buchanan, T.S. Unbalanced medial-to-lateral knee muscle co-contractions are associated with medial tibiofemoral underloading during gait three months after anterior cruciate ligament reconstruction. J. Biomech. 2024, 163, 111925. [Google Scholar] [CrossRef]
- Marriott, K.A.; Birmingham, T.B. Fundamentals of osteoarthritis. Rehabilitation: Exercise, diet, biomechanics, and physical therapist-delivered interventions. Osteoarthr. Cartil. 2023, 31, 1312–1326. [Google Scholar] [CrossRef]
- Holden, M.A.; Murphy, M.; Simkins, J.; Thomas, M.J.; Huckfield, L.; Quicke, J.G.; Halliday, N.; Birrell, F.N.; Borrelli, B.; Callaghan, M.J.; et al. Knee braces for knee osteoarthritis: A scoping review and narrative synthesis of interventions in randomised controlled trials. Osteoarthr. Cartil. 2024, 32, 1371–1396. [Google Scholar] [CrossRef]
- Du, W.; Guo, Y.; Wang, C.; Cui, W.; Chen, W.; Li, X. Biomechanical response of lower limb joints to lateral wedge insoles. Sci. Rep. 2024, 14, 107. [Google Scholar] [CrossRef]
- D’Souza, N.; Ohashi, T.; Grayson, J.; Hiller, C.; Hutchison, L.; Simic, M. Toe-in and toe-out gait retraining for people with medial knee osteoarthritis: A pilot randomised clinical trial. Osteoarthr. Cartil. 2022, 30, s143–s144. [Google Scholar] [CrossRef]
- Pamuk, U.; Yucesoy, C.A. MRI analyses shows that kinesio taping affects much more than just the targeted superficial tissues and causes heterogeneous deformations within the the whole limb. J. Biomech. 2015, 48, 4262–4270. [Google Scholar] [CrossRef]
- Zhang, L.; Liu, G.; Han, B.; Wang, Z.; Li, H.; Jiao, Y. Assistive devices of human knee joint: A review. Robot. Auton. Syst. 2020, 125, 103394. [Google Scholar] [CrossRef]
- Ro, J.; Ro, D.U.; Kang, Y.; Han, H.; Shin, C.S. Biomechanical effect of coronal alignment and ligament laxity in total knee arthroplasty: A simulation study. Front. Bioeng. Biotechnol. 2022, 10, 851495. [Google Scholar] [CrossRef] [PubMed]
- Winby, C.R.; Lloyd, D.G.; Besier, T.F.; Kirk, T.B. Muscle and external load contribution to knee joint contact loads during normal gait. J. Biomech. 2009, 42, 2294–2300. [Google Scholar] [CrossRef]
- Konrath, J.M.; Saxby, D.J.; Killen, B.A.; Pizzolato, C.; Vertullo, C.J.; Barrett, R.S.; Lloyd, D.G. Muscle contributions to medial tibiofemoral compartment contact loading following ACL reconstruction using semitendinosus and gracilis tendon grafts. PLoS ONE 2017, 12, e0176016. [Google Scholar] [CrossRef] [PubMed]
- Brandon, S.C.E.; Brown, M.J.; Clouthier, A.L.; Campbell, A.; Richards, J.D.; Deluzio, K.J. Contributions of muscles and external forces to medial knee load reduction due to osteoarthritis braces. Knee 2019, 26, 564–577. [Google Scholar] [CrossRef]
- Shelburne, K.B.; Torry, M.R.; Pandy, M.G. Contributions of muscles, ligaments, and the ground-reaction force to tibiofemoral joint loading during normal gait. J. Orthop. Res. 2006, 24, 1983–1990. [Google Scholar] [CrossRef]
- Kohn, M.D.; Sassoon, A.A.; Fernando, N.D. Classifications in brief: Kellgren-Lawrence classification of osteoarthritis. Clin. Orthop. Relat. Res. 2016, 474, 1886–1893. [Google Scholar] [CrossRef]
- Zhang, L.; Ma, R.; Li, H.; Wan, X.; Xu, P.; Zhu, A.; Wei, P. Comparison of knee biomechanical characteristics during gait between patients with knee osteoarthritis and healthy individuals. Heliyon 2024, 10, e36931. [Google Scholar] [CrossRef] [PubMed]
- Zeighami, A.; Aissaoui, R.; Dumas, R. Knee medial and lateral contact forces in a musculoskeletal model with subject-specific contact joint trajectories. J. Biomech. 2018, 69, 138–145. [Google Scholar] [CrossRef]
- Lund, M.E.; Chander, D.S.; Galibarov, P.; Torholm, S.; Engelund, B.; Hamed, S.; Michael, D. The AnyBody Managed Model Repository (AMMR) (Version 3.0.0). Available online: https://zenodo.org/records/3404750 (accessed on 13 February 2023).
- Vanheule, V.; Delport, H.P.; Andersen, M.S.; Scheys, L.; Wirix-Speetjens, R.; Jonkers, I.; Victor, J.; Sloten, J.V. Evaluation of predicted knee function for component malrotation in total knee arthroplasty. Med. Eng. Phys. 2017, 40, 56–64. [Google Scholar] [CrossRef] [PubMed]
- Marra, M.A.; Vanheule, V.; Fluit, R.; Koopman, B.H.F.J.M.; Rasmussen, J.; Verdonschot, N.; Andersen, M.S. A subject-specific musculoskeletal modeling framework to predict in vivo mechanics of total knee arthroplasty. J. Biomech. Eng. 2015, 137, 020904. [Google Scholar] [CrossRef] [PubMed]
- Hu, J.Y.; Chen, Z.X.; Xin, H.; Zhang, Q.D.; Jin, Z.M. Musculoskeletal multibody dynamics simulation of the contact mechanics and kinematics of a natural knee joint during a walking cycle. J. Eng. Med. 2018, 232, 508–519. [Google Scholar] [CrossRef] [PubMed]
- Zhang, L.; Liu, G.; Yan, Y.; Han, B.; Li, H.; Ma, J.; Wang, X. A subject-specific musculoskeletal model to predict the tibiofemoral contact forces during daily living activities. Comput. Methods Biomech. Biomed. Eng. 2023, 26, 972–985. [Google Scholar] [CrossRef]
- Saigo, T.; Tajima, G.; Kikuchi, S.; Yan, J.; Maruyama, M.; Sugawara, A.; Doita, M. Morphology of the insertions of the superficial medial collateral ligament and posterior oblique ligament using 3-dimensional computed tomography: A cadaveric study. Arthroscopy 2017, 33, 400–407. [Google Scholar] [CrossRef]
- LaPrade, R.F.; Ly, T.V.; Wentorf, F.A.; Engebretsen, L. The posterolateral attachments of the knee: A qualitative and quantitative morphologic analysis of the fibular collateral ligament, popliteus tendon, popliteofibular ligament, and lateral gastrocnemius tendon. Am. J. Sports Med. 2003, 31, 854–860. [Google Scholar] [CrossRef]
- Xu, H.; Bloswick, D.; Merryweather, A. An improved OpenSim gait model with multiple degrees of freedom knee joint and knee ligaments. Comput. Methods Biomech. Biomed. Eng. 2015, 18, 1217–1224. [Google Scholar] [CrossRef]
- Zhang, L.; Li, H.; Wan, X.J.; Xu, P.; Zhu, A.B.; Wei, P.P. Prediction of in vivo knee mechanics during daily activities based on a musculoskeletal model incorporated with a subject-specific knee joint. Bioengineering 2025, 12, 153. [Google Scholar] [CrossRef]
- Sasaki, K.; Neptune, R.R. Individual muscle contributions to the axial knee joint contact force during normal walking. J. Biomech. 2010, 43, 2780–2784. [Google Scholar] [CrossRef]
- Shelburne, K.B.; Torry, M.R.; Pandy, M.G. Muscle, ligament and joint-contact forces at the knee during walking. Med. Sci. Sports Exerc. 2005, 37, 1948–1956. [Google Scholar] [CrossRef]
- Liu, T.T.; Xie, H.; Yan, S.; Zeng, J.; Zhang, K. The effect of thigh muscle forces on knee contact force in female patients with severe knee osteoarthritis. Bioengineering 2024, 11, 1299. [Google Scholar] [CrossRef]
- Patterson, B.E.; Girdwood, M.A.; West, T.J.; Bruder, A.M.; Oiestad, B.E.; Juhl, C.; Culvenor, A.G. Muscle strength and osteoarthritis of the knee: A systematic review and meta-analysis of longitudinal studies. Skelet. Radiol. 2023, 52, 2085–2097. [Google Scholar] [CrossRef] [PubMed]
- Kutzner, I.; Trepczynski, A.; Heller, M.O.; Bergmann, G. Knee adduction moment and medial contact force—Facts about their correlation during gait. PLoS ONE 2013, 8, e81036. [Google Scholar] [CrossRef]
- Peters, A.E.; Geraghty, B.; Bates, K.T.; Akhtar, R.; Readioff, R.; Comerford, E. Ligament mechanics of ageing and osteoarthritis human knees. Front. Bioeng. Biotechnol. 2022, 10, 954837. [Google Scholar] [CrossRef] [PubMed]
- Piao, C.D.; Zhang, W.J.; Liu, Y.Y. Tensile mechanical properties of lateral collateral ligaments in animal model of osteoarthritis. J. Clin. Rehabil. Tissue Eng. Res. 2010, 13, 9097–9100. [Google Scholar]
- Jin, X.F.; Guo, C.Q.; Jiang, Z.X.; Liu, F.S. Biomechanical characteristics of medial collateral ligaments in animal models of knee osteoarthritis. J. Clin. Rehabil. Tissue Eng. Res. 2011, 15, 8046–8049. [Google Scholar]
- Nawata, K.; Enokida, M.; Yamasaki, D.; Minamizaki, T.; Hagino, H.; Morio, Y.; Teshima, R. Tensile properties of rat anterior cruciate ligament in collagen induced arthritis. Ann. Rheum. Dis. 2001, 60, 395–398. [Google Scholar] [CrossRef]
- Rasmussen, J.; Vondrak, V.; Damsgaard, M.; Zee, M.D.; Christensen, S.T.; Dostal, Z. The AnyBody project—Computer analysis of the human body. Biomech. Man. 2002, 1, 270–274. [Google Scholar]
- Seth, A.; Sherman, M.; Reinbolt, J.A.; Delp, S.L. OpenSim: A musculoskeletal modeling and simulation framework for in silico investigations and exchange. Procedia IUTAM 2011, 2, 212–232. [Google Scholar] [CrossRef] [PubMed]


| KOA Patients Group (n = 20) | Healthy Control Group (n = 20) | p | |
|---|---|---|---|
| Age, years | 66.2 ± 7.7 | 64.8 ± 5.4 | 0.510 |
| Height, meters | 1.56 ± 0.06 | 1.58 ± 0.05 | 0.259 |
| Body mass, kg | 66.8 ± 8.7 | 65.7 ± 4.6 | 0.621 |
| BMI 1, kg/m2 | 27.6 ± 3.2 | 26.3 ± 2.1 | 0.138 |
| Sex, male/female | 4/16 | 6/14 | 0.715 |
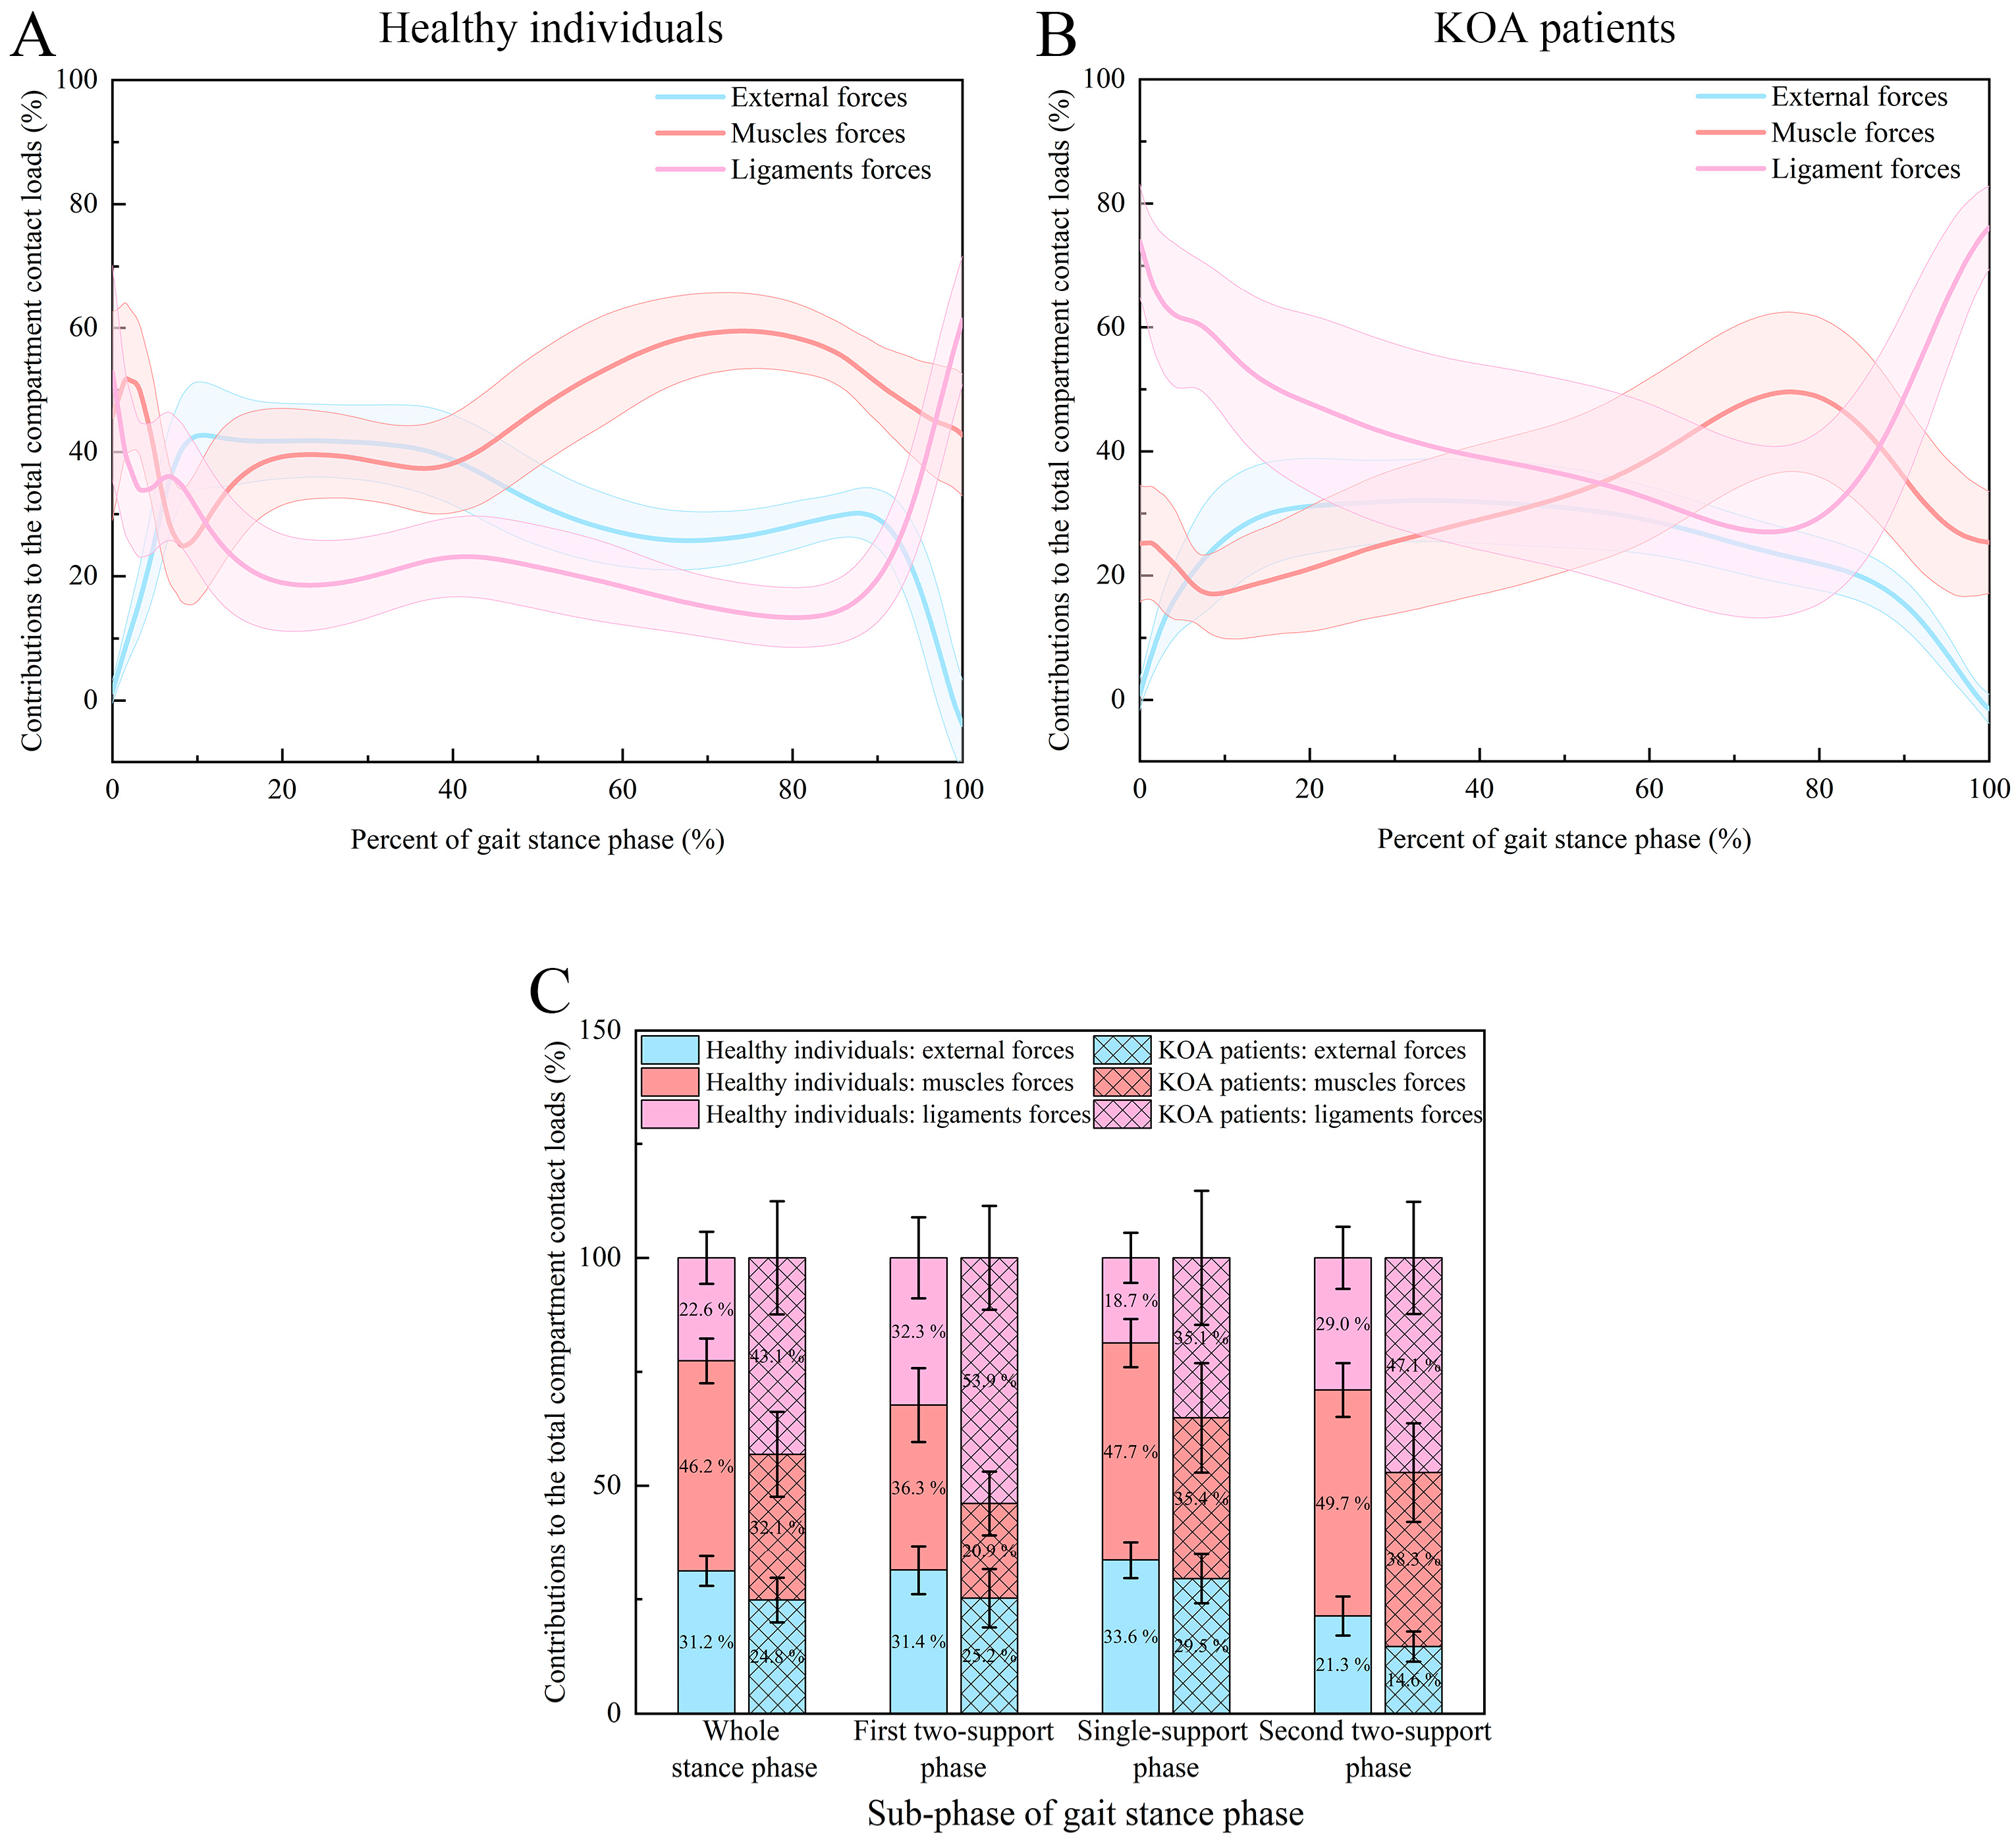
| Phase | Type of Forces | KOA Patients Group | Healthy Control Group |
|---|---|---|---|
| Whole stance phase | External forces | 24.8 ± 4.9% | 31.2 ± 3.3% |
| Muscle forces | 32.1 ± 9.3% | 46.2 ± 4.9% | |
| Ligament forces | 43.1 ± 12.4% | 22.6 ± 5.7% | |
| p values | <0.001 a; <0.001 b; <0.001 c | <0.001 a; <0.001 b; <0.001 c | |
| First two-support stance phase | External forces | 25.2 ± 6.4% | 31.4 ± 5.3% |
| Muscle forces | 20.9 ± 7.0% | 36.3 ± 8.1% | |
| Ligament forces | 53.9 ± 11.4% | 32.3 ± 8.9% | |
| p values | 0.0191 a; <0.001 b; <0.001 c | <0.001 a; 0.601 b; <0.001 c | |
| Single-support stance phase | External forces | 29.5 ± 5.4% | 33.6 ± 4.0% |
| Muscle forces | 35.4 ± 12.0% | 47.7 ± 5.3% | |
| Ligament forces | 35.1 ± 14.7% | 18.7 ± 5.5% | |
| p values | <0.001 a; <0.001 b; 0.934 c | <0.001 a; <0.001 b; <0.001 c | |
| Second two-support stance phase | External forces | 14.6 ± 3.3% | 21.3 ± 4.3% |
| Muscle forces | 38.3 ± 10.8% | 49.7 ± 5.9% | |
| Ligament forces | 47.1 ± 12.3% | 29.0 ± 6.8% | |
| p values | <0.001 a; <0.001 b; <0.001 c | <0.001 a; <0.001 b; <0.001 c |
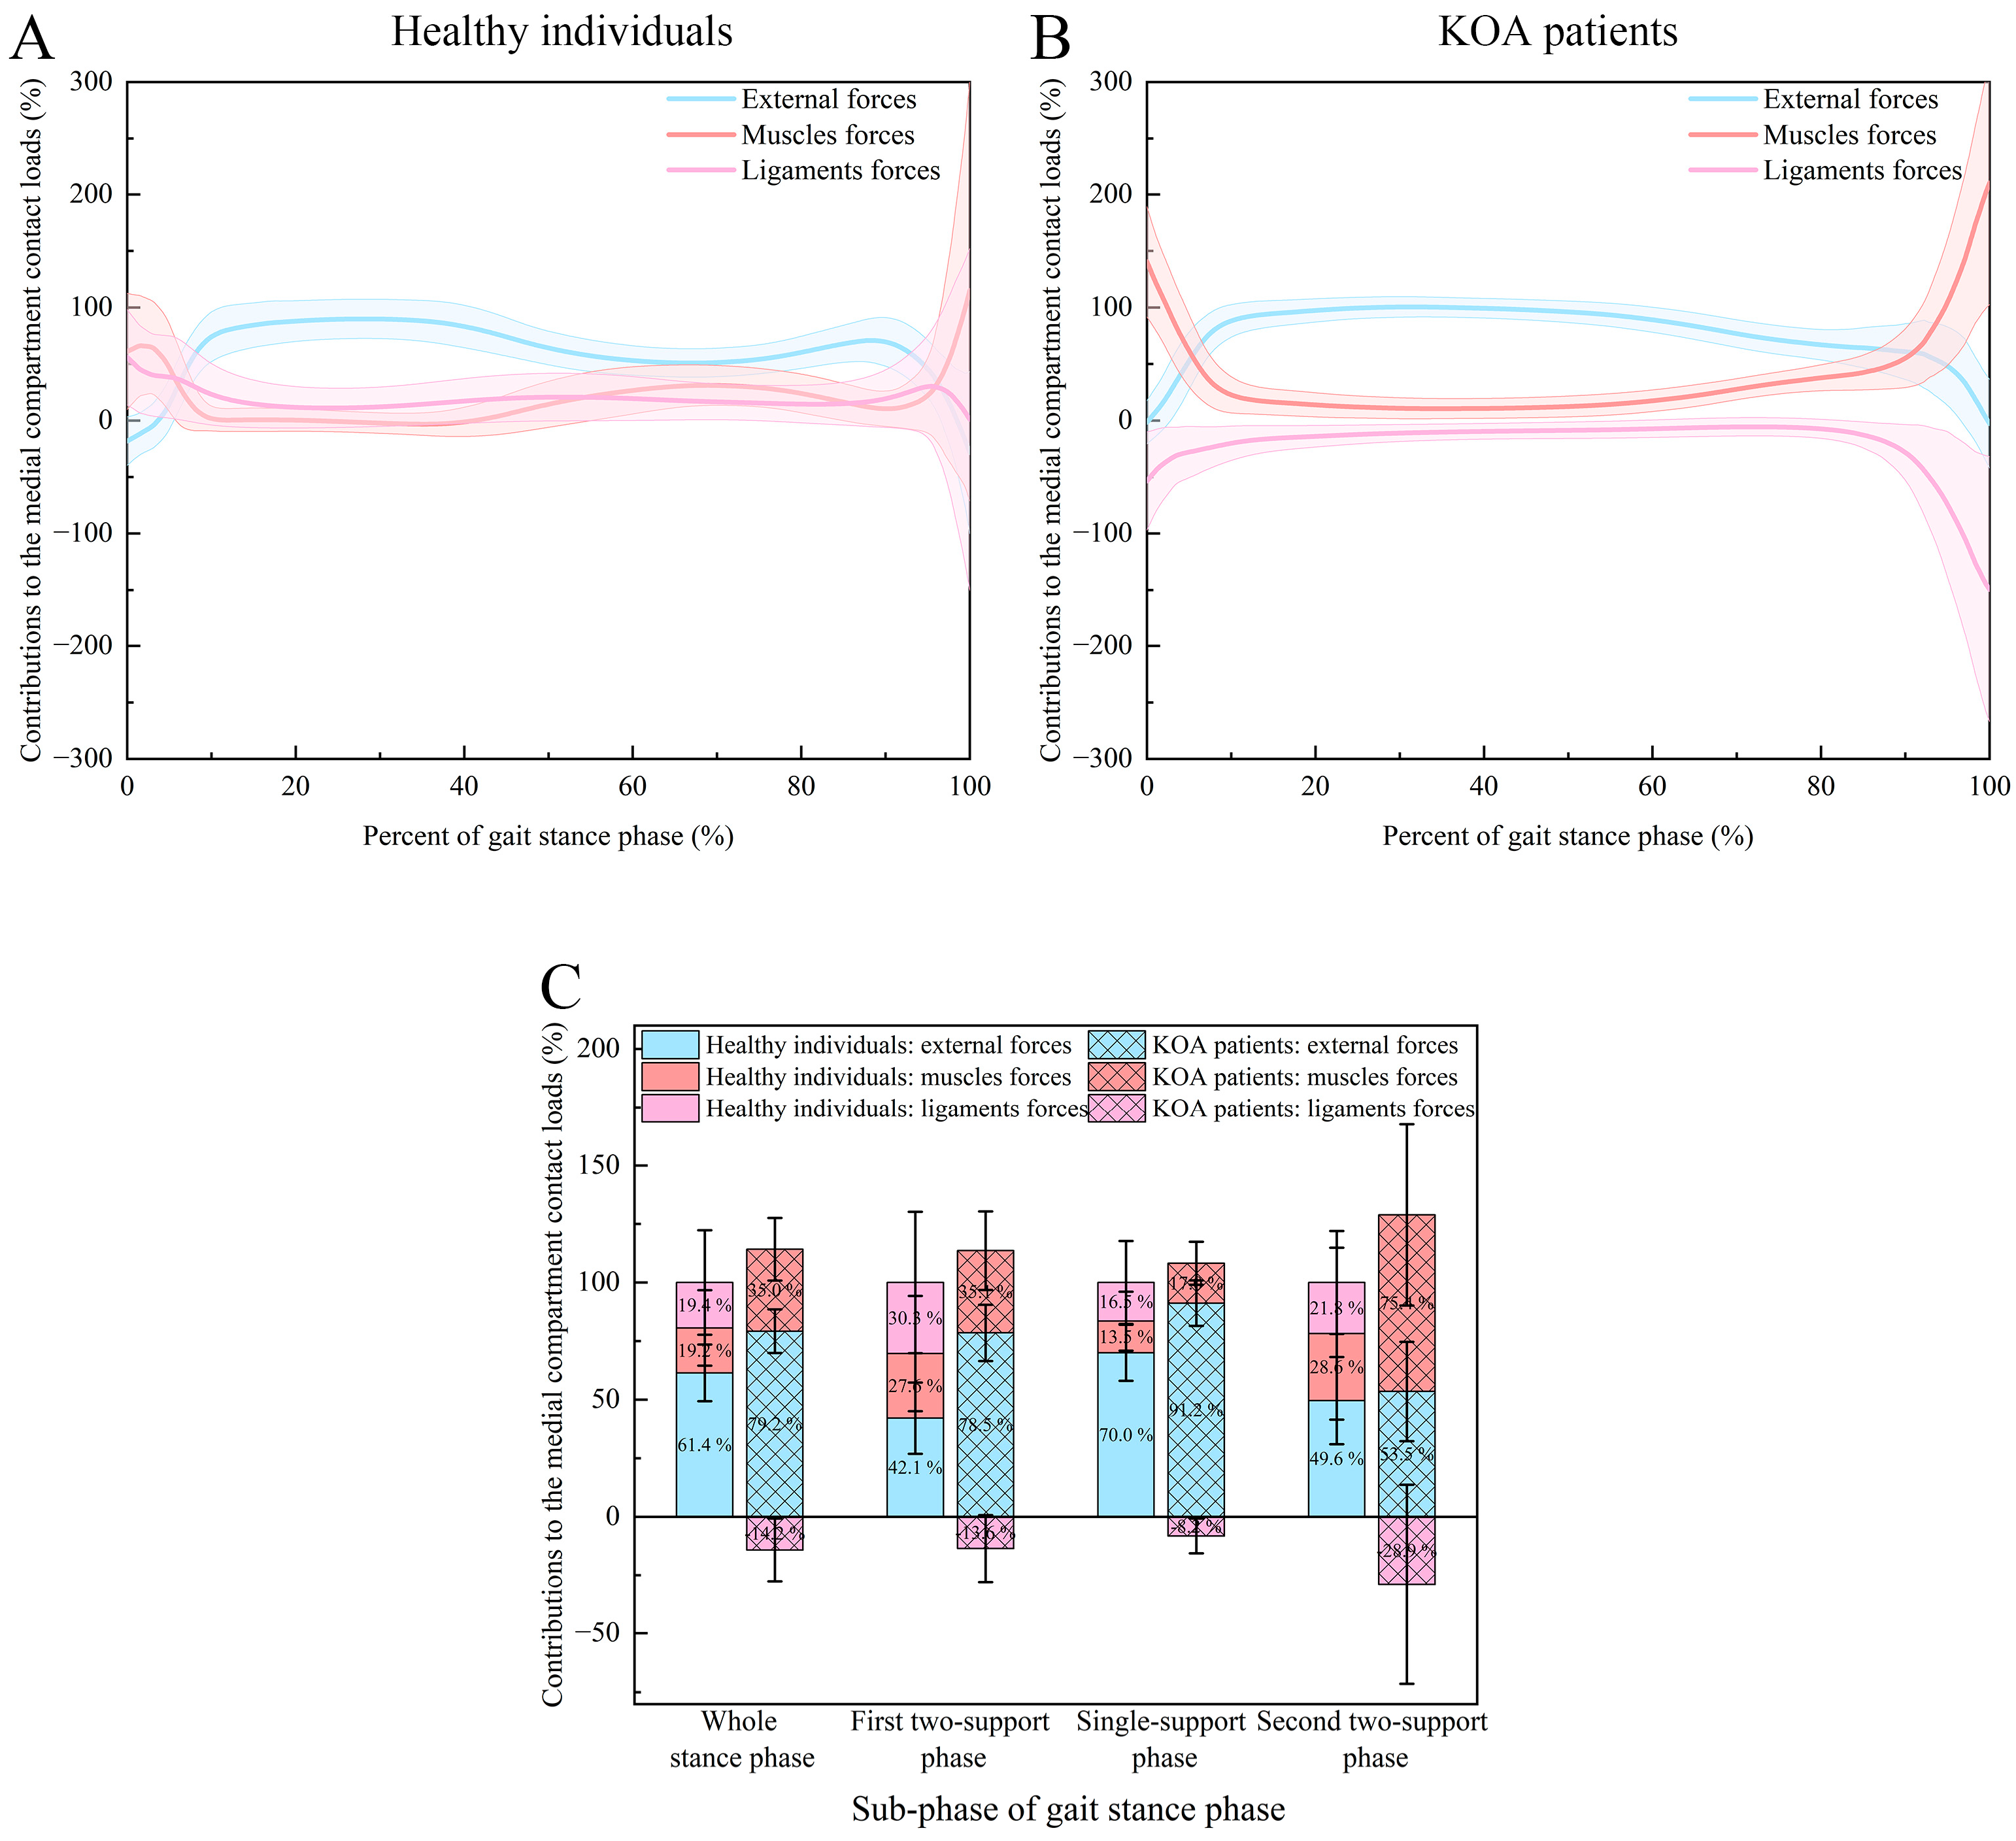
| Phase | Type of Forces | KOA Patients Group | Healthy Control Group |
|---|---|---|---|
| Whole stance phase | External forces | 79.2 ± 9.3% | 61.4 ± 12.1% |
| Muscle forces | 35.0 ± 13.4% | 19.2 ± 16.1% | |
| Ligament forces | −14.2 ± 13.4% | 19.4 ± 22.3% | |
| p values | <0.001 a; <0.001 b; <0.001 c | <0.001 a; <0.001 b; 0.747 c | |
| First two-support stance phase | External forces | 78.5 ± 12.0% | 42.1 ± 15.2% |
| Muscle forces | 35.1 ± 16.8% | 27.6 ± 24.6% | |
| Ligament forces | −13.6 ± 14.3% | 30.3 ± 30.2% | |
| p values | <0.001 a; <0.001 b; <0.001 c | <0.001 a; <0.001 b; 0.563 c | |
| Single-support stance phase | External forces | 91.2 ± 9.7% | 70.0 ± 12.0% |
| Muscle forces | 17.0 ± 9.2% | 13.5 ± 12.6% | |
| Ligament forces | −8.2 ± 7.4% | 16.5 ± 17.7% | |
| p values | <0.001 a; <0.001 b; <0.001 c | <0.001 a; <0.001 b; 0.415 c | |
| Second two-support stance phase | External forces | 53.5 ± 21.2% | 49.6 ± 18.6% |
| Muscle forces | 75.4 ± 38.7% | 28.6 ± 36.7% | |
| Ligament forces | −28.9 ± 42.6% | 21.8 ± 22.0% | |
| p values | <0.001 a; <0.001 b; <0.001 c | <0.001 a; <0.001 b; 0.467 c |
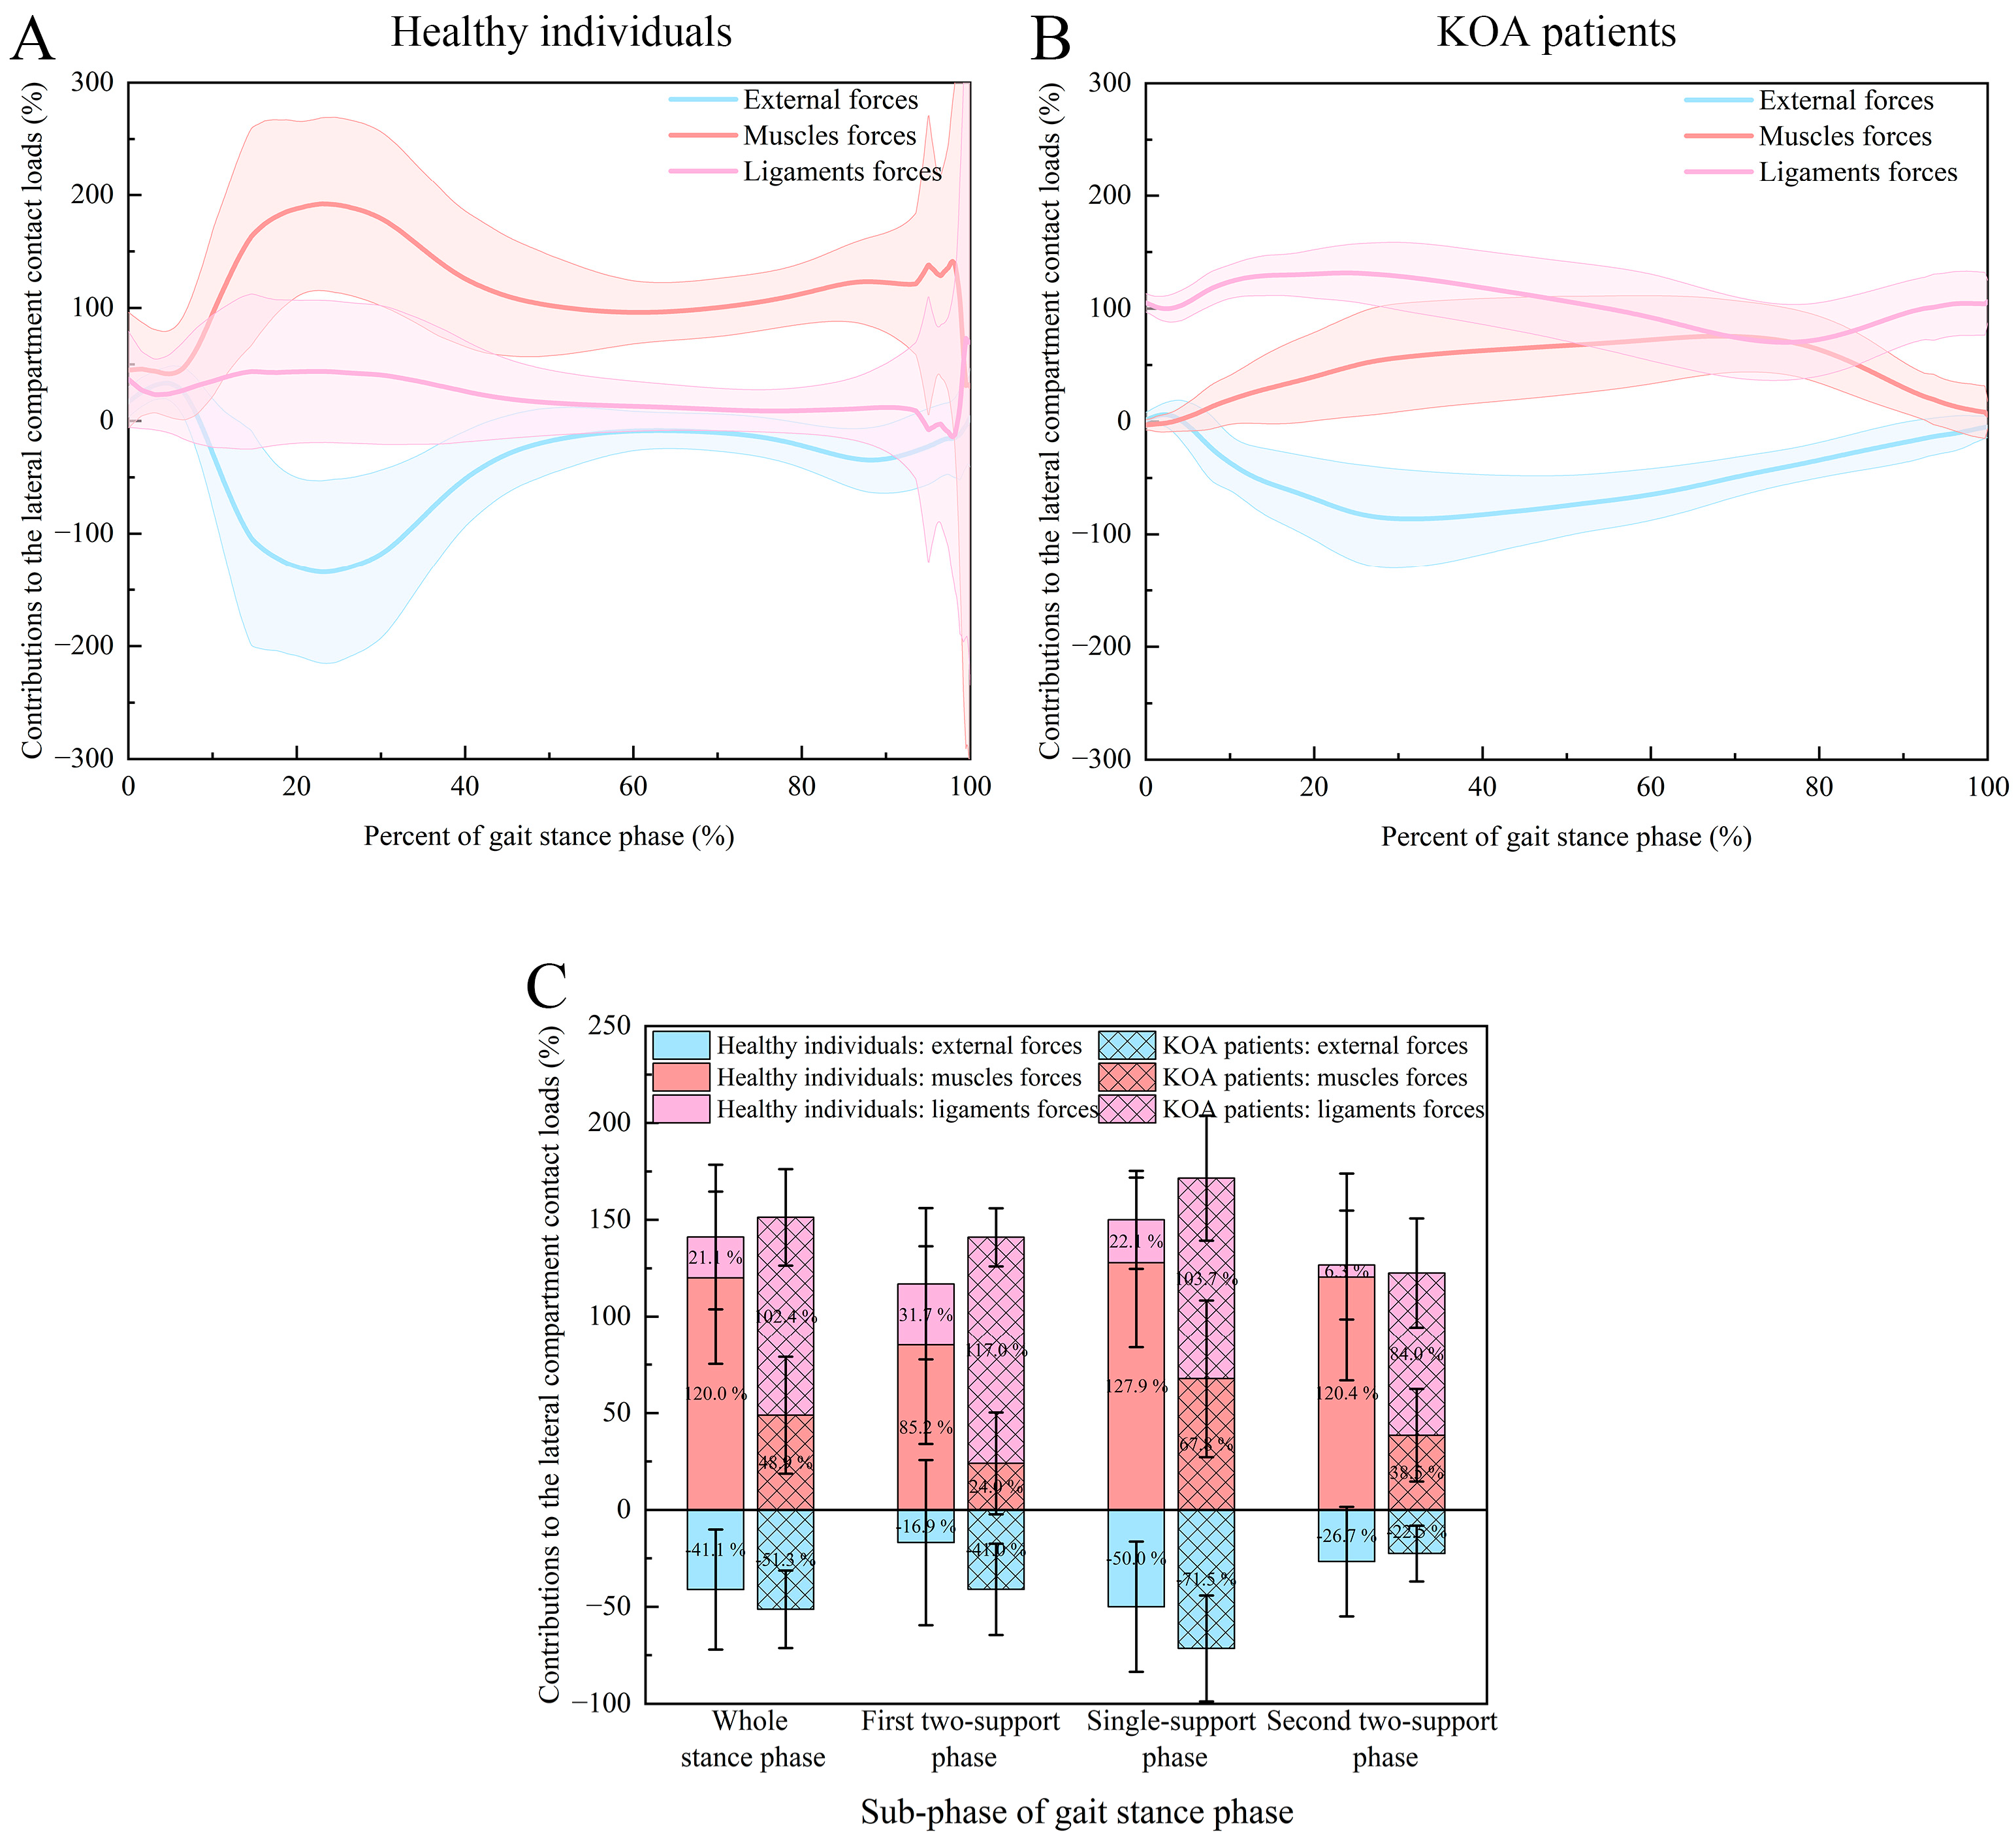
| Phase | Type of Forces | KOA Patients Group | Healthy Control Group |
|---|---|---|---|
| Whole stance phase | External forces | −51.3 ± 20.0% | −41.1 ± 31.0% |
| Muscle forces | 48.9 ± 30.2% | 120.0 ± 44.6% | |
| Ligament forces | 102.4 ± 24.9% | 21.1 ± 37.3% | |
| p values | <0.001 a; <0.001 b; <0.001 c | <0.001 a; <0.001 b; <0.001 c | |
| First two-support stance phase | External forces | −41.0 ± 23.6% | −16.9 ± 42.6% |
| Muscle forces | 24.0 ± 26.3% | 85.2 ± 51.2% | |
| Ligament forces | 117.0 ± 15.0% | 31.7 ± 39.2% | |
| p values | <0.001 a; <0.001 b; <0.001 c | 0.001 a; <0.001 b; <0.001 c | |
| Single-support stance phase | External forces | −71.5 ± 27.3% | −50.0 ± 33.6% |
| Muscle forces | 67.8 ± 40.6% | 127.9 ± 43.9% | |
| Ligament forces | 103.7 ± 32.3% | 22.1 ± 25.3% | |
| p values | <0.001 a; <0.001 b; <0.001 c | <0.001 a; <0.001 b; <0.001 c | |
| Second two-support stance phase | External forces | −22.5 ± 14.4% | −26.7 ± 28.3% |
| Muscle forces | 38.5 ± 23.9% | 120.4 ± 53.5% | |
| Ligament forces | 84.0 ± 28.2% | 6.3 ± 28.1% | |
| p values | <0.001 a; <0.001 b; <0.001 c | <0.001 a; <0.001 b; <0.001 c |
Disclaimer/Publisher’s Note: The statements, opinions and data contained in all publications are solely those of the individual author(s) and contributor(s) and not of MDPI and/or the editor(s). MDPI and/or the editor(s) disclaim responsibility for any injury to people or property resulting from any ideas, methods, instructions or products referred to in the content. |
© 2025 by the authors. Licensee MDPI, Basel, Switzerland. This article is an open access article distributed under the terms and conditions of the Creative Commons Attribution (CC BY) license (https://creativecommons.org/licenses/by/4.0/).
Share and Cite
Zhang, L.; Xu, P.; Li, H.; Lu, C.; Hou, W.; Zhu, A.; Wei, P. Contributions of External, Muscle, and Ligament Forces to Tibiofemoral Contact Loads in Patients with Knee Osteoarthritis and Healthy Individuals. Bioengineering 2025, 12, 600. https://doi.org/10.3390/bioengineering12060600
Zhang L, Xu P, Li H, Lu C, Hou W, Zhu A, Wei P. Contributions of External, Muscle, and Ligament Forces to Tibiofemoral Contact Loads in Patients with Knee Osteoarthritis and Healthy Individuals. Bioengineering. 2025; 12(6):600. https://doi.org/10.3390/bioengineering12060600
Chicago/Turabian StyleZhang, Li, Peng Xu, Hui Li, Chao Lu, Weikun Hou, Aibin Zhu, and Pingping Wei. 2025. "Contributions of External, Muscle, and Ligament Forces to Tibiofemoral Contact Loads in Patients with Knee Osteoarthritis and Healthy Individuals" Bioengineering 12, no. 6: 600. https://doi.org/10.3390/bioengineering12060600
APA StyleZhang, L., Xu, P., Li, H., Lu, C., Hou, W., Zhu, A., & Wei, P. (2025). Contributions of External, Muscle, and Ligament Forces to Tibiofemoral Contact Loads in Patients with Knee Osteoarthritis and Healthy Individuals. Bioengineering, 12(6), 600. https://doi.org/10.3390/bioengineering12060600